 Shuling Liu
 Jiucheng Shen2†
 Yezhou Li
 Juan Xu
- 1Department of Respiratory Medicine, Sleep Center, The Second Affiliated Hospital of Soochow University, Soochow University, Suzhou, China
- 2Department of Respiratory Medicine, The Second Affiliated Hospital of Soochow University, Suzhou, China
- 3School of Medicine, The University of Manchester, Manchester, United Kingdom
- 4Sleep Center, The Second Affiliated Hospital of Soochow University, Suzhou, China
Objective: To characterize electroencephalogram (EEG) power in different frequency bands during rapid eye movement (REM) sleep and non-rapid eye movement (NREM) sleep in patients with obstructive sleep apnea (OSA).
Methods: Retrospective data on 151 patients were collected and divided into three groups: primary snoring group (AHI < 5/h), mild-moderate OSA group (6 ≤ AHI < 30/h), and severe OSA group (AHI ≥ 30/h). EEG recordings in the frontal, central, and occipital regions were extracted from both REM and NREM sleep, to compute the normalized spectral power densities in the delta, theta, alpha, sigma, beta, and gamma frequency bands, using Fast Fourier Transform. Correlations between the computed EEG power and PSG parameters were analyzed.
Results: In NREM sleep, elevated normalized power spectral density (PSD) in the delta band was observed in the severe OSA group compared to the other two groups. In contrast, the PSD of the other frequency bands showed a corresponding decrease in the severe OSA group. In REM sleep, similar changes were observed in the frontal region. Delta band PSD was positively correlated with Apnea Hypopnea Index (AHI) (r = 0.33), longest time of apnea, oxygen desaturation index (ODI) (r = 0.34), percent sleep time below 90% SaO2 (T90%) (r = 0.30), Arousal Index (ArI) (r = 0.29), and negatively correlated with N3%, minimum oxygen saturation (minSaO2).
Conclusion: Our findings provide neurophysiological evidence for pathological cortical activation during REM/NREM sleep, which may be associated with the arousals and cognitive impairments in OSA. The technique of power spectral analysis could prove a potentially useful tool in complementing traditional PSG parameters in assessing disease burden to guide therapeutic decisions.
Introduction
Obstructive Sleep Apnea is one of the most common types of sleep-disordered breathing (SDB) (1–3). It is characterized by recurrent upper airway collapse during sleep, often leading to repeated awakening, sleep fragmentation, and reduced slow-wave sleep (4, 5). Increasingly, OSA is regarded as a systemic disease that impacts multiple organs of the metabolic, cardio- and cerebrovascular systems, elevating all-cause mortality (6, 7).
Sleep fragmentation and frequent awakening in OSA patients lead to daytime sleepiness, reduced working and learning efficiency, cognitive dysfunction, as well as increased risks of diseases such as hypertension, stroke, diabetes, and thus reduced overall quality of life (8). At present, several major problems remain unsolved regarding the pathophysiology as well as the clinical diagnosis and treatment of OSA: (1) clinicians face significant difficulties in evaluating the disease burden of OSA due to its highly heterogeneous clinical manifestations (9), with symptoms ranging from morning fatigue to memory impairment (see Table 1 for the lack of inter-group differences in reported symptoms); (2) Polysomnography is the gold standard for OSA diagnosis (10, 11), but the current measures of disease severity (AHI, ODI, the proportions of each sleep stage) do not strongly and consistently relate to comorbidity and mortality risks (12–14); and (3) the current suite of clinical assessment questionnaires on sleep quality, daytime sleepiness, and cognitive function, viz. the Epworth Sleepiness Scale (ESS), Pittsburgh Sleep Quality Index (PSQI), Mini-Mental State Examination and Montreal Cognitive Assessment (MoCA), tends to be subjective, and lacks specificity and sensitivity in the early stages of the disease. Therefore, current clinical practice calls for better biomarkers that might objectively capture the disease burden faced by patients to better guide therapeutic decisions.
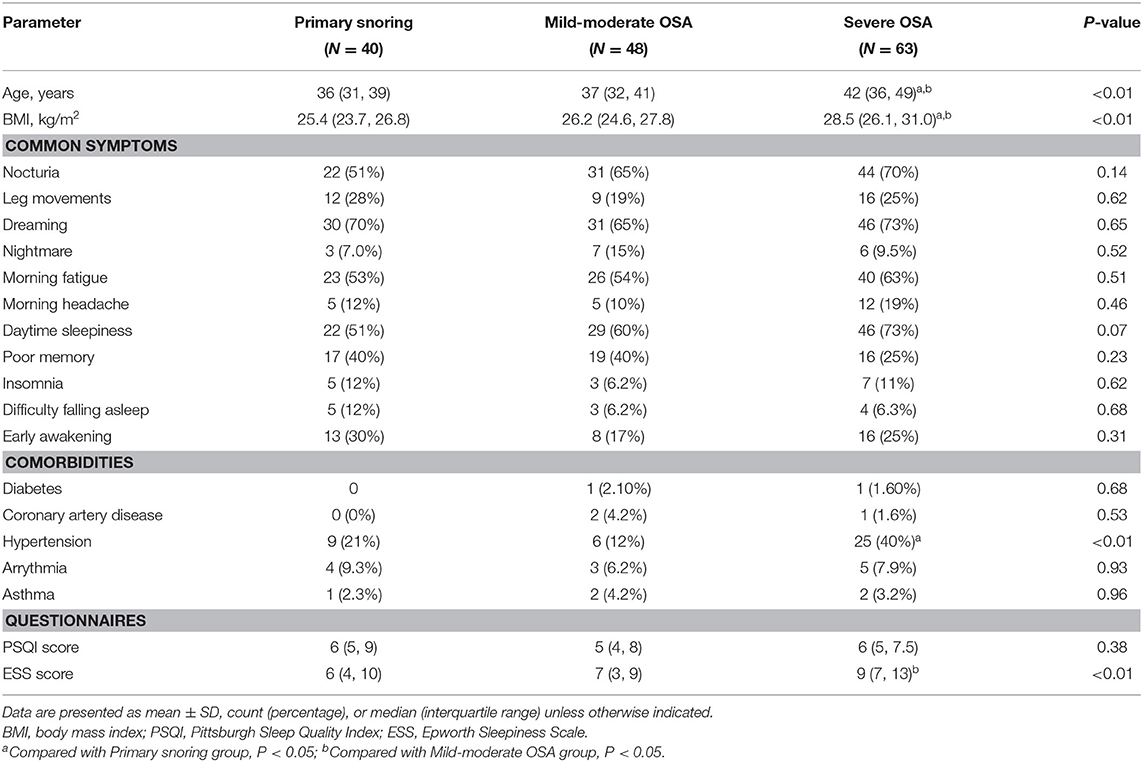
Table 1. Demographic and clinical characteristics in the primary snoring group, mild-moderate OSA group, and Severe OSA group.
Power spectral analysis (PSA) provides a more objective alternative perspective for the analysis of EEG signals by leveraging Fast Fourier Transform (FFT) to convert time-domain EEG signals (amplitude vs. time) to frequency-domain signals (amplitude vs. frequency). This technique reveals additional information about brain activities during sleep, which might otherwise be hidden to clinicians examining the plain EEG signals on PSG tracings. PSA quantifies the amplitude of each frequency component band that constitutes the EEG waveform in the form of a power spectrum, with amplitude plotted against frequency (15). The literature has much on the physiological significance of each frequency band during different sleep stages: (1) delta activities (1–4 Hz) is generally considered to be an indicator of sleep depth and homeostasis during NREM sleep (16, 17); (2) theta activities (4–8 Hz) in the frontal region serve as a marker of emotional memory consolidation (18, 19); (3) alpha activities (8–12 Hz) are suggested to be a cortical signature of visual perception and mental imagery (20), and a reflection of neuronal activities, with low alpha levels indicating a state of excitation and vice versa (21, 22); (4) sigma activities (12–15 Hz) during N2 sleep serve as a proxy for the sleep spindle and is shown to facilitate learning and memory consolidation (23) and protect sleep from external disturbances (24, 25); and (5) high-frequency activities in the beta (15–30 Hz) and gamma (30–40 Hz) ranges are associated with arousals (24, 26, 27). As such, PSA enables a closer examination of the relative changes in prominence of each frequency band in OSA patients, to reveal the functional significance that underlies the change in EEG patterns.
In this study, we applied the PSA technique to analyze the EEG power spectral distribution variations between OSA patients and primary snoring patients during NREM and REM sleep. Moreover, clinical variables were examined for their correlation with the observed between-group EEG power differences, so as to reveal pathological manifestations of the underlying EEG changes and the clinical significance thereof.
Method
Participants
A retrospective cohort study was carried out with a selected subset of data from 1,086 patients received with complaints of snoring and a clinical suspicion of OSA at the Sleep Center of the Second Affiliated Hospital of Soochow University from January 2018 to June 2020. In view of previous studies that have shown gender differences in various sleep parameters (28), this study focused primarily on male patients. The patients were between 25 and 65 years old and have received >9 years of education. Individuals taking medications in the last 3 months that are known to impact sleep profiles (e.g., hypnotics, benzodiazepines) or suffering from other sleep disorders (insomnia, central sleep apnea, rapid eye movement sleep behavioral disorder, restless legs syndrome, narcoleptic spectral disorder, periodic limb movement disorder) or significant artifacts in EEG date were excluded. Individuals with serious lung, kidney, liver, or brain diseases were also excluded. Clinical data and PSG studies from 151 subjects were eventually selected and divided into three groups, according to standards recommended by the Chinese Medical Association (29): primary snoring (snoring with AHI <5 events/h; N = 40), mild-moderate OSA (5 ≤ AHI ≤ 30 events/h; N = 48), and severe OSA (AHI > 30 events/h; N = 63) (see Figure 1 for a flow chart of the subject selection process). Epworth Sleepiness Scale (ESS) and the Pittsburgh Sleep Quality Index (PSQI) were administered to all patients to evaluate their sleep quality and the potential presence of excessive daytime sleepiness (30, 31). All subjects completed the questionnaires in a quiet and isolated room. The participants in the study gave informed consent, and the study protocol was approved by the Research Ethics Committee of the Second Affiliated Hospital of Soochow University, Suzhou, China (Batch number: JD-LK-2018-006-01).
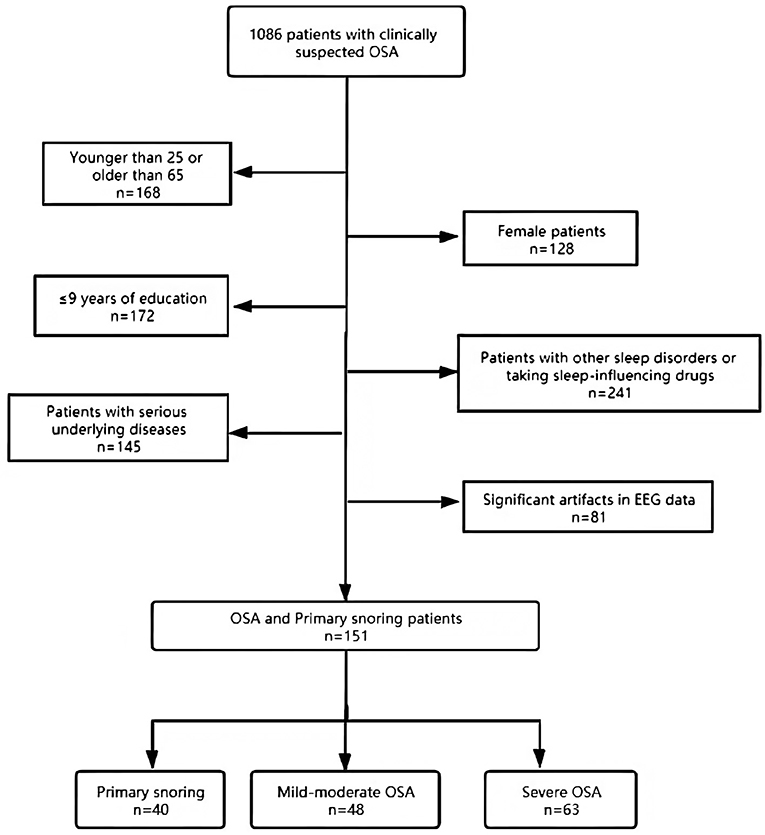
Figure 1. Flow chart showing the patient selection process leading to the final cohort.
Polysomnography and Sleep Analysis
The participants underwent overnight, supervised, laboratory-based video polysomnography. The PSG recorded from 22:00 to 06:00 the next morning. Compumedics Grael multifunctional PSG monitoring system was used for all signal acquisition (Compumedics Company, Australia). Only PSG readings with an effective monitoring time ≥7 h were included for analysis (32). The polysomnographic recordings included eight electroencephalogram (EEG) channels (F3, F4, C3, C4, O1, O2, A1, and A2, placed according to the international 10–20 system), bilateral electrooculograms (EOGs), submental and bilateral anterior tibialis electromyograms (EMGs), electrocardiograms (ECGs), the nasal and oronasal airflow (by using nasal pressure monitor and thermistor), arterial oxygen saturation (via finger pulse oximetry), thoracic and abdominal movements (via inductance plethysmography), and time-synchronized video recordings with audio.
Sleep Stage Analysis and Scoring
Sleep stages and sleep-related respiratory analysis were scored manually in 30-s epochs by registered technicians according to the AASM scoring criteria (33). The apnea-hypopnea index (AHI) was calculated as the mean number of apneas and hypopneas (with ≥3% desaturation or an arousal) per hour of sleep. The oxygen desaturation index was defined as the mean number of ≥3% desaturation events per hour of sleep. Other recorded parameters included total sleep time (TST), proportions of each sleep stage, minimum arterial oxygen saturation (minSaO2), percent sleep time below 90% SaO2 (T90%), sleep efficiency, sleep latency, REM latency, and arousal index (ArI).
EEG Preprocessing
Thirty-second samples were extracted from EEG recordings during both rapid eye movement (REM) sleep and non-rapid eye movement (NREM) sleep. As NREM sleep is a very heterogeneous state consisting of three distinct stages (N1, N2, and N3), in this study, we chose to focus mainly on N2 sleep, the more stable period during sleep. EEG signals were sampled from epochs free from respiratory events to avoid potential interferences. Using the EEGLAB toolbox in MATLAB (Math works, R2013b), raw data were imported at a sampling rate of 512 Hz and down-sampled to 256 Hz, before applying a band-pass filter between 0.1 and 100 Hz and a notch filter at 50 Hz. We used the linked ear electrodes as a reference and segmented the 30-second REM and NREM sleep epochs into 15 2s mini-epochs. Channels with excessive noise, drift, or unstable connection were interpolated using spherical interpolation. Mini-epochs were visually inspected to exclude those with excessive noise or >3 electrodes with artifacts. To identify mini-epochs with eye movements, Independent component analysis (ICA) was performed using the extended infomax algorithm, and identified segments were manually inspected and removed. Lastly, the EEG was inspected visually again and epochs with excessive noise or artifacts were removed. Impedances of all EEG electrodes were kept below 10 kΩ. The investigator who performed the EEG preprocessing was blinded to the diagnosis.
Power Spectral Analyses
Selected mini-epochs in each EEG electrode (F3, F4, C3, C4, O1, O2) were Hanning-tapered and Fourier transformed by the FFT algorithm (with 50% overlapping windows) to obtain the spectral power density at each frequency. We assessed the following six frequency bands: delta (0.5–4 Hz), theta (4–8 Hz), alpha (8–12 Hz), sigma (12–15 Hz), beta (15–30 Hz), and gamma (30–45 Hz), with each band inclusive of the lower boundary but not the upper boundary. Normalized band power [also known in some other studies as relative EEG power (34), and equivalently percent power (35)] was then calculated by normalizing the total power (0.5–45 Hz) for inter-participant comparisons. That is, the absolute band spectral power measurements of each participant were multiplied by a factor such that all participants share the same total power in the frequency range of interest (0.5–45 Hz) (Normalization was conducted separately for each sleep stage and electrode location). This method thus accounts better for the relative contribution and thus the prominence of each frequency band and reduced the cross-participant variance. Activities between 48 and 52 Hz were excluded from the analysis to remove potential power line interferences. Scalp electrodes were grouped into three regions of interest (ROIs), including the frontal (F3, F4), central (C3, C4), and occipital (O1, O2) regions.
Statistical Analysis
The statistical analyses were carried out using the SPSS software (version 17.0, SPSS, Inc. Chicago, IL, USA). The measured data are presented as the mean ± standard deviation if normally distributed or otherwise median (with interquartile range in brackets). Normally distributed variables were compared using one-way analysis of variance, and the non-normally distributed variables using the Mann-Whitney U test. Categorical variables are presented as the frequency distribution and were compared using the chi-squared test or Fisher's exact test. Partial Spearman correlation analyses were used to evaluate the relationship between the clinical variables and normalized power spectral density in each frequency band, adjusting for patients' age. The p-values were adjusted for multiple comparisons using the Benjamini-Hochberg procedure. A false discovery rate of p < 0.05 was considered statistically significant.
Results
Demographics and Sleep Microarchitecture
An initial cohort of 1,086 patients with complaints of snoring and a clinical suspicion of OSA were identified in the database, from which a subset of 151 patients was selected to form the final cohort (see Figure 1 for details on patient selection). The demographic and clinical characteristics are shown in Table 1. The median age was 38 years. The patients tend to be older, with higher BMI, score higher in ESS, and are at higher risks for hypertension in the severe OSA group than in the other two groups (all p < 0.05). We found no significant differences in PSQI score and the prevalence of diabetes, arrhythmia, stroke, coronary artery diseases, and asthma among the three groups. Notably, no significant inter-group differences were found in terms of patient-reported symptoms, including daytime sleepiness, insomnia, and poor memory (all p > 0.05). Table 2 summarizes the PSG parameters for all three groups. Increasing OSA severity is associated with higher N1%, ODI, T90%, arousal index and longest time of apnea, lower N3%, and minSaO2 (p < 0.05 and mostly p < 0.01 between any two severity groups).
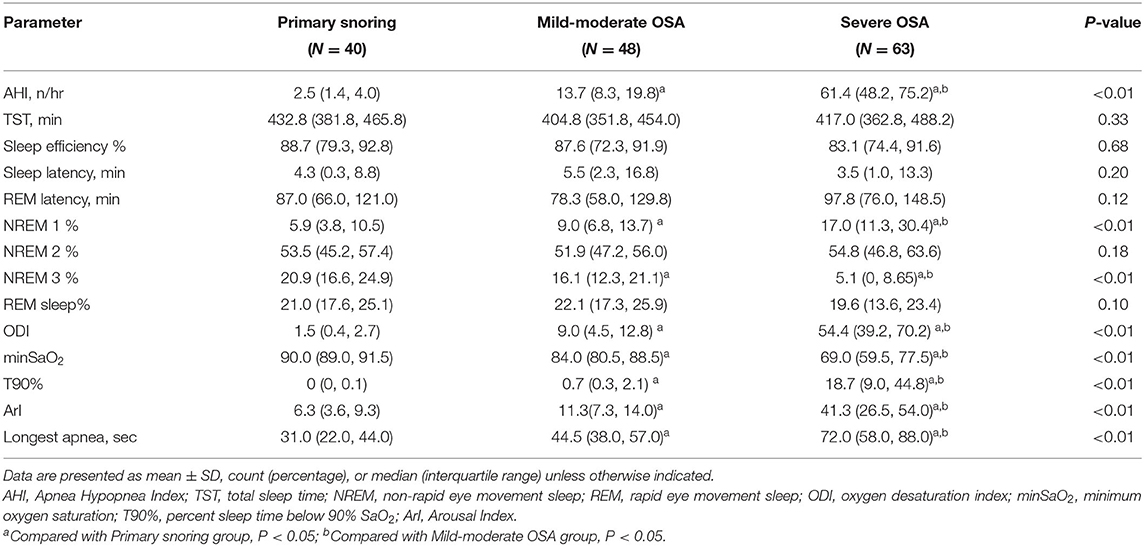
Table 2. PSG parameters in the primary snoring group, mild-moderate OSA group, and Severe OSA group.
Power Spectral Analyses
Figure 2 shows the normalized power spectral density among the primary snoring group, mild-moderate OSA group, and severe OSA group. In NREM sleep, elevated delta band PSD was observed in the severe OSA group compared to the other two groups. In contrast, the PSD of the other frequency bands showed a corresponding decrease in the severe OSA group, which is especially prominent in the theta and alpha frequency bands. This change was observed in the frontal, central, and occipital regions. In REM sleep, a similar pattern was observed, but only in the frontal region, i.e., an increase in delta PSD and a decrease in that of the other bands (all p < 0.05 and mostly p < 0.01).
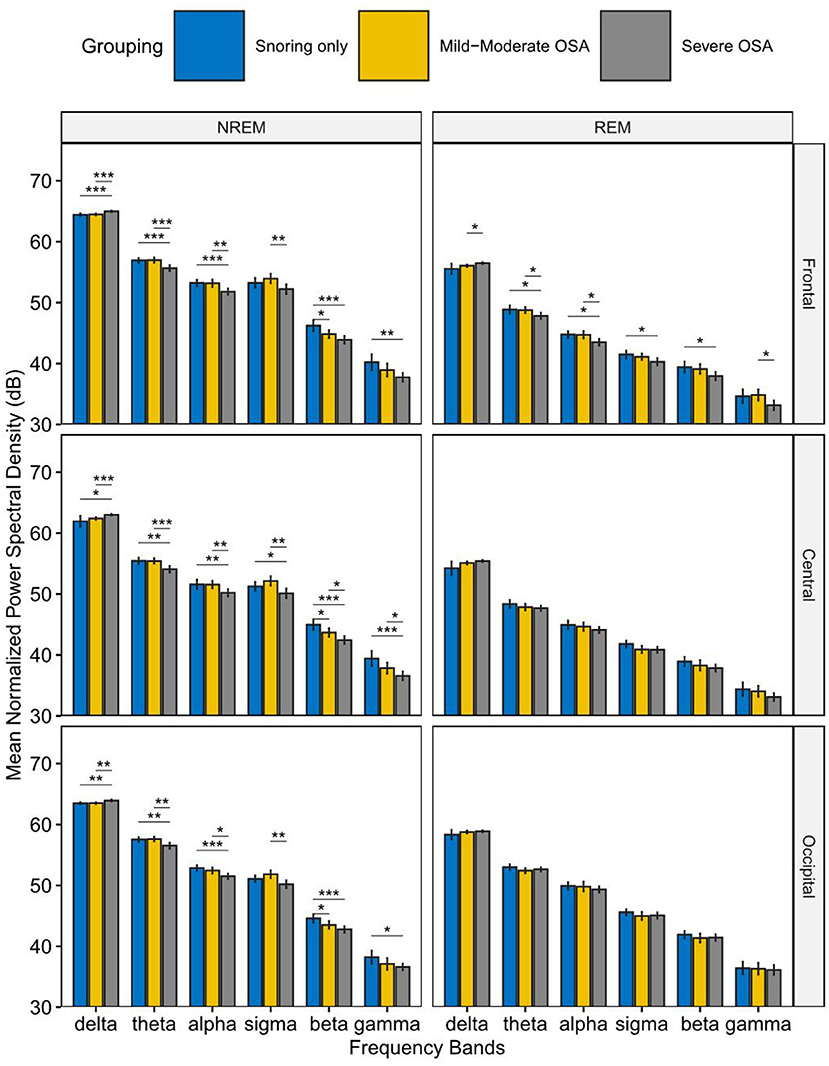
Figure 2. Mean Normalized Power spectral density in the primary snoring group, mild-moderate OSA group, and Severe OSA group. In NREM sleep (left), elevated normalized power spectral density (PSD) in the delta band was observed in the severe OSA group compared to the other two groups. In contrast, the PSD of the other frequency bands showed a corresponding decrease in the severe OSA group. In REM sleep (right), similar changes were observed in the frontal region. *P < 0.05, **P < 0.01, ***P < 0.001.
Relationship Between Sleep EEG Power and OSA Clinical Variables
Partial correlation analyses were conducted to explore further the associations of the EEG PSD with the clinical PSG parameters. After adjustments for patient age and corrections for multiple comparisons, delta band PSD was shown to be positively correlated with AHI (r = 0.33), longest time of apnea (r = 0.21), ODI (r = 0.34), T90% (r = 0.30), ArI (r = 0.29) and negatively correlated with N3% (r = −0.25), minSaO2 (r = −0.28) (see Table 3). Correspondingly, the PSD in the other frequency bands except sigma demonstrated an inverse pattern of correlations with these PSG parameters (see Table 3 and Figure 3).
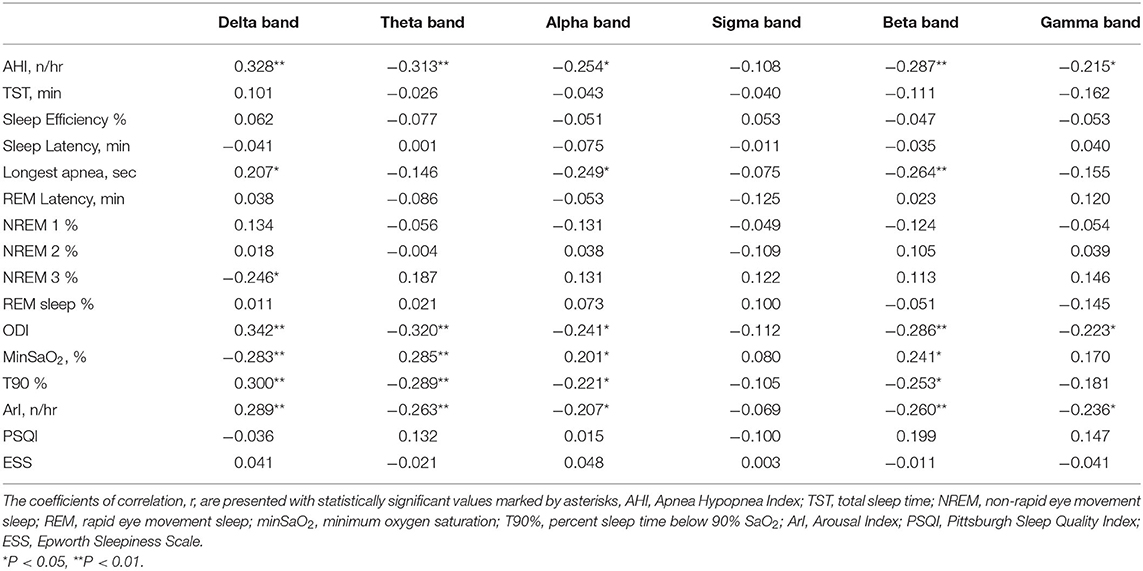
Table 3. Correlation between PSG parameters and normalized power spectral density in each frequency band.
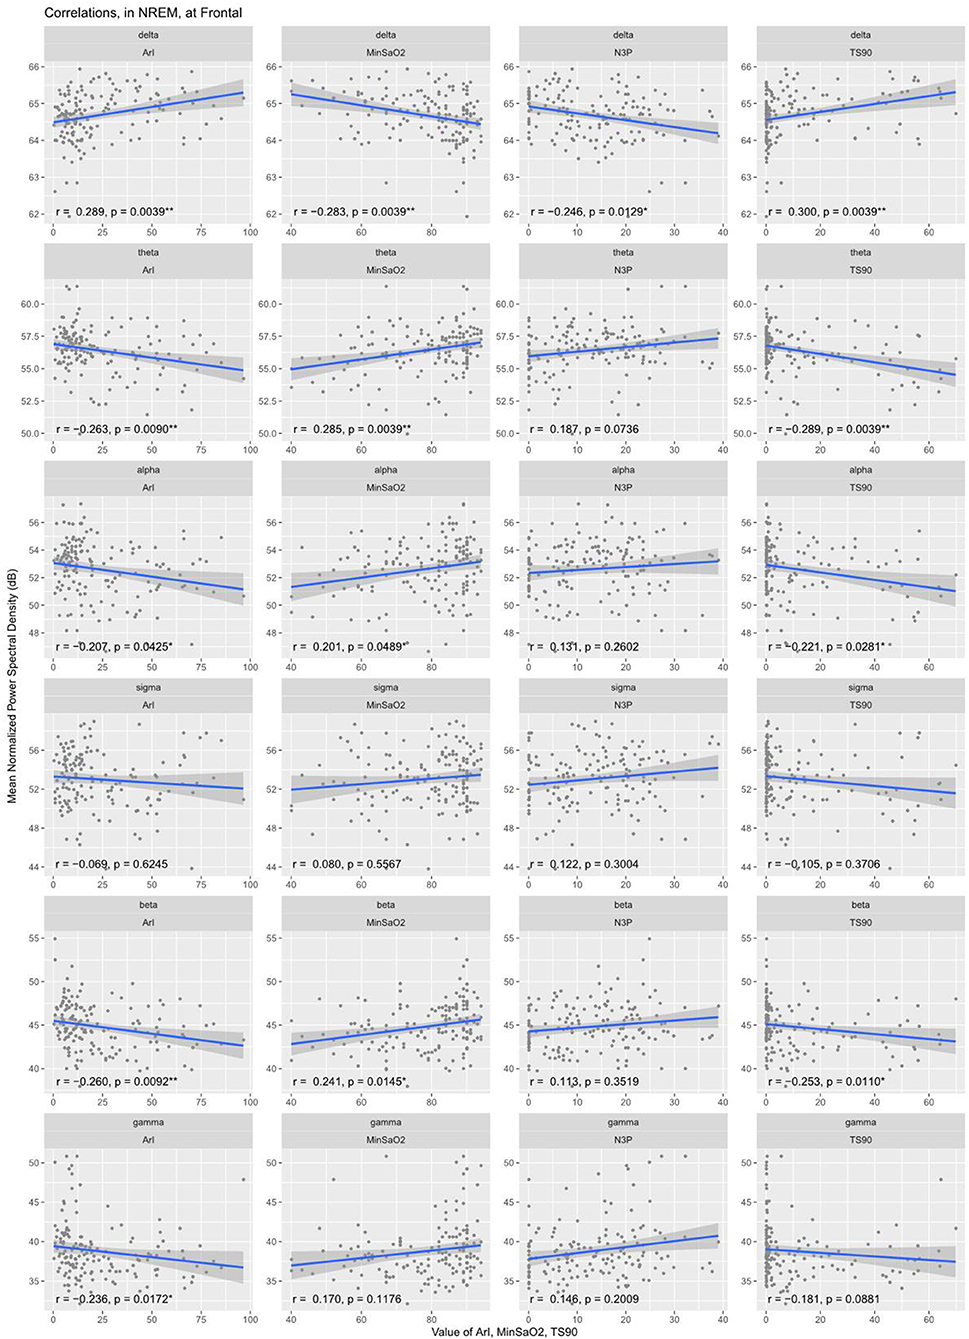
Figure 3. Correlation between normalized EEG spectral power density in the frontal region and clinical variables during NREM sleep. Delta band PSD was positively correlated with ArI, T90% and negatively correlated with minSaO2, N3%. Correspondingly, the PSD in the other frequency bands except sigma demonstrated an inverse pattern of correlations with these PSG parameters. ArI, Arousal Index; N3%, proportion of time in Stage III sleep; T90%, percent sleep time below 90% SaO2; minSaO2, minimum SaO2 reached during sleep.
Discussion
This study aimed to characterize EEG power in different frequency bands during REM sleep and NREM sleep in patients with OSA. By computing the normalized spectral power densities, we found elevated normalized PSD in the delta band and decreased normalized PSD in the other frequency bands in the severe OSA group compared to the other two groups in NREM sleep. In REM sleep, similar changes were observed in the frontal region.
Two aspects distinguish this study from the previously published works on EEG spectral analysis in OSA patients: (1) previous studies have mostly focused their investigation on the EEG spectral distribution during wakefulness in OSA patients, with results showing increased low-frequency activity (delta and theta) in frontal and central regions compared with healthy controls (35, 36) and (2) few studies have so far analyzed the relative changes in the power of each frequency band in OSA patients during sleep. One previous study by Appleton et al. (37) demonstrated the absolute band spectral power in all frequency bands was higher for patients with higher AHI, and no changes were shown in the relative proportion or importance of each frequency band [see also a study by Kang et al. (38) showing similar increases in the beta and delta frequency bands].
This study thus set the focus on EEG recordings during sleep and adopted a relative measure of EEG band spectral power by normalizing the total EEG power for each participant for cross-participant comparisons, to allow a closer examination of the relative contributions by each frequency band to the total power, and how the severity of OSA mediates this change. Our results showed elevated delta power spectral density in the severe OSA group during the N2 stage compared to both the snoring only group and the mild-moderate OSA group. Correspondingly, reduced power spectral density was observed in other frequency bands in the severe OSA group compared to the other two groups. This demonstrates a shift in relative power contribution from the higher frequencies to the lower frequencies, i.e., the delta band, in the severe OSA patients. This is in agreement with previous EEG studies on OSA patients showing an increase in delta power during sleep (38, 39) and wakefulness (34). The methodology of computing normalized EEG power, however, allowed this paper to provide a more detailed analysis of the change in the relative importance of each power band, specifically, showing the relatively reduced spectral power in faster frequencies in NREM sleep, which previous studies failed to reveal.
There are a few potential explanations for this increase in delta power. In line with the two key pathophysiological mechanisms of OSA patients, hypoxia and sleep fragmentation, correlation analysis was conducted to examine whether variations in delta spectral power could be predicted by clinical variables associated with the two characteristics. For the former, hypoxia, our analysis showed that delta EEG spectral power was negatively correlated with MinSaO2 and positively correlated with T90%. That is, OSA patients who suffered from more severe hypoxia during the night exhibited higher spectral power in the delta frequency band. This is supported by previous studies, which demonstrated an increase in delta spectral power (40, 41) and a decrease in beta power (38) in healthy volunteers under hypoxia conditions [see however a mouse study showing contrary results (42)]. In terms of sleep fragmentation, it was found that frontal delta spectral power in NREM sleep was positively correlated with the patients' arousal index and negatively correlated with the proportion of time in N3 sleep. That is, patients with higher EEG slowing are more prone to arousals, resulting in sleep fragmentation and a reduction of deep sleep. However, it has to be cautiously noted that the evidence provided in this study is purely correlational. Future studies are required to investigate the exact causal relationship between hypoxia, sleep fragmentation, and EEG slowing.
Clinically, changes in EEG power spectral distributions and especially the EEG slowing could entail significant prognostic consequences. Studies have reported greater EEG slowing in association with poorer performance in psychomotor vigilance tasks (41) and driving simulators (43, 44). Another observational study has reported EEG slowing in frontal lateral regions in patients with memory difficulties and mild cognitive impairment (45). It is also worth noting that this increased delta band activity was observed in frontal, central, and occipital regions in the NREM stage, as was also observed previously (44). This corroborates with existing brain imaging studies demonstrating cortical activation and compromised gray and white matter integrity across multiple brain regions (frontal and parietal cortex, temporal lobe, anterior cingulate, hippocampus, and cerebellum) (46, 47). This may partly account for the wide variability of neurobehavioral disorders in OSA patients (46).
This thus suggests that the changes in slow-wave activities may be one of the pathological mechanisms of OSA. Consistent with previous studies that demonstrated pathological EEG changes in the frontal area (46), we found a significant increase in delta spectral power and a decrease in spectral power in the faster frequency bands in severe OSA patients during both NREM and REM sleep in the frontal lobe. Given that the frontal lobe is believed to be primarily responsible for regulating higher cognitive functions such as goal-directed executive function, attention, motivation, and memory, these impairments in higher cognitive functions are frequently reported in OSA patients (48). Moreover, this is made worse by the fact that the frontal lobe is more sensitive to sleep fragmentation or hypoxic damage than other brain regions (49). In our study, no apparent differences were observed among the three groups in terms of patient complaints including memory function decline, daytime sleepiness, and insomnia; neither did the PSQI questionnaires reveal any inter-group distinctions. In contrast, significant changes in the power density spectrum were detected in multiple brain regions, sensitive enough even in our set of young and middle-aged patients (39.8 ± 10.1 years). Therefore, EEG spectral analysis could be a potentially useful technique to signal early pathological brain changes in OSA patients.
There are a few limitations in this study. Our cohort consists only of young and middle-aged male patients, making our findings potentially less generalizable to the overall OSA population. Another limitation is that we chose to only analyze stage N2 among the three NREM stages, though N2 sleep is usually the most stable and it accounts for the largest proportion (~45–55%) of the total sleep time in adults. Lastly, the control group chosen in this study is primary snoring patients instead of healthy individuals, partly due to the retrospective and hospital-based nature of the study.
In summary, in OSA patients, abnormal activations of the cerebral cortex, that is, the increase in slow-wave EEG activities and the decrease in fast-wave activities, represent an increase in disease severity, degree of hypoxia, sleep fragmentation, and repeated awakening. This study also demonstrated the utility of PSA as a tool in EEG analysis in complementing the traditional PSG parameters to assess disease severity and progression.
Data Availability Statement
The raw data supporting the conclusions of this article will be made available by the authors, without undue reservation.
Ethics Statement
The studies involving human participants were reviewed and approved by the Research Ethics Committee of the Second Affiliated Hospital of Soochow University, Suzhou, China (JD-LK-2018-004-02). The patients/participants provided their written informed consent to participate in this study. Informed consent was sought from all patients involved, with the understanding that anonymized data could be used for research and publications.
Author Contributions
SL collected and analyzed data and drafted the manuscript. JS designed the study, co-drafted the manuscript, was involved in the clinical diagnosis, and management of patients. YL analyzed data and co-drafted the manuscript. JinW conducted the medical assessment of the patients. QW analyzed the PSG data for the study. JX and JiaW provided guidance on experimental design and statistical analyses. RC designed experiments, participated in coordination, and critically revised the manuscript. All authors read and approved the final manuscript.
Funding
This work was supported by National Natural Science Foundation of China (NSFC 81770085 and NSFC 82070095); Jiangsu Key Laboratory of Preventive and Translational Medicine for Geriatric Diseases (KJS2041); Team Innovation Funding Program of the Second Affiliated Hospital of Soochow University (XKTJ-TD202003).
Conflict of Interest
The authors declare that the research was conducted in the absence of any commercial or financial relationships that could be construed as a potential conflict of interest.
References
1. Ralls F, Cutchen L. A contemporary review of obstructive sleep apnea. Curr Opin Pulm Med. (2019) 25:578–93. doi: 10.1097/MCP.0000000000000623
2. Morin CM, Drake CL, Harvey AG, Krystal AD, Manber R, Riemann D, et al. Insomnia disorder. Nat Rev Dis Primers. (2015) 1:15026. doi: 10.1038/nrdp.2015.26
3. Lévy P, Kohler M, McNicholas WT, Barbé F, McEvoy RD, Somers VK, et al. Obstructive sleep apnoea syndrome. Nat Rev Dis Primers. (2015) 1:15015. doi: 10.1038/nrdp.2015.15
4. Leppänen T, Töyräs J, Mervaala E, Penzel T, Kulkas A. Severity of individual obstruction events increases with age in patients with obstructive sleep apnea. Sleep Med. (2017) 37:32–37. doi: 10.1016/j.sleep.2017.06.004
5. Shahveisi K, Jalali A, Moloudi MR, Moradi S, Maroufi A, Khazaie H. Sleep architecture in patients with primary snoring and obstructive sleep apnea. Basic Clin Neurosci. (2018) 9:147–56. doi: 10.29252/NIRP.BCN.9.2.147
6. Punjabi NM, Caffo BS, Goodwin JL, Gottlieb DJ, Newman AB, O'Connor GT, et al. Sleep-disordered breathing and mortality: a prospective cohort study. PLoS Med. (2009) 6:e1000132. doi: 10.1371/journal.pmed.1000132
7. Banno K, Kryger MH. Sleep apnea: clinical investigations in humans. Sleep Med. (2007) 8:400–26. doi: 10.1016/j.sleep.2007.03.003
8. Chen R, Xiong KP, Huang JY, Lian YX, Jin F, Li ZH, et al. Neurocognitive impairment in Chinese patients with obstructive sleep apnoea hypopnoea syndrome. Respirology. (2011) 16:842–8. doi: 10.1111/j.1440-1843.2011.01979.x
9. Vakulin A, Catcheside PG, Baulk SD, Antic NA, Banks S, Dorrian J, et al. Individual variability and predictors of driving simulator impairment in patients with obstructive sleep apnea. J Clin Sleep Med. (2014) 10:647–55. doi: 10.5664/jcsm.3792
10. Kapur VK, Auckley DH, Chowdhuri S, Kuhlmann DC, Mehra R, Ramar K, et al. Clinical practice guideline for diagnostic testing for adult obstructive sleep apnea: an american academy of sleep medicine clinical practice guideline. J Clin Sleep Med. (2017) 13:479–504. doi: 10.5664/jcsm.6506
11. Gottlieb DJ, Punjabi NM. Diagnosis and management of obstructive sleep apnea: a review. JAMA. (2020) 323:1389–400. doi: 10.1001/jama.2020.3514
12. Al-Shawwa BA, Badi AN, Goldberg AN, Woodson BT. Defining common outcome metrics used in obstructive sleep apnea. Sleep Med Rev. (2008) 12:449–61. doi: 10.1016/j.smrv.2008.07.008
13. Beebe DW. Neurobehavioral effects of obstructive sleep apnea: an overview and heuristic model. Curr Opin Pulm Med. (2005) 11:494–500. doi: 10.1097/01.mcp.0000183059.52924.39
14. Quan SF, Chan CS, Dement WC, Gevins A, Goodwin JL, Gottlieb DJ, et al. The association between obstructive sleep apnea and neurocognitive performance–the Apnea Positive Pressure Long-term Efficacy Study (APPLES). Sleep. (2011) 34:303–14B. doi: 10.1093/sleep/34.3.303
15. Arab MR, Suratgar AA, Ashtiani AR. Electroencephalogram signals processing for topographic brain mapping and epilepsies classification. Comput Biol Med. (2010) 40:733–9. doi: 10.1016/j.compbiomed.2010.06.001
16. Knyazev GG. EEG delta oscillations as a correlate of basic homeostatic and motivational processes. Neurosci Biobehav Rev. (2012) 36:677–95. doi: 10.1016/j.neubiorev.2011.10.002
17. Jones SG, Riedner BA, Smith RF, Ferrarelli F, Tononi G, Davidson RJ, et al. Regional reductions in sleep electroencephalography power in obstructive sleep apnea: a high-density EEG study. Sleep. (2014) 37:399–407. doi: 10.5665/sleep.3424
18. Nishida M, Pearsall J, Buckner RL, Walker MP. REM sleep, prefrontal theta, and the consolidation of human emotional memory. Cereb Cortex. (2009) 19:1158–66. doi: 10.1093/cercor/bhn155
19. Kraus J, Roman R, Lacinová L, Lamoš M, Brázdil M, Fredrikson M. Imagery-induced negative affect, social touch and frontal EEG power band activity. Scand J Psychol. (2020) 61:731–9. doi: 10.1111/sjop.12661
20. Xie S, Kaiser D, Cichy RM. Visual imagery and perception share neural representations in the alpha frequency band. Curr Biol. (2020) 30:2621–7.e5. doi: 10.1016/j.cub.2020.04.074
21. Hanslmayr S, Volberg G, Wimber M, Dalal SS, Greenlee MW. Prestimulus oscillatory phase at 7 Hz gates cortical information flow and visual perception. Curr Biol. (2013) 23:2273–8. doi: 10.1016/j.cub.2013.09.020
22. Weisz N, Hartmann T, Müller N, Lorenz I, Obleser J. Alpha rhythms in audition: cognitive and clinical perspectives. Front Psychol. (2011) 2:73. doi: 10.3389/fpsyg.2011.00073
23. Fogel SM, Smith CT. The function of the sleep spindle: a physiological index of intelligence and a mechanism for sleep-dependent memory consolidation. Neurosci Biobehav Rev. (2011) 35:1154–65. doi: 10.1016/j.neubiorev.2010.12.003
24. Spiegelhalder K, Regen W, Feige B, Holz J, Piosczyk H, Baglioni C. Increased EEG sigma and beta power during NREM sleep in primary insomnia. Biol Psychol. (2012) 91:329–33. doi: 10.1016/j.biopsycho.2012.08.009
25. Dang-Vu TT, McKinney SM, Buxton OM, Solet JM, Ellenbogen JM. Spontaneous brain rhythms predict sleep stability in the face of noise. Curr Biol. (2010) 20:R626–R7. doi: 10.1016/j.cub.2010.06.032
26. Perlis ML, Smith MT, Andrews PJ, Orff H, Giles DE. Beta/Gamma EEG activity in patients with primary and secondary insomnia and good sleeper controls. Sleep. (2001) 24:110–7. doi: 10.1093/sleep/24.1.110
27. Hogan SE, Delgado GM, Hall MH, Nimgaonkar VL, Germain A, Buysse DJ, et al. Slow-oscillation activity is reduced and high frequency activity is elevated in older adults with insomnia. J Clin Sleep Med. (2020) 16:1445–54. doi: 10.5664/jcsm.8568
28. Richards A, Metzler TJ, Ruoff LM, Inslicht SS, Rao M, Talbot LS, et al. Sex differences in objective measures of sleep in post-traumatic stress disorder and healthy control subjects. J Sleep Res. (2013) 22:679–87. doi: 10.1111/jsr.12064
29. Chinese Medical Association Sleep Breathing Disorders Group. Diagnostic and therapic manual for obstructive sleep apnea–hypopnea syndrome. Chin J Tuberc Respir Dis. (2002) 25:195–8. doi: 10.3760/cma.j.issn.1001-0939.2012.01.007
30. Hurlston A, Foster SN, Creamer J, Brock MS, Matsangas P, Moore BA, et al. The epworth sleepiness scale in service members with sleep disorders. Mil Med. (2019) 184:e701–e7. doi: 10.1093/milmed/usz066
31. Mollayeva T, Thurairajah P, Burton K, Mollayeva S, Shapiro CM, Colantonio A, et al. The Pittsburgh sleep quality index as a screening tool for sleep dysfunction in clinical and non-clinical samples: a systematic review and meta-analysis. Sleep Med Rev. (2016) 25:52–73. doi: 10.1016/j.smrv.2015.01.009
32. Chen R, Xiong KP, Lian YX, Huang JY, Zhao MY, Li JX, et al. Daytime sleepiness and its determining factors in Chinese obstructive sleep apnea patients. Sleep Breath. (2011) 15:129–35. doi: 10.1007/s11325-010-0337-4
33. Berry RB, Budhiraja R, Gottlieb DJ, Gozal D, Iber C, Kapur VK, et al. Rules for scoring respiratory events in sleep: update of the 2007 AASM Manual for the Scoring of Sleep and Associated Events. Deliberations of the sleep apnea definitions task force of the american academy of sleep medicine. J Clin Sleep Med. (2012) 8:597–619. doi: 10.5664/jcsm.2172
34. Sunwoo JS, Cha KS, Byun JI, Kim TJ, Jun JS, Lim JA, et al. Abnormal activation of motor cortical network during phasic REM sleep in idiopathic REM sleep behavior disorder. Sleep. (2019) 42:1–10. doi: 10.1093/sleep/zsy227
35. Xiromeritis AG, Hatziefthimiou AA, Hadjigeorgiou GM, Gourgoulianis KI, Anagnostopoulou DN, Angelopoulos NV. Quantitative spectral analysis of vigilance EEG in patients with obstructive sleep apnoea syndrome : EEG mapping in OSAS patients. Sleep Breath. (2011) 15:121–8. doi: 10.1007/s11325-010-0335-6
36. D'Rozario AL, Kim JW, Wong KK, Bartlett DJ, Marshall NS, Dijk DJ, et al. A new EEG biomarker of neurobehavioural impairment and sleepiness in sleep apnea patients and controls during extended wakefulness. Clin Neurophysiol. (2013) 124:1605–14. doi: 10.1016/j.clinph.2013.02.022
37. Appleton SL, Vakulin A, D'Rozario A, Vincent AD, Teare A, Martin SA, et al. Quantitative electroencephalography measures in rapid eye movement and nonrapid eye movement sleep are associated with apnea–hypopnea index and nocturnal hypoxemia in men. Sleep. (2019) 42:1–9. doi: 10.1093/sleep/zsz092
38. Kang JM, Kim ST, Mariani S, Cho SE, Winkelman JW, Park KH, et al. Difference in spectral power density of sleep EEG between patients with simple snoring and those with obstructive sleep apnoea. Sci. Rep. (2020) 10:1–8. doi: 10.1038/s41598-020-62915-x
39. Muñoz-Torres Z, Jiménez-Correa U, Montes-Rodríguez CJ. Sex differences in brain oscillatory activity during sleep and wakefulness in obstructive sleep apnea. J. Sleep Res. (2020) 29:1–9. doi: 10.1111/jsr.12977
40. Saletu B, Grünberger J, Anderer P, Linzmayer L, König P. On the cerebro-protective effects of caroverine, a calcium-channel blocker and antiglutamatergic drug: double-blind, placebo-controlled, EEG mapping and psychometric studies under hypoxia. Br J Clin Pharmacol. (1996) 41:89–99. doi: 10.1111/j.1365-2125.1996.tb00165.x
41. Kraaier V, Van Huffelen AC, Wieneke GH. Quantitative EEG changes due to hypobaric hypoxia in normal subjects. Electroencephalogr Clin Neurophysiol. (1988) 69:303–12. doi: 10.1016/0013-4694(88)90002-8
42. Polotsky VY, Rubin AE, Balbir A, Dean T, Smith PL, Schwartz AR, et al. Intermittent hypoxia causes REM sleep deficits and decreases EEG delta power in NREM sleep in the C57BL/6J mouse. Sleep Med. (2006) 7:7–16. doi: 10.1016/j.sleep.2005.06.006
43. Mullins AE, Kim JW, Wong KKH, Bartlett DJ, Vakulin A, Dijk DJ, et al. Sleep EEG microstructure is associated with neurobehavioural impairment after extended wakefulness in obstructive sleep apnea. Sleep Breath. (2020) 4–11. doi: 10.1007/s11325-020-02066-5
44. Vakulin A, D'Rozario A, Kim JW, Watson B, Cross N, Wang D, et al. Quantitative sleep EEG and polysomnographic predictors of driving simulator performance in obstructive sleep apnea. Clin. Neurophysiol. (2016) 127:1428–35. doi: 10.1016/j.clinph.2015.09.004
45. Brayet P, Petit D, Frauscher B, Gagnon JF, Gosselin N, Gagnon K, et al. Quantitative EEG of rapid-eye-movement sleep: a marker of amnestic mild cognitive impairment. Clin. EEG Neurosci. (2016) 47:134–41. doi: 10.1177/1550059415603050
46. D'Rozario AL, Cross NE, Vakulin A, Bartlett DJ, Wong KKH, Wang D, et al. Quantitative electroencephalogram measures in adult obstructive sleep apnea – potential biomarkers of neurobehavioural functioning. Sleep Med Rev. (2017) 36:29–42. doi: 10.1016/j.smrv.2016.10.003
47. Harper RM, Kumar R, Ogren JA, Macey PM. Sleep-disordered breathing: effects on brain structure and function. Respir Physiol Neurobiol. (2013) 188:383–91. doi: 10.1016/j.resp.2013.04.021
48. Gagnon K, Baril AA, Gagnon JF, Fortin M, Décary A, Lafond C, et al. Cognitive impairment in obstructive sleep apnea. Pathol Biol (Paris). (2014) 62:233–40. doi: 10.1016/j.patbio.2014.05.015
Keywords: obstructive sleep apnea, polysomnography, REM and NREM sleep, power spectral analysis, normalized EEG power
Citation: Liu S, Shen J, Li Y, Wang J, Wang J, Xu J, Wang Q and Chen R (2021) EEG Power Spectral Analysis of Abnormal Cortical Activations During REM/NREM Sleep in Obstructive Sleep Apnea. Front. Neurol. 12:643855. doi: 10.3389/fneur.2021.643855
Received: 21 December 2020; Accepted: 27 January 2021;
Published: 26 February 2021.
Edited by:
David Gozal, University of Missouri, United StatesReviewed by:
Gonzalo C. Gutiérrez-Tobal, Center for Biomedical Network Research (CIBER), SpainThomas Penzel, Charité—Universitätsmedizin Berlin, Germany
Copyright © 2021 Liu, Shen, Li, Wang, Wang, Xu, Wang and Chen. This is an open-access article distributed under the terms of the Creative Commons Attribution License (CC BY). The use, distribution or reproduction in other forums is permitted, provided the original author(s) and the copyright owner(s) are credited and that the original publication in this journal is cited, in accordance with accepted academic practice. No use, distribution or reproduction is permitted which does not comply with these terms.
*Correspondence: Rui Chen, chenruigood@126.com
†These authors have contributed equally to this work