 Alexander Peter Murphy1,2
 Elizabeth Greally2Dara O'Hogain3Andrew Blamire3Peter Caravan4
 Volker Straub1,5*
- 1The Institute of Cancer and Genomics, Birmingham University, Birmingham, United Kingdom
- 2The John Walton Muscular Dystrophy Research Centre, Institute of Translational and Clinical Research, Newcastle University, Newcastle upon Tyne, United Kingdom
- 3Newcastle Magnetic Resonance Centre, Translational and Clinical Research Institute, Newcastle University, Newcastle upon Tyne, United Kingdom
- 4Department of Radiology, Martinos Center for Biomedical Imaging, Harvard Medical School, Massachusetts General Hospital, Charlestown, MA, United States
- 5Newcastle upon Tyne Hospitals NHS Foundation Trust, Newcastle University, Newcastle upon Tyne, United Kingdom
As putative treatments are developed for Duchenne muscular dystrophy (DMD), sensitive, non-invasive measures are increasingly important to quantify disease progression. Fibrosis is one of the histological hallmarks of muscular dystrophy and has been directly linked to prognosis. EP3533 is a novel contrast agent with an affinity to collagen 1 that has demonstrated a significant and high correlation to ex vivo fibrosis quantification. Halofuginone is an established anti-fibrotic compound shown to reduce collagen skeletal muscle fibrosis in murine models of DMD. This experiment explored whether EP3533 could be used to detect signal change in skeletal muscle of mdx mice before and after a 12 week course of halofuginone compared to controls. Four age-matched groups of treated and untreated mice were evaluated: 2 groups of mdx (n = 8 and n = 13, respectively), and 2 groups of BL10 mice (n = 5 and n = 3, respectively). Treated mice received an intraperitoneal injection with halofuginone three times per week for 12 weeks, with the remaining mice being given vehicle. Both mdx groups and the untreated BL10 were scanned at baseline, then all groups were scanned on week 13. All subjects were scanned using a 7T Varian scanner before and after administration of EP3533 using a T1 mapping technique. Mice underwent grip testing in week 13 prior to dissection. Skeletal muscle was used for Masson's trichrome quantification, hydroxyproline assay, and immunofluorescent antibody staining. Untreated mdx mice demonstrated a significant increase in R1 signal from pre- to post-treatment scan in three out of four muscles (gastrocnemius p = 0.04, hamstrings p = 0.009, and tibialis anterior p = 0.01), which was not seen in either the treated mdx or the BL10 groups. Histological quantification of fibrosis also demonstrated significantly higher levels in the untreated mdx mice with significant correlation seen between histology and EP3533 signal change. Forelimb weight adjusted-grip strength was significantly lower in the untreated mdx group, compared to the treated group. EP3533 can be used over time as an outcome measure to quantify treatment effect of an established anti-fibrotic drug. Further studies are needed to evaluate the use of this contrast agent in humans.
Introduction
Duchenne muscular dystrophy (DMD) is caused by mutations in the DMD gene and is inherited in an X-linked recessive fashion. DMD is considered the most commonly inherited muscle disease in childhood, with an incidence of 1 in 3,500–6,000 live male births (1–3). Dystrophin, the protein product of the DMD gene, is a sub-sarcolemmal cytoskeletal protein present in all muscle (4). The phenotype of patients with DMD is of progressive weakness of the skeletal, respiratory and cardiac muscles. DMD is considered a devastating, life-limiting condition (3, 5).
Dystrophin-deficient muscle results in a loss of structural membrane integrity of muscle fibres during cycles of contraction and relaxation. The damaged sarcolemma leads to an influx of cations such as calcium and sodium (6) into the intracellular compartment and consecutively to myofiber necrosis and chronic inflammation. Subsequently there is an accumulation of fibrosis and adipose tissue within the muscle (7). Higher degrees of endomysial fibrosis in skeletal muscle has been associated with a worse prognosis in neuromuscular disease (8). Sensitive and preferably minimally invasive techniques are increasingly important to evaluate putative therapies by quantifying fibrosis in vivo as a biomarker of disease progression.
EP3533 is a gadolinium-based MRI contrast agent which has an affinity for type 1 collagen (9). EP3533 has been successful in quantifying and staging fibrosis in several murine models (9–13) as well as quantifying anti-fibrotic therapy response (14). EP3533-enhanced MRI has been previously evaluated in a murine model of DMD, quantifying fibrosis in skeletal and cardiac tissues (15). There was a significant linear correlation demonstrated between ex vivo measures of fibrosis and skeletal muscle measurement of R1 change using EP3533-enhanced MRI (gastrocnemius: r = 0.83, P = 0.001; tibialis anterior: r = 0.73, P = 0.01) (15). While there is evidence that EP3533-enhanced MRI could be used to quantify fibrosis, it is unclear whether it is sensitive enough to detect disease progression in mdx mice and able to demonstrate changes in response to treatment as an outcome measure.
Halofuginone is a potent anti-fibrotic which inhibits phosphorylation of Smad 3 and attenuates gene expression of collagen-α1 in fibroblasts. These effects have been shown to lead to a reduction in collagen deposition and fibrosis (16, 17). Halofuginone has been trialled as an anti-fibrotic in the treatment of mdx mice with success in vivo (17–19). Studies have shown that halofuginone administration to young and old mdx mice have demonstrated significant improvements in measures of fibrosis and skeletal muscle function (18, 19).
The primary aim of this study was to determine whether EP3533-enhanced quantitative MRI could be used to demonstrate significant differences between mdx mice treated with an established anti-fibrotic (halofuginone). The secondary aim was to evaluate whether EP3533-enhanced quantitative MRI correlated significantly to ex vivo measures of fibrosis and a measurement of muscle function.
Materials and Methods
Four groups of age-matched (16 ± 3 weeks) mdx (C57BL/10ScSn-mdx/J, Jackson, Maine USA)and BL10 (C57BL/10ScSnOlaHsd, wild type, WT, Harlan Laboratories, Indianapolis, USA) male mice were utilised for the study. Groups were split to receive either vehicle (150 μl of 5% dimethyl sulfoxide and 0.9% saline) or halofuginone (7.5 μg) dissolved in the same solution (18, 20). All groups received vehicle or halofuginone via intraperitoneal injections three times per week for 12 weeks. The treated mdx group (n = 8), untreated mdx group (n = 13) and the treated BL10 mice (n = 3) would undergo baseline MRI scans with EP3533. The untreated BL10 group (n = 5) would be scanned at follow up (week 13) only. All groups underwent grip strength testing at week 13, then scanning of the lower limbs. Following this, mice were humanely killed and dissected for ex vivo quantification of fibrosis.
MRI Protocol
Animals were anaesthetised using 5% isoflurane in 0.5 L/min of oxygen, once induced, anaesthesia was maintained at 1 to 2% isoflurane. Hair removal cream was used to clear two patches of skin for contact with ECG electrodes, the tail vein cannulated and a line containing the EP3533 attached. The mouse was placed on a sled, incorporating ECG electrodes for cardiac imaging (Dazai, Canada) and positioned in a 39 mm internal diameter birdcage radiofrequency coil (Rapid Biomedical GmbH, Germany). Core body temperature was maintained using a warm air heating system interfaced to a rectal temperature monitoring probe and heart rate and respiration monitored (SA Instruments, NY).
Magnetic resonance scanning was performed on a 7-Tesla micro-imaging system (Varian; Agilent Technologies, Santa Clara, United States) equipped with a 12 cm micro-imaging gradient insert (maximum gradient, 40 mT/m). Following administration of 20 μmol/kg of EP3533, based on a previous study (15), subjects underwent all imaging at 60–70 min post-infusion using T1 weighted gradient recalled echo (GRE) imaging and then a gradient echo multi-slice inversion-recovery Look-Locker (gemsIR-LL). The T1 mapping sequence was performed on both upper and lower portions of the rear legs using a gemsIR-LL with 1 slice of 1 mm thickness selected through lower leg muscles with the following parameters: repetition time (TR) inversion = 5 s, 10 inversion times (from 0.1 to 5 s), TR/echo time (TE) = 9.68/4.86 ms, echo train length (ETL) = 4, flip angle (FA) = 4°, Field Of View (FOV) 30 × 30 mm, matrix = 128 × 128. The T1 weighted GRE acquired pre and post-contrast enhancement was acquired with TR/TE = 9.46/4.75 ms, FA = 20°, FOV = 30 × 30 × 30 mm, matrix 128 × 128 × 128, band width = 20 KHz.
For the lower leg muscles, mice were positioned with the upper border of the field of view beginning at the lower border of the knee. For the upper leg, mice were positioned with the centre of the knee joint as close as possible to the centre of the radiofrequency coil. Four slices were used to obtain the gemsIR-LL, two positioned above (+0.6 mm, 1.2 mm) and two below the knee joint (−0.6 mm, −1.2 mm). This enabled homogeneity in positioning for analysis.
All procedures performed were in accordance with the ethical standards of directive 2010/63/EU of the European parliament and under the auspices of the terms of the animals (scientific procedures) act 1986 and project licence PB3CA650C, authorised by the Home Secretary, Home Office, United Kingdom.
MRI Analysis and Region of Interest Selection
All scans were analysed using “Aedes software” (21). T1 maps were created by pixel-wise fitting of the lower limb datasets to the standard inversion recovery Look-Locker equation. Lower limb muscle ROIs were interactively defined in tibialis anterior and gastrocnemius muscles, based on previous MRI-based murine studies (22). Application of the ROIs to T1 maps were used to determine the change in R1 values in skeletal and cardiac muscles pre and post-contrast.
Ex vivo Fibrosis Quantification
Mice were humanely killed immediately after the second scan. The tibialis anterior, gastrocnemius, hamstring and quadriceps muscles were harvested. Samples were snap frozen in liquid nitrogen cooled isopentane and stored at −80°C. The left-sided muscles were collected for quantification of fibrosis markers via hydroxyproline, while right-sided muscles were obtained for histological analysis. In all muscles cryosections were cut 8 μm thick. To ensure more coverage of the muscle to detect focal fibrosis, sections were spaced 200 μm apart.
Histological staining was used to quantify fibrosis and confirm disease pathology. Cryosections were stained with Masson's trichrome (MaTr), haematoxylin and eosin (H&E) and immunofluorescent staining for collagen 1.
The percentage of fibrosis was quantified using the MaTr staining and regions of interest (ROIs) analysis via imaging software (Fiji 64 bit). Fibrosis was calculated as a percentage of the total area of the muscle section. A modified hydroxyproline assay was also used to quantify fibrosis in muscle (23).
Pharmacokinetics Sampling
To confirm serum levels of halofuginone, pharmacokinetics (PK) was performed in four halofuginone-naive mdx mice of similar ages to the experimental groups, using liquid chromatography—mass spectrometry/mass spectrometry (LC-MS/MS). Venesection of the saphenous vein was performed using a needle and capillary tubes after administration of halofuginone. To keep within UK Home Office guidance for volume of venesection per mouse, the samples were taken from four mice at two different time points each (24). From each mouse two samples of 150 μl were taken, with the second a terminal sample. PK levels were measured at: pre-injection, 5, 15, and at 30 min, then at 1, 2, 4, 8, and 24 h. These were stored as serum in lithium-heparin bottles and stored at −80°C. LC-MS/MS allowed quantification against a calibration curve from 0.5 to 1000 ng/ml. A stock solution of halofuginone in DMSO (5%) and saline (0.9%) was provided at a concentration of 10 mM as well as serum from a halofuginone naive mdx mouse. Quality control samples (3, 30, and 700 ng/mL) and mouse samples were mixed with organic solvent (methanol) containing a mixture of three generic internal standards. Samples were treated at a ratio of 3:1 solvent to sample. Following protein precipitation, samples were then centrifuged (30 min at 5,000 g). The resulting supernatant was diluted with double distilled water at a ratio of 2:1 parts of supernatant in a 96-well-plate. The plate was sealed, vortex mixed and analysed by LC-MS/MS with incurred samples quantified from the calibration line.
Functional Assessment of Grip Strength
Prior to the final scan, a measure of muscle function was assessed using a grip strength apparatus (BioSeb, Chaville, France), with both two and four limb assessment performed. These were tested using a “T” shaped bar attachment and were placed upon the apparatus before being pulled gently backwards by the tail. Mice had three attempts with at least a 1 min of rest between assessments. To reduce bias the same examiner performed the test, in the same temperature controlled, quiet environment. The weight and the maximal recorded value from the three attempts was used to calculate the normalised force (force/body weight) (25).
Statistical Analysis
All statistics were calculated using SPSS (version 23). Correlation is reported as a Pearson coefficient. Student's t-test was used to compare means, with p < 0.05 considered significant. One way anova was applied to compare grip test results with post-hoc analysis performed using the Tukey-Kramer test.
Results
All mice (mdx n = 21, BL10 n = 6) tolerated halofuginone treatment, vehicle and EP3533 administration with no side effects attributed to the drug and no significant weight difference was seen between treated and untreated groups. There were no significant differences between BL10 mouse groups in terms of weight, functional assessment, ex vivo measures of fibrosis or baseline and follow up R1 change. The BL10 groups were therefore considered together for comparison with mdx mouse groups.
Halofuginone Treatment Effects
Pharmacokinetic results demonstrated that halofuginone was detectable in serum at six of the eight time points. The concentration range was from 2.85 to 21.2 ng/ml with the highest peak at 5 min post-administration, these findings suggest successful administration at a concentration expected to induce a treatment effect (Figure 1). Area under the curve analysis was 913.68 ng/ml/min.
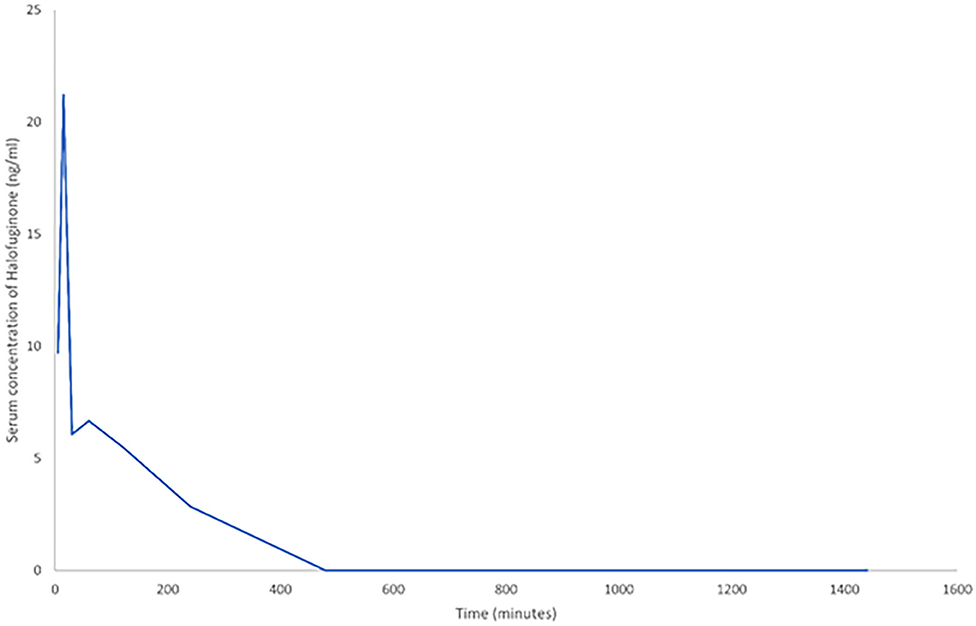
Figure 1. A line graph demonstrating the change in serum halofuginone post-intraperitoneal (IP) administration of 7.5 μg (n = 4). To allow inclusion of all time points, time is measured in minutes. The last five data points are at 1, 2, 4, 8, and 24 h respectively.
Ex vivo Fibrosis Quantification
Histological analysis demonstrated the diffuse nature of the fibrotic changes in mdx mouse muscle and comparative differences between groups (Figure 2). All treated mdx muscles demonstrated significantly lower mean levels of fibrosis compared to untreated mdx using hydroxyproline assay. Comparing treated to untreated mdx, MaTr quantification was significantly lower in three of the four muscles, with the exception of the QUADS (p = 0.06). These results suggest that levels of fibrosis were lower in the majority of muscles in treated mdx groups compared to the untreated mdx groups (Figure 3).
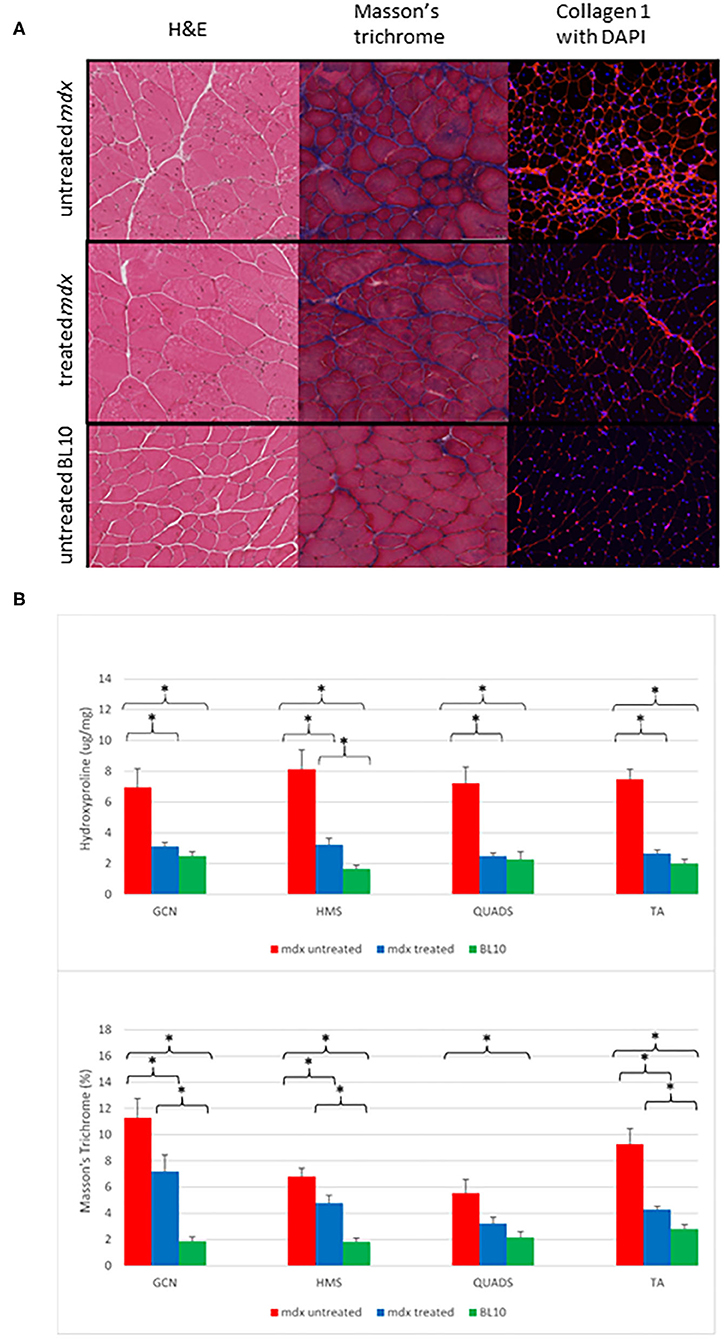
Figure 2. (A) Examples of transverse sections from gastrocnemius (GCN) muscles. The left column shows H&E staining at ×20 magnification demonstrate that the mdx mouse groups have evidence of more centrally located nuclei, varying myocyte size and areas of fibrosis (white). The middle column demonstrates Masson's trichrome staining in ×20 magnification. Fibrosis is shown as dark blue, the mdx untreated group show diffuse fibrosis throughout with the BL10 group showing very small amounts of fibrosis, the treated mdx mouse group shows fewer areas of blue staining compared to the untreated mdx group. The right column is immunofluorescent staining for collagen 1 with DAPI, areas of red are areas with collagen 1, nuclei are highlighted as blue (Magnification ×10). Similar to the Masson's trichrome staining, the untreated mdx mice have large amounts of diffuse fibrosis evident across the whole slide, with the BL10 slide only showing collagen 1 staining in the sarcolemma in an ordered fashion. The treated mdx mice demonstrate an amount of collagen staining in between these. (B) Bar charts to show the differences in ex vivo quantification of fibrosis within muscle between treated mdx, untreated mdx and BL10 groups. (A) hydroxyproline quantification, (B) MaTr quantification. Significant differences are seen between the all muscles of the untreated mdx mice and the BL10 group using bother measures of fibrosis. Using Masson's trichrome (MaTr) quantification, all muscles had significantly lower amounts of fibrosis in the treated mdx group compared to the untreated. Hydroxyproline quantification identified 3/4 of these muscles as significantly lower in the treated mdx group. Error bars represent standard error. *p < 0.05, GCN, Gastrocnemius, HMS, Hamstrings, QUADS, Quadriceps, TA, Tibialis anterior.
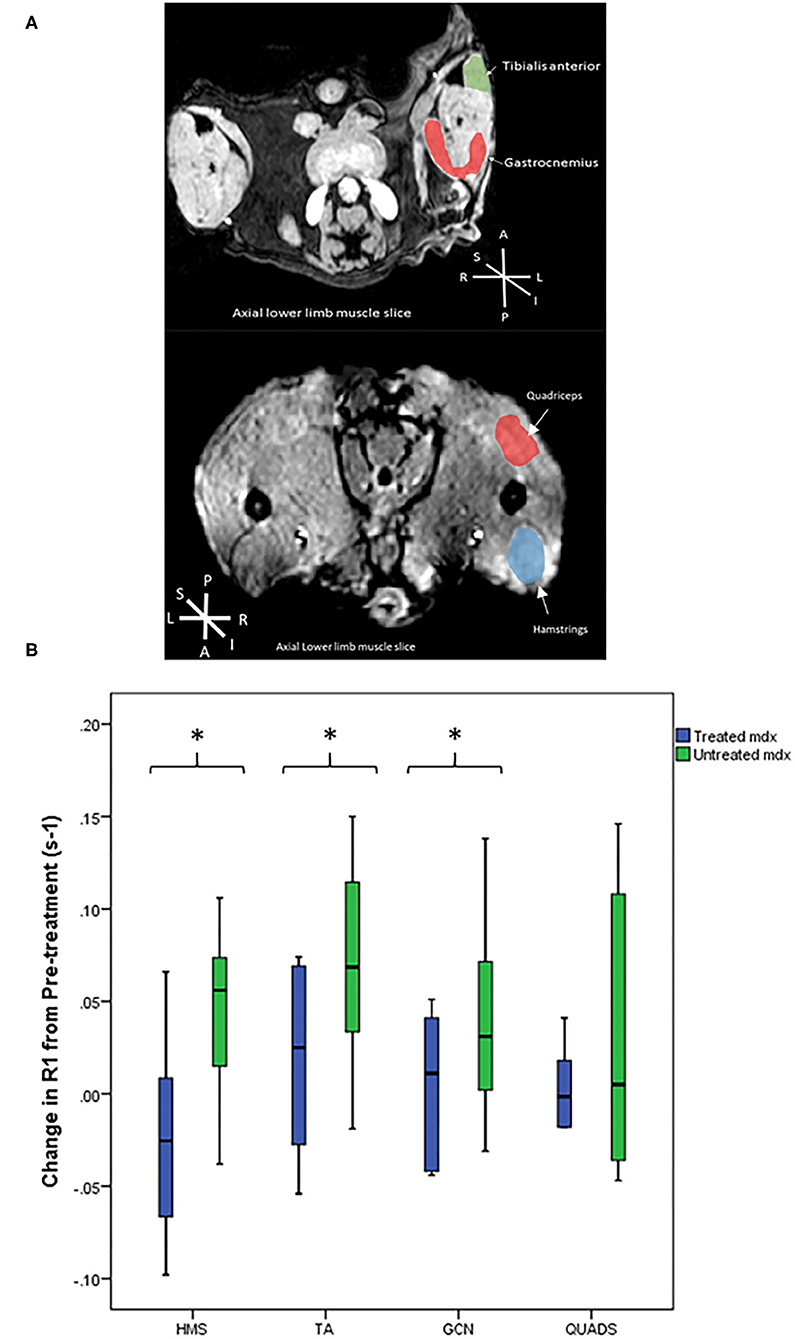
Figure 3. (A) Representative T1 weighted axial MRI scans through hind limbs with regions of interest labelled. P, posterior, A, anterior, L, left, R, right, S, superior, I, inferior. (B) Box plots to compare the difference in R1 change between the mdx groups from pre-treatment to post-treatment scans. The treated mdx mice did not show significant increases in R1 post-treatment whereas the untreated mdx group showed significant increases in R1 change over time in all three muscles: gastrocnemius p = 0.04, hamstrings p = 0.009, and tibialis anterior p = 0.01. *p < 0.05, GCN, Gastrocnemius, HMS, Hamstrings, QUADS, Quadriceps, TA, Tibialis anterior.
Functional Assessment
The mouse groups were compared using a one-way Anova test. Using the two-limb grip strength measure the untreated mdx mouse group was significantly weaker than the other groups (F = 6.08, p < 0.03). Post-hoc analysis demonstrated a significant difference between the untreated and the treated mdx mice (untreated mdx 21.5 mN/g vs. treated mdx 37.0 mN/g). There were no statistically significant differences between the BL10 groups and the treated mdx mice (p = NS).
R1 Change in EP3533 Enhanced MRI
Pre-treatment scans demonstrated no significant differences between the treated and untreated mdx mouse groups. Figure 3A shows representative T1 weighted axial MRI scans through hind limbs with regions of interest labelled. In the pre-treatment scans R1 change of all muscles were significantly higher at 60 min in the combined mdx groups than the BL10 at 60 min. These findings suggest that there was no detectable difference between the two mdx groups at baseline and that EP3533-enhanced scans were sensitive enough to discern between BL10 and mdx groups at an early age (12 weeks).
In the post-treatment scan, there were no significant differences between the untreated and treated BL10 groups in any of the muscles at any of the time points. No significant differences were seen between treated and untreated mdx groups in absolute R1 value at the post-treatment scan. When comparing the R1 change over time from pre-treatment to post-treatment scan there was a significant increase in three out of four of the muscle of the untreated mdx group (GCN p = 0.04, HMS p = 0.009, and TA p = 0.01; Table 1, Figure 3B). No significant change was seen over time in any of the muscles in the other groups.
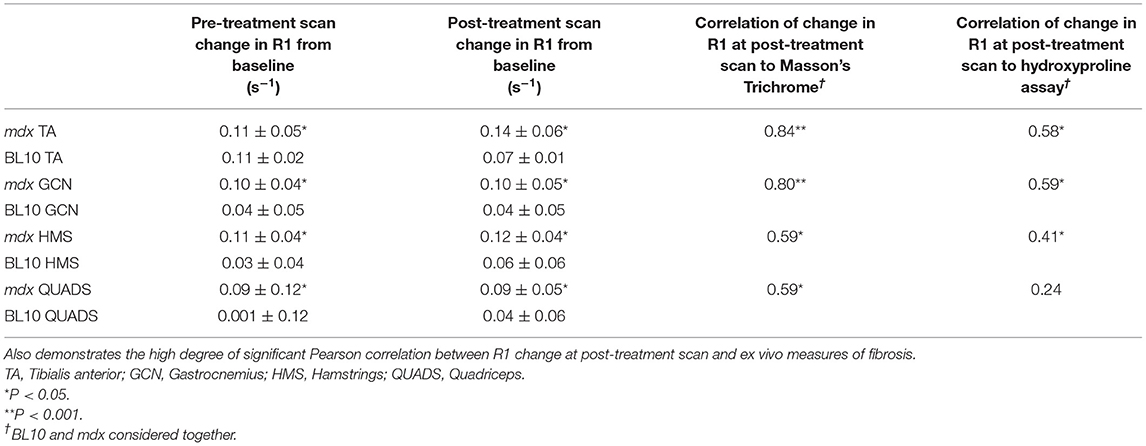
Table 1. Table to show absolute R1 change at both the pre- and post-treatment scans.
Correlation of EP3533-Enhanced MRI Findings to ex vivo Measures of Fibrosis
R1 values in all muscles at the post-treatment scan correlated significantly with Masson's trichrome (Table 1). R1 change at post-treatment correlated linearly in three out of four muscles with hydroxyproline. The strongest correlations to ex vivo measures of fibrosis were in the gastrocnemius muscle (Table 1).
Correlation of EP3533-Enhanced MRI to Functional Assessments
None of the two limb force assessments significantly correlated to the change in R1 values from the post-treatment scan, in either the individual muscles or all muscles grouped together. Considering all muscles together the change in R1 values including the pre and post-treatment scans correlated significantly, albeit weakly (r = −0.33, p = 0.004). The correlation may suggest that there is an association between R1 change at post treatment and muscle function, the lack of a strong correlation may be due to the other confounding factors that influence muscle function.
Discussion
Muscular dystrophies such as DMD are slowly progressive conditions, the histological hallmarks include inflammation, fibrosis, and fat replacement of healthy muscle. Eventually, secondary to this pathology, the muscles are unable to function and clinical weakness is evident. Clinical trial outcome measures are biomarkers of disease progression that are increasingly important to test putative therapies. In clinical trials involving neuromuscular disease the most commonly used outcome measures are assessing muscle strength and muscle function. Use of a non-invasive outcome measure based on earlier pathology provides a potentially more sensitive biomarker to disease progression over a shorter period. Such outcome measures are sorely needed as muscular dystrophies may take several years to progress clinically, this makes drug development time consuming and expensive. This is the first study to look at use of EP3533 as an outcome measure in muscular dystrophy. Previous studies have shown that EP3533-enhanced MRI can demonstrate sufficient sensitivity to fibrosis in vivo to accurately stage disease, demonstrate disease progression and quantify fibrosis in organs with low proton density (9, 10, 12–14). This study showed that EP3533 was able to demonstrate a treatment effect as well as demonstrating strong correlations with ex vivo measures of fibrosis, and a weaker correlation to a functional assessment.
Halofuginone was chosen as an anti-fibrotic as it has previously demonstrated that it can induce a reduction in collagen and an improvement of muscle function in murine models (18, 19). Halofuginone is currently being evaluated in a clinical trial (26). This study further supported the use of halofuginone to reduce fibrosis in vivo and to improve muscle function. In this experiment the mdx treated and BL10 groups were not significantly different in a number of ways including: absolute values of R1 change over time, functional assessments, and degree of ex vivo fibrosis in several muscles (Figure 3). Other anti-fibrotics have been trialled in DMD patients, though in humans factors such as fat replacement may reduce the effectiveness of these drugs (27–29). Anti-fibrotics do have the advantage of not being mutation dependent, unlike a number of recent medications aimed at increasing dystrophin production (30–32). As anti-fibrotic agents are potential drug candidates to treat muscular dystrophies, we tested if EP3533-enhanced MRI could be used as an outcome measure, as it has been shown to be successful at monitoring fibrosis progression over time in murine models. A further advantage of EP3533 is that due to the non-invasive nature of the test fewer animals would need to be sacrificed to demonstrate interim changes in experiments.
Currently the only validated way to quantify fibrosis in human skeletal muscle is via muscle biopsy (33). Muscle biopsy is invasive, risks sampling error and includes the risk of a general anaesthetic in patients with reduced respiratory function. EP3533, by contrast, has been shown to be able to measure change in skeletal muscle fibrosis over time in a relatively non-invasive manner. As seen in humans with muscular dystrophy, mdx mice demonstrate individual variation in fibrosis. This may explain why it was the change in R1 value from pre-treatment to post-treatment which demonstrated a significant difference between the treated and untreated groups rather than the absolute R1 change in the post-treatment scan alone (34, 35). This is important for future experiments using EP3533, with baseline and post treatment scans being the correct way to demonstrate change, rather than a single measurement.
Other quantitative MRI methods have been used clinically in muscular dystrophies, including native T1, T2, magnetic resonance spectroscopy, and Dixon fat fraction (FF) (36–41). In particular, FF has been shown to be a sensitive measure of disease progression. A drawback of the mdx mouse model is that it demonstrates minimal intramuscular fat replacement compared to humans with the condition. Therefore, the utility of EP3533-enhanced MRI scan would have to be compared against FF as an outcome measure. In human pathology, fat replacement eventually becomes the dominant pathology with large percentages of muscle replaced, therefore it is unknown whether EP3533-enhanced MRI is likely to be helpful in advanced disease or to be merely used alongside established biomarkers such as FF.
In murine experiments several standardised assessments have been developed to measure motor function and strength in a reliable way (25, 34, 42). External validity may be reduced due to different compensatory mechanisms employed by both species (43). Grip strength tests in rodents are most akin to quantitative muscle assessment in humans (44), with such grip assessments able to demonstrate significant differences between control and mdx mice at an early age (34). In this experiment functional results correlated significantly to R1 change (r = −0.33, p = 0.004), and demonstrated a significant difference between untreated and treated mdx groups (p < 0.001). In contrast to these results, Huebner et al. who performed halofuginone studies in mdx mice, did not report a significant difference between treated mdx mice and control in grip assessment (19). This difference may be due to the smaller group sizes used by Huebner et al. (19) (n = 5). As with functional outcome measures in humans, other factors such as cognition, stress and motivation can be confounding variables (35). In humans with DMD, quantitative MRI such as Dixon fat fraction (FF) measurement has been shown to have higher levels of correlation to the 6 min walk test (6MWT), (r = −0.65, p < 0.001), as well as other functional assessments (45–48). The correlations seen in this experiment were lower than that of FF in humans. Any future evaluation of efficacy of EP3533-induced R1 change in clinical trials should therefore be compared with functional assessments as well as MRI measures (45, 49). The relatively weak correlation between function and EP3533-induced R1 change may be due to the non-linear development of fibrosis throughout muscle, as seen in other human and murine studies (37, 50, 51).
There have been concerns around gadolinium-based contrast agents and their repeated use in humans due to potential neurotoxicity (52). Even less is known of the safety profile of peptide-based gadolinium agents which may be excreted less readily due to their complex structure. Further preclinical studies are required to provide safety data findings used to inform a future application for registration of potential human trials before this agent can be used as an outcome measure or in clinical practise.
Conclusion
As new therapies are trialled in muscular dystrophies there is great potential for EP3533 to be used as an outcome measure, adding important, quantifiable information relatively non-invasively. EP3533 can also be used to reduce animal numbers in murine experiments, allowing accurate quantification of fibrosis over time. Our study showed that EP3533-enhanced MRI can be used in a muscular dystrophy mouse model to demonstrate disease progression over time and to effectively monitor a treatment response.
Data Availability Statement
The raw data supporting the conclusions of this article will be made available by the authors, without undue reservation.
Ethics Statement
The animal study was reviewed and approved by all procedures performed were in accordance with the ethical standards of directive 2010/63/EU of the European parliament and under the auspices of the terms of the animals (scientific procedures) act 1986 and project licence PB3CA650C, authorised by the Home Secretary, Home Office, United Kingdom.
Author Contributions
All authors have contributed considerably to the design, execution of the study or to the analysis and interpretation of data, involved in drafting or critically revising the manuscript, and have read and approved its final version.
Funding
This work was supported by grants from Muscular Dystrophy UK (17GRO-PG12-0197) and from AFM-Téléthon (#20553) to VS.
Conflict of Interest
PC has equity in, and is a consultant to Collagen Medical LLC which holds the patent rights to EP-3533.
The remaining authors declare that the research was conducted in the absence of any commercial or financial relationships that could be construed as a potential conflict of interest.
References
1. Bradley D, Parsons E. Newborn screening for duchenne muscular dystrophy. Semi Neonatol. (1998) 3:27–34. doi: 10.1016/S1084-2756(98)80146-2
2. Moat SJ, Bradley DM, Salmon R, Clarke A, Hartley L. Newborn bloodspot screening for duchenne muscular dystrophy: 21 years experience in Wales (UK). Euro J Hum Genet. (2013) 21:1049–53. doi: 10.1038/ejhg.2012.301
3. Bushby K, Finkel R, Birnkrant DJ, Case LE, Clemens PR, Cripe L, et al. Diagnosis and management of duchenne muscular dystrophy, part 1: diagnosis, and pharmacological and psychosocial management. Lancet Neurol. (2010) 9:77–93. doi: 10.1016/S1474-4422(09)70271-6
4. Muntoni F, Torelli S, Ferlini A. Dystrophin and mutations: one gene, several proteins, multiple phenotypes. Lancet Neurol. (2003) 2:731–40. doi: 10.1016/S1474-4422(03)00585-4
5. Bushby K, Finkel R, Birnkrant DJ, Case LE, Clemens PR, Cripe L, et al. Diagnosis and management of duchenne muscular dystrophy, part 2: implementation of multidisciplinary care. Lancet Neurol. (2010) 9:177–89. doi: 10.1016/S1474-4422(09)70272-8
6. Klingler W, Jurkat-Rott K, Lehmann-Horn F, Schleip R. The role of fibrosis in Duchenne muscular dystrophy. Acta Myol. (2012) 31:184–95.
7. Zanotti S, Gibertini S, Mora M. Altered production of extra-cellular matrix components by muscle-derived Duchenne muscular dystrophy fibroblasts before and after TGF-β1 treatment. Cell Tissue Res. (2010) 339:397–410. doi: 10.1007/s00441-009-0889-4
8. Desguerre I, Mayer M, Leturcq F, Barbet JP, Gherardi RK, Christov C. Endomysial fibrosis in duchenne muscular dystrophy: a marker of poor outcome associated with macrophage alternative activation. J Neuropathol Exp Neurol. (2009) 68:762–73. doi: 10.1097/NEN.0b013e3181aa31c2
9. Helm PA, Caravan P, French BA, Jacques V, Shen L, Xu Y, et al. Postinfarction myocardial scarring in mice: molecular MR imaging with use of a collagen-targeting contrast agent. Radiology. (2008) 247:788–96. doi: 10.1148/radiol.2473070975
10. Fuchs BC, Wang H, Yang Y, Wei L, Polasek M, Schühle DT, et al. Molecular MRI of collagen to diagnose and stage liver fibrosis. J Hepatol. (2013) 59:992–8. doi: 10.1016/j.jhep.2013.06.026
11. Polasek M, Fuchs BC, Uppal R, Schühle DT, Alford JK, Loving GS, et al. Molecular MR imaging of liver fibrosis: a feasibility study using rat and mouse models. J Hepatol. (2012) 57:549–55. doi: 10.1016/j.jhep.2012.04.035
12. Caravan P, Yang Y, Zachariah R, Schmitt A, Mino-Kenudson M, Chen HH, et al. Molecular magnetic resonance imaging of pulmonary fibrosis in mice. Am J Respir Cell Mol Biol. (2013) 49:1120–6. doi: 10.1165/rcmb.2013-0039OC
13. Polasek M, Yang Y, Schuhle DT, Yaseen MA, Kim YR, Sung YS, et al. Molecular MR imaging of fibrosis in a mouse model of pancreatic cancer. Sci Rep. (2017) 7:8114. doi: 10.1038/s41598-017-08838-6
14. Farrar CT, DePeralta DK, Day H, Rietz TA, Wei L, Lauwers GY, et al. 3D molecular MR imaging of liver fibrosis and response to rapamycin therapy in a bile duct ligation rat model. J Hepatol. (2015) 63:689–96. doi: 10.1016/j.jhep.2015.04.029
15. Murphy AP, Greally E, O'Hogain D, Blamire A, Caravan P, Straub V. Noninvasive quantification of fibrosis in skeletal and cardiac muscle in mdx mice using EP3533 enhanced magnetic resonance imaging. Magn Reson Med. (2019) 81:2728–35. doi: 10.1002/mrm.27578
16. McGaha TL, Phelps RG, Spiera H, Bona C. Halofuginone, an inhibitor of type-I collagen synthesis and skin sclerosis, blocks transforming-growth-factor-beta-mediated Smad3 activation in fibroblasts. J Invest Dermatol. (2002) 118:461–70. doi: 10.1046/j.0022-202x.2001.01690.x
17. Barzilai-Tutsch H, Bodanovsky A, Maimon H, Pines M, Halevy O. Halofuginone promotes satellite cell activation and survival in muscular dystrophies. Biochim Biophys Acta. (2016) 1862:1–11. doi: 10.1016/j.bbadis.2015.10.007
18. Turgeman T, Hagai Y, Huebner K, Jassal DS, Anderson JE, Genin O, et al. Prevention of muscle fibrosis and improvement in muscle performance in the mdx mouse by halofuginone. Neuromuscul Disord. (2008) 18:857–68. doi: 10.1016/j.nmd.2008.06.386
19. Huebner KD, Jassal DS, Halevy O, Pines M, Anderson JE. Functional resolution of fibrosis in mdx mouse dystrophic heart and skeletal muscle by halofuginone. Am J Physiol Heart Circ Physiol. (2008) 294:H1550–61. doi: 10.1152/ajpheart.01253.2007
20. Sigma-Aldrich. Halofuginone Bromide. (2018). Available online at: https://www.sigmaaldrich.com/catalog/search?term=Halofuginone&interface=All&N=0&mode=partialmax&lang=en®ion=GB&focus=product (accessed May 8, 2018).
21. Niskanen J. Aedes a Tool for Analyzing Medical Images. (2016). Available online at: http://aedes.uef.fi/ (accessed February 1, 2016).
22. Zhang J, Zhang G, Morrison B, Mori S, Sheikh KA. Magnetic resonance imaging of mouse skeletal muscle to measure denervation atrophy. Exp Neurol. (2008) 212:448–57. doi: 10.1016/j.expneurol.2008.04.033
23. Carlson G. Determination of Hydroxyproline Content as a Measure of Fibrosis in Nondystrophic and Dystrophic Skeletal Muscle. (2014). Available online at: http://www.treat-nmd.eu/downloads/file/sops/dmd/MDX/DMD_M.1.2.006.pdf (accessed May 31, 2016).
24. UK Home Office. Mouse: Decision Tree for Blood Sampling. (2018). Available online at: https://www.nc3rs.org.uk/mouse-decision-tree-blood-sampling (accessed May 9, 2018).
25. De Luca A, Tinsley J, Aartsma-Rus A, van Putten M, Nagaraju K, de La Porte S, et al. Use of Grip Strength Meter to Assess the Limb Strength of mdx Mice. (2014). Available online at: http://www.treatnmd.eu/downloads/file/sops/dmd/MDX/DMD_M.2.2.001.pdf (accessed March 13, 2018).
26. Clinical Trials,.gov. Safety, Tolerability, Pharmacokinetics of Single Multiple Doses of HT-100 in Duchenne Muscular Dystrophy. (2018). Available online at: https://clinicaltrials.gov/ct2/show/NCT01847573 (accessed January 9, 2019).
27. Nio Y, Tanaka M, Hirozane Y, Muraki Y, Okawara M, Hazama M, Matsuo T. Phosphodiesterase 4 inhibitor and phosphodiesterase 5 inhibitor combination therapy has anti-fibrotic and anti-inflammatory effects in mdx mice with duchenne muscular dystrophy. FASEB J. (2017) 31:5307–20. doi: 10.1096/fj.201700249R
28. Zanotti S, Mora M. Test of anti-fibrotic drugs in a cellular model of fibrosis based on muscle-derived fibroblasts from duchenne muscular dystrophy patients. Methods Mol Biol. (2018) 1687:205–17. doi: 10.1007/978-1-4939-7374-3_15
29. Swiderski K, Todorov M, Gehrig SM, Naim T, Chee A, Stapleton DI et al. Tranilast administration reduces fibrosis and improves fatigue resistance in muscles of mdx dystrophic mice. Fibrogenesis Tissue Repair. (2014) 7:1. doi: 10.1186/1755-1536-7-1
30. van Deutekom JCT, Bremmer-Bout M, Janson AAM, Ginjaar LB, Baas F, den Dunnen JT, et al. Antisense-induced exon skipping restores dystrophin expression in DMD patient derived muscle cells. Hum Mol Genet. (2001) 10:1547–54. doi: 10.1093/hmg/10.15.1547
31. McDonald CM, Campbell C, Torricelli RE, Finkel RS, Flanigan KM, Goemans N, et al. Ataluren in patients with nonsense mutation duchenne muscular dystrophy (ACT DMD): a multicentre, randomised, double-blind, placebo-controlled, phase 3 trial. Lancet. (2017) 390:1489–98. doi: 10.1016/S0140-6736(17)31611-2
32. Voit T, Topaloglu H, Straub V, Mutoni F, Deconinck N, Campion G, et al. Safety and efficacy of drisapersen for the treatment of duchenne muscular dystrophy (DEMAND II): an exploratory, randomised, placebo-controlled phase 2 study. Lancet Neurol. (2014) 13:987–96. doi: 10.1016/S1474-4422(14)70195-4
33. Sardone V, Ellis M, Torelli S, Feng L, Chambers D, Eastwood D et al. A novel high-throughput immunofluorescence analysis method for quantifying dystrophin intensity in entire transverse sections of duchenne muscular dystrophy muscle biopsy samples. PLoS ONE. (2018) 13:e0194540. doi: 10.1371/journal.pone.0194540
34. Spurney CF, Gordish-Dressman H, Guerron AD, Sali A, Pandey GS, Rawat R, et al. Preclinical drug trials in the mdx mouse: assessment of reliable and sensitive outcome measures. Muscle Nerve. (2009) 39:591–602. doi: 10.1002/mus.21211
35. Grounds MD, Radley HG, Lynch GS, Nagaraju K, De Luca A. Towards developing standard operating procedures for pre-clinical testing in the mdx mouse model of duchenne muscular dystrophy. Neurobiol Dis. (2008) 31:1–19. doi: 10.1016/j.nbd.2008.03.008
36. Barnard AM, Willcocks RJ, Finanger EL, Daniels MJ, Triplett WT, Rooney WD, et al. Skeletal muscle magnetic resonance biomarkers correlate with function and sentinel events in duchenne muscular dystrophy. PLoS ONE. (2018) 13:e0194283. doi: 10.1371/journal.pone.0194283
37. Arpan I, Forbes SC, Lott DJ, Senesac CR, Daniels MJ, Triplett WT et al. T2 mapping provides multiple approaches for the characterization of muscle involvement in neuromuscular diseases: a cross-sectional study of lower leg muscles in 5–15-year-old boys with duchenne muscular dystrophy. NMR Biomed. (2012) 26:320–28. doi: 10.1002/nbm.2851
38. Carlier PG, Marty B, Scheidegger O, de Sousae PL, Baudinf PY, Snezhkoc E, et al. Skeletal muscle quantitative nuclear magnetic resonance imaging and spectroscopy as an outcome measure for clinical trials. J Neuromuscul Dis. (2016) 3:1–28. doi: 10.3233/JND-160145
39. Fatehi F, Salort-Campana E, Le Troter A, Lareau-Trudel E, Bydder M, Foure' A, et al. Long-term follow-up of MRI changes in thigh muscles of patients with facioscapulohumeral dystrophy: a quantitative study. PLoS ONE. (2017) 12:e0183825. doi: 10.1371/journal.pone.0183825
40. Murphy AP, Morrow J, Dahlqvist JR, Stojkovic T, Willis TA, Sinclair CDJ, et al. Natural history of limb girdle muscular dystrophy R9 over 6 years: searching for trial endpoints. Ann Clin Transl Neurol. (2019) 6:1033–45. doi: 10.1002/acn3.774
41. Yin L, Xie Z-y, Xu H-y, Zheng SS, Wang ZX, Xiao JX, et al. T2 mapping and fat quantification of thigh muscles in children with duchenne muscular dystrophy. Curr Med Sci. (2019) 39:138–45. doi: 10.1007/s11596-019-2012-8
42. Treat NMD. TREAT NMD: Experimental Protocols for DMD Animal Models. (2016). Available online at: http://www.treat-nmd.eu/research/preclinical/dmd-sops/ (accessed January 8, 2019).
43. Hu X, Charles JP, Akay T, Hutchinson JR, Blemker SS. Are mice good models for human neuromuscular disease? Comparing muscle excursions in walking between mice and humans. Skeletal Muscle. (2017) 7:26. doi: 10.1186/s13395-017-0143-9
44. McDonald CM, Henricson EK, Abresch RT, Florence JM, Eagle M, Gappmaier E, et al. The 6 minute walk test and other endpoints in Duchenne muscular dystrophy: Longitudinal natural history observations over 48 weeks from a multicenter study. Muscle Nerve. (2013) 48:343–56. doi: 10.1002/mus.23902
45. Fischer D, Hafner P, Rubino D, Schmid M, Neuhaus C, Jung H, et al. The 6-minute walk test, motor function measure and quantitative thigh muscle MRI in Becker muscular dystrophy: a cross-sectional study. Neuromusc Disord. (2016) 26:414–22. doi: 10.1016/j.nmd.2016.04.009
46. Wokke BH, van den Bergen JC, Versluis MJ, Niks EH, Milles J, Webb AG, et al. Quantitative MRI and strength measurements in the assessment of muscle quality in Duchenne muscular dystrophy. Neuromusc Disord. (2014) 24:409–16. doi: 10.1016/j.nmd.2014.01.015
47. Willcocks RJ, Rooney WD, Triplett WT, Forbes SC, Lott DJ, Senesac CR, et al. Multicenter prospective longitudinal study of magnetic resonance biomarkers in a large duchenne muscular dystrophy cohort. Ann Neurol. (2016) 79:535–47. doi: 10.1002/ana.24599
48. Willcocks RJ, Triplett WT, Forbes SC, Arora H, Senesac CR, Lott DJ et al. Magnetic resonance imaging of the proximal upper extremity musculature in boys with duchenne muscular dystrophy. J Neurol. (2017) 264:64–71. doi: 10.1007/s00415-016-8311-0
49. Akima H, Lott D, Senesac C, Deol J, Germain S, Arpan I, et al. Relationships of thigh muscle contractile and non-contractile tissue with function, strength, and age in boys with duchenne muscular dystrophy. Neuromusc Disord. (2012) 22:16–25. doi: 10.1016/j.nmd.2011.06.750
50. Vohra R, Batra A, Forbes SC, Vandenborne K, Walter GA. Magnetic resonance monitoring of disease progression in mdx mice on different genetic backgrounds. Am J Pathol. (2017) 187:2060–70. doi: 10.1016/j.ajpath.2017.05.010
51. Gutpell KM, Hrinivich WT, Hoffman LM. Skeletal muscle fibrosis in the mdx/utrn+/− mouse validates its suitability as a murine model of duchenne muscular dystrophy. PLoS ONE. (2015) 10:e0117306. doi: 10.1371/journal.pone.0117306
Keywords: EP3533, muscular dystrophy, fibrosis, magnetic resonance image, mdx mouse model
Citation: Murphy AP, Greally E, O'Hogain D, Blamire A, Caravan P and Straub V (2021) Use of EP3533-Enhanced Magnetic Resonance Imaging as a Measure of Disease Progression in Skeletal Muscle of mdx Mice. Front. Neurol. 12:636719. doi: 10.3389/fneur.2021.636719
Received: 01 December 2020; Accepted: 12 May 2021;
Published: 17 June 2021.
Edited by:
Anna Pichiecchio, Neurological Institute Foundation Casimiro Mondino (IRCCS), ItalyReviewed by:
Jill Rafael-Fortney, The Ohio State University, United StatesRussell G. Rogers, Cedars-Sinai Medical Center, United States
Heinrich Brinkmeier, Universitätsmedizin Greifswald, Germany
Copyright © 2021 Murphy, Greally, O'Hogain, Blamire, Caravan and Straub. This is an open-access article distributed under the terms of the Creative Commons Attribution License (CC BY). The use, distribution or reproduction in other forums is permitted, provided the original author(s) and the copyright owner(s) are credited and that the original publication in this journal is cited, in accordance with accepted academic practice. No use, distribution or reproduction is permitted which does not comply with these terms.
*Correspondence: Volker Straub, Vm9sa2VyLnN0cmF1YkBuZXdjYXN0bGUuYWMudWs=