
94% of researchers rate our articles as excellent or good
Learn more about the work of our research integrity team to safeguard the quality of each article we publish.
Find out more
REVIEW article
Front. Neurol., 28 April 2021
Sec. Applied Neuroimaging
Volume 12 - 2021 | https://doi.org/10.3389/fneur.2021.632307
This article is part of the Research TopicMulti-Modal Imaging in Neurological Conditions: Translational ApplicationsView all 9 articles
 Kuntal Sen1
 Afrouz A. Anderson2Matthew T. Whitehead3
 Andrea L. Gropman1* on behalf of the Children's National Medical Center
The urea cycle disorders (UCD) are rare genetic disorder due to a deficiency of one of six enzymes or two transport proteins that act to remove waste nitrogen in form of ammonia from the body. In this review, we focus on neuroimaging studies in OTCD and Arginase deficiency, two of the UCD we have extensively studied. Ornithine transcarbamylase deficiency (OTCD) is the most common of these, and X-linked. Hyperammonemia (HA) in OTCD is due to deficient protein handling. Cognitive impairments and neurobehavioral disorders have emerged as the major sequelae in Arginase deficiency and OTCD, especially in relation to executive function and working memory, impacting pre-frontal cortex (PFC). Clinical management focuses on neuroprotection from HA, as well as neurotoxicity from other known and yet unclassified metabolites. Prevention and mitigation of neurological injury is a major challenge and research focus. Given the impact of HA on neurocognitive function of UCD, neuroimaging modalities, especially multi-modality imaging platforms, can bring a wealth of information to understand the neurocognitive function and biomarkers. Such information can further improve clinical decision making, and result in better therapeutic interventions. In vivo investigations of the affected brain using multimodal neuroimaging combined with clinical and behavioral phenotyping hold promise. MR Spectroscopy has already proven as a tool to study biochemical aberrations such as elevated glutamine surrounding HA as well as to diagnose partial UCD. Functional Near Infrared Spectroscopy (fNIRS), which assesses local changes in cerebral hemodynamic levels of cortical regions, is emerging as a non-invasive technique and will serve as a surrogate to fMRI with better portability. Here we review two decades of our research using non-invasive imaging and how it has contributed to an understanding of the cognitive effects of this group of genetic conditions.
The urea cycle disorders (UCD) are rare disorders due to a deficiency of the enzymes or transport proteins that remove ammonia from the body (Figure 1). There are six enzyme deficiencies and two carrier defects that make up this group of conditions (1). The overall prevalence of the UCD is 1/35,000 which range from the more common Ornithine transcarbamylase deficiency (OTCD), an X-linked inborn error of metabolism (~1 in 56,500) to the least common being Arginase deficiency (~1:350,000 and 1:1,000,000). The remainder of the UCD, including arginase deficiency, are autosomal recessive. The UCD collectively are defined by a condition of protein intoxication (2). Arginase deficiency presents predominantly with a spastic paraplegia or quadriplegia. Late-onset UCD can present any time after the first 6 weeks of life and sometimes, for the first time in adulthood. Because many adult physicians are not familiar with the UCD, and because the clinical presentation may mimic other conditions that also present with acute confusional states or psychosis, they may be difficult to diagnose, if at all. The triggers of adult disease may be brought on by various metabolic stressors such as chronic starvation, gastric bypass surgery, rapid weight loss, and changes in diet with protein loading (3), or the postpartum period in addition to illness and certain medications (4–14). Since OTCD is X linked, female OTCD heterozygotes may show great variability in symptoms ranging from asymptomatic to significant clinical symptoms. It has been estimated that 5–20% of females ultimately develop symptoms however study of this group has shown that they manifest a similar albeit milder picture on magnetic resonance spectroscopy (MRS), diffusion tensor imaging (DTI), and cognitive testing (15).
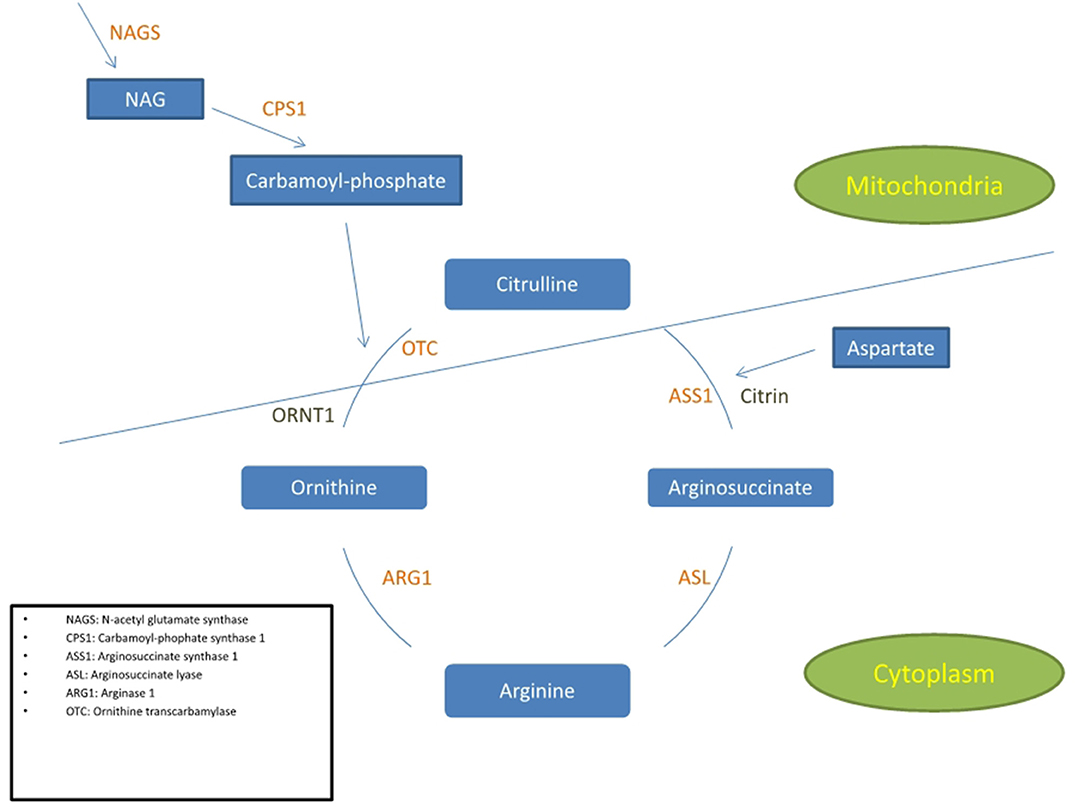
Figure 1. Simplified diagram of the urea cycle indicating the 6 enzymes and 2 transporters associated with UCD. The cycle is partly in the cytoplasm and partly in the mitochondria. The 3 enzymes positioned in the inner mitochondrial membrane are NAGS, CPS1, and OTC.
While the brain may sustain the most impact from elevated ammonia, recent clinical observations has shown that the liver and kidney may be impacted in UCDs (16). Early and ongoing work in hepatic encephalopathy (HE) has laid the groundwork for knowledge of the impact of ammonia in the brain (17). Whereas, in HE, where the urea cycle enzymes are indiscriminately impacted due to liver cirrhosis which destroys the urea cycle enzymes by destruction of liver tissues, UCD are caused by selective enzyme deficiency.
Prior to 2004, the survival rate of patients with a UCD was 10% (unpublished data, Urea Cycle Rare Disease Consortium natural history study). Those who survived had significant neurological morbidity (18). Follow up neuroimaging studies in survivors of neonatal coma shows hypomyelination, leukodystrophy, myelination delay, and cystic changes as well as gliosis of the deep gray matter nuclei (19–25). Although UCD lead to significant encephalopathy, it was rare prior to 2005, that a patient had neuroimaging to understand the impact of HA on neurological function. After a government mandate, the rare disease clinical research network (RDCRN) was formed and the urea cycle rare disorders consortium (UCDC) was born. This allowed a deep dive into the function of UCD patients in a longitudinal manner and allowed a critical evaluation of therapies and neurocognitive outcomes. Currently with the development of newer therapies and improved clinical care, patients are living into adulthood. However, as patients live longer, they are noted to manifest varying degrees of neurocognitive difficulties particularly in the areas of working memory and attention, elements of executive function (26–30). We now understand that the downstream effects of HA and other toxic metabolites but quantification of these effects on cognitive performance during daily life activities is still unknown. How to prevent or mitigate these outcomes is a major challenge. No correlation exists between age of onset, genotype, peak ammonia level, neuroimaging, and/or phenotype. However, generally, degree of HA and its duration and the age of onset are predictive of outcome (31–35). Normal Intelligent Quotient (IQ) can occur after a hyperammonemic event although accumulating damage results in impairments that are irreversible (34–37).
The mechanism of ammonia induced neuropathology in UCD is not known. Accumulations of both ammonia and glutamate lead to toxic effects upon the brain. Glutamate is the main excitatory neurotransmitter and its sustained accumulation may be a causative mechanism of neuronal degeneration in a variety of neurological disorders (38). In animal models, the HA leads to excitotoxic cell death that eventually leads to the loss of NMDA receptors (39). In the OTCD sparse fur (Spf) mouse model, NMDA receptor is disrupted (40). The effects of Hyperammonemia and glutamate are astrocyte swelling (41, 42), seizures (28), increased permeability of the blood brain barrier, disrupted energy due to depletion of intermediaries of metabolism (29, 43), and altered levels of neurotransmitter and amino acid (44, 45).
As neuroimaging technologies have become more sophisticated and accessible, the UCDC and others sought to use this non-invasive technology to understand the implications of HA on the brain. There is no one single MRI modality that allows a total appreciation of the entire picture of neurological damage OTCD. Therefore, multimodal brain imaging studies create a unique opportunity by providing a wealth of information and comprehensive framework to understand the brain and its injury pattern with each studied disorder. Longitudinal or cross-sectional imaging data have been reported in several adult onset degenerative conditions such as Parkinson disease, Alzheimer disease, and multiple sclerosis (46–48).
The traditional analysis in imaging has been to use Independent component analysis (ICA) (49) which serves as a general-purpose statistical model. One problem is that the estimated independent components might not be reliable and does not consider weighting of the components that may be more important. The goal is to extract the full complementary information each modality can provide to an understanding of the pathology (50). Combined Neuroimaging data from multiple imaging modalities can overcome the incomplete information from only individual modalities (50). Combination of methods such as electroencephalogram (EEG) that measures the neural electrical activity with that of fMRI and fNIRS that measure the hemodynamic response can provide complementary information about neurocognitive function and has shown to be effective in increasing the accuracy in seizure detection and classification (51, 52). Correlation analysis is used to find the association between several measurements such as electrophysiological activities using EEG and structural connectivity using DTI (53). Joint independent component analysis (jICA) is another multivariate method that allows combination of features from different modalities such as MRI and PET or fMRI and structural MRI to investigate the covariation across several datasets (54, 55). Classification techniques such as support vector machine (SVM) have also been used in biomarker identification of major depressive disorders using structural MRI measurement and diffusion MRI (dMRI) (56).
Merging information from different imaging modalities requires specialized post-processing tools that can merge data from the various modalities. One must consider that the image space of all meaningful measured qualities will likely vary for each imaging modality. One must determine how to combine the complementary features of each modality and what these are. This could be defined in terms of the underlying pathophysiology or in terms of a spatial and/or temporal resolution. There should be an added benefit in doing this vs. compared to analyzing and interpreting each dataset separately and independently from one another. An example of how this may work may involve the collection of diffusion tensor imaging (DTI), functional magnetic resonance imaging (fMRI), magnetic resonance spectroscopy (MRS), and functional near infrared spectroscopy (fNIRS) in ornithine transcarbamlyase deficiency (OTCD), one of the UCDs. Each of these modalities measures a different potential biomarker of an aspect of the disease fMRI and fNIRS measure the dynamics of the hemodynamic response based on neuronal activity during a task (57). Compared to fNIRS, fMRI can measure the hemodynamic response at depth of the brain, whereas fNIRS can measure the response at the cortical regions. The advantage of fNIRS is being portable and wearable as well as being less prone to motion artifact compared to fMRI. DTI can measure white matter integrity and structural connectivity (58). MRS can probe important information about metabolites that may be altered in relation to the disease (59).
Magnetic resonance imaging has played the major rule in neuroimaging studies. This technique uses the magnetic field along with radio frequency waves to generate the image of the brain. The setup for MRI based technique include the tube-shape magnets, where patients lie inside the tube. Each MRI modality contributes to an understanding of some aspect of the pathology in UCD. MRI in late onset UCD patients shows diffuse cerebral edema and white matter lesions (60). Other MRI findings may include signal intensity increase in the regions of frontal lobes, cingulate gyri, temporal lobes, as well as the insular regions (60). Many patients may have a normal MRI with changes that appear after an acute hyperammonemic episode (61).
Early in the course of HA, the MRI may be normal, and the only abnormal finding may be an elevated glutamine peak (gln) on MRS. MRS can detect elevated brain gln levels that is helpful in detection of subtle variations in OTCD females (59). Early diagnosis is critical to instituting ammonia lowering therapies, thus where available, 1HMRS adds typically 5–10 extra min to conventional MRI and can help in expediting diagnosis for partial or atypical OTCD when biochemical and molecular confirmation can take up to several days and weeks, respectively, and provides complementary information that can lead to early diagnosis (61) (Figure 2). At our institution, modern neuroimaging techniques play a role in clinical monitoring and clinical decision making.
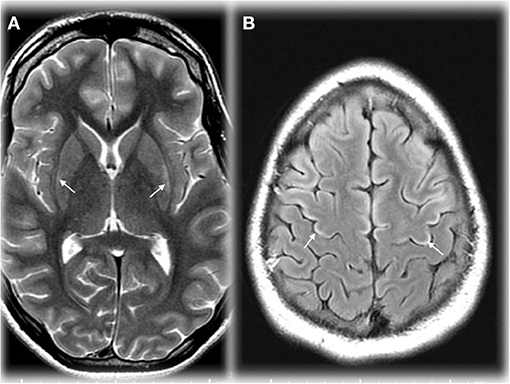
Figure 2. Axial T2 weighted image (TR/TE ms, 4,228/98) through the basal ganglia (A) demonstrating maximal changes in signal in the lateral putamen in an adolescent in OTCD after HA. Axial T2 FLAIR image (IT/TR/TE ms, 2,250/10,000/144) at the cerebral vertex (B) showing cortical hyperintensity in parts of the frontal lobes (motor strip, arrows). Reprinted from, with permission from IOS Press. Sen et al. (62).
DTI provides information regarding white matter tract such as its axonal density, myelination, and fiber orientation based on rate of diffusion of water molecules. Such information can be used to investigate the brain pathology in much greater detail than MRI. Given the normal early findings in patients with HA and those at baseline, we demonstrated that DTI is more sensitive in detecting white matter abnormalities in patients with OTCD that were normal-appearing using T2-weighted imaging (58). The extent of white matter abnormality also correlated with cognitive deficits, as we demonstrated key areas of difference underlie pathways important in executive function. The location of the frontal white matter deficits correlates with networks related to attention, executive function, and working memory that show deficiencies in this patient population (63). Specific details of imaging deserve mention. MRI may be normal by T1 and T2 early in the course of disease or with a short duration of HA. A predilection for diffusion signal changes in the insular and peri insular regions, occipital lobe, temporal lobe, basal ganglia, parietal lobe, and dorsal thalamus have been reported (64). DTI has been useful and informative in arginase deficiency (see section Neonatal Onset Urea Cycle Disorders).
1HMRS produces metabolic spectra in a volume of cerebral tissue (voxel). This technique is based on analyzing the MR signal intensity at various frequencies induced by tissue chemical environment. MRS can therefore be used for tissue characterization such as studying the concentration of metabolites. A characteristic MRS HE profile as described by Cordoba et al. (65) showed an increase in the glutamine/glutamate level while indicating a decreased level of choline and myoinositol, in compensation for glutamine osmotic power.
In vivo 13C spectroscopy is a method of MRS that can allow study of metabolic fluxes in brain (65–67). This requires infusing highly enriched 13-carbon substrates (acetate or glucose) along with complete proton decoupling that results in carbon signal enhancement by removing proton splitting. We explored the feasibility and safety of using 13C MRS on the frontal lobe of patients with OTCD as a proof of concept to evaluate low power direct detection of 13C enriched glutamate, glutamine, and bicarbonate to explore disorders of glutamine and glutamate neurotransmission and oxidative metabolism of frontal brain based disorders (68). Our group, furthermore, went on to use this method to determine turnover rate of cerebral glutamate in OTCD (69).
In several recent reports, fNIRS has been used as a surrogate to fMRI imaging. fNIRS uses light in near infrared (NIR) range (700–900 nm) that is sensitive to changes of oxy-hemoglobin and deoxy-hemoglobin to probes the cortical regions. Typical fNIRS setup uses the pairs of sources and detector to send and detect the changes in the light intensity, respectively. Since the blood absorbs the light in the NIR region, the detected changes in the light intensity are correlated with the cortical hemodynamic due to neurovascular coupling. Therefore, the fNIRS measurements are like that of the fMRI Blood Oxygenation Level Dependent (BOLD) signal. The system is wearable, where the array of sources and detectors in the shape of cap or headband are worn on the head. Advantages of this methodology are its portability and the fact that it avoids the claustrophobia of the MRI scanner which limits imaging young, cognitively impaired and claustrophobic patients and imaging can be done in realistic setting (70, 71). Another apparent benefit in this group is the fact that it is not degraded by movement. fNIRS therefore can be used to advantage in research on infants or more cognitively impaired individuals (71, 72).
fNIRS assesses local changes in cerebral hemodynamic levels of cortical regions associated with brain activity. Compared fMRI and positron emission tomography (PET), fNIRS has better temporal resolution (72, 73) and unlike PET it is non-invasive (Figure 3).
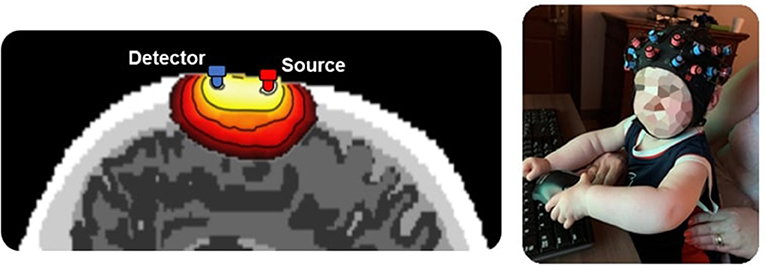
Figure 3. Left – A diagram of near infrared light probing from location of source through cortical region. Light intensity that is backscattered is measured by a detector. Changes in the light intensity as measured by the detector will be converted to changes in oxy-hemoglobin and deoxy-hemoglobin. Right – Several combinations of sources and detectors are used to cover the cortical regions.
As a distal UCD defect, arginase deficiency most commonly presents in childhood or adulthood with spasticity, cognitive impairment, and/or seizures, and less commonly, acute encephalopathy (63, 74, 75). Structural brain abnormalities are non-specific and include variable atrophy, deep and/or subcortical cerebral white matter hyperintense lesions on T2WI, and reduced fractional anisotropy in the corticospinal tracts (63, 74–80). Mild striatal lesions may be present (63, 77). These changes may reflect arginase induced, NOS-mediated oxidative damage (63). Furthermore, putaminal T1 shortening can occur (77). In the later onset forms, MRS may be normal or show mild changes including arginase elevation at 3.8 ppm, elevated glutamine, and decreased myoinositol. Rarely, arginase deficiency (63, 80) can present earlier with hyperammonemic induced encephalopathy; in those cases, MRI findings are similar to those of proximal UCD including cerebral swelling/edema which may spare the thalami (80). Reduced diffusion may occur in the sub-insular and other subcortical white matter and capsules during active injury (80). Severe injury can even lead to multifocal cystic encephalomalacia (81). MRS in early onset arginase deficiency shows changes like those of early onset proximal UCD. Namely, elevated glutamine and glutamate and decreased myoinositol secondary to hyperammonemia (80).
We documented marked depletion of myoinositol in asymptomatic and symptomatic subjects with partial OTCD relative to age matched controls as well as elevations of gln (59) (Figure 4). We therefore believe that these parameters will prove to be solid indicators of the effect of HA on brain metabolism and will predict the response to therapy. The classic triad in proximal UCD (Carbamoyl Phosphate Synthetase I deficiency and OTCD) consists of elevated glutamine peak with reduced myoinositol and choline peaks. In Arginase deficiency, glutamine peak is elevated followed by normal myoinositol and normal or increased choline. Based on our unpublished data, increased guanidino peaks are observed in Arginosuccinate Synthetase and Arginosuccinate Lyase deficiency (unpublished data, Urea Cycle Rare Disease Consortium).
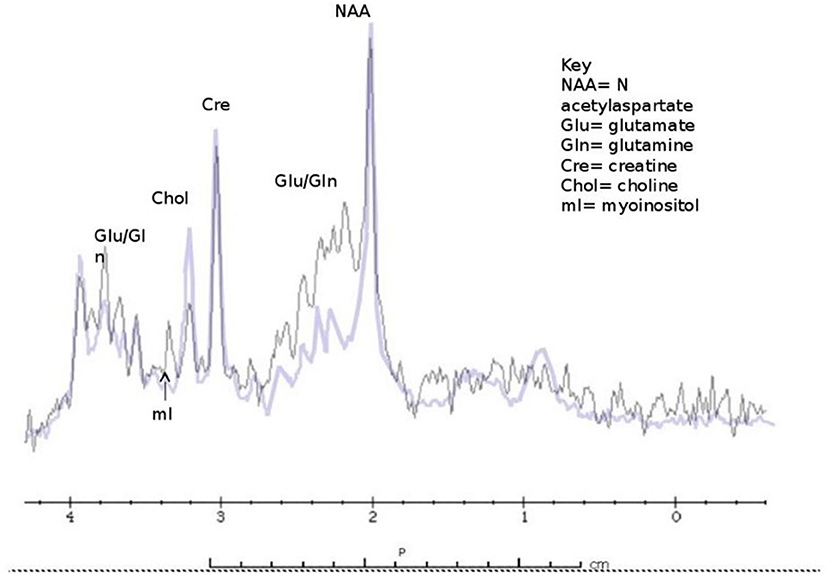
Figure 4. Classic findings of 1H MRS in OTCD - elevated glutamine peak with reduced myoinositol and choline and peaks (purple) compared to normal subject (black).
Neonatal brain MRI interpretation is predicated on knowledge of the patient's corrected gestational age, symptoms (type, onset, and duration), and whether other mimics such as ischemia and infection have been excluded clinically. Neonatal onset UCD related hyperammonemia causes variable brain edema/injury that tends to correlate with severity and duration, but not with the underlying defect. As the clinical severity increases, lesional location progresses from regional to diffuse in the following manner: periinsular, frontal, parietal, temporal, then occipital lobes (62). This results in two main neuroimaging patterns of neonatal onset UCD: (1) diffuse and (2) central. The more severe diffuse pattern involves the cerebral cortex and basal ganglia extensively, and occasionally, the thalami and brainstem rendering it indistinguishable from hypoxic-ischemic encephalopathy (HIE) and encephalitis (62). Typically, infants with diffuse cerebral involvement had higher plasma glutamine levels and worse neurological outcomes (62). The central pattern is more specific to UCD based on selective vulnerability of brain tissue. This signature appearance includes symmetric edema (vasogenic, cytotoxic, and intramyelinic) in the insular/periinsular, sylvian/perisylvian, perirolandic, and basal ganglia regions (62). Importantly, the thalami are typically spared which helps exclude HIE. Diffusion abnormality extent (diffuse cortical and/or striatal) trends negatively with prognosis (82) (Figure 5). However, not much is known about the expected duration of diffusion abnormalities in and after a hyperammonemic event which may be mechanistically different from those of hypoxic ischemic injury. Laminar necrosis rapidly develops with hyperintense signal on T1 weighted image (T1WI) in the involved cortex in subacute injury. Chronic injury shows encephalomalacia, gliosis, myelination disturbance, and sometimes, cystic necrosis. During metabolic decompensation, MRS shows increased glutamine and glutamate, decreased myoinositiol, and in severe cases, lactate.
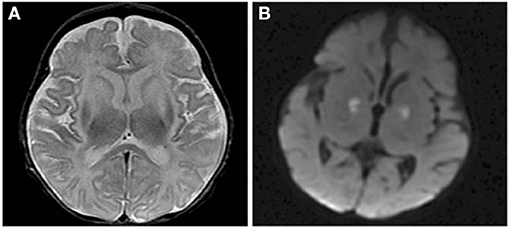
Figure 5. Axial T2 (A) and diffusion brain MR (B) images through the basal ganglia from a 13 day old female with CPSD1 deficiency. Symmetric basal ganglia and insular cortex hyperintensity reflects edema and laminar necrosis in the setting of subacute hyperammonemic injury. Reduced diffusion in the globi pallidi may represent more acute injury due to secondary energy failure or subacute pre-wallerian degeneration.
fNIRS is ideal to evaluate brain activity in inborne error of metabolism at baseline and during recovery of an acute metabolic event. Our prior fMRI experience in OTCD demonstrated altered brain networks in areas underlying executive function in frontal lobbe (83). We expected fNIRS to provide a sensitive measure of cortical hemodynamics. Using fNIRS, we measured the cortical activation of the pre-frontal cortex (PFC) while participants performed a Stroop task. We showed that in control participants left PFC had higher task related activation compared to patients with OTCD (F(1, 27) = 6.15, p = 0.02). In subjects with OTCD, we further demonstrated a significant correlation between cortical activation in left and right pre-frontal cortex (PFC), where patients with OTCD showed bilateral increase in PFC activation (r = 0.62, p = 0.01) but such trend was not observed in control subjects (r = 0.23, p = 0.42) (57) (Figure 6).
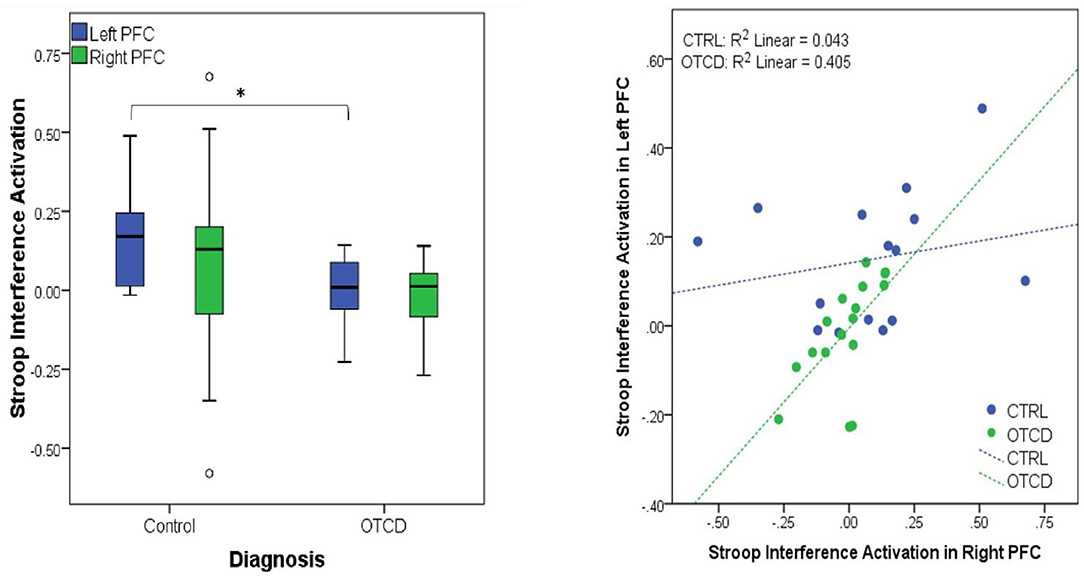
Figure 6. (Left) Significant activation difference between controls and participants with OTCD in Left PFC. (Right) Significant correlation between left and right PFC in OTCD participants (https://www.sciencedirect.com/science/article/abs/pii/S1096719219307310).
Although there are several reports of multimodal MRI at baseline or during acute HA, less is known about the recovery of HA with regard to changes in time and space. A prospective multimodal sequence of an OTCD patient with MRI/MRS exams performed during (5 over 1 month) and after (3 and 5 months) a hyperammonemic episode demonstrated abnormal signal changes in the posterolateral putamen, and supplemental motor strip (SMA), pre-motor cortex, and post-central gyrus (61). This occurred with cerebral hypoperfusion evolving to hyperperfusion. Apparent diffusion coefficient values increased while fractional anisotropy decreased in key areas such as cingulum corpus, callosum, and projectional fibers which correlated with reduction in volume of white matter fibers on tractography (Figure 7). Elevated glutamine and reduced myoinositol were present during HA on MRS. Chronic imaging changes reflecting permanent injury were found long after the apparent clinical resolution despite normal ammonia and plasma glutamine levels (61). This is not surprising since many patients report residual neurocognitive slowing following HA recovery. This study demonstrated the long-term effects and altered structural and metabolic sequence despite resolution of plasma markers of altered metabolism (61).
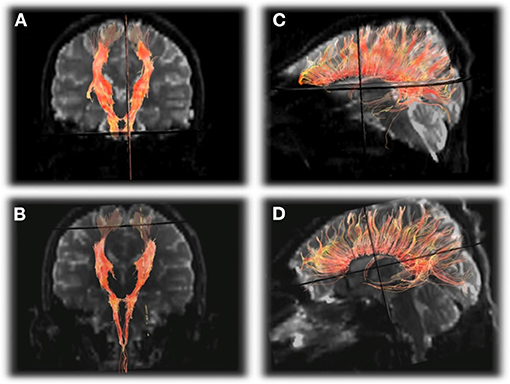
Figure 7. DTI tractography of the corticospinal tracts displayed in the anterioroposterior plane (A,B) and corpus callosum displayed laterally (C,D) from the first exam (A,C) and final exam (B,D) showing subtle decrease in the number of projectional and commissural fibers over time. Reprinted from, with permission from IOS Press. Sen et al. (62).
The goal of UCD therapy is to decrease morbidity of the brain, understanding its impact on injury pattern, time course and evolution to frame treatment and long-term monitoring in patients. Injuries to the native pathways, and/or development of an additional accessory pathway can arise differential neural networks. More quantitative features such as axonal integrity and microscopic features of myelination are best evaluated using DTI and DWI, instead of T1 and T2 weighted changes in white matter that can detect a macroscopic amount of damage.
This manuscript reviews two decades of our work encompassing multi modal neuroimaging in UCD and provides a glimpse into the future techniques which will help to further delineate our understanding of this group of disorders. Information ranging from alterations in structure (T1/T2/FLAIR) to fluctuations in metabolites (1H and 13CMRS) have led to unraveling of disease pathophysiology, helped in expediting diagnosis as well as monitoring effects of therapeutic interventions. Imaging attributes have helped in expanding the clinical spectrum and distinguishing between partial and complete enzyme deficiencies, OTCD hemizygotes and heterozygotes as well as proximal and distal UCD. Modalities which elucidate dynamic neural activity such as EEG, fMRI, and fNIRs, when combined with tractography and perfusion studies can provide unprecedented insights and broaden the cognitive phenotypes associated with these neurometabolic disorders. Multimodality studies, such as combined fNIRS, EEG, and fMRI can provide information about hemodynamic and electrical neural activity to further clarify the underlying neurocognitive function and its impairments in UCD. Addition of machine learning methods to these modalities can facilitate clinical decision making and finding the neural signatures of UCD. Studying these temporal events in the central nervous system of patients with UCD has identified the different signature patterns of HA and can be used as a model for neuroimaging research in other inborn errors of metabolism.
KS and AA wrote sections of the manuscript and edited the manuscript. MW wrote sections of the manuscript, supplied figures, and edited the manuscript. AG conceptualized the manuscript, acquired data that is referenced in the manuscript, wrote the first draft, and edited all subsequent drafts. All authors contributed to the article and approved the submitted version.
The Urea Cycle Disorders Consortium (UCDC; U54HD061221) is a part of the National Institutes of Health (NIH) Rare Disease Clinical Research Network (RDCRN), supported through collaboration between the Office of Rare Diseases Research (ORDR), the National Center for Advancing Translational Science (NCATS), and the Eunice Kennedy Shriver National Institute of Child Health and Human Development (NICHD). The Urea Cycle Disorders Consortium is also supported by the O'Malley Foundation and the Kettering Fund.
The authors declare that the research was conducted in the absence of any commercial or financial relationships that could be construed as a potential conflict of interest.
We would specifically like to acknowledge feedback from NICHD science officer Tracy King.
DTI, Diffusion tensor imaging; fMRI, functional Magnetic resonance imaging; fNIRS, Functional Near Infrared Spectroscopy; gln, glutamine peak; HE, hepatic encephalopathy; HA, hyperammonemia; HIE, hypoxic-ischemic encephalopathy; IEMs, inborn errors of metabolism; ICA, Independent component analysis; MRI, magnetic resonance imaging; MRS, magnetic resonance spectroscopy; NBS, newborn screening; OTCD, ornithine transcarbamylase deficiency; PET, positron emission tomography; PFC, pre-frontal cortex; RDCRN, rare disease clinical research network; SMA, supplemental motor strip; UCD, urea cycle disorder; UCDC, urea cycle rare disorders consortium.
1. Ah Mew N, Simpson KL, Gropman AL, Lanpher BC, Chapman KA, Summar ML. Urea cycle disorders overview. In: Adam MP, Ardinger HH, Pagon RA, Wallace SE, Bean LJH, Stephens K, et al. editors. GeneReviews® [Internet]. Seattle, WA: University of Washington, Seattle (2003). p. 1–15.
2. Häberle J, Boddaert N, Burlina A, Chakrapani A, Dixon M, Huemer M, et al. Suggested guidelines for the diagnosis and management of urea cycle disorders. Orphanet J Rare Dis. (2012) 7:32. doi: 10.1186/1750-1172-7-32
3. Barkovich E, Gropman AL. Late onset ornithine transcarbamylase deficiency triggered by an acute increase in protein intake: a review of 10 cases reported in the literature. Case Rep Genet. (2020) 2020:7024735. doi: 10.1155/2020/7024735
4. Summar ML, Barr F, Dawling S, Smith W, Lee B, Singh RH, et al. Unmasked adult-onset urea cycle disorders in the critical care setting. Crit Care Clin. (2005) 21:1–8. doi: 10.1016/j.ccc.2005.05.002
5. Alameri M, Shakra M, Alsaadi T. Fatal coma in a young adult due to late-onset urea cycle deficiency presenting with a prolonged seizure: a case report. Austin J Clin Neurol. (2015) 2:1–3. doi: 10.1186/s13256-015-0741-2
6. Bigot A, Brunault P, Lavigne C, Feillet F, Odent S, Kaphan E, et al. Psychiatric adult-onset of urea cycle disorders: a case-series. Mol Genet Metab Rep. (2017) 12:103–9. doi: 10.1016/j.ymgmr.2017.07.001
7. Daijo K, Kawaoka T, Nakahara T, Nagaoki Y, Tsuge M, Hiramatsu A, et al. Late-onset ornithine transcabamylase deficiency associated with hyperammonaemia. Clin J Gastroenterol. (2017) 10:383–7. doi: 10.1007/s12328-017-0753-0
8. Lee CH, Ellaway C, Shun A, Thomas G, Nair P, O'Neill J, et al. Split-graft liver transplantation from an adult donor with an unrecognized UCD to a pediatric and adult recipient. Pediatr Transplant. (2017) 22:e13073. doi: 10.1111/petr.13073
9. Osawa Y, Wada A, Ohtsu Y, Yamada K, Takizawa T. Late-onset argininosuccinic aciduria associated with hyperammonemia triggered by influenza infection in an adolescent: a case report. Mol Genet Metab Rep. (2020) 24:100605. doi: 10.1016/j.ymgmr.2020.100605
10. Pendela VS, Kudaravalli P, Munoz A, Razzouk G. A mysterious case of recurrent acute hyperammonemic encephalopathy. Cureus. (2020) 12: e7484. doi: 10.7759/cureus.7484
11. Ramanathan M, Uppalapu S, Patel NM. Hiding in plain sight: a case of ornithine transcarbamylase deficiency unmasked post-liver transplantation. Am J Transplant. (2017) 17:1405–8. doi: 10.1111/ajt.14174
12. Weiss N, Mochel F, Rudler M, Demeret S, Lebray P, Conti F, et al. Peak hyperammonaemia and atypical acute liver failure: the eruption of a urea cycle disorder during hyperemesis gravidarum. J Hepatol. (2018) 68:185–92. doi: 10.1016/j.jhep.2017.09.009
13. Wells DL, Thomas JB, Sacks GS, Zouhary LA. Late-onset urea cycle disorder in adulthood unmasked by severe malnutrition. Nutrition. (2014) 30:943–7. doi: 10.1016/j.nut.2013.12.011
14. Ben-Ari Z, Dalal A, Morry A, Pitlik S, Zinger P, Cohen J, et al. Adult onset ornithine transcarbamylase (OTC) deficiency unmasked by the Atkins diet. J Hepatol. (2010) 52:292–5. doi: 10.1016/j.jhep.2009.11.014
15. Sprouse C, King J, Helman G, Pacheco-Colón I, Shattuck K, Breeden A, et al. Investigating neurological deficits in carriers and affected patients with ornithine transcarbamylase deficiency. Mol Genet Metab. (2014) 113:136–41. doi: 10.1016/j.ymgme.2014.05.007
16. Felipo V, Butterworth RF. Neurobiology of ammonia. Prog Neurobiol. (2002) 67:259–79. doi: 10.1016/S0301-0082(02)00019-9
17. Braissant O, McLin VA, Cudalbu C. Ammonia toxicity to the brain. J Inherit Metab Dis. (2013) 36:595–612. doi: 10.1007/s10545-012-9546-2
18. Krivitzky L, Babikian T, Lee HS, Thomas NH, Burk-Paull KL, Batshaw ML. Intellectual, adaptive, and behavioral functioning in children with urea cycle disorders. Pediatr Res. (2009) 66:96–101. doi: 10.1203/PDR.0b013e3181a27a16
19. Dolman CL, Clasen RA, Dorovini-Zis K. Severe cerebral damage in ornithine transcarbamylase deficiency. Clin Neuropathol. (1988) 7:10–5.
20. Harding BN, Leonard JV, Erdohazi M. Ornithine carbamoyl transferase deficiency: a neuropathological study. Eur J Pediatr. (1984) 141:215–20. doi: 10.1007/BF00572763
21. Krieger D, Krieger S. Markers of reversible hepatic encephalopathy. Neurology. (1997) 49:1187–8. doi: 10.1212/WNL.49.4.1187-b
22. Kornfeld M, Woodfin BM, Papile L, Davis LE, Bernard LR. Neuropathology of ornithine carbamyl transferase deficiency. Acta Neuropathol. (1985) 65:261–4. doi: 10.1007/BF00687006
23. Thakur V, Rupar CA, Ramsay DA, Singh R, Fraser DD. Fatal cerebral edema from late-onset ornithine transcarbamylase deficiency in a juvenile male patient receiving valproic acid. Pediatr Crit Care Med. (2006) 7:273–6. doi: 10.1097/01.PCC.0000216682.56067.23
24. Mattson LR, Lindor NM, Goldman DH, Goodwin JT, Groover RV, Vockley J. Central pontine myelinolysis as a complication of partial ornithine carbamoyl transferase deficiency. Am J Med Genet. (1995) 60:210–3. doi: 10.1002/ajmg.1320600308
25. Yamanouchi H, Yokoo H, Yuhara Y, Maruyama K, Sasaki A, Hirato J, et al. An autopsy case of ornithine transcarbamylase deficiency. Brain Dev. (2002) 24:91–4. doi: 10.1016/S0387-7604(01)00408-9
26. Gropman AL, Summar M, Leonard JV. Neurological implications of urea cycle disorders. J Inherit Metab Dis. (2007) 30:865–79. doi: 10.1007/s10545-007-0709-5
27. Mouad M, Haberle J, Whitehead MT, Stricker T, Gropman AL. Brain Biomarkers of long-term outcome of neonatal onset urea cycle disorder. Int J Neonatal Screen. (2016) 2:10. doi: 10.3390/ijns2040010
28. Breningstall GN. Neurologic syndromes in hyperammonemic disorders. Pediatr Neurol. (1986) 2:253–62. doi: 10.1016/0887-8994(86)90016-0
29. Nicolaides P, Liebsch D, Dale N, Leonard J, Surtees R. Neurological outcome of patients with ornithine carbamoyltransferase deficiency. Arch Dis Child. (2002) 86:54–6. doi: 10.1136/adc.86.1.54
30. Bachmann C. Ornithine carbamoyl transferase deficiency: findings, models and problems. J Inherit Metab Dis. (1992) 15:578–91. doi: 10.1007/BF01799616
31. Bachmann C. Outcome and survival of 88 patients with urea cycle disorders: a retrospective evaluation. Eur J Pediatr. (2003) 162:410–6. doi: 10.1007/s00431-003-1188-9
32. Enns GM. Neurologic damage and neurocognitive dysfunction in urea cycle disorder. Semin Pediatr Neurol. (2008) 15:132–9. doi: 10.1016/j.spen.2008.05.007
33. Msall M, Batshaw ML, Suss R, Brusilow SW, Mellits ED. Neurologic outcome in children with inborn errors of urea synthesis. Outcome of urea-cycle enzymopathies. N Engl J Med. (1984) 310:1500–5. doi: 10.1056/NEJM198406073102304
34. Uchino T, Endo F, Matsuda I. Neurodevelopmental outcome of long-term therapy of urea cycle disorders in Japan. J Inherit Metab Dis. (1998) 21:151–9. doi: 10.1023/A:1005374027693
35. Batshaw ML, Brusilow S, Waber L, Blom W, Brubakk AM, Burton BK, et al. Treatment of inborn errors of urea synthesis: activation of alternative pathways of waste nitrogen synthesis and excretion. N Engl J Med. (1982) 306:1387–92. doi: 10.1056/NEJM198206103062303
36. Nagata N, Matsuda I, Matsuura T, Oyanagi K, Tada K, Narisawa K, et al. Retrospective survey of urea cycle disorders: Part 2. Neurological outcome in forty-nine Japanese patients with urea cycle enzymopathies. Am J Med Genet. (1991) 40:477–81. doi: 10.1002/ajmg.1320400421
37. Msall M, Monahan PS, Chapanis N, Batshaw ML. Cognitive development in children with inborn errors of urea synthesis. Acta Paediatr Jpn. (1988) 30:435–41. doi: 10.1111/j.1442-200X.1988.tb02534.x
38. Whetsell WO Jr, Shapira NA. Neuroexcitation, excitotoxicity and human neurological disease. Lab Invest. (1993) 68:372–87.
39. Willard-Mack CL, Koehler RC, Hirata T, Cork LC, Takahashi H, Traystman RJ, et al. Inhibition of glutamine synthetase reduces ammonia-induced astrocyte swelling in rat. Neuroscience. (1996) 71:589–99. doi: 10.1016/0306-4522(95)00462-9
40. Qureshi IA, Rao KV. Sparse-fur (spf) mouse as a model of hyperammonemia: alterations in the neurotransmitter systems. Adv Exp Med Biol. (1997) 420:143–58. doi: 10.1007/978-1-4615-5945-0_9
41. Brusilow SW, Horwich AL. Urea cycle enzymes. In: Scriver CR, Beaudet AL, Sly WS, Valle D, Childs B, Kinzler KW, editors. The Metabolic & Molecular Bases of Inherited Diseases. Chap 85. 8 ed. New York, NY: McGraw-Hill (2001).
42. Voorhies TM, Ehrlich ME, Duffy TE, Petito CK, Plum F. Acute hyperammonemia in the young primate: physiologic and neuropathologic correlates. Pediatr Res. (1983) 17:970–5. doi: 10.1203/00006450-198312000-00009
43. Duffy TE, Vergara F, Plum F. Alpha-ketoglutaramate in hepatic encephalopathy. Res Publ Assoc Res Nerv Ment Dis. (1974) 53:39–52.
44. Bachmann C, Colombo JP. Increase of tryptophan and 5-hydroxyindole acetic acid in the brain of ornithine carbamoyltransferase deficient sparse-fur mice. Pediatr Res. (1984) 18:372–5. doi: 10.1203/00006450-198404000-00014
45. Butterworth RF. Effects of hyperammonaemia on brain function. J Inherit Metab Dis. (1998) 21:6–20. doi: 10.1023/A:1005393104494
46. Rane S, Owen J, Hippe DS, Cholerton B, Zabetian CP, Montine T, et al. White matter lesions in mild cognitive impairment and idiopathic parkinson's disease: multimodal advanced MRI and cognitive associations. J Neuroimaging. (2020) 30:843–50. doi: 10.1111/jon.12778
47. Raji CA, Torosyan N, Silverman DHS. Optimizing use of neuroimaging tools in evaluation of prodromal alzheimer's disease and related disorders. J Alzheimers Dis. (2020) 77:935–47. doi: 10.3233/JAD-200487
48. Park CH, Lee PH, Lee SK, Chung SJ, Shin NY. The diagnostic potential of multimodal neuroimaging measures in Parkinson's disease and atypical Parkinsonism. Brain Behav. (2020) 10:e01808. doi: 10.1002/brb3.1808
49. Hyvarinen A, Karhunen J, Oja E. Independent Component Analysis. New York, NY: Wiley Interscience (2001). doi: 10.1002/0471221317
50. Calhoun VD, Sui J. Multimodal fusion of brain imaging data: a key to finding the missing link(s) in complex mental illness. Biol Psychiatry Cogn Neurosci Neuroimaging. (2016) 1:230–44. doi: 10.1016/j.bpsc.2015.12.005
51. Ahn S, Jun SC. Multi-modal integration of eeg-fnirs for brain-computer interfaces - current limitations and future directions. Front Human Neurosci. (2017) 11:503. doi: 10.3389/fnhum.2017.00503
52. Sirpal P, Kassab A, Pouliot P, Nguyen DK, Lesage F. fNIRS improves seizure detection in multimodal EEG-fNIRS recordings. J Biomed Optics. (2019) 24:1–9. doi: 10.1117/1.JBO.24.5.051408
53. Westerhausen R, Kreuder F, Woerner W, Huster RJ, Smit CM, Schweiger E, et al. Interhemispheric transfer time and structural properties of the corpus callosum. Neurosci Lett. (2016) 409:140–5. doi: 10.1016/j.neulet.2006.09.028
54. Calhoun VD, Adali T, Giuliani NR, Pekar JJ, Kiehl KA, Pearlson GD. Method for multimodal analysis of independent source differences in schizophrenia: combining gray matter structural and auditory oddball functional data. Hum Brain Mapp. (2006) 27:47–62. doi: 10.1002/hbm.20166
55. Specht K, Zahn R, Willmes K, Weis S, Holtel C, Krause BJ, et al. Joint independent component analysis of structural and functional images reveals complex patterns of functional reorganisation in stroke aphasia. Neuroimage. (2009) 47:2057–63. doi: 10.1016/j.neuroimage.2009.06.011
56. Yang J, Zhang M, Ahn H, Zhang Q, Jin TB, Li I, et al. Development and evaluation of a multimodal marker of major depressive disorder. Hum Brain Mapp. (2018) 39:4420–39. doi: 10.1002/hbm.24282
57. Anderson A, Gropman A, Le Mons C, Stratakis C, Gandjbakhche A. Evaluation of neurocognitive function of prefrontal cortex in ornithine transcarbamylase deficiency. Mol Genet Metab. (2020) 129:207–12. doi: 10.1016/j.ymgme.2019.12.014
58. Gropman AL, Gertz B, Shattuck K, Kahn IL, Seltzer R, Krivitsky L, et al. Diffusion tensor imaging detects areas of abnormal white matter microstructure in patients with partial ornithine transcarbamylase deficiency. Am J Neuroradiol. (2010) 31:1719–23. doi: 10.3174/ajnr.A2122
59. Gropman A, Seltzer RR, Yudkoff ML, Sawyer A, VanMeter J, Fricke ST, et al. 1H MRS allows brain phenotype differentiation in sisters with late onset ornithine transcarbamylase deficiency (OTCD) and discordant clinical presentations. Mol Genet Metab. (2008) 94:52–60. doi: 10.1016/j.ymgme.2007.12.008
60. Bireley WR, Van Hove JL, Gallagher RC, Fenton LZ. Urea cycle disorders: brain MRI and Neurological outcome. Pediatr Radiol. (2012) 42:455–62. doi: 10.1007/s00247-011-2253-6
61. Sen K, Whitehead MT, Gropman AL. Multimodal imaging in urea cycle-related neurological disease – What can imaging after hyperammonemia teach us? Transl Sci Rare Dis. (2020) 5:87–95. doi: 10.3233/TRD-200048
62. Gunz AC, Choong K, Potter M, Miller E, Magnetic resonance imaging findings and neurodevelopmental outcomes in neonates with urea-cycle defects. Int Med Case Rep J. (2013) 6:41–8. doi: 10.2147/IMCRJ.S43513
63. Jichlinski A, Clarke L, Whitehead MT, Gropman A. “Cerebral Palsy” in a patient with arginase deficiency. Semin Pediatr Neurol. (2018) 26:110–4. doi: 10.1016/j.spen.2017.03.016
64. Yu D, Lu G, Mowshica R, Cheng Y, Zhao F. Clinical and cranial MRI features of female patients with ornithine transcarbamylase deficiency: two case reports. Medicine (Baltimore). (2019) 98:e16827. doi: 10.1097/MD.0000000000016827
65. Shen J, Petersen KF, Behar KL, Brown P, Nixon TW, Mason GF, et al. Determination of the rate of the glutamate/glutamine cycle in the human brain by in vivo 13C NMR. Proc Natl Acad Sci USA. (1999) 96:8235–40. doi: 10.1073/pnas.96.14.8235
66. Rothman DL, Novotny EJ, Shulman GI, Howseman AM, Petroff OA, Mason G, et al. 1H-[13C] NMR measurements of [4-13C] glutamate turnover in human brain. Proc Natl Acad Sci USA. (1992) 89:9603–6. doi: 10.1073/pnas.89.20.9603
67. Blüml S, Moreno-Torres A, Ross BD. [1-13C] glucose MRS in chronic hepatic encephalopathy in man. Magn Reson Med. (2001) 45:981–93. doi: 10.1002/mrm.1131
68. Sailasuta N, Robertson LW, Harris KC, Gropman AL, Allen PS, Ross BD. Clinical NOE 13C MRS for neuropsychiatric disorders of the frontal lobe. J Magn Reson. (2008) 195:219–25. doi: 10.1016/j.jmr.2008.09.012
69. Gropman AL, Sailasuta N, Harris KC, Abulseoud O, Ross BD. Ornithine transcarbamylase deficiency with persistent abnormality in cerebral glutamate metabolism in adults. Radiology. (2009) 252:833–41. doi: 10.1148/radiol.2523081878
70. Hapuarachchi T, Scholkmann F, Caldwell M, Hagmann C, Kleiser S, Metz AJ, et al. Simulation of preterm neonatal brain metabolism during functional neuronal activation using a computational model. Adv Exp Med Biol. (2016) 876:111–20. doi: 10.1007/978-1-4939-3023-4_14
71. McDonald NM, Perdue KL. The infant brain in the social world: moving toward interactive social neuroscience with functional near-infrared spectroscopy. Neurosci Biobehav Rev. (2018) 87:38–49. doi: 10.1016/j.neubiorev.2018.01.007
72. Ferrari M, Quaresima V. A brief review on the history of human functional near-infrared spectroscopy (fNIRS) development and fields of application. Neuroimage. (2012) 63:921–35. doi: 10.1016/j.neuroimage.2012.03.049
73. Scarapicchia V, Brown C, Mayo C, Gawryluk JR. Functional magnetic resonance imaging and functional near-infrared spectroscopy: insights from combined recording studies. Front Hum Neurosci. (2017) 11:419. doi: 10.3389/fnhum.2017.00419
74. Carvalho DR, Brum JM, Speck-Martins CE, Ventura FD, Navarro MM, Coelho KE, et al. Clinical features and neurologic progression of hyperargininemia. Pediatr Neurol. (2012) 46:369–74. doi: 10.1016/j.pediatrneurol.2012.03.016
75. Oldham MS, VanMeter JW, Shattuck KF, Cederbaum SD, Gropman AL. Diffusion tensor imaging in arginase deficiency reveals damage to corticospinal tracts. Pediatr Neurol. (2010) 42:49–52. doi: 10.1016/j.pediatrneurol.2009.07.017
76. Silva ES, Cardoso ML, Vilarinho L, Medina M, Barbot C, Martins E. Liver transplantation prevents progressive neurological impairment in argininemia. JIMD Rep. (2013) 11:25–30. doi: 10.1007/8904_2013_218
77. Güngör S, Akinci A, Firat AK, Tabel Y, Alkan A. Neuroimaging findings in hyperargininemia. J Neuroimaging. (2008) 18:457–62. doi: 10.1111/j.1552-6569.2007.00217.x
78. Nagarjunakonda S, Daggumati R, Amalakanti S. Hyperargininemic encephalopathy with unique clinical presentation and novel genetic mutations. J Coll Physicians Surg Pak. (2020) 30:535–6. doi: 10.29271/jcpsp.2020.05.535
79. Prasad AN, Breen JC, Ampola MG, Rosman NP. Argininemia: a treatable genetic cause of progressive spastic diplegia simulating cerebral palsy: case reports and literature review. J Child Neurol. (1997) 12:301–9. doi: 10.1177/088307389701200502
80. Jain-Ghai S, Nagamani SC, Blaser S, Siriwardena K, Feigenbaum A. Arginase I deficiency: severe infantile presentation with hyperammonemia: more common than reported? Mol Genet Metab. (2011) 104:107–11. doi: 10.1016/j.ymgme.2011.06.025
81. Segawa Y, Matsufuji M, Itokazu N, Utsunomiya H, Watanabe Y, Yoshino M, et al. A long-term survival case of arginase deficiency with severe multicystic white matter and compound mutations. Brain Dev. (2011) 33:45–8. doi: 10.1016/j.braindev.2010.03.001
82. Ozturk K, McKinney AM, Nascene D. Urea cycle disorders: a neuroimaging pattern approach using diffusion and FLAIR MRI. J Neuroimaging. (2020) 31:144–50. doi: 10.1111/jon.12787
Keywords: urea cycle disorders, neuroimaging, hyperammonemia, magnetic resonance spectroscopy, ornithine transcarbamylase deficiency, arginase deficiency, multimodal imaging, functional near infrared spectroscopy
Citation: Sen K, Anderson AA, Whitehead MT and Gropman AL (2021) Review of Multi-Modal Imaging in Urea Cycle Disorders: The Old, the New, the Borrowed, and the Blue. Front. Neurol. 12:632307. doi: 10.3389/fneur.2021.632307
Received: 23 November 2020; Accepted: 26 March 2021;
Published: 28 April 2021.
Edited by:
Maria Petracca, University of Naples Federico II, ItalyReviewed by:
Kerem Ozturk, University of Minnesota Twin Cities, United StatesCopyright © 2021 Sen, Anderson, Whitehead and Gropman. This is an open-access article distributed under the terms of the Creative Commons Attribution License (CC BY). The use, distribution or reproduction in other forums is permitted, provided the original author(s) and the copyright owner(s) are credited and that the original publication in this journal is cited, in accordance with accepted academic practice. No use, distribution or reproduction is permitted which does not comply with these terms.
*Correspondence: Andrea L. Gropman, YWdyb3BtYW5AY2hpbGRyZW5zbmF0aW9uYWwub3Jn
Disclaimer: All claims expressed in this article are solely those of the authors and do not necessarily represent those of their affiliated organizations, or those of the publisher, the editors and the reviewers. Any product that may be evaluated in this article or claim that may be made by its manufacturer is not guaranteed or endorsed by the publisher.
Research integrity at Frontiers
Learn more about the work of our research integrity team to safeguard the quality of each article we publish.