- Motor Neuron Disease Unit, National Institute of Neurological Disorders and Stroke, National Institutes of Health, Bethesda, MD, United States
A repeat expansion mutation in the C9orf72 gene causes amyotrophic lateral sclerosis (ALS), frontotemporal dementia (FTD), or symptoms of both, and has been associated with gray and white matter changes in brain MRI scans. We used graph theory to examine the network properties of brain function at rest in a population of mixed-phenotype C9orf72 mutation carriers (C9+). Twenty-five C9+ subjects (pre-symptomatic, or diagnosed with ALS, behavioral variant FTD (bvFTD), or both ALS and FTD) and twenty-six healthy controls underwent resting state fMRI. When comparing all C9+ subjects with healthy controls, both global and connection-specific decreases in resting state connectivity were observed, with no substantial reorganization of network hubs. However, when analyzing subgroups of the symptomatic C9+ patients, those with bvFTD (with and without comorbid ALS) show remarkable reorganization of hubs compared to patients with ALS alone (without bvFTD), indicating that subcortical regions become more connected in the network relative to other regions. Additionally, network connectivity measures of the right hippocampus and bilateral thalami increased with increasing scores on the Frontal Behavioral Inventory, indicative of worsening behavioral impairment. These results indicate that while C9orf72 mutation carriers across the ALS-FTD spectrum have global decreased resting state brain connectivity, phenotype-specific effects can also be observed at more local network levels.
Introduction
A repeat expansion mutation in the C9orf72 gene is the most frequent cause of familial amyotrophic lateral sclerosis (ALS) and familial frontotemporal dementia (FTD) in populations of Northern European origin (1, 2) accounting for 5–10% of sporadic cases of these disorders (3). Carriers of the C9orf72 mutation (hereafter referred to as C9+) can present with clinical symptoms of ALS, FTD, or with combinations of motor, cognitive, and behavioral symptoms (4–7). Compared to patients with sporadic ALS or FTD, neuroimaging studies in C9+ ALS and FTD patients show more pronounced atrophy, particularly of subcortical structures and extramotor cortical regions (4, 8–15). Although subtle structural changes can be detected in groups of pre-symptomatic C9+ carriers (9, 16–18), most structural changes are found later in the disease course, when symptoms are manifest. In individual C9+ carriers, the structural changes may represent a hybrid pattern between those described for sporadic ALS and sporadic FTD, appearing to reflect the relative balance of motor and cognitive-behavioral dysfunction (10, 19–21).
Functional connectivity changes also occur in patients with ALS and FTD. In sporadic and C9+ FTD, intrinsic functional connectivity is reduced in the salience networks, frontal and temporal regions, and thalamic networks (13, 22–24). Findings from resting state fMRI studies in sporadic ALS are less consistent. Most reports find increased connectivity, particularly in the sensorimotor network and default mode network (25–28). However, others report decreased connectivity (29–32), or mixtures of increased and decreased network connectivity (33–36). We hypothesized that functional imaging in C9+ carriers would show a hybrid pattern on a continuum of those seen in ALS and FTD reflecting the relative balance of motor and cognitive-behavioral dysfunction in each patient. To examine this hypothesis, we evaluated changes in network measures and their association with clinical measures of motor and cognitive-behavioral dysfunction using graph theory metrics. In this analysis, each brain region is represented as a node and the relationship between two brain regions is represented as an edge connecting the two nodes (37). Graph theory allows us to quantify whole-brain network properties, as well as how regions interact with each other as part of a larger network.
We first compared differences in network measures of functional connectivity in a heterogeneous group of C9+ carriers to healthy controls to identify changes associated with the C9orf72 mutation itself. We then compared C9+ carriers with ALS alone (C9+ FTD-) to C9+ patients with behavioral variant FTD (bvFTD) or ALS-FTD within the cohort. We hypothesized that C9+ with bvFTD/ALS-FTD would exhibit changes in networks associated with cognitive-behavioral function whereas C9+ FTD—ALS patients would exhibit changes in motor networks, and that network measures would correlate with clinical measures of motor or cognitive-behavioral function.
Methods
Participants
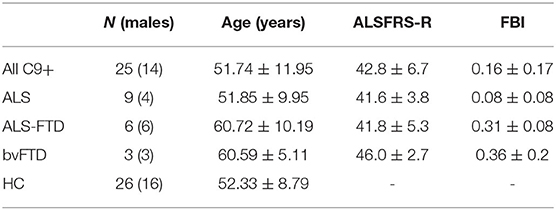
Twenty-five carriers of the C9orf72 expansion mutation (Table 1) were recruited from across the United States though online advertising, organizational outreach, and physician referrals between 2013 and 2016. All subjects gave written informed consent in accordance with an IRB-approved protocol. Inclusion criteria required the C9+ subjects to have >30 repeats in the C9orf72 gene as established by repeat prime polymerase chain reaction in a CLIA certified lab. They were not excluded for having other comorbid conditions. All C9+ subjects were examined by an experienced neurologist and underwent electromyography and cognitive testing to determine their clinical diagnosis as previously reported (10). ALS was diagnosed using the 2015 revised El Escorial criteria (38). The International Consensus Criteria for behavioral variant FTD (39) were used for diagnosis of possible, probable, or definite bvFTD. The cohort consisted of C9+ subjects classified as being pre-symptomatic (N = 7), or as having ALS only (N = 9), bvFTD only (N = 3), or both ALS and bvFTD (N = 6). C9+ patients were administered the revised ALS functional rating scale [ALSFRS-R; (40)] to quantify motor impairment related to ALS and the frontal behavioral inventory [FBI; (41)] to assess behavioral impairment related to bvFTD. Twenty-six healthy controls (HC) underwent the same imaging protocol as the C9+ patients as part of a separate IRB-approved study. All healthy controls had normal neurological examinations and a normal cognitive screening test.
Imaging Protocol
Participants underwent MRI scanning on a GE 3T scanner. Two T1 FSPGR anatomical scans were collected (TI = 450 ms, α = 13°, voxel size = 1 × 0.938 × 0.938 mm). Resting state functional scans were collected during which subjects were instructed to stay awake, keep their eyes open, and think random thoughts (TR = 2,000 ms, TE = 30 ms, flip angle = 77, voxel size = 3.75 × 3.75 × 3.8 mm, FOV = 64 × 64 cm, 40 slices, 214 volumes).
Image Processing
Anatomical MRI data were processed in FreeSurfer and each subject's gray matter was parcellated into 82 volumes of interest (VOIs). These VOIs consisted of 34 cortical regions per hemisphere based on the Desikan-Killiany atlas (42) plus 14 subcortical VOIs, excluding the cerebellum (Table 2). Resting state functional data were preprocessed using FSL and custom MATLAB scripts. Preprocessing steps included motion and slice time correction, volume scrubbing based on motion outliers (identified by FSL's calculation of framewise displacement and the derivative of the time-course of root mean square intensity across voxels [DVARS; (43)], regression of motion parameters and white matter and CSF signals, and bandpass filtering between 0.01 and 0.1 Hz. Each subject's functional image was registered to their structural image. The anatomical parcellation and segmentation were applied to the functional time series to extract the 82 VOIs, and all the voxels within each VOI were averaged at every time point to create a time series of average signal for each VOI.
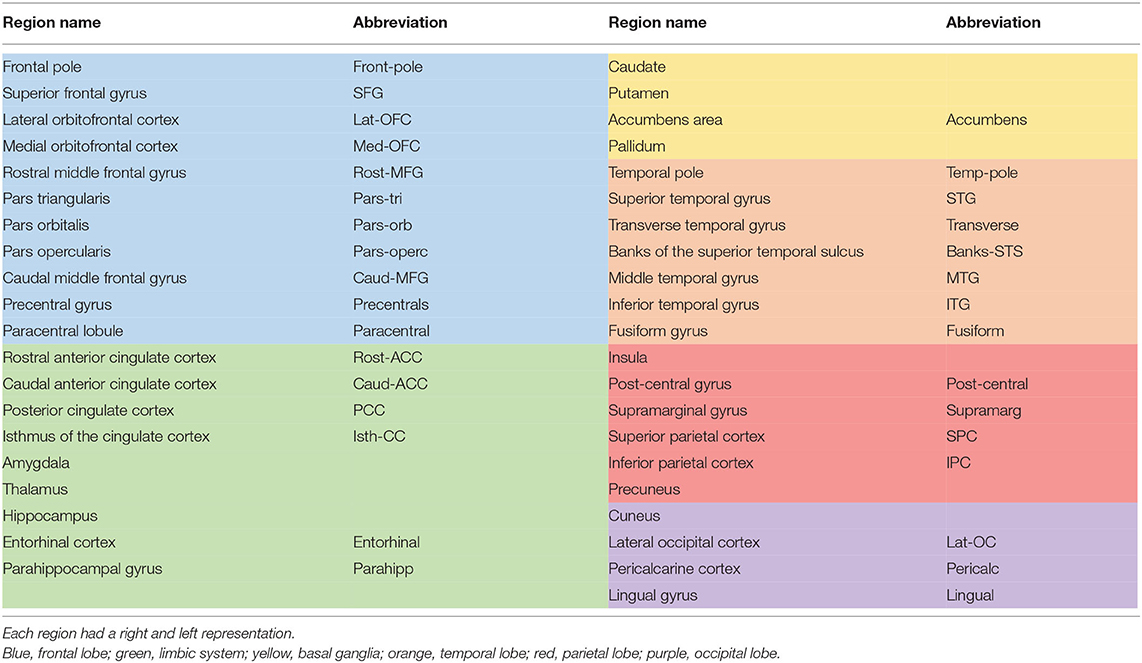
Table 2. Volumes of interest used in the analysis and their abbreviations and color scheme as displayed in Figure 3.
Graph Theory Analysis and Statistics
A connectivity matrix was formed with each row and column representing a node (VOI) and each cell representing an edge with strength equal to the Pearson correlation coefficient (R) of the row/column pair. Fisher transformation was applied to permit multiple linear regression of age and gender effects, followed by back transformation to R. The matrices were then thresholded by setting all connections below a specific R to zero. Thresholds from 0 to 0.7 were tested in increments of 0.1; thresholds >0.7 resulted in matrices too sparse for the calculation of may graph metrics. Thresholds between 0 and 0.4 yielded similar statistical results in global metrics, so R ≥ 0.2 was selected as the representative threshold for reporting. Graph theory metrics were calculated using custom MATLAB scripts and the Brain Connectivity Toolbox [https://sites.google.com/site/bctnet (37)].
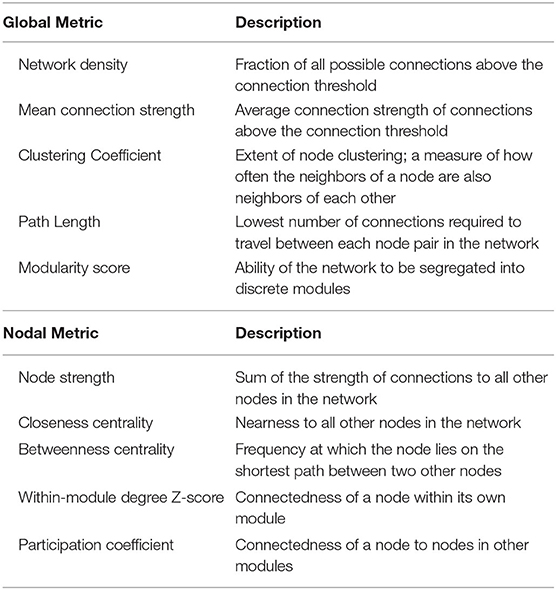
Two group analyses were performed: (1) all C9+ vs. HC and (2) a sub-analysis of C9+ subjects in which symptomatic bvFTD+ patients (bvFTD and ALS-FTD, n = 9) were compared to symptomatic ALS-only patients (ALS only, n = 9). Group differences for both analyses were evaluated using global, nodal, and edge metrics (Table 3). Global metrics included network density, mean connection strength, mean node clustering coefficient, mean node path length, and modularity score. Nodal measures included node strength, closeness centrality, betweenness centrality, within-module degree Z score, and participation coefficient. Hubs, or nodes that are particularly highly connected and involved within the network, were identified with a composite hub score that was calculated by summing the Z scores of the five nodal measures.
Permutation testing was used to calculate effective p-values (44). In each permutation, subjects' group assignments were randomly shuffled and the difference in the metric of interest between the two shuffled groups was calculated. The effective p-value was defined as the fraction of total permutations in which the shuffled groups had a larger magnitude of difference in the graph metric than the actual study groups. 1 × 10³ permutations were used to ensure a sufficient number of significant figures for reporting.
Results
Comparison of C9+ Carriers With Healthy Controls
Global Graph Metrics—C9+ vs. HC
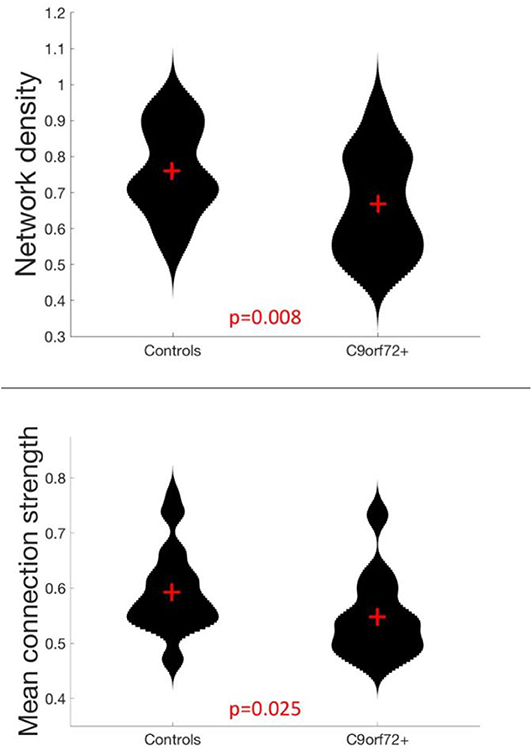
Analysis of global measures revealed that the C9+ carrier group had significantly lower global network density than HC, with fewer connections with strength greater than the correlation threshold (Figures 1, 2). Those edges that survived thresholding had a significantly lower mean connection strength for C9+ than HC (Figure 2). The clustering coefficients were also significantly different between groups (p = 0.018). However, because path length and modularity score are sensitive to network density (45), any significant differences are likely to be influenced by the different network densities, so they were not further explored.
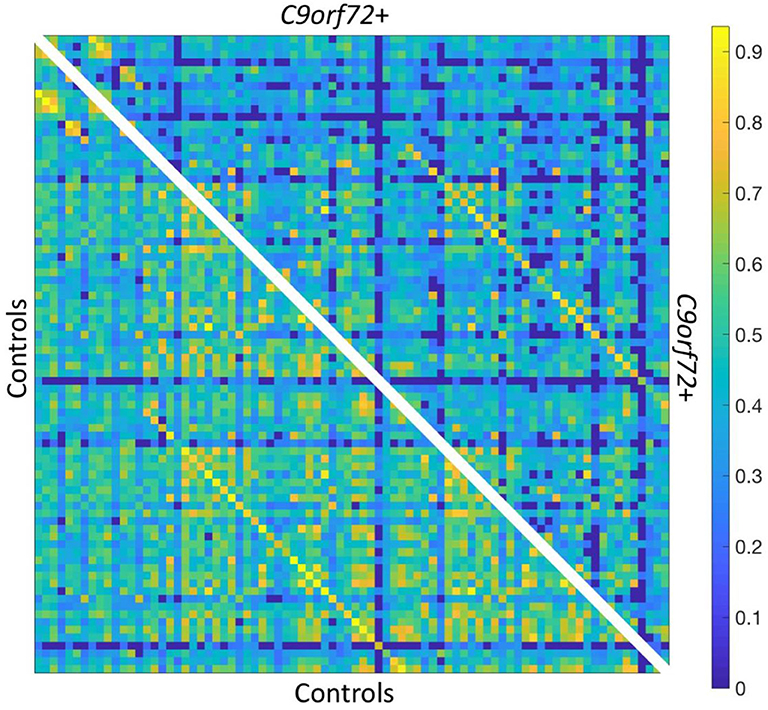
Figure 1. Resting state functional connectivity matrix thresholded at R ≥ 0.2. Bottom left: HC mean connectivity matrix. Top right: C9+ mean connectivity matrix. Scale bar shows Pearson correlation coefficient.
Network Hubs—C9+ Carriers vs. Healthy Controls
There was minimal reorganization of hub nodes in C9+ carriers compared to the healthy control group. The composite hub score showed that 75% of the nodes comprising the top 20% of hub scores were the same for HC and C9+ carriers (Table 4). Moreover, with the exception of one node in the top 20% in each group, hubs were ranked within the top 30% in the other group or were the contralateral pair to one of the top 20% nodes. The single hub that was highly ranked in healthy controls but not C9+ was the left lateral orbitofrontal cortex. The single hub that ranked highly in the C9+ carrier group but not healthy controls was the left thalamus.
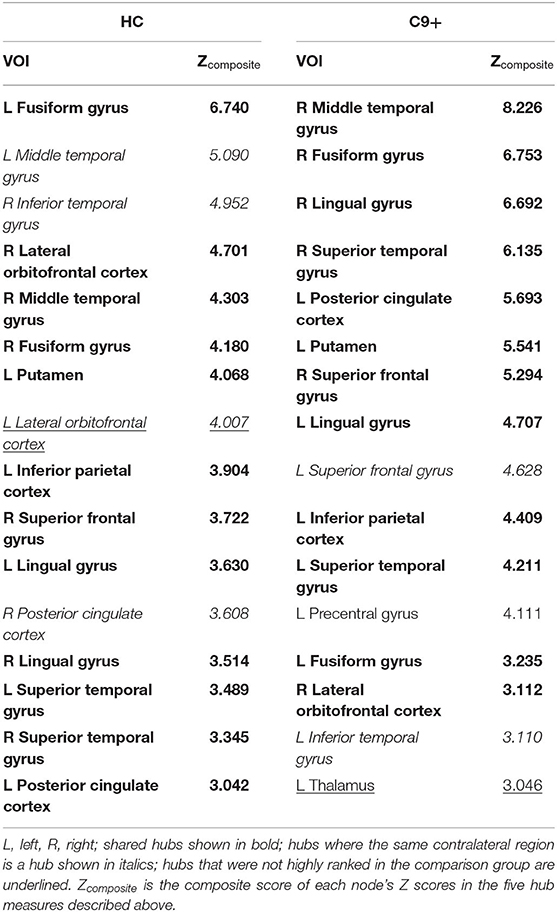
Table 4. Group hubs, defined as the top 20% of nodes based on a composite hub score (Z) for Healthy Controls and C9+ carrier groups.
Edge Analysis—C9+ vs. HC
Figure 3 displays the edges that had significantly decreased functional connectivity in C9+ carriers compared to HC (p < 0.001 uncorrected). There were no impaired intra-hemispheric connections in the left hemisphere. All connections with decreased functional connectivity were either inter-hemispheric or intra-hemispheric within the right hemisphere. More cortical connections were affected than subcortical connections. The right frontal lobe had the greatest number of reduced connections. Reduced connectivity was also seen for connections with the basal ganglia, temporal lobe, and parietal lobes. These edges connect regions involved in a broad range of cognitive functions. Additionally, several edges connecting motor-related regions were affected, including the right precentral and paracentral lobules. Other regions having multiple differing connections were the pars opercularis, pars triangularis, supramarginal gyrus, inferior temporal gyrus, and the left putamen.
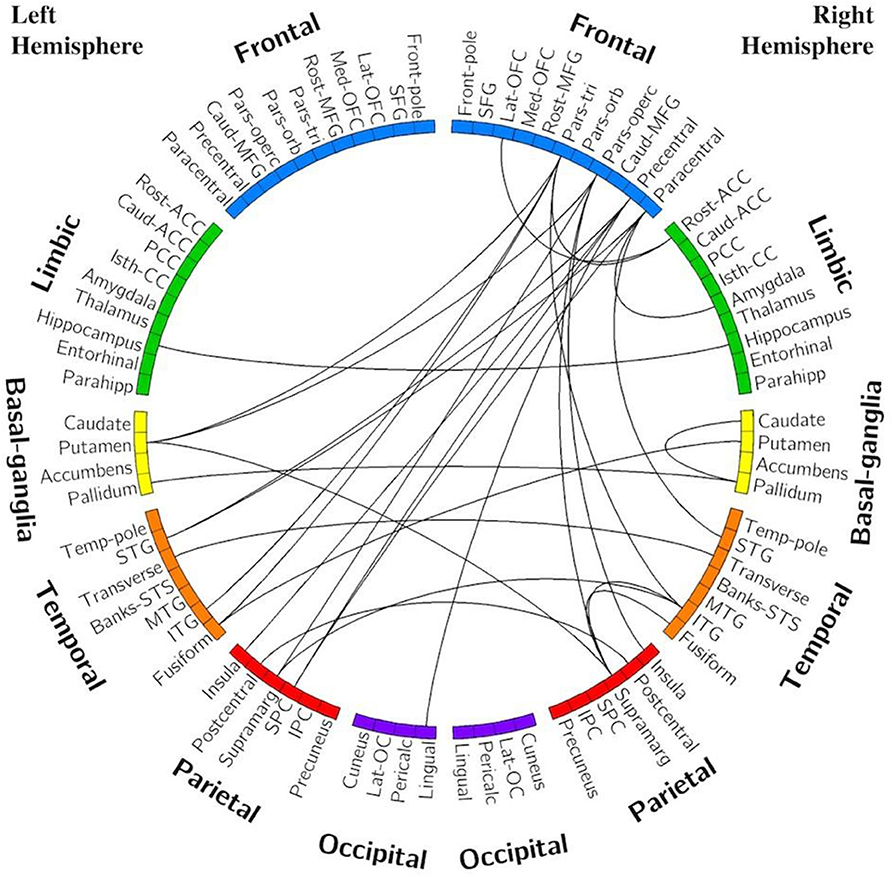
Figure 3. Edges with reduced connectivity strength in C9+ carriers compared with HC. Significance was determined using permutation testing at p < 0.001 uncorrected. See Table 2 for region name abbreviations.
Comparison of C9+ bvFTD/ALS-FTD Carriers With C9+ ALS Alone (bvFTD-)
Global Graph Metrics—bvFTD+ vs. ALS-only
Within the symptomatic group of C9+ carriers, there were no significant differences in global metrics (network density, mean connection strength, clustering coefficient, path length, and modularity) between the nine patients with ALS alone and the nine patients with bvFTD or ALS-FTD.
Network Hubs—bvFTD+ vs. ALS-only
The ALS-only group had similar hubs to healthy controls, with the addition of the precentral gyri and right caudate. In contrast, the bvFTD+ group had several nodes with hub scores that were ranked much lower than in the ALS-only group and healthy controls. These hubs included bilateral thalamus, right hippocampus, and right lateral occipital cortex. Hubs are listed in Table 5.
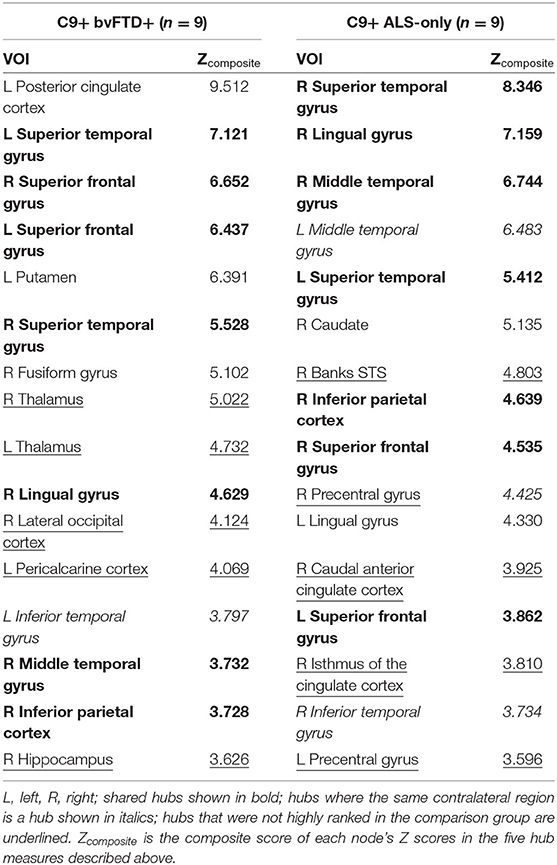
Table 5. Group hubs, defined as top 20% of nodes based on composite hub score for symptomatic patients with and without bvFTD.
The correlations between the hub score and the FBI and ALSFRS-R scores were computed for each of the unique hubs within each group. Three of the unique hubs in bvFTD+ patients correlated with FBI scores across all symptomatic C9+, indicating that behavioral impairment was associated with higher node strength (Figure 4). These hub nodes were the left thalamus (R = 0.443, p = 0.066), right thalamus (R = 0.471, p = 0.049), and right hippocampus (R = 0.525, p = 0.025).
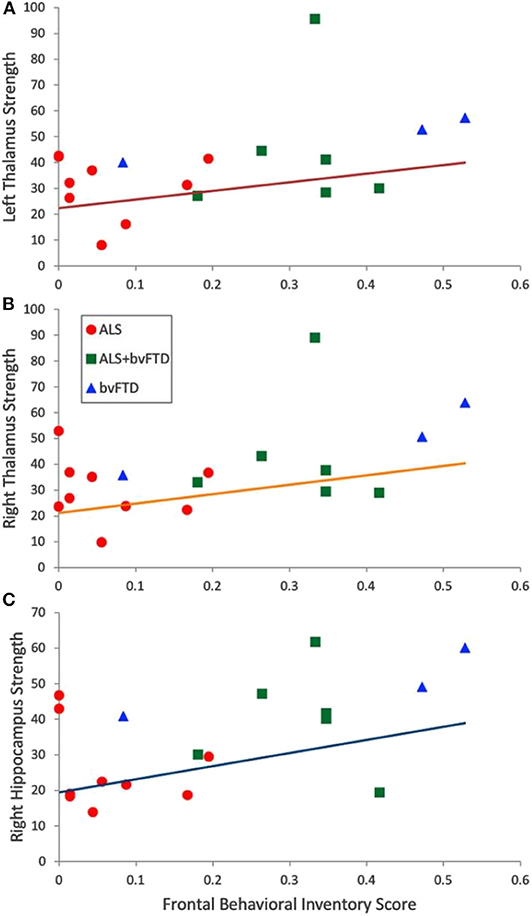
Figure 4. Correlation across all symptomatic C9+ carriers of Frontal Behavioral Inventory Scores with node strength of hubs that were more highly ranked in the bvFTD+ group than ALS-only group. (A) Left thalamus, R = 0.443, p = 0.066 (B) Right thalamus, R = 0.471, p = 0.049 (C) Right hippocampus, R = 0.525, p = 0.025.
Edge Analysis—C9+ bvFTD+ vs. ALS-only
Several edges had reduced connectivity strength in the ALS-only group compared to the bvFTD+ group. All statistically significant differences consisted of decreases in connection strength in the ALS-only group compared with the bvFTD+ group. The frontal and temporal regions exhibited the greatest number of decreased connections (Figure 5).
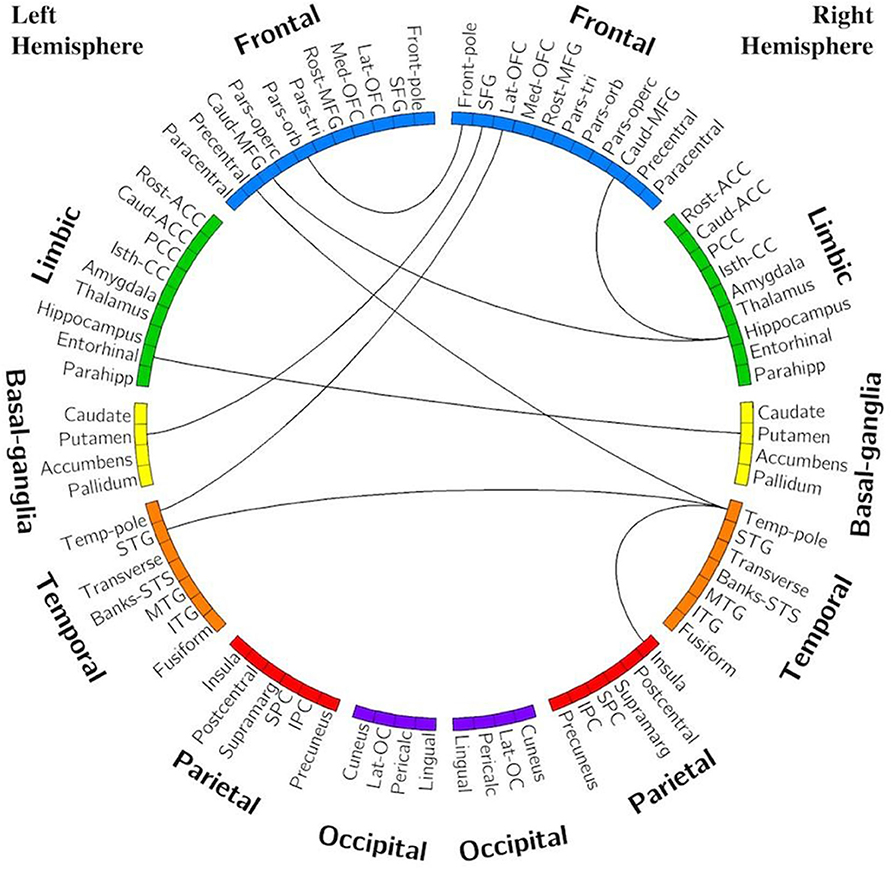
Figure 5. Edges with reduced connectivity strength in ALS-only group compared with bvFTD+/ALS-FTD. Significance was determined using permutation testing at p < 0.001 uncorrected. See Table 2 for region name abbreviations.
Discussion
In this study, we used graph theory metrics to explore alterations in network organization in C9orf72 mutation carriers and network correlations with motor and cognitive-behavioral functional measures. Graph theory allows exploration of network organization and functionality as a whole, rather than correlations between activity in discrete regions. We found that global network measures of connectivity were reduced in a cohort of C9+ carriers with heterogenous symptoms compared to healthy controls. Because C9orf72 expansion mutations cause motor and cognitive-behavioral symptoms across the ALS-FTD spectrum, we had anticipated that brain regions known to be affected in sporadic forms of both diseases would exhibit connectivity changes. This was mostly confirmed, with reduced connectivity specifically found in connections involving the frontal and temporal regions and the right motor cortex, regions known to be involved in cognitive and motor function. These findings are consistent with many prior studies in sporadic and C9+ FTD (13, 15, 22, 33, 35, 46–51). However, as previously noted, the literature on resting state connectivity in sporadic ALS has many discordant results. Our findings are consistent with studies showing decreased connectivity in ALS (29, 30, 32, 35, 52). The nodes with the greatest numbers of impaired connections in the C9+ population represented regions that are involved in networks previously described as being affected in ALS and bvFTD. These regions–the right precentral, paracentral, supramarginal, and inferior temporal gyri, the pars opercularis, pars triangularis, and the left putamen–are parts of the sensorimotor, salience, and central executive networks (53, 54).
Interestingly, while overall connectivity was decreased in the C9+ group, there appeared to be no substantial reorganization of network hubs. This indicates a relatively diffuse global decline in connectivity. Further underscoring this point, the edge analysis found no regions with increased connectivity in the C9+ network compared to HCs. This relative preservation of network organization may be interpreted as supporting the proposal that networks can compensate for low grade degeneration for a substantial period in order to maintain clinical function (55, 56). An alternative possibility is that pooling C9+ ALS, ALS-FTD, bvFTD, and pre-symptomatic carriers into one analysis group masked phenotype-specific network alterations.
To explore this possibility, we compared subgroups of C9+ symptomatic patients with and without FTD. This analysis found no significant differences in global network measures between subgroups, indicating that the global decrease in connectivity observed in the full C9+ cohort was likely not solely driven by a large change in one of the phenotypic subgroups. However, nodal graph theory metrics revealed some organizational differences between subgroups. Both of the symptomatic phenotypic subgroups had several hubs that that were unique in comparison with the healthy controls and from the other subgroup. In the ALS-only group (i.e., patients without FTD), the bilateral precentral gyri emerged as group-specific hubs. This implies that the ALS-only subgroup either had small increases in motor cortex connectivity or that the motor cortex connectivity remained relatively stable in the face of declining connectivity of the more active nodes. This phenomenon is consistent with resting state studies of patients with sporadic ALS that demonstrate localized increases in connectivity of motor regions (15, 25, 28, 57), and could represent a compensatory mechanism or the relative resilience of the motor network.
The bvFTD+ group had a greater number of subcortical hubs. The bilateral thalami and the right hippocampus were hub nodes in the bvFTD+ group and were not highly ranked in the ALS-only group or in healthy controls. The greater dependence on subcortical nodes could arise as a consequence of structural changes, including cortical atrophy (10, 15, 58, 59). The emergence of the thalamus as an important hub in C9+ bvFTD was somewhat surprising given that thalamic atrophy occurs in bvFTD (13, 16, 60) and in C9+ patients (8, 10, 15, 21). It also seems to conflict with resting state studies of bvFTD that report decreases in thalamic connectivity (47, 61). This may reflect differences between seed-based analysis methods (which may neglect global neuromodulatory changes) vs. the whole-brain approach used here. On balance, these modulated connections could result in the thalamus having a more prominent role as a network hub. The emergence of the hippocampus as a hub may account for the preservation of memory in the first few years of bvFTD symptoms (39, 60), although there are a few reports of hippocampal atrophy in bvFTD (48, 62).
To investigate the relationship between disease severity and network hub changes, we evaluated the correlation between hub scores of hubs unique to each subgroup and the FBI and ALSFRS-R scores of symptomatic C9+ carriers. The hub scores of the bilateral thalami and right hippocampus correlated with behavioral impairment as measured by the FBI. There was also significantly higher connectivity between the right hippocampus and the right and left middle frontal gyrus in the analysis of individual connections in the bvFTD+ group. Therefore, as the thalamus and hippocampus became more hub-like, patients exhibited more severe behavioral impairment. In contrast, there was no association between the hub scores and the ALSFRS-R scores for the unique hubs in the ALS-only group. The connectivity of these motor regions appears to change independently from this measure of motor symptom severity.
There are limitations in the present study that warrant discussion. First, because no subjects with sporadic disease were considered for this study, it is impossible to determine if any effects described here are unique to familial (and specifically C9-linked) disease. Second, as a result of our relatively small sample size, there is a large amount of heterogeneity in the study population and functional connectivity data. Subjects were grouped according to meeting diagnostic criteria for ALS and/or bvFTD; however, minor symptoms that were insufficient to meet criteria for a clinical diagnosis could nevertheless affect neural activity. Future studies with larger subgroups are warranted. Third, due to the wide variation in disease severity and duration amongst subjects, our cross-sectional design may not capture the full extent of functional connectivity changes in C9+ disease; a longitudinal study would be better suited to explore the evolution of functional connectivity changes across the ALS-FTD spectrum over time.
Conclusion
Carriers of the C9orf72 repeat expansion mutation have decreased functional connectivity at rest compared with healthy controls. Global network organization is generally preserved, although local network alterations emerge in C9+ carriers with ALS vs. FTD. Subcortical regions, including the bilateral thalami and the right hippocampus, emerge as hubs associated with the severity of behavioral impairment.
Data Availability Statement
The raw data supporting the conclusions of this article will be made available by the authors, without undue reservation.
Ethics Statement
The studies involving human participants were reviewed and approved by National Institutes of Health Institutional Review Board. The patients/participants provided their written informed consent to participate in this study.
Author Contributions
RS contributed to data collection, analytical design, data analysis and interpretation, and manuscript drafting. MC contributed to data collection, data interpretation, and manuscript editing. MF contributed to project conception and design, data collection, data interpretation, and manuscript editing. All authors contributed to the article and approved the submitted version.
Funding
This study was supported by the intramural program of the National Institutes of Health, National Institute of Neurological Disorders and Stroke. Z01 NS003146.
Conflict of Interest
The authors declare that the research was conducted in the absence of any commercial or financial relationships that could be construed as a potential conflict of interest.
Acknowledgments
Recruitment was made possible in part by ATSDR's National ALS Registry Research Notification Mechanism (https://www.cdc.gov/als/ALSResearchNotificationClinicalTrialsStudies.html).
We gratefully acknowledge Jennifer Farren, R.N. for patient coordination, the neurologists who referred patients, and the patients and caregivers whose participation was invaluable. We also give our thanks to Laura Braun and Laura Danielian for their contributions in data collection. This work utilized the computational resources of the NIH HPC Biowulf cluster (https://hpc.nih.gov). This manuscript has been released as a pre-print at MedXriv, (63).
References
1. DeJesus-Hernandez M, Mackenzie IR, Boeve BF, Boxer AL, Baker M, Rutherford NJ, et al. Expanded GGGGCC hexanucleotide repeat in noncoding region of C9ORF72 causes chromosome 9p-linked FTD and ALS. Neuron. (2011) 72:245–56. doi: 10.1016/j.neuron.2011.09.011
2. Renton AE, Majounie E, Waite A, Simon-Sanchez J, Rollinson S, Gibbs JR, et al. A hexanucleotide repeat expansion in C9ORF72 is the cause of chromosome 9p21-linked ALS-FTD. Neuron. (2011) 72:257–68. doi: 10.1016/j.neuron.2011.09.010
3. Majounie E, Renton AE, Mok K, Dopper EG, Waite A, Rollinson S, et al. Frequency of the C9orf72 hexanucleotide repeat expansion in patients with amyotrophic lateral sclerosis and frontotemporal dementia: a cross-sectional study. Lancet Neurol. (2012) 11:323–30. doi: 10.1016/j.yneu.2012.05.040
4. Byrne S, Elamin M, Bede P, Shatunov A, Walsh C, Corr B, et al. Cognitive and clinical characteristics of patients with amyotrophic lateral sclerosis carrying a C9orf72 repeat expansion: a population-based cohort study. Lancet Neurol. (2012) 11:232–40. doi: 10.1016/S1474–4422(12)70014-5
5. Cooper-Knock J, Kirby J, Highley R, Shaw PJ. The Spectrum of C9orf72-mediated neurodegeneration and amyotrophic lateral sclerosis. Neurotherapeutics. (2015) 12:326–39. doi: 10.1007/s13311-015-0342-1
6. Floeter MK, Traynor BJ, Farren J, Braun LE, Tierney M, Wiggs EA, et al. Disease progression in C9orf72 mutation carriers. Neurology. (2017) 89:234–41. doi: 10.1212/WNL.0000000000004115
7. Boeve BF, Boylan KB, Graff-Radford NR, DeJesus-Hernandez M, Knopman DS, Pedraza O, et al. Characterization of frontotemporal dementia and/or amyotrophic lateral sclerosis associated with the GGGGCC repeat expansion in C9ORF72. Brain. (2012) 135(Pt 3):765–83. doi: 10.1016/j.jalz.2012.05.2129
8. Bede P, Bokde AL, Byrne S, Elamin M, McLaughlin RL, Kenna K, et al. Multiparametric MRI study of ALS stratified for the C9orf72 genotype. Neurology. (2013) 81:361–9. doi: 10.1212/WNL.0b013e31829c5eee
9. Cash DM, Bocchetta M, Thomas DL, Dick KM, van Swieten JC, Borroni B, et al. Patterns of gray matter atrophy in genetic frontotemporal dementia: results from the GENFI study. Neurobiol Aging. (2018) 62:191–6.
10. Floeter MK, Bageac D, Danielian LE, Braun LE, Traynor BJ, Kwan JY. Longitudinal imaging in C9orf72 mutation carriers: relationship to phenotype. NeuroImage Clinical. (2016) 12:1035–43. doi: 10.1016/j.nicl.2016.10.014
11. Whitwell JL, Weigand SD, Boeve BF, Senjem ML, Gunter JL, DeJesus-Hernandez M, et al. Neuroimaging signatures of frontotemporal dementia genetics: C9ORF72, tau, progranulin and sporadics. Brain. 2012;135(Pt 3):794–806. doi: 10.1093/brain/aws001
12. Mahoney CJ, Beck J, Rohrer JD, Lashley T, Mok K, Shakespeare T, et al. Frontotemporal dementia with the C9ORF72 hexanucleotide repeat expansion: clinical, neuroanatomical and neuropathological features. Brain. (2012) 135(Pt 3):736–50. doi: 10.1093/brain/awr361
13. Lee SE, Khazenzon AM, Trujillo AJ, Guo CC, Yokoyama JS, Sha SJ, et al. Altered network connectivity in frontotemporal dementia with C9orf72 hexanucleotide repeat expansion. Brain. (2014) 137(Pt 11):3047–60. doi: 10.1093/brain/awu248
14. Mahoney CJ, Simpson IJ, Nicholas JM, Fletcher PD, Downey LE, Golden HL, et al. Longitudinal diffusion tensor imaging in frontotemporal dementia. Ann Neurol. (2015) 77:33–46. doi: 10.1002/ana.24296
15. Agosta F, Ferraro PM, Riva N, Spinelli EG, Domi T, Carrera P, et al. Structural and functional brain signatures of C9orf72 in motor neuron disease. Neurobiol Aging. (2017) 57:206–19. doi: 10.1016/j.neurobiolaging.2017.05.024
16. Lee SE, Sias AC, Mandelli ML, Brown JA, Brown AB, Khazenzon AM, et al. Network degeneration and dysfunction in presymptomatic C9ORF72 expansion carriers. NeuroImage Clinical. (2017) 14:286–97. doi: 10.1016/j.nicl.2016.12.006
17. Papma JM, Jiskoot LC, Panman JL, Dopper EG, den Heijer T, Donker Kaat L, et al. Cognition and gray and white matter characteristics of presymptomatic C9orf72 repeat expansion. Neurology. (2017) 89:1256–64. doi: 10.1212/WNL.0000000000004393
18. Walhout R, Schmidt R, Westeneng HJ, Verstraete E, Seelen M, van Rheenen W, et al. Brain morphologic changes in asymptomatic C9orf72 repeat expansion carriers. Neurology. (2015) 85:1780–8. doi: 10.1212/WNL.0000000000002135
19. Floeter MK, Danielian LE, Braun LE, Wu T. Longitudinal diffusion imaging across the C9orf72 clinical spectrum. J Neurol Neurosurg Psychiatr. (2018) 89:53–60. doi: 10.1136/jnnp-2017-316799
20. Westeneng HJ, Walhout R, Straathof M, Schmidt R, Hendrikse J, Veldink JH, et al. Widespread structural brain involvement in ALS is not limited to the C9orf72 repeat expansion. J Neurol Neurosurg Psychiatr. (2016) 87:1354–60. doi: 10.1136/jnnp-2016-313959
21. Omer T, Finegan E, Hutchinson S, Doherty M, Vajda A, McLaughlin RL, et al. Neuroimaging patterns along the ALS-FTD spectrum: a multiparametric imaging study. Amyotroph Lateral Scler Frontotemporal Degener. (2017) 18:611–23. doi: 10.1080/21678421.2017.1332077
22. Caminiti SP, Canessa N, Cerami C, Dodich A, Crespi C, Iannaccone S, et al. Affective mentalizing and brain activity at rest in the behavioral variant of frontotemporal dementia. NeuroImage Clin. (2015) 9:484–97. doi: 10.1016/j.nicl.2015.08.012
23. Hafkemeijer A, Möller C, Dopper EG, Jiskoot LC, van den Berg-Huysmans AA, van Swieten JC, et al. A longitudinal study on resting state functional connectivity in behavioral variant frontotemporal dementia and Alzheimer's disease. J Alzheimers Dis. (2017) 55:521–37. doi: 10.3233/JAD-150695
24. Trojsi F, Caiazzo G, Corbo D, Piccirillo G, Cristillo V, Femiano C, et al. Microstructural changes across different clinical milestones of disease in amyotrophic lateral sclerosis. PLoS ONE. (2015) 10:e0119045. doi: 10.1371/journal.pone.0119045
25. Douaud G, Filippini N, Knight S, Talbot K, Turner MR. Integration of structural and functional magnetic resonance imaging in amyotrophic lateral sclerosis. Brain. (2011) 134(Pt 12):3470–9. doi: 10.1093/brain/awr279
26. Heimrath J, Gorges M, Kassubek J, Muller HP, Birbaumer N, Ludolph AC, et al. Additional resources and the default mode network: evidence of increased connectivity and decreased white matter integrity in amyotrophic lateral sclerosis. Amyotroph Lateral Scler Frontotemporal Degener. (2014) 15:537–45. doi: 10.3109/21678421.2014.911914
27. Ma X, Zhang J, Zhang Y, Chen H, Li R, Wang J, et al. Altered cortical hubs in functional brain networks in amyotrophic lateral sclerosis. Neurol Sci. (2015) 36:2097–104. doi: 10.1007/s10072-015-2319-6
28. Schulthess I, Gorges M, Müller H-P, Lulé D, Del Tredici K, Ludolph AC, et al. Functional connectivity changes resemble patterns of pTDP-43 pathology in amyotrophic lateral sclerosis. Sci Rep. (2016) 6:38391. doi: 10.1038/srep38391
29. Mohammadi B, Kollewe K, Samii A, Krampfl K, Dengler R, Munte TF. Changes of resting state brain networks in amyotrophic lateral sclerosis. Exp Neurol. (2009) 217:147–53. doi: 10.1016/j.expneurol.2009.01.025
30. Tedeschi G, Trojsi F, Tessitore A, Corbo D, Sagnelli A, Paccone A, et al. Interaction between aging and neurodegeneration in amyotrophic lateral sclerosis. Neurobiol Aging. (2012) 33:886–98. doi: 10.1016/j.neurobiolaging.2010.07.011
31. Zhang J, Ji B, Hu J, Zhou C, Li L, Li Z, et al. Aberrant interhemispheric homotopic functional and structural connectivity in amyotrophic lateral sclerosis. J Neurol Neurosurg Psychiatry. (2016) 88:369–370. doi: 10.1136/jnnp-2016-314567
32. Zhou C, Hu X, Hu J, Liang M, Yin X, Chen L, et al. Altered brain network in amyotrophic lateral sclerosis: a resting graph theory-based network study at voxel-wise level. Front Neurosci. (2016) 10:204. doi: 10.3389/fnins.2016.00204
33. Agosta F, Sala S, Valsasina P, Meani A, Canu E, Magnani G, et al. Brain network connectivity assessed using graph theory in frontotemporal dementia. Neurology. (2013) 81:134–43. doi: 10.1212/WNL.0b013e31829a33f8
34. Loewe K, Machts J, Kaufmann J, Petri S, Heinze H-J, Borgelt C, et al. Widespread temporo-occipital lobe dysfunction in amyotrophic lateral sclerosis. Sci Rep. (2017) 7:40252. doi: 10.1038/srep40252
35. Trojsi F, Esposito F, de Stefano M, Buonanno D, Conforti FL, Corbo D, et al. Functional overlap and divergence between ALS and bvFTD. Neurobiol Aging. (2015) 36:413–23. doi: 10.1016/j.neurobiolaging.2014.06.025
36. Verstraete E, van den Heuvel MP, Veldink JH, Blanken N, Mandl RC, Hulshoff Pol HE, et al. Motor network degeneration in amyotrophic lateral sclerosis: a structural and functional connectivity study. PLoS ONE. (2010) 5:e13664. doi: 10.1371/journal.pone.0013664
37. Rubinov M, Sporns O. Complex network measures of brain connectivity: uses and interpretations. Neuroimage. (2010) 52:1059–69. doi: 10.1016/j.neuroimage.2009.10.003
38. Ludolph A, Drory VE, Hardiman O, Nakano I, Ravits J, Robberecht W, et al. A revision of the El escorial criteria-2015. Amyotroph Lateral Scler and Frontotemporal Dementia. (2015) 16:291–82. doi: 10.3109/21678421.2015.1049183
39. Rascovsky K, Hodges JR, Knopman D, Mendez MF, Kramer JH, Neuhaus J, et al. Sensitivity of revised diagnostic criteria for the behavioural variant of frontotemporal dementia. Brain. (2011) 134(Pt 9):2456–77. doi: 10.1093/brain/awr179
40. Cedarbaum JM, Stambler N, Malta E, Fuller C, Hilt D, Thurmond B, et al. The ALSFRS-R: a revised ALS functional rating scale that incorporates assessments of respiratory function. BDNF ALS study group (phase III). J Neurol Sci. (1999) 169:13–21. doi: 10.1016/S0022-510X(99)00210-5
41. Kertesz A, Davidson W, Fox H. Frontal Behavioral inventory: diagnostic criteria for frontal lobe dementi. Can J Neurol Sci. (1997) 24:29–36. doi: 10.1017/S0317167100021053
42. Desikan RS, Segonne F, Fischl B, Quinn BT, Dickerson BC, Blacker D, et al. An automated labeling system for subdividing the human cerebral cortex on MRI scans into gyral based regions of interest. NeuroImage. (2006) 31:968–80. doi: 10.1016/j.neuroimage.2006.01.021
43. Power JD, Barnes KA, Snyder AZ, Schlaggar BL, Petersen SE. Spurious but systematic correlations in functional connectivity MRI networks arise from subject motion. NeuroImage. (2012) 59:2142–54. doi: 10.1016/j.neuroimage.2011.10.018
44. Nichols TE, Holmes AP. Nonparametric permutation tests for functional neuroimaging: a primer with examples. Hum Brain Mapp. (2002) 15:1–25. doi: 10.1002/hbm.1058
45. Fornito A, Zalesky A, Bullmore E. Fundamentals of Brain Network Analysis. London: Academic Press (2016).
46. Filippi M, Agosta F, Scola E, Canu E, Magnani G, Marcone A, et al. Functional network connectivity in the behavioral variant of frontotemporal dementia. Cortex. (2013) 49:2389–401. doi: 10.1016/j.cortex.2012.09.017
47. Hafkemeijer A, Möller C, Dopper EG, Jiskoot LC, Schouten TM, van Swieten JC, et al. Resting state functional connectivity differences between behavioral variant frontotemporal dementia and Alzheimer's disease. Front Hum Neurosci. (2015) 9:474. doi: 10.3389/fnhum.2015.00474
48. Jastorff J, De Winter FL, Van den Stock J, Vandenberghe R, Giese MA, Vandenbulcke M. Functional dissociation between anterior temporal lobe and inferior frontal gyrus in the processing of dynamic body expressions: insights from behavioral variant frontotemporal dementia. Hum Brain Mapp. (2016) 37:4472–86. doi: 10.1002/hbm.23322
49. Meijboom R, Steketee R, de Koning I, Osse RJ, Jiskoot L, De Jong FJ, et al. Functional connectivity and microstructural white matter changes in phenocopy frontotemporal dementia. Eur Radiol. (2017) 27:1352–60. doi: 10.1007/s00330-016-4490-4
50. Meijboom R, Steketee RM, Ham LS, van der Lugt A, van Swieten JC, Smits M. Differential Hemispheric predilection of microstructural white matter and functional connectivity abnormalities between respectively semantic and behavioral variant frontotemporal dementia. J Alzheimers Dis. (2017) 56:789–804. doi: 10.3233/JAD-160564
51. Tuovinen T, Rytty R, Moilanen V, Elseoud AA, Veijola J, Remes AM, et al. The effect of gray matter ICA and coefficient of variation mapping of BOLD data on the detection of functional connectivity changes in Alzheimer's disease and bvFTD. Front Hum Neurosci. (2016) 10:680. doi: 10.3389/fnhum.2016.00680
52. Zhou F, Gong H, Li F, Zhuang Y, Zang Y, Xu R, et al. Altered motor network functional connectivity in amyotrophic lateral sclerosis: a resting-state functional magnetic resonance imaging study. Neuroreport. (2013) 24:657–62. doi: 10.1097/WNR.0b013e328363148c
53. Damoiseaux JS, Rombouts SA, Barkhof F, Scheltens P, Stam CJ, Smith SM, et al. Consistent resting-state networks across healthy subjects. Proc Natl Acad Sci USA. (2006) 103:13848–53. doi: 10.1073/pnas.0601417103
54. Seeley WW, Menon V, Schatzberg AF, Keller J, Glover GH, Kenna H, et al. Dissociable intrinsic connectivity networks for salience processing and executive control. J Neurosci. (2007) 27:2349–56. doi: 10.1523/JNEUROSCI.5587-06.2007
55. Feis RA, Bouts M, de Vos F, Schouten TM, Panman JL, Jiskoot LC, et al. A multimodal MRI-based classification signature emerges just prior to symptom onset in frontotemporal dementia mutation carriers. J Neurol Neurosurg Psychiatry. (2019) 90:1207–14. doi: 10.1136/jnnp-2019-320774
56. Rittman T, Borchert R, Jones S, van Swieten J, Borroni B, Galimberti D, et al. Functional network resilience to pathology in presymptomatic genetic frontotemporal dementia. Neurobiol Aging. (2019) 77:169–77. doi: 10.1016/j.neurobiolaging.2018.12.009
57. Agosta F, Valsasina P, Absinta M, Riva N, Sala S, Prelle A, et al. Sensorimotor functional connectivity changes in amyotrophic lateral sclerosis. Cereb Cortex. (2011) 21:2291–8. doi: 10.1093/cercor/bhr002
58. Mahoney CJ, Downey LE, Ridgway GR, Beck J, Clegg S, Blair M, et al. Longitudinal neuroimaging and neuropsychological profiles of frontotemporal dementia with C9ORF72 expansions. Alzheimers Res Ther. (2012) 4:41. doi: 10.1186/alzrt144
59. Yokoyama JS, Rosen HJ. Neuroimaging features of C9ORF72 expansion. Alzheimers Res Ther. (2012) 4:45. doi: 10.1186/alzrt148
60. Seeley WW, Crawford R, Rascovsky K, Kramer JH, Weiner M, Miller BL, et al. Frontal paralimbic network atrophy in very mild behavioral variant frontotemporal dementia. Arch Neurol. (2008) 65:249–55. doi: 10.1001/archneurol.2007.38
61. Farb NA, Grady CL, Strother S, Tang-Wai DF, Masellis M, Black S, et al. Abnormal network connectivity in frontotemporal dementia: evidence for prefrontal isolation. Cortex. (2013) 49:1856–73. doi: 10.1016/j.cortex.2012.09.008
62. Rytty R, Nikkinen J, Paavola L, Elseoud AA, Moilanen V, Visuri A, et al. GroupICA dual regression analysis of resting state networks in a behavioral variant of frontotemporal dementia. Front Hum Neurosci. (2013) 7:461. doi: 10.3389/fnhum.2013.00461
Keywords: C9orf72, amyotrophic lateral sclerosis, behavioral variant frontotemporal dementia, pre-symptomatic, resting state fMRI, graph theory
Citation: Smallwood Shoukry RF, Clark MG and Floeter MK (2020) Resting State Functional Connectivity Is Decreased Globally Across the C9orf72 Mutation Spectrum. Front. Neurol. 11:598474. doi: 10.3389/fneur.2020.598474
Received: 27 August 2020; Accepted: 22 October 2020;
Published: 19 November 2020.
Edited by:
Hans-Peter Müller, University of Ulm, GermanyReviewed by:
Peter Bede, Trinity College Dublin, IrelandAmgad Droby, Tel Aviv Sourasky Medical Center, Israel
Copyright © 2020 Smallwood Shoukry, Clark and Floeter. This is an open-access article distributed under the terms of the Creative Commons Attribution License (CC BY). The use, distribution or reproduction in other forums is permitted, provided the original author(s) and the copyright owner(s) are credited and that the original publication in this journal is cited, in accordance with accepted academic practice. No use, distribution or reproduction is permitted which does not comply with these terms.
*Correspondence: Mary Kay Floeter, ZmxvZXRlcm1AbmluZHMubmloLmdvdg==
 Rachel F. Smallwood Shoukry
 Michael G. Clark
 Mary Kay Floeter