 Yong Cui1,2
 Wei Zeng3
 Haihui Jiang1,2
 Xiaohui Ren1,2
 Song Lin1,2Yanzhu Fan1,2Yapeng Liu1,2
 Jizong Zhao1,2*
- 1Department of Neurosurgery, Beijing Tiantan Hospital, Capital Medical University, Beijing, China
- 2National Clinical Research Center for Neurological Diseases, Center of Brain Tumor, Beijing Institute for Brain Disorders and Beijing Key Laboratory of Brain Tumor, Beijing, China
- 3Department of Neurosurgery, Beijing Electric Power Hospital, Beijing, China
Objective: To explore the prognostic significance of metabolic parameters in postoperative peritumoral edema zone (PEZ) of patients with glioblastoma (GBM) based on proton magnetic resonance spectroscopy (MRS).
Methods: The postoperative MRS data of 67 patients with GBM from Beijing Tiantan Hospital were retrospectively reviewed. Metabolite ratios including Cho/NAA, Cho/Cr, and NAA/Cr in both postoperative PEZ and contralateral normal brain region were recorded. Log-rank analysis and Cox regression model were used to identify parameters correlated with progression-free survival (PFS) and overall survival (OS).
Results: Compared with the contralateral normal brain region, postoperative PEZ showed a lower ratio of NAA/Cr (1.20 ± 0.42 vs. 1.81 ± 0.48, P < 0.001), and higher ratios of Cho/Cr and Cho/NAA (1.36 ± 0.44 vs. 1.02 ± 0.27, P < 0.001 and 1.32 ± 0.59 vs. 0.57 ± 0.14, P < 0.001). Both the ratios of Cho/NAA and NAA/Cr were identified as prognostic factors in univariate analysis (P < 0.05), while only Cho/NAA ≥ 1.31 was further confirmed as an independent risk factor for early recurrence in the Cox regression model (P < 0.01). According to the factors of MGMT promoter unmethylation, without radiotherapy and Cho/NAA ≥ 1.31, a prognostic scoring scale for GBM was established, which could divide patients into low-risk, moderate-risk, and high-risk groups. There was a significant difference of survival rate between the three groups (P < 0.001).
Conclusions: Higher Cho/NAA ratio in the postoperative PEZ of GBM predicts earlier recurrence and is associated with poor prognosis. The prognostic scoring scale based on clinical, molecular and metabolic parameters of patients with GBM can help doctors to make more precise prediction of survival time and to adjust therapeutic regimens.
Introduction
Glioblastoma (GBM) is the most common primary malignant tumor of central nervous system (1). It is charactered by rapid proliferation, strong invasion to normal tissue, and dismal prognosis (2). Surgical resection plays a vital role in the treatment protocol of patients with GBM (3, 4). And the resection degree has been proved to be closely correlated with patient's clinical outcome (4). Although the gross-total resection (GTR) evaluated from contrast-enhanced T1 weighted imaging can be achieved in nowadays (5, 6), the residual T2 or fluid attenuated inversion recovery (FLAIR) abnormal signal region surrounding the surgical cavity is frequently found in routine clinical practice (7, 8). The components of this region are quite complicated and studies committed to addressing this issue are relatively rare (9). It may be a combined consequence of surgical injury, tumor cells invasion, or even demyelination, etc., which cannot be differentiated normally by routine magnetic resonance imaging (MRI) (10–13).
1H magnetic resonance spectroscopy (1H-MRS) is widely used to non-invasively detect the biochemical index and metabolic changes of intracranial lesions, which plays a vital role in making precise diagnosis and predicting the prognosis of patients (14, 15). 1H-MRS can reinforce the diagnostic confidence in the following three situations in which conventional MRI may be of limited significance: (1) the distinction of neoplastic and non-neoplastic intracranial lesions (16, 17); (2) the differentiation between tumor recurrence and radiation necrosis (18); (3) the role in biopsy guidance and radiotherapy planning (19, 20).
Therefore, in this study, the residual T2/FLAIR abnormal signal region surrounding the surgical cavity was defined as postoperative peritumoral edema zone (PEZ), which was the major cause of tumor recurrence of GBM. Our primary objective was to compare the metabolic parameters between postoperative PEZ and contralateral region, and further explore the clinical significance of these properties in predicting tumor recurrence.
Materials and Methods
Patients Cohort
A total number of 67 patients with diagnosis of GBM were surgically treated in the Neurosurgery department IV of Beijing Tiantan Hospital from January 2014 to August 2015. All patients underwent routine and enhanced MRI and MRS within 48–72 h after operation. Volumetric calculation of tumor has been fully described in a prior study (3). The extent of resection (EOR) was evaluated by two experienced neuro-radiologists who were blinded to clinical information of patients, according to the following equation: (preoperative tumor volume – postoperative tumor volume) / preoperative tumor volume. The EOR for each patient was classified as either GTR (>99%), near-total resection (NTR) (95–99%), or subtotal resection (STR) (80–95%). All pathological slides were morphologically examined and graded according to the World Health Organization (WHO) Classification of Tumors of the Central Nervous System (21, 22). Once pathological diagnosis was confirmed, all the patients were recommended to receive standard Stupp protocol (23). Briefly, radiotherapy divided into 30 daily fractions of 2 Gy each was delivered to patients within 1 month after operation. Concomitant chemotherapy consisted of temozolomide (TMZ) at a dose of 75 mg/m2/d was given during the whole procedure of radiotherapy. After a 4-weeks break, patients would receive six cycles of adjuvant TMZ at a dose of 150–200 mg/m2/d for 5 days in every 28 days. Unfortunately, seven patients, in this study, quit the continued treatment after operation for personal reason.
Acquisition of MRI Data
All MRI data acquisition was performed on a 3.0 Tesla scanner (Siemens Magnetom Trio Tim, Germany) (Figure 1). The routine sequences included T1-weighted imaging, T2-weighted imaging, and contrast-enhanced imaging. The specific scanning protocol of axial/sagittal T1Flair was field of view (FOV) 240 × 240 mm2, matrix 256 × 256, slice thickness 5 mm, spacing 1 mm, time of repetition (TR) 1,500 ms, time of echo (TE) 13 ms, echo train length (ETL) 5, average 1, and scan time of 1 min and 23 s. The specific scanning protocol of Axial T2Flair was FOV 240 × 240 mm2, matrix 256 × 180, slice thickness 5 mm, spacing 1 mm, TR 8,000 ms, TE 13 ms, time of inversion (TI) 2,500 ms, ETL 17, average 1, and scan time of 1 min and 48 s. 1H-MRS data was acquired using a 3D MRS sequence with point-resolved spectroscopy (PRESS). Acquisition parameters were as follows: TE 135 ms, TR 1,700 ms, FOV 160 × 160 mm2, slice thickness 15 mm, voxel sizes 10 × 10 × 15 mm3, average 3, and scan time of 6 min and 53 s. Spectral bandwidth was 2,000 Hz and number of points was 1,024 points. The postoperative PEZ was defined as target region and the contralateral mirror area of target region was served as reference, avoiding bone, subcutaneous fat, hemorrhage, and infarction. Six voxels per case were placed in the target region in order to cover as much of the image abnormality as possible. For cases with residual tumor, at least one voxel was placed on the enhanced region. The relative amounts (area under the curve) of the signals from N-acetyl-aspartate (NAA), choline (Cho), and creatine (Cr) in the target and reference voxels were measured. The MRS detection mentioned above was performed by two independent neuro-radiologists who were blinded to the outcomes of patients. The mean ratios of Cho/NAA, Cho/Cr, NAA/Cr of 12 voxels from two neuro-radiologists was calculated for each patient.
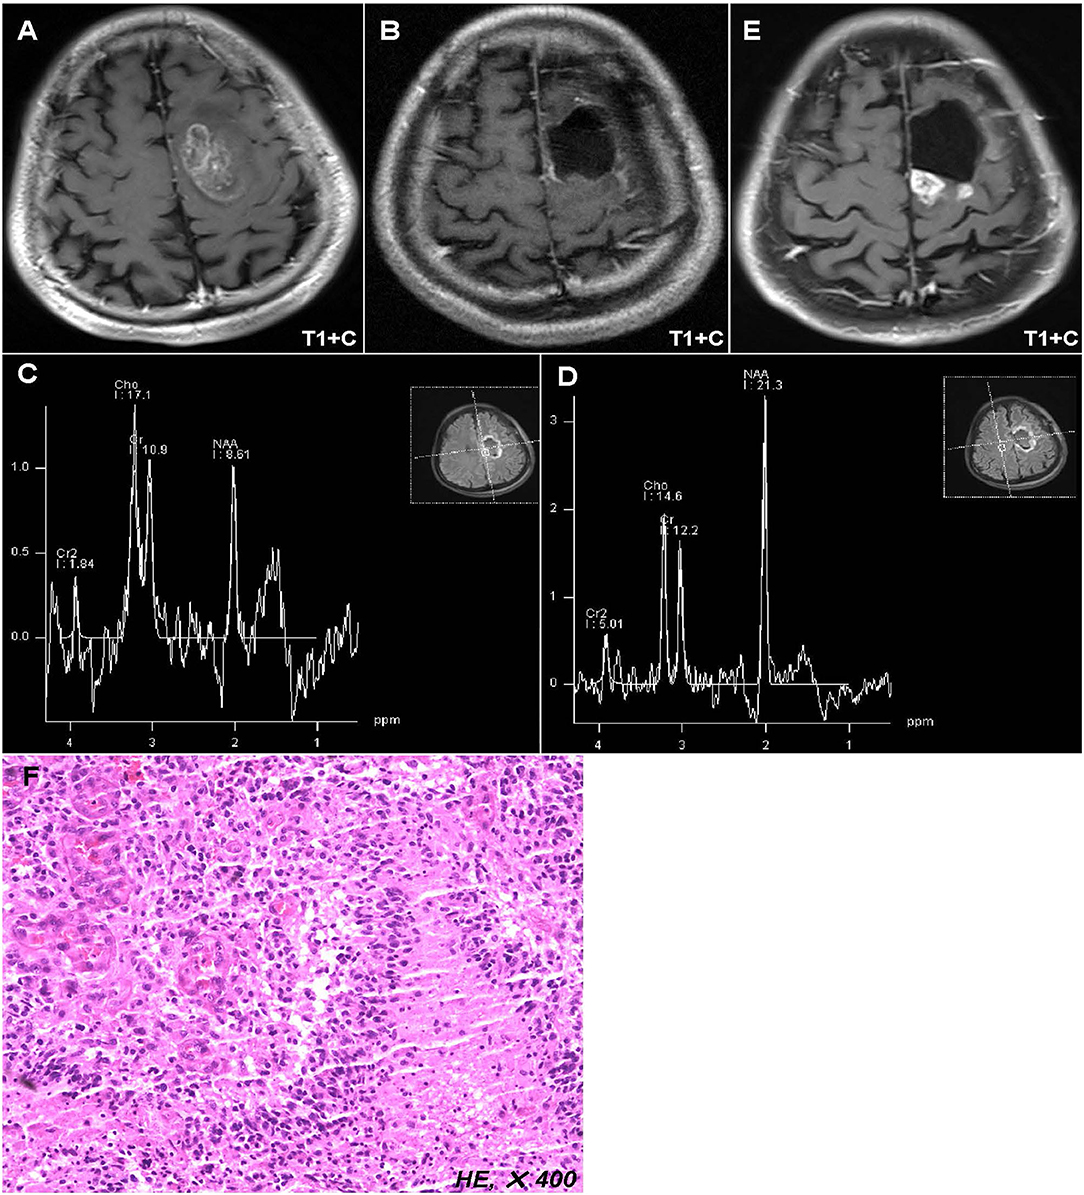
Figure 1. Representative case of this study. Preoperative MR images showed a lesion located in the left anterior central gyrus and supplementary motor area (A). Postoperative MR images displayed that the tumor has been totally removed (B), while the postoperative peritumoral zone showed a higher ratio of Cho/NAA (>1.31) than that in the contralateral region (C,D). Twelve months after operation, the MR images showed a new enhanced lesion in the peritumoral zone (E), which was further confirmed as tumor recurrence by biopsy (F).
Follow-Up
Patients were followed up using MRI scans with an interval of 3 months after operation, or 1 month if necessary. Multimodal MR including perfusion, diffusion and MRS was used to rule out radiation necrosis and pseudoprogression. All the patients enrolled in this study would be followed until death. Progression-free survival (PFS) was defined as the time period from the date of operation to date of tumor recurrence or last follow-up. Overall survival (OS) was defined as the time period from the date of operation to the date of death or last follow-up. At the time of data analysis, the median follow-up of this cohort was 44.0 (range: 3.0–58.0) months, and there were 59 (88.1%) patients progressed and 47 (70.1%) patients died.
Statistical Analysis
Summary of data are presented as the mean ± SD for parametric variables and percentage for categorical variables. For the comparison of the metabolic ratios between target and reference regions, paired t-test was performed. Receiver operating characteristic (ROC) curves were constructed and were used to determine the area under the curve (AUC) and the optimal cutoff of metabolic ratios in predicting recurrence. Survival as a function of time was plotted using the Kaplan-Meier method, and the Log-rank analysis was used to compare Kaplan-Meier plots. Multivariate proportional hazard regression analysis was used to identify factors associated with PFS and OS. In this analysis, all variables associated with survival in univariate analysis (P < 0.05) were included in a step-wise multivariate proportional hazard regression model. All data were analyzed with SPSS software package version 22.0, IBM Corporation, Armonk, NY, USA. Probability values were obtained using 2-sided tests, with statistical significance defined as P < 0.05.
Results
Overall Characteristics of Study Population
The baseline characteristics of the 67 patients with supratentorial GBM were summarized in Table 1. There were 41 (61.2%) male and 26 (38.8%) female patients with a mean age of 47.1 ± 11.6 years). Of the 67 patients, 23 (34.3%) with tumor located in one lobe, 28 (41.8%) in two lobes, 12 (17.9%) in three lobes, and 4 (6.0%) in four lobes. GTR was achieved in 49 (73.1%) patients, NTR in 13 (19.4%) patients, and STR in 5 (7.5%) patients. Chromosome 1p/19q was intact in all detected cases and only 6 (9.0%) patients harbored isocitrate dehydrogenase (IDH) mutation. Thirty-five (52.2%) patients were identified with O6-methylguanine-DNA-methyltransferase (MGMT) promoter methylation.
Table 1. Baseline characteristics for all patients with GBM.
Comparisons of Metabolic Parameters Between PEZ and Contralateral Brain Region
The mean ratios of Cho/NAA, Cho/Cr, and NAA/Cr in the postoperative PEZ (target region) were 1.32 ± 0.59, 1.36 ± 0.44, and 1.20 ± 0.42, respectively; while the mean ratios of Cho/NAA, Cho/Cr and NAA/Cr in the contralateral brain region (reference region) were 0.57 ± 0.14, 1.02 ± 0.27, and 1.81 ± 0.48, respectively (Supplementary Table 1). Compared with the reference region, ratios of Cho/NAA and Cho/Cr in the target region were remarkably increased, but the ratio of NAA/Cr was significantly decreased (P < 0.001, Figure 2).
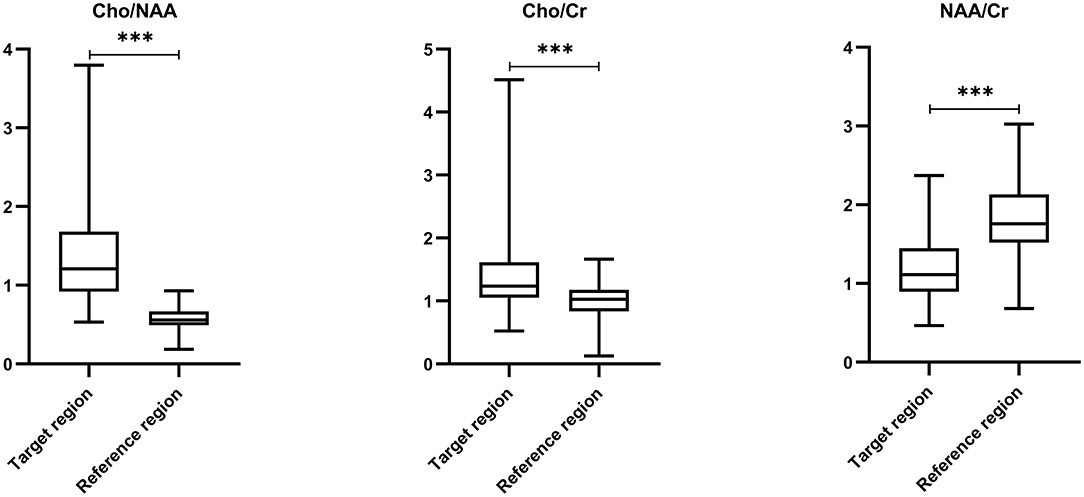
Figure 2. Comparisons of metabolic ratios between target and reference regions by paired t-test. Comparing with reference region, ratios of Cho/NAA (0.57 ± 0.14 vs. 1.32 ± 0.59) and Cho/Cr (1.02 ± 0.27 vs. 1.36 ± 0.44) in the target region were remarkably increased, but the ratio of NAA/Cr (1.81 ± 0.48 vs. 1.20 ± 0.42) was significantly decreased (P < 0.001). *** p < 0.001.
Values of Metabolic Parameters in Predicting Tumor Recurrence
We used ROC curves to determine the optimal cutoff ratios of Cho/NAA, Cho/Cr, and NAA/Cr in predicting tumor recurrence. As the median PFS of our cohort was 10.0 months, 10-months recurrence was selected to serve as the observation point. According to the results of ROC analyses, the cutoff ratio of Cho/NAA was 1.31 with an AUC of 0.731 (95% confidence interval [CI]: 0.607–0.856, P = 0.001). The sensitivity and specificity were 82.4 and 66.7% for recurrence, respectively. The cutoff ratio of Cho/Cr was 1.43 with an AUC of 0.542 (95% CI: 0.402–0.683, P = 0.551). The sensitivity and specificity were 73.5 and 45.5% for recurrence, respectively. The cutoff ratio of NAA/Cr was 1.10 with an AUC of 0.754 (95% CI: 0.635–0.872, P < 0.001). The sensitivity and specificity were 76.5 and 69.7% for recurrence, respectively (Figure 3).
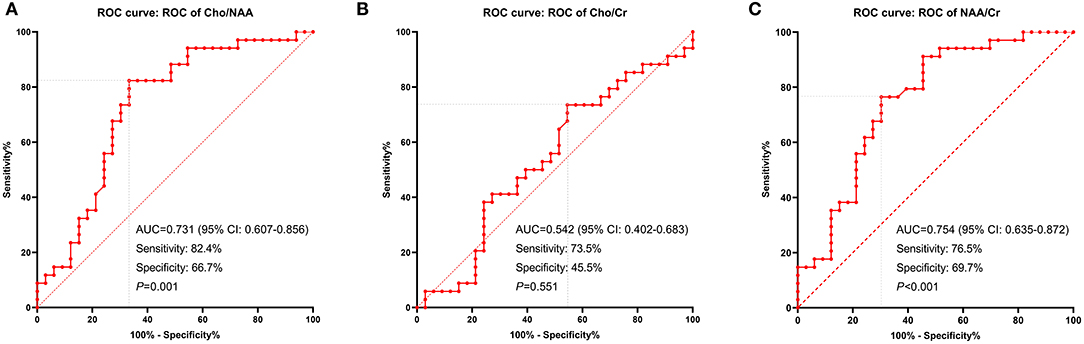
Figure 3. ROC curves displaying the metabolic ratios: Cho/NAA (A), Cho/Cr (B), and NAA/Cr (C) in recurrence prediction. The cutoff ratio of Cho/NAA was 1.31 with an area under the curve (AUC) of 0.731 (P = 0.001). The cutoff ratio of Cho/Cr was 1.43 with an AUC of 0.542 (P = 0.551). The cutoff ratio of NAA/Cr was 1.10 with an AUC of 0.754 (P < 0.001).
Univariate and Multivariate Survival Analysis
Univariate analysis showed that EOR, radiotherapy, chemotherapy, MGMT promoter methylation, and ratios of Cho/NAA and NAA/Cr were correlated with PFS and OS (P < 0.05) (Table 2). All these factors correlated with PFS and OS were further enrolled in Cox multivariate analysis. In the Cox proportional hazards regression model, radiotherapy, MGMT promoter methylation and Cho/NAA ratio were confirmed as independent factors associated with both PFS (hazard ratio [HR] = 0.417, 95% CI: 0.174–0.996, P = 0.049; HR = 0.401, 95% CI: 0.233–0.690, P = 0.001; HR = 2.959, 95% CI: 1.706–5.132, P < 0.001, respectively) and OS (HR = 0.083, 95% CI: 0.030–0.230, P < 0.001; HR = 0.290, 95% CI: 0.156–0.539, P < 0.001; HR = 2.755, 95% CI: 1.512–5.020, P = 0.001, respectively) (Table 2).
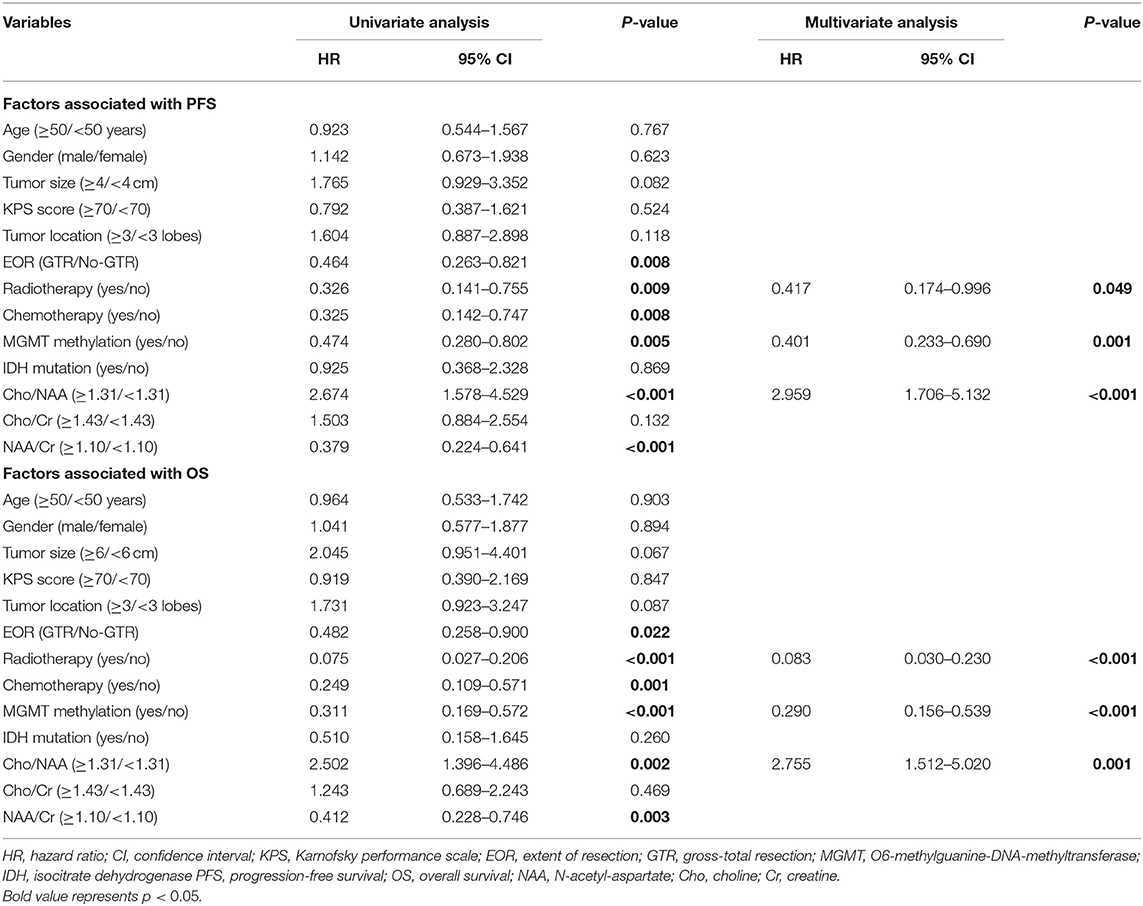
Table 2. Univariate and multivariate survival analysis in all patients.
A Proposed Prognostic Scoring Scale for GBM
According to the independent prognostic factors identified by the multivariate Cox proportional hazards regression model, a prognostic scoring scale was thereby proposed. Briefly, one point was assigned for each of the prognostic risk factors (MGMT promoter unmethylation, without radiotherapy, and Cho/NAA ≥ 1.31). Accordingly, the patients would get a score ranging from 0 to 3 points. Then patients with a score of 0, 1, and equal or more than 2, could be respectively divided into low-risk, moderate-risk, and high-risk subgroups. The median PFS for patients in low-risk, moderate-risk and high-risk groups was 18.0, 11.0, and 5.5 months, respectively, which conferred a significant difference according to the log-rank analysis (P < 0.001) (Figure 4A). Meanwhile, a similar survival tendency was also observed in terms of OS among the three subgroups (P < 0.001) (Figure 4B).
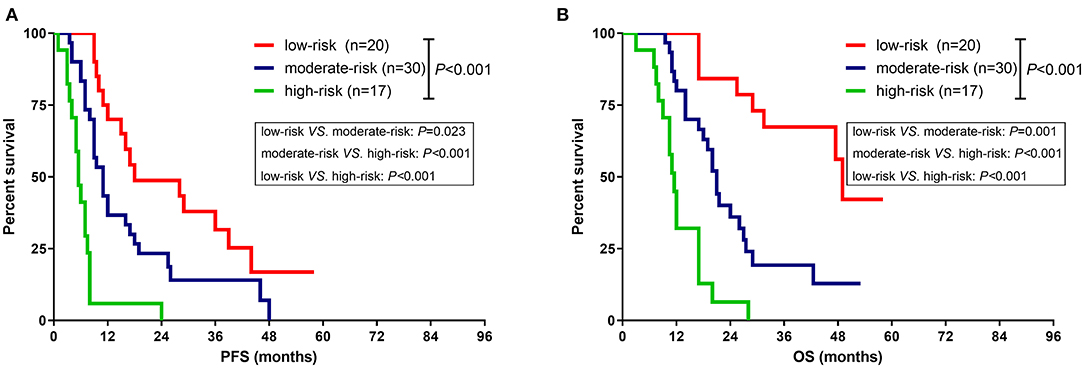
Figure 4. Comparison of survival rate between different subgroups based on the prognostic scoring scale. (A) The median PFS for patients in low-risk, moderate-risk and high-risk groups was 18.0, 11.0, and 5.5 months, respectively, which imparted a significant difference (P < 0.001). (B) The median OS for patients in low-risk, moderate-risk and high-risk groups was 49.0, 21.0, and 11.5 months, respectively, which imparted a significant difference (P < 0.001).
Illustrative Case
A 42-years-old male who complained of right limb weakness for 2 months was admitted in our hospital with radiological diagnosis of high-grade glioma. Neurological examination found that the muscle strength of right limbs was grade IV. Radiological result showed a round-like lesion with contrast enhancement in the left anterior central gyrus and supplementary motor area (Figure 1A). The patient underwent surgical resection in our hospital. Postoperative MR implied the enhanced tumor was totally removed (Figure 1B), while the peritumoral zone with abnormal T2/FLAIR signal showed a higher ratio of Cho/NAA (>1.31) than that in the contralateral region (Figures 1C,D). After operation, the patient received concurrent chemoradiotherapy and six cycles adjuvant chemotherapy. Twelve months post of operation, the patient was hospitalized again in our department because of seizures. The MR images showed a new enhanced lesion in the peritumoral zone where initially conferred a higher ratio of Cho/NAA (Figure 1E). To rule out radiation necrosis and pseudoprogression, stereotactic biopsy was performed. And final result confirmed the tumor recurrence (Figure 1F).
Discussion
GBM, unlike the circumscribed glioma, commonly spreads along the axonal, vascular or subarachnoid space (24). The infiltrated extent of GBM is traditionally refer to the central region on contrast-enhanced T1-weighted images which includes both enhancement and necrosis. However, this central region, to a certain degree, is smaller than the truly infiltrated extent of tumor (25, 26). In contrast, the abnormal region with hyper intensity signal on T2/FLAIR image which reflects a combined consequence of tumor and edema, is larger than the truly infiltrated extent of tumor (27, 28). It's well-established that peritumoral edema is frequently presented in malignant glioma, metastases, and meningioma (29–31). The degree and range of peritumoral edema is correlated with tumor malignancy, and can be used to predict the prognosis of patients (32). Therefore, the peritumoral edema zone (PEZ) is worthy to make further exploration and research.
Given the PEZ was infiltrated with tumor cells which has been validated by histopathological examination, several studies tried to explore the clinical implication of extensively resecting PEZ (3, 33). Li et al., in 2016, conducted a study based on a larger single-center series of GBM patients in order to disclose the association between EOR and prognosis and found that additional resection of PEZ could prolong the survival of patients with GBM (33). Meanwhile, our previous study showed that patients with proliferation-dominant and/or IDH-mutant high-grade astrocytoma could benefit from extensive resection of the FLAIR abnormality region (3). However, current assessment of EOR of patients with GBM is mainly dependent on contrast-enhanced T1-weighted images. Patients who achieved complete removal of the contrast-enhanced region can be defined as gross-total resection. It indicates that the PEZ which is considered as the major origin of tumor recurrence has been remained during operation. How to monitor the change of tumor burden in PEZ is of great significance.
MRS is an imaging technique which can non-invasively detect the metabolism and biochemical changes of tissue. It has been used to differentiate tumor from edema in the PEZ of intracranial malignancies (34, 35). In this study, we systematically analyzed the metabolic changes in postoperative PEZ of patients with GBM. To our knowledge, it's the first study that devoted to disclosing the relationship between metabolic parameters in postoperative PEZ and tumor recurrence. The most important finding was that higher Cho/NAA ratio in postoperative PEZ was associated with early recurrence and the prognostic implication of Cho/NAA has been further confirmed in multivariate analysis. Theoretically, a higher ratio of Cho/NAA implies a more destruction of neuron and a stronger activity of tumor cells (36). This is the reason for higher Cho/NAA ratio in postoperative PEZ harboring poor prognosis. Cordova and colleagues maintained that Cho/NAA could not only identify regions at high risk for contrast-enhancing recurrence, but also show a significant association with PFS in the cohort of GBM patients (37). Tarnawski et al. (38) prospectively analyzed the postoperative tumor bed of 51 patients with malignant gliomas using MRS and found that the ratios of Cho/Cr, Cho/NAA, and myo-inosytol/Cr in PEZ were remarkably increased, but the ratio of NAA/Cr was significantly decreased, which was consistent with our results. They also reported that Lac/NAA > 2 was a strong independent prognostic risk factor (38). In 2015, Tolia et al. explored the prognostic value of MRS metabolites in postoperative irradiated high-grade gliomas and found that Cho/Cr ≥ 2 was associated with earlier recurrence (39). All these results support the hypothesis that substantial tumor cells do exist in PEZ and spectroscopy can provide accurate tumor metabolism information for physicians to better control gliomas.
The second valuable and interesting finding in our study was that patients could be divided into low-risk, moderate-risk, and high-risk subgroups with distinct survival time according to a scoring scale based on the prognostic parameters of radiotherapy, MGMT promoter, and ratio of Cho/NAA. This prognostic scoring scale could lead to an incremental increase in the strength of survival prediction. Li et al. built a survival tree based on older age, larger contrast enhancement, higher ratios of Cho/Cr, Cho/NAA, and lactate/lipid, and lower ratio of Cr/NAA in order to better predict survival (40). But the operation of this survival tree was complicated which limited the use of it in clinical practice. Similarly, TCGA Glioma Phenotype Research Group established a model based on clinical, imaging, and genetic variables which showed the highest accuracy in predicting survival (41). However, the AUC of this predicting model was only 0.679 ± 0.068, which implied a low stability and reliability. In 2019, Gandia-Gonzalez et al. proposed an OS prediction model based on the metabolic markers for patients with glioma, which could do help to make more precise therapeutic decisions (42). Unfortunately, molecular biomarkers have not been included in the model. Therefore, our presented model seems to be relatively stable, easy to use, and more practical.
This study has limitations common to other retrospectively designed studies. First, the sample size is relatively small. However, even given the small sample size, the analytical methods are robust enough to describe the significance of metabolic parameters in predicting tumor recurrence. Second, some patients still fail to reach endpoint event. In the future, we will continue this study until all patients died in order to recheck our results and conclusions. Moreover, several important molecular biomarkers, such as telomerase reverse transcriptase (TERT), phosphate and tension homology deleted on chromosome ten (PTEN), etc., have not been included in our prognostic scoring scale. In spite of these limitations, our study reported some interesting and important findings which might help to extend the application of MRS in the assessment of early recurrence and prognosis prediction of patients with GBM.
Conclusions
The ratio of Cho/NAA ≥ 1.31 in postoperative PEZ predicts earlier recurrence and is associated with poor prognosis. The prognostic scoring scale based on clinical, molecular and metabolic parameters of patients with GBM can contribute to making more precise prediction of survival time and adjusting therapeutic regimens timely.
Data Availability Statement
All data supporting the conclusions of this article are available on request from any qualified investigator.
Ethics Statement
The studies involving human participants were reviewed and approved by Institutional review board of Capital Medical University. The patients/participants provided their written informed consent to participate in this study.
Author Contributions
YC, WZ, and XR: acquisition of data. YC, WZ, and HJ: analysis and interpretation of data and drafting the article. YC, HJ, and XR: statistical analysis. SL and YC: funding acquisition. YC and JZ: conception and design. JZ: study supervision. All authors contributed to the article and approved the submitted version.
Funding
This work was supported by the National Natural Science Foundation of China (81771309) and the Capital's Funds for Health Improvement and Research (2020-2-1075).
Conflict of Interest
The authors declare that the research was conducted in the absence of any commercial or financial relationships that could be construed as a potential conflict of interest.
Acknowledgments
The authors would like to thank Dr. Gehong Dong, and Dr. Guang Li, Department of Pathology, Beijing Tiantan Hospital, Capital Medical University, for pathology diagnosis. We also appreciate Dr. Hongyan Chen and Prof. Xuzhu Chen, Department of Neuroradiology, Beijing Tiantan Hospital, Capital Medical University, for the evaluation of EOR and metabolic ratios.
Supplementary Material
The Supplementary Material for this article can be found online at: https://www.frontiersin.org/articles/10.3389/fneur.2020.592155/full#supplementary-material
References
1. Ostrom QT, Cioffi G, Gittleman H, Patil N, Waite K, Kruchko C, et al. CBTRUS statistical report: primary brain and other central nervous system tumors diagnosed in the United States in 2012–2016. Neuro Oncol. (2019) 21(Suppl.5):v1. doi: 10.1093/neuonc/noz150
2. Alexander BM, Cloughesy TF. Adult glioblastoma. J Clin Oncol. (2017) 35:2402–9. doi: 10.1200/JCO.2017.73.0119
3. Jiang H, Cui Y, Liu X, Ren X, Li M, Lin S. Proliferation-dominant high-grade astrocytoma: survival benefit associated with extensive resection of FLAIR abnormality region. J Neurosurg. (2019) 132:998–1005. doi: 10.3171/2018.12.JNS182775
4. Brown TJ, Brennan MC, Li M, Church EW, Brandmeir NJ, Rakszawski KL, et al. Association of the extent of resection with survival in glioblastoma: a systematic review and meta-analysis. JAMA Oncol. (2016) 2:1460–9. doi: 10.1001/jamaoncol.2016.1373
5. Suero Molina E, Wolfer J, Ewelt C, Ehrhardt A, Brokinkel B, Stummer W. Dual-labeling with 5-aminolevulinic acid and fluorescein for fluorescence-guided resection of high-grade gliomas: technical note. J Neurosurg. (2018) 128:399–405. doi: 10.3171/2016.11.JNS161072
6. D'Amico RS, Kennedy BC, Bruce JN. Neurosurgical oncology: advances in operative technologies and adjuncts. J Neurooncol. (2014) 119:451–63. doi: 10.1007/s11060-014-1493-3
7. Yano H, Nakayama N, Ohe N, Miwa K, Shinoda J, Iwama T. Pathological analysis of the surgical margins of resected glioblastomas excised using photodynamic visualization with both 5-aminolevulinic acid and fluorescein sodium. J Neurooncol. (2017) 133:389–97. doi: 10.1007/s11060-017-2445-5
8. Elson A, Bovi J, Siker M, Schultz C, Paulson E. Evaluation of absolute and normalized apparent diffusion coefficient (ADC) values within the post-operative T2/FLAIR volume as adverse prognostic indicators in glioblastoma. J Neurooncol. (2015) 122:549–58. doi: 10.1007/s11060-015-1743-z
9. Yan JL, Li C, Boonzaier NR, Fountain DM, Larkin TJ, Matys T, et al. Multimodal MRI characteristics of the glioblastoma infiltration beyond contrast enhancement. Ther Adv Neurol Disord. (2019) 12:1756286419844664. doi: 10.1177/1756286419844664
10. Lama G, Mangiola A, Anile C, Sabatino G, de Bonis P, Lauriola L, et al. Activated ERK1/2 expression in glioblastoma multiforme and in peritumor tissue. Int J Oncol. (2007) 30:1333–42. doi: 10.3892/ijo.30.6.1333
11. Mangiola A, Lama G, Giannitelli C, de Bonis P, Anile C, Lauriola L, et al. Stem cell marker nestin and c-Jun NH2-terminal kinases in tumor and peritumor areas of glioblastoma multiforme: possible prognostic implications. Clin Cancer Res. (2007) 13:6970–7. doi: 10.1158/1078-0432.CCR-07-1229
12. Jensen TR, Schmainda KM. Computer-aided detection of brain tumor invasion using multiparametric MRI. J Magn Reson Imaging. (2009) 30:481–9. doi: 10.1002/jmri.21878
13. Sica G, Lama G, Anile C, Geloso MC, La Torre G, de Bonis P, et al. Assessment of angiogenesis by CD105 and nestin expression in peritumor tissue of glioblastoma. Int J Oncol. (2011) 38:41–9. doi: 10.3892/ijo_00000822
14. Nelson SJ, Kadambi AK, Park I, Li Y, Crane J, Olson M, et al. Association of early changes in 1H MRSI parameters with survival for patients with newly diagnosed glioblastoma receiving a multimodality treatment regimen. Neuro Oncol. (2017) 19:430–9. doi: 10.1093/neuonc/now159
15. Fellows GA, Wright AJ, Sibtain NA, Rich P, Opstad KS, McIntyre DJ, et al. Combined use of neuroradiology and 1H-MR spectroscopy may provide an intervention limiting diagnosis of glioblastoma multiforme. J Magn Reson Imaging. (2010) 32:1038–44. doi: 10.1002/jmri.22350
16. Butzen J, Prost R, Chetty V, Donahue K, Neppl R, Bowen W, et al. Discrimination between neoplastic and nonneoplastic brain lesions by use of proton MR spectroscopy: the limits of accuracy with a logistic regression model. AJNR Am J Neuroradiol. (2000) 21:1213–9.
17. Wijnen JP, Idema AJS, Stawicki M, Lagemaat MW, Wesseling P, Wright AJ, et al. Quantitative short echo time 1H MRSI of the peripheral edematous region of human brain tumors in the differentiation between glioblastoma, metastasis, and meningioma. J Magn Reson Imaging. (2012) 36:1072–82. doi: 10.1002/jmri.23737
18. Zhang H, Ma L, Wang Q, Zheng X, Wu C, Xu BN. Role of magnetic resonance spectroscopy for the differentiation of recurrent glioma from radiation necrosis: a systematic review and meta-analysis. Eur J Radiol. (2014) 83:2181–9. doi: 10.1016/j.ejrad.2014.09.018
19. Dowling C, Bollen AW, Noworolski SM, McDermott MW, Barbaro NM, Day MR, et al. Preoperative proton MR spectroscopic imaging of brain tumors: correlation with histopathologic analysis of resection specimens. AJNR Am J Neuroradiol. (2001) 22:604–12.
20. Pirzkall A, McKnight TR, Graves EE, Carol MP, Sneed PK, Wara WW, et al. MR-spectroscopy guided target delineation for high-grade gliomas. Int J Radiat Oncol Biol Phys. (2001) 50:915–28. doi: 10.1016/S0360-3016(01)01548-6
21. Louis DN, Ohgaki H, Wiestler OD, Cavenee WK, Burger PC, Jouvet A, et al. The 2007 WHO classification of tumours of the central nervous system. Acta Neuropathol. (2007) 114:97–109. doi: 10.1007/s00401-007-0243-4
22. Louis DN, Perry A, Reifenberger G, von Deimling A, Figarella-Branger D, Cavenee WK, et al. The 2016 World health organization classification of tumors of the central nervous system: a summary. Acta Neuropathologica. (2016) 131:803–20. doi: 10.1007/s00401-016-1545-1
23. Stupp R, Mason WP, van den Bent MJ, Weller M, Fisher B, Taphoorn MJB, et al. Radiotherapy plus concomitant and adjuvant temozolomide for glioblastoma. New Engl J Med. (2005) 352:987–96. doi: 10.1056/NEJMoa043330
24. Laws ER, Shaffrey ME. The inherent invasiveness of cerebral gliomas: Implications for clinical management. Int J Dev Neurosci. (1999) 17:413–20. doi: 10.1016/S0736-5748(99)00013-1
25. Kalpathy-Cranner J, Gerstner ER, Emblen KE, Andronesi OC, Rosen B. Advanced magnetic resonance imaging of the physical processes in human glioblastoma. Cancer Res. (2014) 74:4622–37. doi: 10.1158/0008-5472.CAN-14-0383
26. Kelly PJ, Daumas-Duport C, Kispert DB, Kall BA, Scheithauer BW, Illig JJ. Imaging-based stereotaxic serial biopsies in untreated intracranial glial neoplasms. J Neurosurg. (1987) 66:865–74. doi: 10.3171/jns.1987.66.6.0865
27. Badie B, Schartner JM, Hagar AR, Prabakaran S, Peebles TR, Bartley B, et al. Microglia cyclooxygenase-2 activity in experimental gliomas: possible role in cerebral edema formation. Clin Cancer Res. (2003) 9:872–7.
28. Blystad I, Warntjes JBM, Smedby O, Lundberg P, Larsson EM, Tisell A. Quantitative MRI for analysis of peritumoral edema in malignant gliomas. PLoS ONE. (2017) 12:e0177135. doi: 10.1371/journal.pone.0177135
29. Wang W, Da R, Wang MD, Wang T, Qi L, Jiang HT, et al. Expression of brain-specific angiogenesis inhibitor 1 is inversely correlated with pathological grade, angiogenesis and peritumoral brain edema in human astrocytomas. Oncol Lett. (2013) 5:1513–8. doi: 10.3892/ol.2013.1250
30. Tsao MN, Khuntia D, Mehta MP. Brain metastases: what's new with an old problem? Curr Opin Support Pa. (2012) 6:85–90. doi: 10.1097/SPC.0b013e32834de714
31. Nassehi D, Dyrbye H, Andresen M, Thomsen C, Juhler M, Laursen H, et al. Vascular endothelial growth factor A protein level and gene expression in intracranial meningiomas with brain edema. Apmis. (2011) 119:831–43. doi: 10.1111/j.1600-0463.2011.02764.x
32. Wu CX, Lin GS, Lin ZX, Zhang JD, Chen L, Liu SY, et al. Peritumoral edema on magnetic resonance imaging predicts a poor clinical outcome in malignant glioma. Oncol Lett. (2015) 10:2769–76. doi: 10.3892/ol.2015.3639
33. Li YM, Suki D, Hess K, Sawaya R. The influence of maximum safe resection of glioblastoma on survival in 1229 patients: can we do better than gross-total resection? J Neurosurg. (2016) 124:977–88. doi: 10.3171/2015.5.JNS142087
34. Law M, Cha S, Knopp EA, Johnson G, Arnett J, Litt AW. High-grade gliomas and solitary metastases: differentiation by using perfusion and proton spectroscopic MR imaging. Radiology. (2002) 222:715–21. doi: 10.1148/radiol.2223010558
35. Kuznetsov YE, Caramanos Z, Antel SB, Preul MC, Leblanc R, Villemure JG, et al. Proton magnetic resonance spectroscopic imaging can predict length of survival in patients with supratentorial gliomas. Neurosurgery. (2003) 53:565–74. doi: 10.1227/01.NEU.0000079331.21178.8E
36. Guo J, Yao CJ, Chen H, Zhuang DX, Tang WJ, Ren G, et al. The relationship between Cho/NAA and glioma metabolism: implementation for margin delineation of cerebral gliomas. Acta Neurochir. (2012) 154:1361–70. doi: 10.1007/s00701-012-1418-x
37. Cordova JS, Shu H-KG, Liang Z, Gurbani SS, Cooper LAD, Holder CA, et al. Whole-brain spectroscopic MRI biomarkers identify infiltrating margins in glioblastoma patients. Neuro-oncology. (2016) 18:1180–9. doi: 10.1093/neuonc/now036
38. Tarnawski R, Sokol M, Pieniazek P, Maciejewski B, Walecki J, Miszczyk L, et al. 1H-MRS in vivo predicts the early treatment outcome of postoperative radiotherapy for malignant gliomas. Int J Radiat Oncol Biol Phys. (2002) 52:1271–6. doi: 10.1016/S0360-3016(01)02769-9
39. Tolia M, Verganelakis D, Tsoukalas N, Kyrgias G, Papathanasiou M, Mosa E, et al. Prognostic value of MRS metabolites in postoperative irradiated high grade gliomas. BioMed Res Int. (2015) 2015:341042. doi: 10.1155/2015/341042
40. Li X, Jin H, Lu Y, Oh J, Chang S, Nelson SJ. Identification of MRI and 1H MRSI parameters that may predict survival for patients with malignant gliomas. NMR Biomed. (2004) 17:10–20. doi: 10.1002/nbm.858
41. Nicolasjilwan M, Hu Y, Yan CH, Meerzaman D, Holder CA, Gutman D, et al. Addition of MR imaging features and genetic biomarkers strengthens glioblastoma survival prediction in TCGA patients. J Neuroradiol. (2015) 42:212–21. doi: 10.1016/j.neurad.2014.02.006
Keywords: glioblastoma, magnetic resonance spectroscopy, choline abnormality, peritumoral edema zone, recurrence, survival
Citation: Cui Y, Zeng W, Jiang H, Ren X, Lin S, Fan Y, Liu Y and Zhao J (2020) Higher Cho/NAA Ratio in Postoperative Peritumoral Edema Zone Is Associated With Earlier Recurrence of Glioblastoma. Front. Neurol. 11:592155. doi: 10.3389/fneur.2020.592155
Received: 06 August 2020; Accepted: 17 November 2020;
Published: 04 December 2020.
Edited by:
Manoj Kumar, National Institute of Mental Health and Neurosciences (NIMHANS), IndiaReviewed by:
Pradeep Kumar Gupta, University of Pennsylvania, United StatesSanjeev Chawla, University of Pennsylvania, United States
Copyright © 2020 Cui, Zeng, Jiang, Ren, Lin, Fan, Liu and Zhao. This is an open-access article distributed under the terms of the Creative Commons Attribution License (CC BY). The use, distribution or reproduction in other forums is permitted, provided the original author(s) and the copyright owner(s) are credited and that the original publication in this journal is cited, in accordance with accepted academic practice. No use, distribution or reproduction is permitted which does not comply with these terms.
*Correspondence: Jizong Zhao, emhhb2p6MjA1QDE2My5jb20=