 Toni C. Berger1,2*†
 Magnus D. Vigeland3†
 Hanne S. Hjorthaug3Cecilie G. Nome2
 Erik Taubøll1,2Kaja K. Selmer3,4,5†
 Kjell Heuser1,2†
- 1Department of Neurology, Oslo University Hospital, Oslo, Norway
- 2University of Oslo, Oslo, Norway
- 3Department of Medical Genetics, Oslo University Hospital and University of Oslo, Oslo, Norway
- 4Division of Clinical Neuroscience, Department of Research and Innovation, Oslo University Hospital, Oslo, Norway
- 5National Centre for Epilepsy, Oslo University Hospital, Sandvika, Norway
Background and Aims: Morphological changes in mesial temporal lobe epilepsy with hippocampal sclerosis (mTLE-HS) are well-characterized. Yet, it remains elusive whether these are a consequence of seizures or originate from a hitherto unknown underlying pathology. We recently published data on changes in gene expression and DNA methylation in the ipsilateral hippocampus (ILH) using the intracortical kainate mouse model of mTLE-HS. In order to explore the effects of epileptic activity alone and also to further disentangle what triggers morphological alterations, we investigated glial and neuronal changes in gene expression and DNA methylation in the contralateral hippocampus (CLH).
Methods: The intracortical kainic acid mouse model of mTLE-HS was used to elicit status epilepticus. Hippocampi contralateral to the injection site from eight kainate-injected and eight sham mice were extracted and shock frozen at 24 h post-injection. Glial and neuronal nuclei were sorted by flow cytometry. Alterations in gene expression and DNA methylation were assessed using reduced representation bisulfite sequencing and RNA sequencing. The R package edgeR was used for statistical analysis.
Results: The CLH featured substantial, mostly cell-specific changes in both gene expression and DNA methylation in glia and neurons. While changes in gene expression overlapped to a great degree between CLH and ILH, alterations in DNA methylation did not. In the CLH, we found a significantly lower number of glial genes up- and downregulated compared to previous results from the ILH. Furthermore, several genes and pathways potentially involved in anti-epileptogenic effects were upregulated in the CLH. By comparing gene expression data from the CLH to previous results from the ILH (featuring hippocampal sclerosis), we derive potential upstream targets for epileptogenesis, including glial Cox2 and Cxcl10.
Conclusion: Despite the absence of morphological changes, the CLH displays substantial changes in gene expression and DNA methylation. We find that gene expression changes related to potential anti-epileptogenic effects seem to dominate compared to the pro-epileptogenic effects in the CLH and speculate whether this imbalance contributes to prevent morphological alterations like neuronal death and reactive gliosis.
Introduction
Epileptogenesis describes the transformation of a normally functioning brain into an epileptic brain (1, 2). For mesial temporal lobe epilepsy with hippocampal sclerosis (mTLE-HS), this process often involves an initial incident (i.e., prolonged febrile seizure, inflammation, or cerebral trauma), followed by a clinically silent latent phase, and, ultimately, seizures of increasing frequency and severity (3). Pathological hallmarks of mTLE-HS are well-characterized in both humans and in animal models and predominantly consist of progressive neuronal cell death and reactive gliosis (4–14). The underlying mechanisms of these features remain elusive, and their further disentanglement is of paramount importance for the development of truly anti-epileptogenic drugs (15, 16).
In this paper, we use a combined analysis of cell-specific gene expression and DNA methylation to investigate epileptogenesis in a mouse model for mTLE-HS. Gene expression by means of RNA sequencing is a well-established approach for investigating biological function (17, 18). A cell-specific approach, i.e., the separation of neurons and glia prior to downstream analysis, has been used in various previous studies (19–21) and facilitates the detection of more subtle effects and the determination of the cellular origin of the observed DNA methylation and gene expression alterations (22).
DNA methylation contributes to cell-specific gene expression (23–26) and is altered in both epileptic human tissue (27) and animal models of epilepsy (22, 28–30). Amendable by, among other things, neuronal activity (31), nutrition (32), and newer epigenetic tools (33), it represents a modifiable potential upstream mechanism in epileptogenesis.
We recently published a study on neuronal and glial DNA methylation and gene expression changes at 24 h post-kainate-induced status epilepticus, a time point relevant to early epileptogenesis (11, 34). These findings from the ipsilateral hippocampus (ILH) revealed a number of significant gene expression alterations in both neurons and glia. We further found a number of epilepsy-relevant genomic loci with a significant association of differential gene expression and differential DNA methylation (22). These observations originated from the intracortical kainate mouse model, where both hippocampi are exposed to epileptic activity but only the ILH gradually develops morphological changes (e.g., neuronal death and reactive gliosis) similar to human mTLE-HS (11) (Figure 1). In contrast, the contralateral hippocampus (CLH) is only exposed to epileptic activity and regarded as “free from morphological alterations” (11, 35). As such, it is often used as an internal control for the ILH (11).
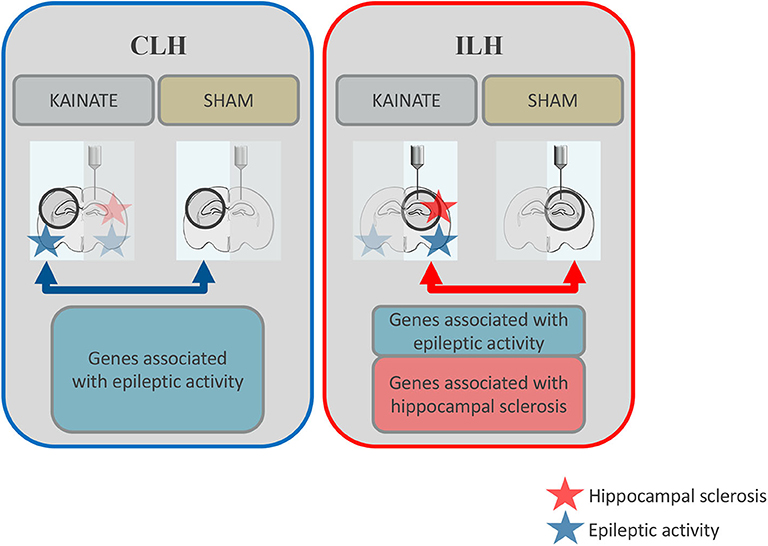
Figure 1. Schematic overview: Differential gene expression in the contralateral and ipsilateral hippocampi at 24 h after status epilepticus induction. Both the ipsilateral and contralateral hippocampi were exposed to epileptic activity (upon a status epilepticus lasting several hours), but only the ipsilateral hippocampus gradually develops morphological alterations such as reactive gliosis and neuronal death (hippocampal sclerosis). In this study, gene expression was compared between epileptic mice (kainate injected over the right, ipsilateral, hippocampus) and sham mice (saline injected at the same location) for the contralateral hippocampus (CLH, blue arrow). This data was compared to previous data on gene expression from the ipsilateral hippocampus (ILH, red arrow). Differentially expressed genes associated with epileptic activity are represented by the blue boxes. Differentially expressed genes potentially associated with morphological alterations typical of mesial temporal lobe epilepsy with hippocampal sclerosis (mTLE-HS) are represented by the red box.
The aims of this study were to on glia- and neuron-mediated downstream effects of epileptic activity based on gene expression changes in the CLH. We further elaborated on potential upstream targets for hippocampal sclerosis and epileptogenesis within genes exclusively differentially expressed in the ILH (and not CLH). Lastly, we explored the potential role of DNA methylation on cell-specific gene expression in early epileptogenesis.
Methods
The methods applied in this study follow the same protocol as previously described in Berger et al. (22). Raw data are available under GEO accession GSE153976.
Animals
Adult male C57/BL6N mice (Janvier Labs, France), acquired at an age of 8 weeks, were acclimatized for 4 weeks in a controlled environment (21–23°C, 12-h dark/light cycles). One to four animals were housed per cage, with water and food available ad libitum. All animal procedures were approved by the Norwegian Food Safety Authority (project number FOTS: 14198), the Center for Comparative Medicine, Oslo University Hospital and the University of Oslo.
Intracortical Kainic Acid Mouse Model of Mesial Temporal Lobe Epilepsy With Hippocampal Sclerosis
We used the intracortical mouse model for mTLE-HS, described in detail by Bedner et al. (11), to elicit status epilepticus. In brief, the mice were anesthetized with a mixture of medetomidine (0.3 mg/kg, i.p.) and ketamine (40 mg/kg, i.p.) and kept on a heating blanket. For mice in the kainic acid group, kainate (70 nl, 20 mM, Tocris) was injected above the right hippocampus (= ipsilateral) by a Hamilton pipette (Hamilton Company, NV) at a depth of 1.7 mm at anteroposterior −2 mm, lateral +1.5 mm in relation to bregma. After the procedure, anesthesia was stopped with atipamezole (300 mg/kg, i.p.). Buprenorphine (0.1 mg/kg, s.c.) was applied at 4 and 12 h after the intervention. In order to ensure successful execution of technical procedures, only animals displaying convulsive seizures (Racine grade 5) within the first 4 h after termination of the procedures were included in further analysis. For sham animals, 0.9% NaCl was used instead of kainate for the intracortical injection.
Tissue Collection and Pooling
Cervical dislocation was performed 24 h after status epilepticus, and hippocampi were extracted. Thereafter, each hemisphere was placed in a 2-ml polypropylene tube, instantly shock frozen in liquid nitrogen, and stored at −80°C. Left hippocampi (= contralateral) were pooled in 2-ml tubes from four (kainic acid group, n = 4; sham group, n = 4) or two (kainic acid group, n = 4; sham group, n = 4) mice prior to further processing. The number of mice amounted to eight per group (eight kainic acid and eight sham) and the number of biological samples to three per group (three samples in the kainic acid and three samples in the sham group). Tissue was kept on dry ice during pooling.
Fluorescence-Activated Nuclear Sorting
Cell nuclei were sorted into NeuN+ nuclei (referred to as neurons) and NeuN– nuclei (referred to as glia) by a modified version of Jiang et al. (36) (for technical limitations and restrictions in interpretability, see Limitations). Hippocampi were placed on ice immediately after pooling, and 1 ml homogenization buffer was added. GentleMACS dissociator (Miltenyi) was used to homogenize the tissue. The homogenate was subsequently filtered through a 70-μm filter and debris removed by density gradient centrifugation using Debris Removal Solution (Miltenyi). Nuclear pellets were resuspended in 100 μl incubation buffer per 1 × 10⁶ nuclei and Anti-NeuN Alexa Fluor 488 (Merck Millipore) added (0.1 μg/ml per sample). The samples were incubated for 1 h on ice, protected from light. Adult mouse liver was used as a NeuN-negative control sample and processed in parallel with hippocampal tissue. The nuclei were sorted into NeuN+ and NeuN– fractions using a FACSAria (BD Biosciences), followed by centrifugation, and pellets were resuspended in lysis buffer for DNA and RNA isolation. For further details, see Supplementary Document.
Isolation of DNA and Total RNA From Sorted Nuclei
MasterPure Complete DNA and RNA Purification Kit (Epicenter) was used to extract DNA from sorted nuclei. DNA purity was evaluated on NanoDrop and the DNA concentration assessed on Qubit (DNA HS assay). Total RNA was extracted using the mirVana miRNA Isolation Kit (Ambion) and RNA was up-concentrated with the RNA Clean & Concentrator-5 kit (Zymo Research). RNA integrity and concentration were analyzed on Bioanalyzer with the RNA Pico Kit (Agilent Technologies). For further details, see Supplementary Document.
Reduced Representation Bisulfite Sequencing
A modified version of the gel-free protocol provided by Boyle et al. (37) was used for reduced representation bisulfite sequencing (RRBS) library preparation. Main changes comprised the inclusion of a two-sided size selection before bisulfite conversion and sample pooling after completion of single libraries. Libraries representing the contralateral and ipsilateral hemispheres were prepared and sequenced in parallel, and sequencing pools contained either 14 libraries run twice on NextSeq500 (50% PhiX spike-in, 75-bp single reads) or15 libraries sequenced over two lanes on HiSeq2500 (10% PhiX spike-in, 50-bp single reads). The library preparation procedure is described in detail in Supplementary Document.
High-Throughput mRNA Sequencing
SMART-Seqv4 Ultra Low InputRNA Kit for Sequencing (Takara Bio) was used to amplify messenger RNA (mRNA) from total RNA, and the resulting complementary DNA (cDNA) was used as the input in library preparation with the ThruPlex DNAseq Kit (Rubicon Genomics). Libraries representing the contralateral and ipsilateral hemispheres were prepared and sequenced in parallel, and sequencing pools contained either 12 libraries sequenced on NextSeq500 (75-bp single reads) or 27 libraries sequenced over three lanes on HiSeq3000 (150-bp paired-end reads). Details regarding mRNA sequencing (mRNAseq) library preparation are given in Supplementary Document.
Computational Methods
Bioinformatic Handling and Quality Control of mRNAseq Data
The mRNAseq reads were trimmed with Trim Galore! v0.4.3 and aligned by the Rsubread (the R interface of the Subread software) (38). Quality control of the BAM files was done with Picard/CollectRnaSeqMetrics. The featureCounts function of Rsubread was used for counting the number of reads mapping uniquely to each gene, based on the comprehensive gene annotation for mm10 in the GENCODE release M16 (www.gencodegenes.org/mouse/release_M16.html). Only reads aligning to mRNA regions were used in further analysis.
The expression levels (normalized counts) of a neuronal gene (Rbfox3), glial genes (Aldh1l1, Cx3cr1, and Mbp), as well as pericyte (Pdgfrb) and endothelial (Pecam1) genes were visualized to verify the enrichment of neurons and glia in the NeuN+ and NeuN– fractions. In order to validate our cell sorting procedures and discover outliers, a multidimensional scaling plot of the mRNAseq data was produced. For this, we used the edgeR function plotMDS to compute point coordinates, using the top 100 most variable genes, and ggplot2 (39) to produce the final plots.
Bioinformatic Handling and Quality Control of RRBS Data
The RRBS raw data underwent trimming with Trim Galore! v0.4.3, with parameters “–rrbs–illumina,” and quality control with FastQC. Alignment was done with Bismark v0.20 (powered by Bowtie2) using the mouse genome mm 10 as reference. The Picard tool CollectRrbsMetrics v2.18.15 was used for quality control of the BAM files.
An MDS plot of the RRBS data set was produced in a similar fashion to the mRNAseq, using the 100 most variable loci.
The bisulfite conversion rates were estimated in two ways. Firstly, by Picard/CollectRrbsMetrics, which measures the conversion of non-CpG cytosines. This statistic may be unreliable in neurons, where the methylation of non-CpG cytosines occurs with non-negligible frequency. To account for this, we also performed an alternative estimate of the conversion rates directly from the untrimmed fastq files, targeting the (unmethylated) cytosines added in the end-repair step of the RRBS preparation (private bash script). Samples whose conversion rate estimates were below 98% in both methods were excluded.
Annotation
Coordinates of the genes, exons, and introns were obtained from the M16 release of GENCODE's comprehensive annotation, restricted to autosomal genes. Annotation of CpG sites was performed with the R package annotatr (40), supplying details of the gene regions overlapping each CpG. In particular, promoter regions were defined as the 1-kb segments upstream of the transcription start sites, and upstream regions were defined as ranging from −5 to −1 kb relative to the transcription start sites.
Analysis of Differential Gene Expression
Analysis of differential gene expression between the kainic acid group and the sham group samples was performed with the R package edgeR (41). Preparatory steps included removal of genes without the official HGNC symbol, removal of genes with a low read count (determined by the edgeR function filterByExpr with default parameters), and normalization adjusting for different library sizes (done with calcNormFactors). The differential gene expression analysis followed a standard edgeR workflow based on a quasi-likelihood negative binomial generalized log-linear model fitted to the count data. Data from glial and neuronal cells were analyzed separately. The significance threshold was set to a false discovery rate (FDR) of 25%.
Analysis of Differential DNA Methylation
Loci exhibiting differential DNA methylation between the kainic acid group and the sham group samples were identified with edgeR, following a workflow for RRBS data recently published by the edgeR authors (42). In brief, this treats the methylated and unmethylated counts at each locus as independent variables following a negative binomial distribution. As for differential gene expression, the differential DNA methylation analysis was carried out separately for neuronal and glial cells, with a FDR of 25% as the significance threshold. Preparatory steps included removing all CpG sites where more than 10% of the samples had either very low coverage (< 8 reads) or very high coverage (>99.5 quantile across all sites and samples). In addition to the a standard differential DNA methylation analysis of individual CpG sites, aggregated analyses were performed for various genomic regions defined by the gene annotation, including upstream segments, promoters, UTR5's, exons, introns, gene bodies (i.e., the union of all exons and introns of a specific gene), and UTR3's. For the aggregated analysis, the input was the mean counts across all the covered CpGs within the region.
Combined Differential Gene Expression and Differential DNA Methylation Analysis
In order to identify genes for which both gene expression and DNA methylation differed significantly between the kainic acid group and sham group, a combined analysis of differential gene expression and (aggregated = differentially methylated regions) differential DNA methylation was performed for each genomic feature. For each feature type (upstream, promoter, UTR5, exon, intron, gene body, and UTR3), only the genes surviving filters in the corresponding aggregated differential DNA methylation data set were kept and used as inputs in a new differential gene expression analysis. Co-incidence of differential gene expression and differential DNA methylation was declared for features surviving a FDR cutoff of 25% in both analyses.
Functional Enrichment Analysis
Enrichment analyses of Gene Ontology (GO) and Kyoto Encyclopedia of Genes and Genomes (KEGG) pathways were performed with the goana and kegga functions of edgeR, with the parameter species = “Mm”.
Selection of Relevant Gene Ontology and Kyoto Encyclopedia of Genes and Genomes Terms
Epileptogenesis-relevant GO and KEGG terms in neurons and glia were selected manually among the complete lists of respective terms in Supplementary Table (sheets 2, 3, 5, 6, 22, 23, 25, and 26) based on reviews on the subject (4, 15) and personal knowledge.
Results
A systematic overview of all data is given in Figure 2.
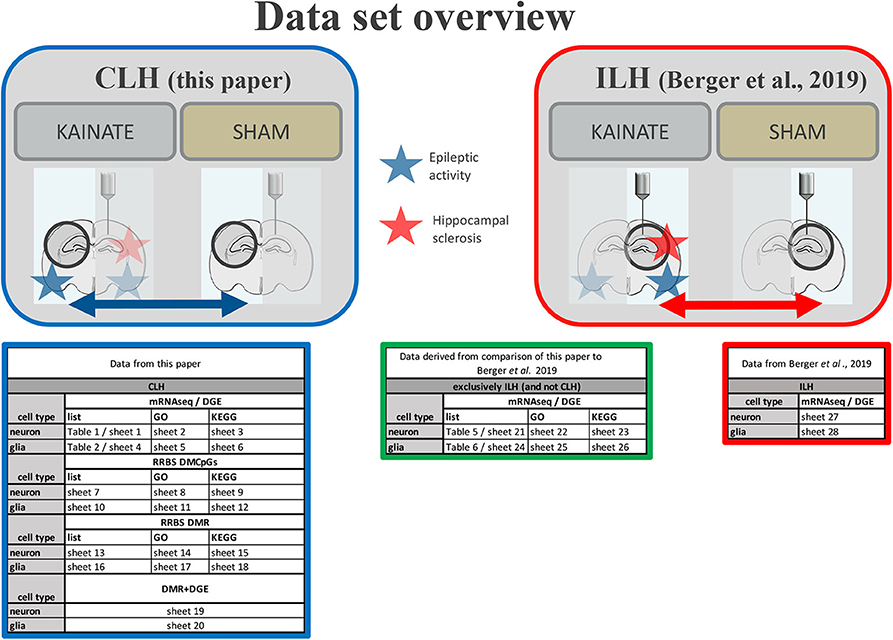
Figure 2. Data set overview. Overview of provided data in paper (Tables 1, 2, etc.) and Supplementary Table (sheets 1, 2, etc.) from the CLH (comparison of the contralateral hippocampi of the kainic acid group vs. sham group) and the ILH (comparison of the ipsilateral hippocampi of the kainic acid group vs. sham group as in Berger et al. (22).
Quality Control
The bisulfite conversion rates of the included samples were above 98% (Supplementary Figure 1). The multidimensional scaling plots for RRBS and mRNAseq (Supplementary Figure 2) clearly distinguished NeuN+ (referred to as neurons) and NeuN– (referred to as glia) fractions. As shown in the normalized mRNAseq plots (Supplementary Figure 3), the NeuN+ fraction was enriched for neuronal mRNA and the NeuN– fraction for glial mRNA. For further details regarding quality control of the differential gene expression and differential DNA methylation data, see Supplementary Document.
Differential Gene Expression in the Hippocampus Contralateral to Kainate Injection
For the analysis of differentially expressed genes, mouse hippocampi contralateral to the kainate injection site were compared to the corresponding hippocampi of sham (saline)-treated animals 24 h post-injection. Differential gene expression was measured in neurons and glia separately. In neurons, 115 genes were upregulated and 16 downregulated (ratio of upregulated to downregulated genes, 7.19) (Table 1 and Supplementary Table, sheet 1). In glia, 74 genes were upregulated and 22 downregulated (ratio of upregulated to downregulated genes, 3.36) (Table 2 and Supplementary Table, sheet 4). We found an overlap of 27 genes differentially expressed in both neurons and glia. All of these were upregulated in both cell types. Comprehensive results from the GO term analysis and KEGG pathway analysis can be found in Supplementary Table (sheets 2, 3, 5, and 6). Selected results considered relevant for epileptogenesis are listed in Table 3 for neurons and Table 4 for glia cells.
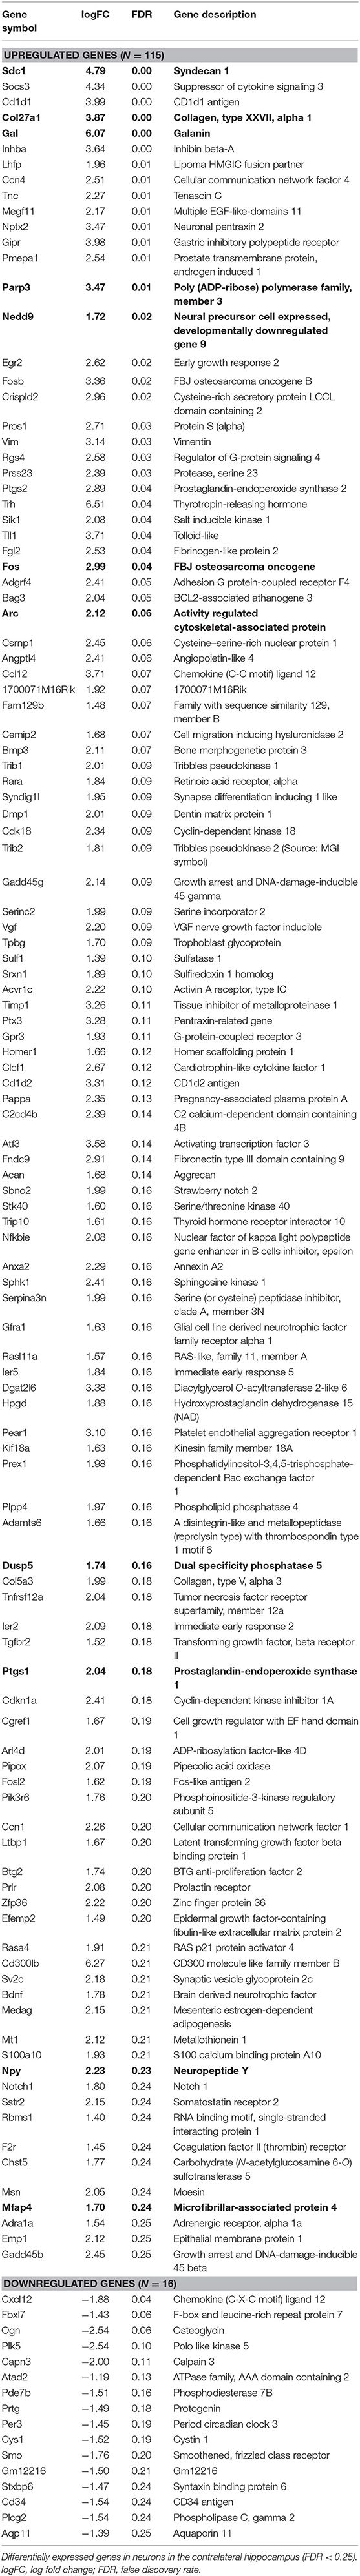
Table 1. Differentially expressed genes in neurons in the contralateral hippocampus (CLH) at 24 h after kainate-induced status epilepticus.
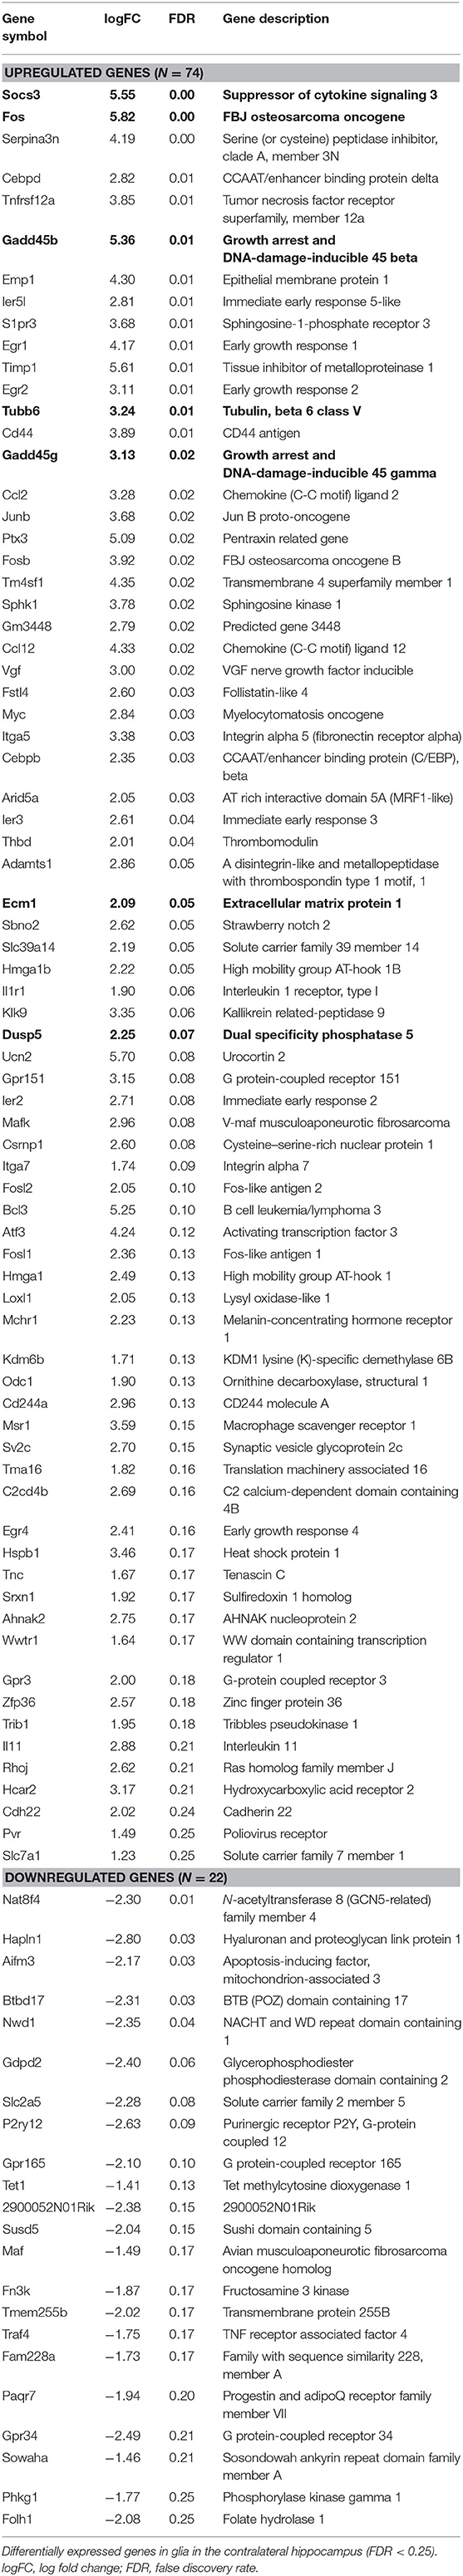
Table 2. Differentially expressed genes in glia in the contralateral hippocampus (CLH) at 24 h after kainate-induced status epilepticus.
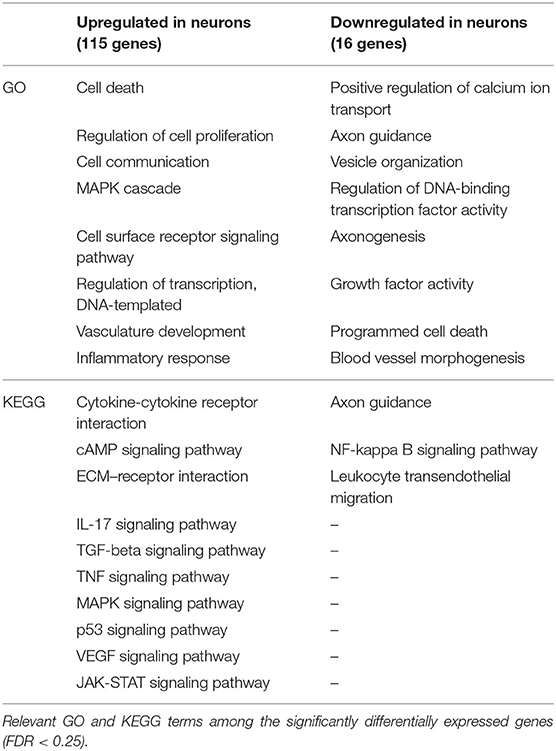
Table 3. Selection of relevant Gene Ontology (GO) and Kyoto Encyclopedia of Genes and Genomes (KEGG) terms of the differentially expressed genes in neurons in the contralateral hippocampus (CLH) at 24 h after kainate-induced status epilepticus.
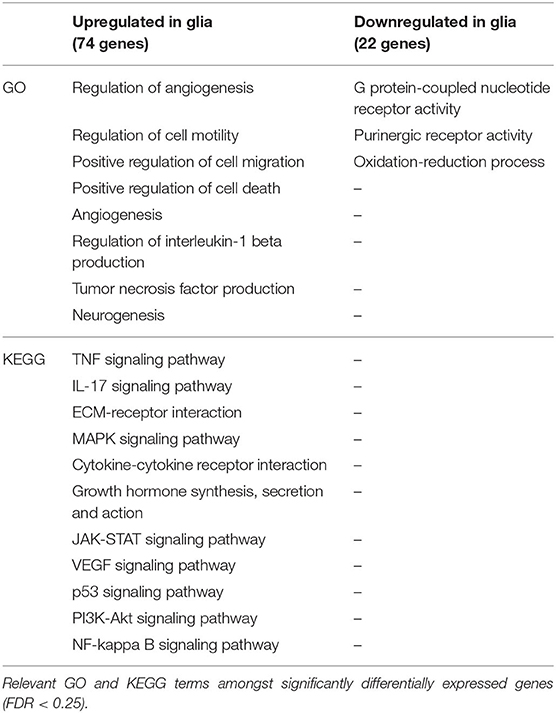
Table 4. Selection of relevant Gene Ontology (GO) and Kyoto Encyclopedia of Genes and Genomes (KEGG) terms of the differentially expressed genes in glia in the contralateral hippocampus (CLH) at 24 h after kainate-induced status epilepticus.
Comparison of Differential Gene Expression Between the Contralateral and Ipsilateral Hippocampus
Comparison of differential gene expression in CLH to ILH (22) revealed similar numbers of differentially expressed genes for neurons, while there was a marked difference in the glia. In the neuronal fraction, 115 genes were upregulated in the CLH (Table 1 and Supplementary Table, sheet 1) while 132 genes were upregulated in the ILH (Supplementary Table, sheet 27). Sixteen genes were downregulated in the CLH (Table 1 and Supplementary Table, sheet 1) and 15 genes downregulated in the ILH (Supplementary Table, Sheet 27). In glia, only half of the number of genes were upregulated in the CLH (74 genes; Table 2 and Supplementary Table, sheet 4) compared with the ILH (147 genes; Supplementary Table, sheet 28). The difference was even more pronounced for the downregulated genes (22 in the CLH vs. 85 in the ILH).
Overlap of Differentially Expressed Genes in the Contralateral and Ipsilateral Hippocampus
A comparison of genes differentially expressed in the CLH to those differentially expressed in the ILH (Supplementary Table, sheets 27 and 28) (22) revealed that a large number of differentially expressed genes coincided between CLH and ILH. This was the case both in the neurons and glia (Figure 3).
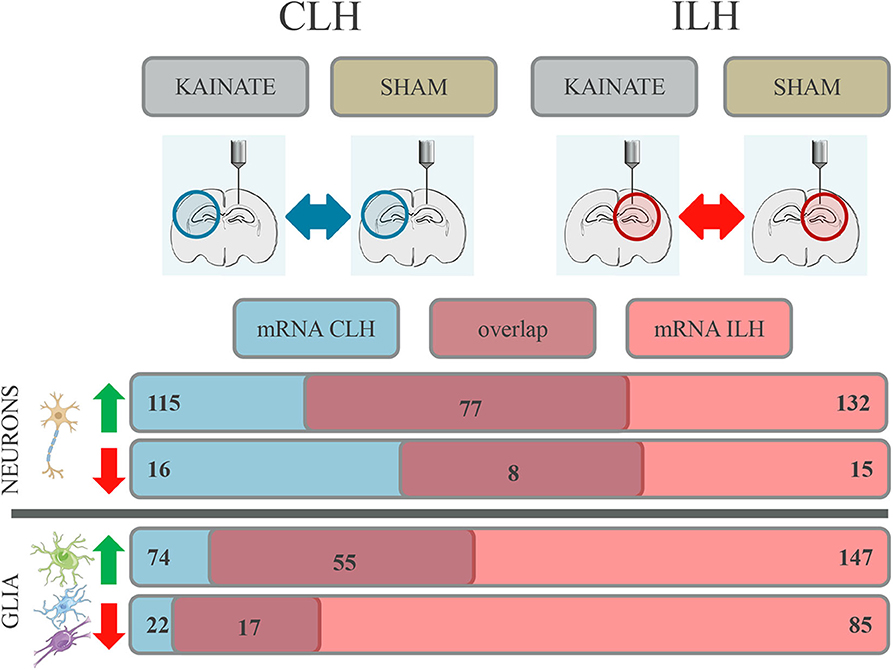
Figure 3. Differential gene expression with overlap in the contralateral (CLH) and ipsilateral hippocampus (ILH) in both neurons and glia at 24 h after kainate-induced status epilepticus. Number of genes in the neurons and glia showing differential expression in the CLH (numbers given in blue box), in the ILH (numbers given in red box), and in both hemispheres (numbers given in dark red box).
For neurons, 77 upregulated genes and eight downregulated genes were differentially expressed in both the CLH and ILH (Figure 3 and Supplementary Table, sheets 1 and 27). This constitutes a proportion of 65.22% (up) and 50.00% (down) of all the differentially regulated genes in the CLH. For glia, we found an overlap of 55 upregulated genes and an overlap of 17 downregulated genes between the CLH and ILH (Figure 3 and Supplementary Table, sheets 4 and 28). This translates to a proportion of 74.32% (up) and 77.27% (down) of all the differentially regulated genes in the CLH. All overlapping genes between the CLH and ILH showed concordant expression.
Genes Exclusively Differentially Expressed in the Ipsilateral Hippocampus
In neurons, we found 55 genes to be upregulated and seven downregulated exclusively in the ILH (Table 5 and Supplementary Table, sheet 21). In glia, 92 genes were upregulated and 68 genes were downregulated exclusively in the ILH (Table 6 and Supplementary Table, sheet 24). The relevant GO and KEGG terms of these differentially expressed genes are listed in Tables 7, 8, and a detailed list of the GO and KEGG terms is to be found in Supplementary Table (sheets 22, 23, 25, and 26).
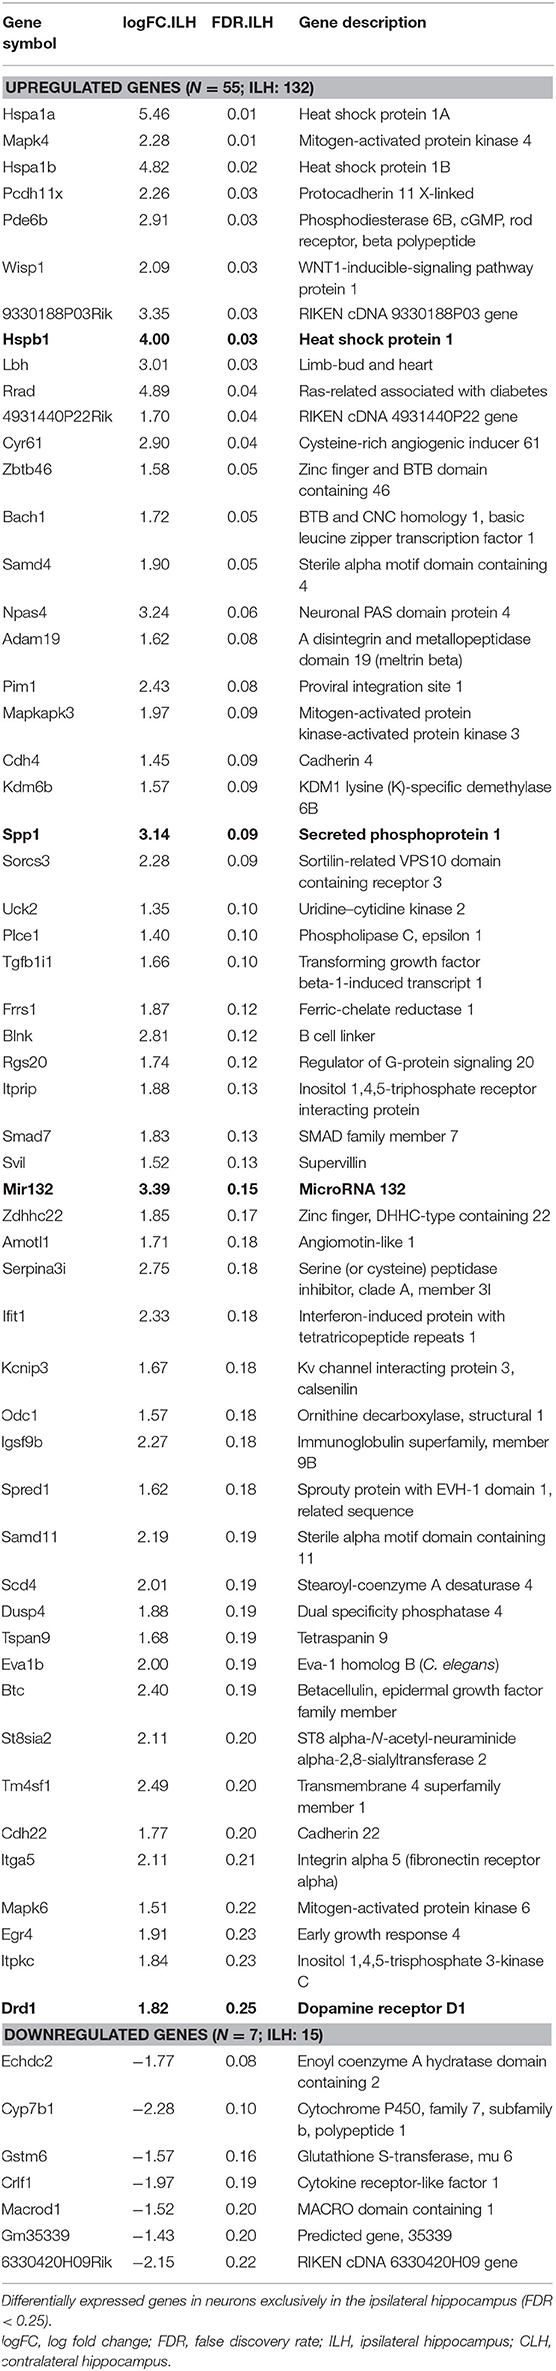
Table 5. Differentially expressed genes in neurons exclusively in the ILH (and not the CLH) at 24 h after kainate-induced status epilepticus.

Table 6. Differentially expressed genes in glia exclusively in the ILH (and not CLH) at 24 h after kainate-induced status epilepticus.
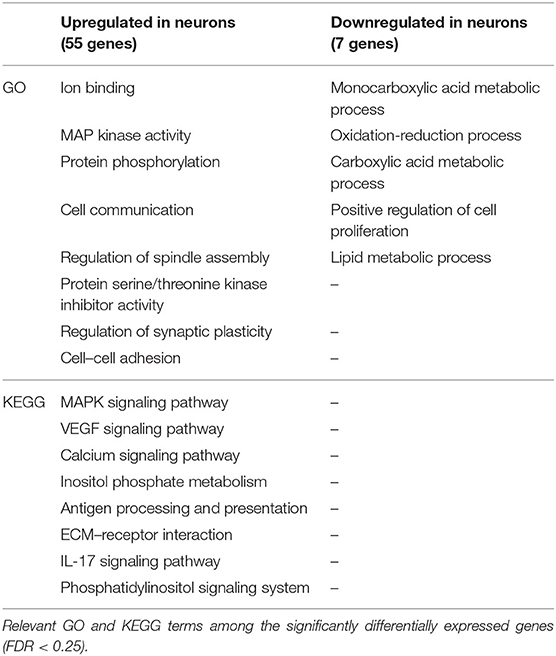
Table 7. Selection of relevant Gene Ontology (GO) and Kyoto Encyclopedia of Genes and Genomes (KEGG) terms of the differentially expressed genes in neurons in the ipsilateral hippocampus (but not in the contralateral hippocampus) at 24 h after kainate-induced status epilepticus.
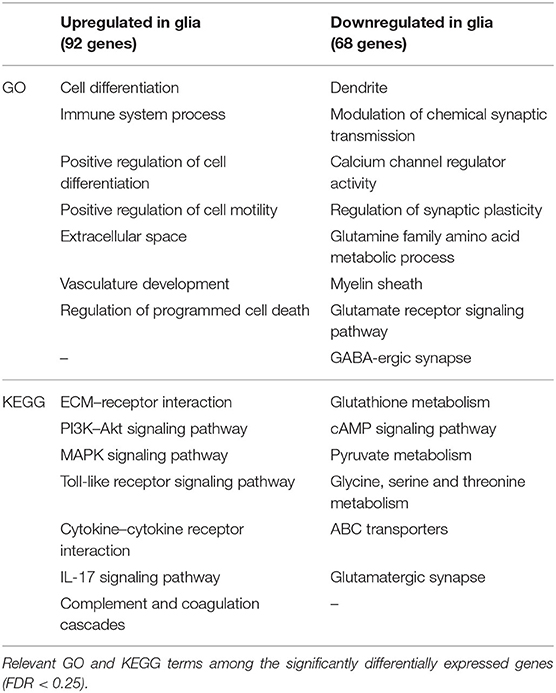
Table 8. Selection of relevant Gene Ontology (GO) and Kyoto Encyclopedia of Genes and Genomes (KEGG) terms of the differentially expressed genes in glia in the ipsilateral hippocampus (but not in the contralateral hippocampus) at 24 h after kainate-induced status epilepticus.
Differential Methylation in the Hippocampus Contralateral to Kainate Injection
Differentially methylated CpGs were analyzed comparing left (contralateral) hippocampi of the kainic acid group to the sham group at 24 h after status epilepticus induction. For an overview of the number and distribution of the differentially methylated sites and the differentially methylated regions, see Figure 4. For a detailed list of the differentially methylated CpGs, differentially methylated regions, and the associated GO and KEGG terms, see Supplementary Table (differentially methylated CpGs: sheets 7 and 10; differentially methylated regions: sheets 13 and 16; differentially methylated CpGs GO: sheets 8 and 11; differentially methylated CpGs KEGG: sheets 9 and 12; differentially methylated regions GO: sheets 14 and 17; differentially methylated regions KEGG: sheets 15 and 18).
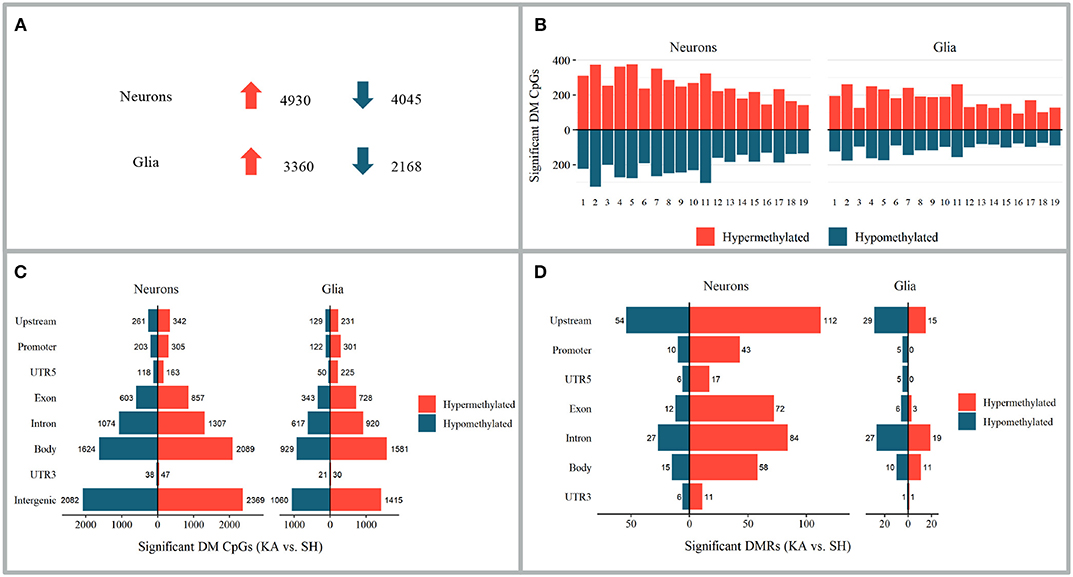
Figure 4. Alterations in DNA methylation 24 h after kainate-induced status epilepticus in hippocampi contralateral to injection site. (A–C) Differentially methylated CpGs of the kainic acid group vs. the sham group. (A) Number of differentially methylated CpGs in neurons and glia; upward arrow implies hypermethylation and downward arrow hypomethylation. (B) Chromosomal distribution of differentially methylated CpGs. (C) Distribution of differentially methylated CpGs among genomic features. (D) Distribution of differentially methylated regions among genomic features.
Overlap of Differentially Methylated CpGs Between Neurons and Glia
Ten CpG sites (0.12% of all differentially methylated CpGs in the CLH) were hypermethylated and six CpG sites (0.09%) hypomethylated in both neurons and glia. Twenty-one CpGs (0.18%) were hypermethylated in neurons and hypomethylated in glia and 13 hypomethylated in neurons and hypermethylated in glia (0.18%).
Association Between Differential Methylation and Differential Gene Expression in the Contralateral Hippocampus
In order to investigate a possible statistical association between differential DNA methylation and differential gene expression in the CLH, significantly differentially methylated regions and differentially expressed genes were aligned. No general trend in the association between the differentially methylated regions (upstream, promoter, UTR5, exon, intron, gene body, and UTR3) and differential gene expression was found (see figures in Supplementary Table, sheets 19 and 20), but significant alterations in DNA methylation and gene expression coincided at 11 genomic loci for neurons and four genomic loci for glia (Supplementary Table, sheets 19 and 20).
Differential DNA Methylation, and Association of Differential Methylation With Differential Gene Expression, in the Contralateral Hippocampus Compared With the Ipsilateral Hippocampus
Only a fragment of the differentially methylated CpGs and the differentially methylated regions overlapped between the CLH and ILH (22). Of all the differentially methylated CpGs in neurons in the CLH, 48 (0.44% of all the differentially methylated CpGs in neurons) were also differentially methylated in neurons in the ILH (22 hypermethylated and 26 hypomethylated). In glia, seven differentially methylated CpGs (0.11%) were differentially methylated in both the CLH and ILH (four hypermethylated and three hypomethylated). Regarding differentially methylated regions, 17 were overlapping between the ILH and CLH in neurons (16 hypermethylated and one hypomethylated) and two (both hypermethylated) in glia. Some of these overlapping differentially methylated CpGs and differentially methylated regions were linked to genes with epilepsy- and DNA methylation-relevant functions like TGF-beta signaling, DNA methyltransferase activity, or angiogenesis, but none of these overlapped with the differentially expressed genes in the ipsilateral or contralateral hippocampus (Supplementary Table).
Only one gene, Spp1, had an association between differential DNA methylation and differential gene expression in both the CLH and ILH (neurons). Spp1 was upregulated in both CLH and ILH. This coincided with upstream and promoter hypermethylation in the CLH and upstream and promoter hypomethylation in the ILH. No overlaps for differential DNA methylation and differential gene expression associations were found for glia when comparing CLH to ILH (Supplementary Table) (22).
Discussion
In this study, we investigate alterations in gene expression and DNA methylation in glia and neurons in mouse hippocampi contralateral to intracortical kainic acid application. We found fulminant changes of both the gene expression and DNA methylation in glia and neurons in the CLH at 24 h after kainate-induced status epilepticus.
Based on our findings, we will discuss possible beneficial and detrimental responses to epileptic activity in the CLH. We will further illuminate potential genetic targets relevant to hippocampal sclerosis by comparing alterations in gene expression in the CLH to gene expression in the ILH. Lastly, we will discuss DNA methylation and its role for gene expression regulation in early epileptogenesis.
Differential Gene Expression in the Contralateral Hippocampus Only Exposed to Epileptic Activity
We found that differential gene expression in the contralateral hippocampus at 24 h after kainate-induced status epilepticus mainly occurs cell-specific, with only a minor overlap of genes differentially expressed in the neurons and glia. This may reflect the complementary characteristic of neuron–glia interactions in epilepsy (4) and is comparable to our previous findings from cell-specific gene expression in the ipsilateral hippocampus (22).
In the CLH, the primary factor affecting differential gene expression is related to epileptic activity upon status epilepticus (Figure 1) (11). Differentially expressed genes comprise diverse inflammatory responses, synaptic signaling, and DNA methylation machinery in both neurons and glia (Tables 3, 4). Many of the gene expression changes seen in the CLH (lacking hippocampal sclerosis) overlap with our previous findings from the ILH [comprising hippocampal sclerosis at chronic time points: Supplementary Table 27 and 28 (22)]. This may appear unexpected since the CLH does not show morphological changes as seen in the ILH like reactive gliosis and neuronal death. A previous study on the ipsilateral and contralateral gene expression changes in a unilateral kainic acid epilepsy model also found a large overlap of the differentially expressed genes in the ipsilateral and contralateral hippocampus (43). The authors created different subsets of genes in order to distinguish between the effect of the kainic acid-induced lesion and epileptic seizures. A comparison of our data obtained at an early time point of epileptogenesis from the CLH to these results at a chronic stage of epileptogenesis reveals several genes overlapping with the “seizure” gene set (neurons: Gal, Fos, Parp3, Nedd9, Mfap4, Dusp5, Col27a1, Sdc1, Ptgs1, and Arc; glia: Tubb6, Fos, Ecm1, and Dusp5).
We further find a great degree of overlap between the gene expression changes seen in the CLH with other studies of various animal models for epilepsy (29, 44), gene expression material from the resected hippocampi of temporal lobe epilepsy (TLE) patients (45), and even with genomic data from animal models of reactive gliosis (46).
If the gene expression response in the CLH is so similar to both the ILH (with morphological alterations such as neuronal cell death and reactive gliosis 3 months after status epilepticus initiation or earlier) (11) and diverse models of epilepsy and reactive gliosis, why does the CLH not develop comparable morphological changes? The question whether epileptic activity can lead to morphological changes has long been a matter of controversial debate and is, to date, unanswered. While several previous studies claim that seizures mediate epileptogenic effects (47, 48), others postulate that seizures per se do not promote epileptogenesis (35, 49).
A hypothesis as to why the CLH remains free of hippocampal sclerosis may be that it is exposed to fewer detrimental or a larger number of beneficial effects, or both. As for fewer detrimental effects, one apparent characteristic in the CLH is the significantly lower number of glial genes up- and downregulated compared to the ILH. Only half the number of genes are up- and only a quarter of the number of genes are downregulated compared to the ILH. With several glial genes coding for pro-inflammatory pathways (Supplementary Table, sheets 4–6), this less pronounced glial activation in the contralateral hippocampus may be related to the lack of morphological changes characteristically observed at later time points. With regard to the gene expression changes with possible beneficial effects in the CLH, we find several seizure-alleviating and even potential anti-epileptic genes and pathways upregulated. Within the glial genes in the CLH, more genes overlapped with a gene set previously related to a “beneficial” type of astrocyte (A2) than with the gene set of “detrimental” astrocytes (A1) (46), possibly representing a glia-mediated endogenic anti-epileptogenic process in early epileptogenesis. Other epileptic activity-induced genes with seizure-alleviating or potentially even anti-epileptogenic effects include Gal, Socs3, and NPY. GAL (galanin) has previously been shown to exhibit anti-seizure effects and comprises potential anti-epileptogenic qualities (50). The gene expression levels of Galanin are elevated in neurons in the CLH, possibly revealing epileptic activity-related homeostatic effects. Further, we find the gene expression levels of NPY (neuropeptide Y), a neuropeptide recently successfully shown to attenuate seizures in slices of medication-refractory TLE (51), elevated in neurons in the CLH. Lastly, we find elevated levels of SOCS3 in glia in the CLH. Socs3 codes for the suppressor of cytokine signaling 3 protein. This protein reduces the pro-inflammatory responses of, among others, IL-6, IFN, IL2, Il12, and NfkB signaling pathways and reduces astrocytic chemokine production (52). Thus, Socs3 expression potentially represents another example of an endogenic reaction aiming at reducing the detrimental effects of seizures.
In sum, we speculate that anti-epileptogenic effects may outweigh pro-epileptogenic effects and thus prevent morphological alterations like neuronal death and reactive gliosis in the CLH. In fact, we find a higher fraction of GO terms anticipating anti-epileptogenic effects like “neurogenesis” (glia) and a lower number of GO terms indicating pro-epileptogenic qualities like “negative regulation of neuronal death” (neurons) in the CLH (Supplementary Table, sheets 2 and 5) compared to the ILH (22).
Potential Upstream Targets of Hippocampal Sclerosis and Epileptogenesis
If one were to speculate which genes in our ipsilateral and contralateral findings in early epileptogenesis were most likely potential candidate genes driving hippocampal sclerosis and epileptogenesis, one could hypothesize that these would have to be exclusively found on the list of differentially expressed genes in the ILH. Featuring morphological changes like reactive gliosis and neuronal death, the ILH is associated with epileptogenesis (Figure 1).
For neurons, genes only differentially expressed in the ILH comprise pathways within various inflammatory responses and epilepsy-relevant genes like Mir132 (53) and Drd1 (54) (Table 5 and Supplementary Table, sheet 21). In glia, genes upregulated in the ILH but not in the CLH include several interferon- and interleukin-associated genes like Ifit3, Iigp1, Ifi204, and Il4ra, other inflammatory genes previously associated with epilepsy like Ptgs2 (Cox2) (55), and epilepsy-related genes like Bdnf (56) and Mir132 (53) (Table 6 and Supplementary Table, sheet 24). Downregulated genes in glia involve, among others, Grm3, a gene encoding for the metabotropic glutamate receptor 3, previously shown to be downregulated in experimental and human mTLE (57).
Within these genes exclusively differentially expressed in the ILH (and not CLH), one could check for overlaps with the top target genes in the reactive gliosis gene set mentioned earlier. Glial CxCl10 and Ptgs2 (Cox2) are exclusively differentially expressed in both the ILH (22) and in a previous genomic analysis of reactive gliosis (46). CXCL10, a chemokine elevated in various central nervous system (CNS) pathologies like Alzheimer's disease (58), multiple sclerosis (59), and Rasmussen encephalitis (60), has been shown to elicit elevated neuronal excitability after acute (61) and chronic exposure (62). Produced in astrocytes (63), it mediates neuronal death via Ca2+-dependent apoptosis (64). Ptgs2, coding for COX2, a cyclooxygenase exerting pro-epileptogenic effects in epileptogenesis (55), represents another potential glial upstream target for anti-epileptogenic intervention. These findings are in line with previous studies on the importance of glia-driven inflammatory pathways in epileptogenesis (4, 65).
As mentioned, the number of genes differentially expressed by the glia in the ILH are significantly higher than those in the CLH. This possibly indicates a more pronounced glial reaction triggered by the combination of epileptic activity and kainate in the ILH. This is supported by the notion of previously reported glial responses to kainic acid injection (66). In the intracortical model of mTLE-HS, the effects of epileptic activity and kainate are difficult to disentangle. Both kainate (67–69) and epileptic activity (47, 48, 70) can exert cytotoxic effects that, in combination, might be potentiated (71, 72). A previous genomic analysis of the ipsilateral and contralateral hippocampi of kainate-injected rats in chronic epilepsy (43) created a “kainic acid” gene set—a list of genes presumably induced by kainic acid. We find a surprisingly small overlap of these “kainic acid genes” with our data (exclusively ILH: Spp1 and Hspb1 in neurons and Spp1 in the glia), possibly indicating that the singular effect of kainate may not be of primordial importance for downstream effects like hippocampal sclerosis and epileptogenesis after all (for restrictions in interpretability, see Limitations). Further, our goal was to identify upstream gene expression alterations possibly leading to hippocampal sclerosis, and as such, the exact cause of these alterations may be of secondary importance as long as they lead to epileptogenesis-relevant hallmarks.
DNA Methylation and Its Role for Gene Expression in Early Epileptogenesis
In line with previous studies (22, 73, 74), DNA methylation occurs mainly in a cell-specific manner in the CLH. Regarding the methylation of singular CpG sites, hypermethylation slightly outweighs hypomethylation in both neurons and glia, both with regards to differentially methylated CpGs in total and differentially methylated CpGs within genomic regions. This trend is similar to the DNA methylation dynamics observed at 24 h in the ILH (22) and to previous data from DNA methylation alterations in a rat model of chronic epilepsy (75). Differentially methylated regions were mostly hypermethylated in neurons and hypomethylated in glia. This represents a near inversion of the methylation pattern of the differentially methylated regions in the ILH, where most differentially methylated regions in neurons were hypomethylated and most differentially methylated regions in the glia were hypermethylated (22). Previous studies of epilepsy-related DNA methylation in acute phases of epilepsy in animal models found no general trend toward hyper- or hypomethylation (30) or a tendency toward hypomethylation (76).
One possible reason for the higher ratio of hypomethylated differentially methylated regions in glia in the CLH is the higher levels of gene expression of Gadd 45b and Gadd 45g, which both are capable of DNA demethylation (77). In the CLH, significant alterations of differential DNA methylation and differential gene expression coincided at several genomic loci (Supplementary Table, sheets 19 and 20), e.g., at epilepsy-relevant genes like Spp1 (78) in neurons and Atf3 (79) in glia. Differential gene expression and differential DNA methylation coincide at epilepsy-related loci in both the CLH and ILH, yet the overlap of differential methylation between the CLH and ILH is marginal. There are no genomic loci in both the CLH and ILH at which differential DNA methylation and differential gene expression coincide in both hippocampi. While several previous studies revealed various associations between DNA methylation and gene expression in epilepsy (28, 29, 75), more recent studies have claimed a more restricted importance of DNA methylation for gene expression in epilepsy (80). The general role of DNA methylation for the regulation of gene expression appears to be highly tissue- and context-specific (81) and may not be the primary factor determining gene expression in early epileptogenesis. Thus, how changes in DNA methylation are related to differential gene expression in early epileptogenesis remains unclear.
Limitations
Considered a solid marker of mature neurons (82, 83), NeuN (Rbfox3) may not stain all CNS neurons (84). As such, the NeuN– fraction (referred to as glia) may, apart from astrocytes, oligodendrocytes, and microglia, contain a minor fraction of non-glial cells (e.g., endothelial cells, pericytes, and neurons) (84–86).
At steady state, RNA sequencing (RNAseq) is a solid approach for the estimation of protein abundance, and as such, biological function, yet in transition states, distortions in this correlation may occur (17, 18). Hence, we may under- or overestimate biological effects based on our interpretation of the differential gene expression results 24 h after injection. Also, posttranscriptional (87) and posttranslational mechanisms (88) may account, among other things, for a non-linear correlation between mRNA and protein abundance. These shortcomings may also contribute to an explanation as to why the CLH, which features many of the same differentially regulated gene transcripts as the ILH, does not feature morphological alterations.
A previous study on gene expression revealed a mainly stage-specific (acute, latent, or chronic) gene expression profile in epileptogenesis (89). As such, the comparison of our gene set, representing relatively acute changes of kainic acid-induced status epilepticus, to previous data from a chronic time point of epileptogenesis (43) should be interpreted with caution.
Regarding the only marginal overlap of differential DNA methylation between the CLH and ILH and the non-existent overlap of genomic loci with the association between differential gene expression and differential DNA methylation, one possible cause is that the method for detecting differential DNA methylation, RRBS, does not include all CpGs (37). RRBS covers most CpGs in promoters and CpG islands (but not all) and has a low coverage at, for example, CpG shores and enhancers (37). We might ergo have missed specific genomic loci at which differential DNA methylation and differential gene expression coincide.
Conclusion
In this study we found substantial changes in gene expression and DNA methylation 24 h after status epilepticus in the mouse hippocampus contralateral to the site of kainate injection. This begs the question why the CLH, in contrast to the ILH, does not develop hippocampal sclerosis? In the CLH we found an overweight of upregulated genes with potential anti-epileptogenic properties. Further, we detected a significantly lower number of differentially regulated genes in glia. We therefore hypothesize that both an overweight of upregulated genes and pathways with potential downstream anti-epileptogenic effects and a lower number of genes and pathways with pro-epileptogenic qualities in glia contribute to prevent epileptogenesis in the CLH. Gene expression changes in terms of nuclear mRNA may, however, only be one among many factors when it comes to finally determining cellular responses upon external stimuli. Also the role of DNA methylation for gene expression remains still uncertain in this model as we only found a marginal overlap of differentially methylated sites between the CLH and ILH. In order to further disentangle the cell- and stage-specific orchestration of epileptogenesis, it is essential to perform longitudinal animal studies including the investigation of acute and chronic time points of epileptogenesis. Finally, studies exploring neuronal and glial gene expression in human tissue are required in order to evaluate the clinical relevance of these findings.
Data Availability Statement
Raw data is available under GEO accession code GSE153976.
Ethics Statement
The animal study was reviewed and approved by Norwegian Food Safety Authority, the Center for Comparatice Medicine, Oslo University Hospital and the University of Oslo.
Author Contributions
TB: conceptualization, data curation, formal analysis, investigation, methodology, project administration, validation, visualization, writing–original draft, and writing–review & editing. KH: conceptualization, funding acquisition, investigation, methodology, project administration, resources, supervision, validation, writing–original draft, and writing–review & editing. KS: conceptualization, funding acquisition, methodology, project administration, resources, supervision, and writing–review and editing. ET: conceptualization, methodology, project administration, resources, supervision, and writing–review & editing. CN: investigation and writing–review & editing. HH: conceptualization, investigation, methodology, project administration, writing–original draft, and writing–review & editing. MV: conceptualization, data curation, formal analysis, methodology, project administration, software, supervision, validation, visualization, writing–original draft, and writing–review & editing. All authors contributed to the article and approved the submitted version.
Funding
This project has participated in the European Commission, ERA-NET NEURON, Brain Inflammation, Glia and Epilepsy (KH), and has received funding from the European Union's Horizon 2020 research and innovation programme under the Marie Sklodowska-Curie grant agreement No. 722053 (to KH). The project was also funded from South-Eastern Norway Regional Health Authority, No. 2014018 (KS). The funders had no role in study design, data collection and analysis, decision to publish, or preparation of the manuscript.
Conflict of Interest
The authors declare that the research was conducted in the absence of any commercial or financial relationships that could be construed as a potential conflict of interest.
Acknowledgments
The sequencing service was provided by the Norwegian Sequencing Centre (www.sequencing.uio.no), a national technology platform hosted by Oslo University Hospital and the University of Oslo supported by the Research Council of Norway and the Southeastern Regional Health Authority. We would like to thank Professor Frank Kirchhoff for his excellent leadership of the EU Glia PhD Consortium. We would like to thank Professor Christian Steinhäuser and Ph.D. Peter Bedner from the Institute of Cellular Neurosciences, University of Bonn Medical Center for their help in establishing and traineeship on the animal model, consistent advice, and friendship. We would like to thank Ph.D. Hans Christian D. Aass (The Flow Cytometry Core Facility, Department of Medical Biochemistry, Oslo University Hospital, Oslo, Norway) for sorting nuclei and providing Supplementary Figure 4 [taken from (22)]. We would also like to thank Ph.D. Rune Enger (Glia Lab and Letten Centre, Department of Molecular Medicine, Division of Physiology, Institute of Basic Medical Sciences, University of Oslo, Oslo, Norway) for providing graphical visualizations of the hippocampi used in Figures 1–3. Parts of Figure 3 were modified from images provided by https://smart.servier.com/ under a Creative Commons Attribution 3.0 Unported License.
Supplementary Material
The Supplementary Material for this article can be found online at: https://www.frontiersin.org/articles/10.3389/fneur.2020.573575/full#supplementary-material
Abbreviations
CLH, contralateral hippocampus comparison (specifically, comparison of the contralateral hippocampi of the kainic acid group vs. the sham group); GO, Gene Ontology; ILH, ipsilateral hippocampus comparison (specifically, comparison of the ipsilateral hippocampi of the kainic acid group vs. the sham group); KEGG, Kyoto Encyclopedia of Genes and Genomes; mRNAseq, mRNA sequencing; mTLE-HS, mesial temporal lobe epilepsy with hippocampal sclerosis; RRBS, reduced representation bisulfite sequencing.
References
1. Pitkanen A, Lukasiuk K. Molecular and cellular basis of epileptogenesis in symptomatic epilepsy. Epilepsy Behav. (2009) 14(Suppl. 1):16–25. doi: 10.1016/j.yebeh.2008.09.023
2. Pitkanen A, Engel J Jr. Past and present definitions of epileptogenesis and its biomarkers. Neurotherapeutics. (2014) 11:231–41. doi: 10.1007/s13311-014-0257-2
3. Wieser HG. ILAE commission report. Mesial temporal lobe epilepsy with hippocampal sclerosis. Epilepsia. (2004) 45:695–714. doi: 10.1111/j.0013-9580.2004.09004.x
4. Patel DC, Tewari BP, Chaunsali L, Sontheimer H. Neuron–glia interactions in the pathophysiology of epilepsy. Nat Rev Neurosci. (2019) 20:282–97. doi: 10.1038/s41583-019-0126-4
5. Mathern GW, Babb TL, Vickrey BG, Melendez M, Pretorius JK. The clinical-pathogenic mechanisms of hippocampal neuron loss and surgical outcomes in temporal lobe epilepsy. Brain. (1995) 118:105–18. doi: 10.1093/brain/118.1.105
6. Houser CR. Granule cell dispersion in the dentate gyrus of humans with temporal lobe epilepsy. Brain Res. (1990) 535:195–204. doi: 10.1016/0006-8993(90)91601-C
7. Houser C, Miyashiro J, Swartz B, Walsh G, Rich J, Delgado-Escueta A. Altered patterns of dynorphin immunoreactivity suggest mossy fiber reorganization in human hippocampal epilepsy. J Neurosci. (1990) 10:267–82. doi: 10.1523/JNEUROSCI.10-01-00267.1990
8. De Lanerolle NC, Kim JH, Robbins RJ, Spencer DD. Hippocampal interneuron loss and plasticity in human temporal lobe epilepsy. Brain Res. (1989) 495:387–95. doi: 10.1016/0006-8993(89)90234-5
9. Tauck DL, Nadler JV. Evidence of functional mossy fiber sprouting in hippocampal formation of kainic acid-treated rats. J Neurosci. (1985) 5:1016–22. doi: 10.1523/JNEUROSCI.05-04-01016.1985
10. Blumcke I, Thom M, Aronica E, Armstrong DD, Bartolomei F, Bernasconi A, et al. International consensus classification of hippocampal sclerosis in temporal lobe epilepsy: a task force report from the ilae commission on diagnostic methods. Epilepsia. (2013). 54:1315–29. doi: 10.1111/epi.12220
11. Bedner P, Dupper A, Huttmann K, Muller J, Herde MK, Dublin P, et al. Astrocyte uncoupling as a cause of human temporal lobe epilepsy. Brain. (2015) 138:1208–22. doi: 10.1093/brain/awv067
12. Vezzani A, Granata T. Brain inflammation in epilepsy: experimental and clinical evidence. Epilepsia. (2005) 46:1724–43. doi: 10.1111/j.1528-1167.2005.00298.x
13. Rigau V, Morin M, Rousset MC, De Bock F, Lebrun A, Coubes P, et al. Angiogenesis Is associated with blood-brain barrier permeability in temporal lobe epilepsy. Brain. (2007). 130:1942–56. doi: 10.1093/brain/awm118
14. Seifert G, Steinhäuser C. Neuron–Astrocyte signaling and epilepsy. Exp Neurol. (2013) 244:4–10. doi: 10.1016/j.expneurol.2011.08.024
15. Pitkanen A, Lukasiuk K. Mechanisms of epileptogenesis and potential treatment targets. Lancet Neurol. (2011) 10:173–86. doi: 10.1016/S1474-4422(10)70310-0
16. Loscher W, Klitgaard H, Twyman RE, Schmidt D. New avenues for anti-epileptic drug discovery and development. Nat Rev Drug Discover. (2013) 12:757–6. doi: 10.1038/nrd4126
17. Liu Y, Beyer A, Aebersold R. On the dependency of cellular protein levels on mrna abundance. Cell. (2016) 165:535–50. doi: 10.1016/j.cell.2016.03.014
18. Silva GM, Vogel C. Quantifying gene expression: the importance of being subtle. Mol Syst Biol. (2016) 12:885. doi: 10.15252/msb.20167325
19. Cahoy JD, Emery B, Kaushal A, Foo LC, Zamanian JL, Christopherson KS, et al. A Transcriptome database for astrocytes, neurons, and oligodendrocytes: a new resource for understanding brain development and function. J Neurosci. (2008) 28:264–78. doi: 10.1523/JNEUROSCI.4178-07.2008
20. Doyle JP, Dougherty JD, Heiman M, Schmidt EF, Stevens TR, Ma G, et al. Application of a translational profiling approach for the comparative analysis of CNS cell types. Cell. (2008). 135:749–62. doi: 10.1016/j.cell.2008.10.029
21. Rizzardi LF, Hickey PF, Rodriguez Diblasi V, Tryggvadóttir R, Callahan CM, Idrizi A, et al. Neuronal brain-region-specific dna methylation and chromatin accessibility are associated with neuropsychiatric trait heritability. Nat Neurosci. (2019) 22:307–16. doi: 10.1038/s41593-018-0297-8
22. Berger TC, Vigeland MD, Hjorthaug HS, Etholm L, Nome CG, Tauboll E, et al. Neuronal and glial DNA methylation and gene expression changes in early epileptogenesis. PLos ONE. (2019) 14:e0226575. doi: 10.1371/journal.pone.0226575
23. Luo C, Hajkova P, Ecker JR. Dynamic DNA methylation: in the right place at the right time. Science. (2018) 361:1336–40. doi: 10.1126/science.aat6806
24. Lister R, Mukamel EA, Nery JR, Urich M, Puddifoot CA, Johnson ND, et al. Global epigenomic reconfiguration during mammalian brain development. Science. (2013) 341:1237905. doi: 10.1126/science.1237905
25. Sanosaka T, Imamura T, Hamazaki N, Chai M, Igarashi K, Ideta-Otsuka M, et al. DNA methylome analysis identifies transcription factor-based epigenomic signatures of multilineage competence in neural stem/progenitor cells. Cell Rep. (2017) 20:2992–3003. doi: 10.1016/j.celrep.2017.08.086
26. Smith ZD, Meissner A. DNA methylation: roles in mammalian development. Nat Rev Genet. (2013) 14:204–20. doi: 10.1038/nrg3354
27. Zhu Q, Wang L, Zhang Y, Zhao FH, Luo J, Xiao Z, et al. Increased expression of DNA methyltransferase 1 and 3a in human temporal lobe epilepsy. J Mol Neurosci. (2012). 46:420–6. doi: 10.1007/s12031-011-9602-7
28. Williams-Karnesky RL, Sandau US, Lusardi TA, Lytle NK, Farrell JM, Pritchard EM, et al. Epigenetic changes induced by adenosine augmentation therapy prevent epileptogenesis. J Clin Invest. (2013) 123:3552–63. doi: 10.1172/JCI65636
29. Debski KJ, Pitkanen A, Puhakka N, Bot AM, Khurana I, Harikrishnan KN, et al. Etiology matters - genomic DNA methylation patterns in three rat models of acquired epilepsy. Sci Rep. (2016) 6:25668. doi: 10.1038/srep25668
30. Ryley Parrish R, Albertson AJ, Buckingham SC, Hablitz JJ, Mascia KL, Davis Haselden W, et al. Status epilepticus triggers early and late alterations in brain-derived neurotrophic factor and NMDA glutamate receptor Grin2b DNA methylation levels in the hippocampus. Neuroscience. (2013). 248:602–19. doi: 10.1016/j.neuroscience.2013.06.029
31. Guo JU, Ma DK, Mo H, Ball MP, Jang MH, Bonaguidi MA, et al. Neuronal activity modifies the DNA methylation landscape in the adult brain. Nat Neurosci. (2011). 14:1345–51. doi: 10.1038/nn.2900
32. Anderson OS, Sant KE, Dolinoy DC. Nutrition and epigenetics: an interplay of dietary methyl donors, one-carbon metabolism and DNA methylation. J Nutr Biochem. (2012) 23:853–9. doi: 10.1016/j.jnutbio.2012.03.003
33. Liu XS, Wu H, Ji X, Stelzer Y, Wu X, Czauderna S, et al. Editing DNA methylation in the mammalian genome. Cell. (2016) 167:233–47.e17. doi: 10.1016/j.cell.2016.08.056
34. Rakhade SN, Jensen FE. Epileptogenesis in the immature brain: emerging mechanisms. Nat Rev Neurol. (2009) 5:380–91. doi: 10.1038/nrneurol.2009.80
35. Noe F, Cattalini A, Vila Verde D, Alessi C, Colciaghi F, Figini M, et al. Epileptiform activity contralateral to unilateral hippocampal sclerosis does not cause the expression of brain damage markers. Epilepsia. (2019) 60:1184–99. doi: 10.1111/epi.15611
36. Jiang Y, Matevossian A, Huang H-S, Straubhaar J, Akbarian S. Isolation of neuronal chromatin from brain tissue. BMC Neuroscience. (2008) 9:42. doi: 10.1186/1471-2202-9-42
37. Boyle P, Clement K, Gu H, Smith ZD, Ziller M, Fostel JL, et al. Gel-free multiplexed reduced representation bisulfite sequencing for large-scale DNA methylation profiling. Genome Biol. (2012) 13:R92. doi: 10.1186/gb-2012-13-10-r92
38. Liao Y, Smyth GK, Shi W. The R package Rsubread is easier, faster, cheaper and better for alignment and quantification Of RNA sequencing reads. Nucleic Acids Res. (2019) 47:e47. doi: 10.1093/nar/gkz114
40. Cavalcante RG, Sartor MA. Annotatr: genomic regions in context. Bioinformatics. (2017) 33:2381–3. doi: 10.1093/bioinformatics/btx183
41. Robinson MD, Mccarthy DJ, Smyth GK. Edger: a bioconductor package for differential expression analysis of digital gene expression data. Bioinformatics. (2010) 26:139–40. doi: 10.1093/bioinformatics/btp616
42. Chen Y, Pal B, Visvader JE, Smyth GK. Differential methylation analysis of reduced representation bisulfite sequencing experiments using edger. F1000Res. (2017) 6:2055. doi: 10.12688/f1000research.13196.1
43. Winden KD, Karsten SL, Bragin A, Kudo LC, Gehman L, Ruidera J, et al. A systems level, functional genomics analysis of chronic epilepsy. PLos ONE. (2011) 6:E20763. doi: 10.1371/journal.pone.0020763
44. Lukasiuk K, Dabrowski M, Adach A, Pitkanen A. Epileptogenesis-related genes revisited. Prog Brain Res. (2006) 158:223–41. doi: 10.1016/S0079-6123(06)58011-2
45. Griffin NG, Wang Y, Hulette CM, Halvorsen M, Cronin KD, Walley NM, et al. Differential gene expression in dentate granule cells in mesial temporal lobe epilepsy with and without hippocampal sclerosis. Epilepsia. (2016) 57:376–85. doi: 10.1111/epi.13305
46. Zamanian JL, Xu L, Foo LC, Nouri N, Zhou L, Giffard RG, et al. Genomic analysis of reactive astrogliosis. J Neurosci. (2012) 32:6391–410. doi: 10.1523/JNEUROSCI.6221-11.2012
47. Pitkanen A, Sutula TP. Is epilepsy a progressive disorder? Prospects for new therapeutic approaches in temporal-lobe epilepsy. Lancet Neurol. (2002) 1:173–81. doi: 10.1016/S1474-4422(02)00073-X
48. Sutula TP, Hagen J, Pitkanen A. Do epileptic seizures damage the brain? Curr Opin Neurol. (2003) 16:189–95. doi: 10.1097/00019052-200304000-00012
49. Rossini L, Garbelli R, Gnatkovsky V, Didato G, Villani F, Spreafico R, et al. Seizure activity per se does not induce tissue damage markers in human neocortical focal epilepsy. Ann Neurol. (2017) 82:331–41. doi: 10.1002/ana.25005
50. Lerner JT, Sankar R, Mazarati AM. Galanin and epilepsy. Cell Mol Life Sci. (2008) 65:1864–71. doi: 10.1007/s00018-008-8161-8
51. Wickham J, Ledri M, Bengzon J, Jespersen B, Pinborg LH, Englund E, et al. Inhibition of epileptiform activity by neuropeptide y in brain tissue from drug-resistant temporal lobe epilepsy patients. Sci Rep. (2019) 9:19393. doi: 10.1038/s41598-019-56062-1
52. Baker BJ, Akhtar LN, Benveniste EN. SOCS1 and SOCS3 in the control of CNS immunity. Trends Immunol. (2009) 30:392–400. doi: 10.1016/j.it.2009.07.001
53. Jimenez-Mateos EM, Bray I, Sanz-Rodriguez A, Engel T, Mckiernan RC, Mouri G, et al. Mirna expression profile after status epilepticus and hippocampal neuroprotection by targeting Mir-132. Am J Pathol. (2011) 179:2519–32. doi: 10.1016/j.ajpath.2011.07.036
54. Gangarossa G, Di Benedetto M, O'Sullivan GJ, Dunleavy M, Alcacer C, Bonito-Oliva A, et al. Convulsant doses of A dopamine D1 receptor agonist result in Erk-Dependent increases in Zif268 And Arc/Arg3.1 expression in mouse dentate gyrus. PLos ONE. (2011) 6:e19415. doi: 10.1371/journal.pone.0019415
55. Rojas A, Jiang J, Ganesh T, Yang MS, Lelutiu N, Gueorguieva P, et al. Cyclooxygenase-2 in epilepsy. Epilepsia. (2014) 55:17–25. doi: 10.1111/epi.12461
56. Iughetti L, Lucaccioni L, Fugetto F, Predieri B, Berardi A, Ferrari F. Brain-derived neurotrophic factor and epilepsy: a systematic review. Neuropeptides. (2018) 72:23–9. doi: 10.1016/j.npep.2018.09.005
57. Tang FR, Chia SC, Chen PM, Gao H, Lee WL, Yeo TS, et al. Metabotropic glutamate receptor 2/3 in the hippocampus of patients with mesial temporal lobe epilepsy, and of rats and mice after pilocarpine-induced status epilepticus. Epilepsy Res. (2004) 59:167–80. doi: 10.1016/j.eplepsyres.2004.04.002
58. Xia MQ, Bacskai BJ, Knowles RB, Qin SX, Hyman BT. Expression of the chemokine receptor CXCR3 on neurons and the elevated expression of its ligand IP-10 in reactive astrocytes: in vitro ERK1/2 activation and role in Alzheimer's disease. J Neuroimmunol. (2000) 108:227–35. doi: 10.1016/S0165-5728(00)00285-X
59. Simpson JE, Newcombe J, Cuzner ML, Woodroofe MN. Expression of the interferon-gamma-inducible chemokines IP-10 and mig and their receptor, CXCR3, in multiple sclerosis lesions. Neuropathol Appl Neurobiol. (2000) 26:133–42. doi: 10.1046/j.1365-2990.2000.026002133.x
60. Mirones I, De Prada I, Gómez AM, Luque A, Martín R, Pérez-Jiménez M, et al. A role for the CXCR3/CXCL10 axis in rasmussen encephalitis. Pediatr Neurol. (2013) 49:451–7.e1. doi: 10.1016/j.pediatrneurol.2013.07.019
61. Nelson TE, Gruol DL. The chemokine CXCL10 modulates excitatory activity and intracellular calcium signaling in cultured hippocampal neurons. J Neuroimmunol. (2004) 156:74–87. doi: 10.1016/j.jneuroim.2004.07.009
62. Cho J, Nelson TE, Bajova H, Gruol DL. Chronic CXCL10 alters neuronal properties in rat hippocampal culture. J Neuroimmunol. (2009) 207:92–100. doi: 10.1016/j.jneuroim.2008.12.007
63. Oh JW, Schwiebert LM, Benveniste EN. Cytokine regulation of CC and cxc chemokine expression by human astrocytes. J Neurovirol. (1999) 5:82–94. doi: 10.3109/13550289909029749
64. Sui Y, Stehno-Bittel L, Li S, Loganathan R, Dhillon NK, Pinson D, et al. CXCL10-induced cell death in neurons: role of calcium dysregulation. Eur J Neurosci. (2006) 23:957–64. doi: 10.1111/j.1460-9568.2006.04631.x
65. Devinsky O, Vezzani A, Najjar S, De Lanerolle NC, Rogawski MA. Glia and epilepsy: excitability and inflammation. Trends Neurosciences. (2013) 36:174–84. doi: 10.1016/j.tins.2012.11.008
66. Zhang X-M, Zhu J. Kainic acid-induced neurotoxicity: targeting glial responses and glia-derived cytokines. Curr Neuropharmacol. (2011) 9:388–98. doi: 10.2174/157015911795596540
67. Vincent P, Mulle C. Kainate receptors in epilepsy and excitotoxicity. Neuroscience. (2009) 158:309–23. doi: 10.1016/j.neuroscience.2008.02.066
68. Curtis DR, Watkins JC. Acidic amino acids with strong excitatory actions on mammalian neurones. J Physiol. (1963) 166:1–14. doi: 10.1113/jphysiol.1963.sp007087
69. Cho IH, Hong J, Suh EC, Kim JH, Lee H, Lee JE, et al. Role of microglial ikkbeta in kainic acid-induced hippocampal neuronal cell death. Brain. (2008) 131:3019–33. doi: 10.1093/brain/awn230
70. Meldrum BS. Concept of activity-induced cell death in epilepsy: historical and contemporary perspectives. Prog Brain Res. (2002) 135:3–11. doi: 10.1016/S0079-6123(02)35003-9
71. Ben-Ari Y, Lagowska Y, Le Gal La Salle G, Tremblay E, Ottersen OP, Naquet R. Diazepam pretreatment reduces distant hippocampal damage induced by intra-amygdaloid injections of kainic acid. Eur J Pharmacol. (1978) 52:419–20. doi: 10.1016/0014-2999(78)90302-3
72. Ben-Ari Y, Represa A. Brief seizure episodes induce long-term potentiation and mossy fibre sprouting in the hippocampus. Trends Neurosci. (1990) 13:312–8. doi: 10.1016/0166-2236(90)90135-W
73. Kozlenkov A, Roussos P, Timashpolsky A, Barbu M, Rudchenko S, Bibikova M, et al. Differences In DNA methylation between human neuronal and glial cells are concentrated in enhancers and non-Cpg Sites. Nucleic Acids Res. (2014) 42:109–27. doi: 10.1093/nar/gkt838
74. Iwamoto K, Bundo M, Ueda J, Oldham MC, Ukai W, Hashimoto E, et al. Neurons show distinctive DNA methylation profile and higher interindividual variations compared with non-neurons. Genome Res. (2011) 21:688–96. doi: 10.1101/gr.112755.110
75. Kobow K, Kaspi A, Harikrishnan KN, Kiese K, Ziemann M, Khurana I, et al. deep sequencing reveals increased DNA methylation in chronic rat epilepsy. Acta Neuropathol. (2013) 126:741–56. doi: 10.1007/s00401-013-1168-8
76. Miller-Delaney SF, Das S, Sano T, Jimenez-Mateos EM, Bryan K, Buckley PG, et al. Differential DNA methylation patterns define status epilepticus and epileptic tolerance. J Neurosci. (2012) 32:1577–88. doi: 10.1523/JNEUROSCI.5180-11.2012
77. Ma DK, Jang M-H, Guo JU, Kitabatake Y, Chang M-L, Pow-Anpongkul N, et al. Neuronal activity-induced Gadd45b promotes epigenetic DNA demethylation and adult neurogenesis. Science. (2009) 323:1074–7. doi: 10.1126/science.1166859
78. Borges K, Gearing M, Rittling S, Sorensen ES, Kotloski R, Denhardt DT, et al. characterization of osteopontin expression and function after status epilepticus. Epilepsia. (2008) 49:1675–85. doi: 10.1111/j.1528-1167.2008.01613.x
79. Pernhorst K, Herms S, Hoffmann P, Cichon S, Schulz H, Sander T, et al. TLR4, ATF-3 and IL8 inflammation mediator expression correlates with seizure frequency in human epileptic brain tissue. Seizure. (2013) 22:675–8. doi: 10.1016/j.seizure.2013.04.023
80. Lipponen A, El-Osta A, Kaspi A, Ziemann M, Khurana I, Kn H, et al. Transcription factors Tp73, Cebpd, Pax6, And Spi1 rather than DNA methylation regulate chronic transcriptomics changes after experimental traumatic brain injury. Acta Neuropathol Commun. (2018) 6:17. doi: 10.1186/s40478-018-0519-z
81. Greenberg MVC, Bourc'his D. The diverse roles of DNA methylation in mammalian development and disease. Nat Rev Mol Cell Biol. (2019) 20:590–607. doi: 10.1038/s41580-019-0159-6
82. Mullen RJ, Buck CR, Smith AM. Neun, a neuronal specific nuclear protein in vertebrates. Development. (1992) 116:201–11.
83. Maxeiner S, Glassmann A, Kao HT, Schilling K. The molecular basis of the specificity and cross-reactivity of the neun epitope of the neuron-specific splicing regulator, Rbfox3. Histochem Cell Biol. (2014) 141:43–55. doi: 10.1007/s00418-013-1159-9
84. Duan W, Zhang YP, Hou Z, Huang C, Zhu H, Zhang CQ, et al. Novel insights into neun: from neuronal marker to splicing regulator. Mol Neurobiol. (2016) 53:1637–47. doi: 10.1007/s12035-015-9122-5
85. Keller D, Erö C, Markram H. Cell densities in the mouse brain: a systematic review. Front Neuroanat. (2018) 12:83. doi: 10.3389/fnana.2018.00083
86. Crouch EE, Doetsch F. FACS isolation of endothelial cells and pericytes from mouse brain microregions. Nat Protoc. (2018) 13:738. doi: 10.1038/nprot.2017.158
87. Desi N, Tay Y. The butterfly effect of RNA alterations on transcriptomic equilibrium. Cells. (2019) 8:1634. doi: 10.3390/cells8121634
88. Wang Y-C, Peterson SE, Loring JF. Protein post-translational modifications and regulation of pluripotency in human stem cells. Cell Res. (2014) 24:143–60. doi: 10.1038/cr.2013.151
Keywords: epilepsy, NeuN, TLE, glia, neuron, gene expression, DNA methylation, epigenetics
Citation: Berger TC, Vigeland MD, Hjorthaug HS, Nome CG, Taubøll E, Selmer KK and Heuser K (2020) Differential Glial Activation in Early Epileptogenesis—Insights From Cell-Specific Analysis of DNA Methylation and Gene Expression in the Contralateral Hippocampus. Front. Neurol. 11:573575. doi: 10.3389/fneur.2020.573575
Received: 17 June 2020; Accepted: 06 October 2020;
Published: 16 November 2020.
Edited by:
Steven Neal Roper, University of Florida, United StatesReviewed by:
Luiz E. Mello, Federal University of São Paulo, BrazilFabio Rogerio, State University of Campinas, Brazil
Copyright © 2020 Berger, Vigeland, Hjorthaug, Nome, Taubøll, Selmer and Heuser. This is an open-access article distributed under the terms of the Creative Commons Attribution License (CC BY). The use, distribution or reproduction in other forums is permitted, provided the original author(s) and the copyright owner(s) are credited and that the original publication in this journal is cited, in accordance with accepted academic practice. No use, distribution or reproduction is permitted which does not comply with these terms.
*Correspondence: Toni C. Berger, dG9uaS5iZXJnZXJAbWVkaXNpbi51aW8ubm8=
†These authors have contributed equally to this work