
94% of researchers rate our articles as excellent or good
Learn more about the work of our research integrity team to safeguard the quality of each article we publish.
Find out more
ORIGINAL RESEARCH article
Front. Netw. Physiol. , 24 September 2024
Sec. Networks in the Cardiovascular System
Volume 4 - 2024 | https://doi.org/10.3389/fnetp.2024.1443156
This article is part of the Research Topic Network Physiology: Insights into the Cardiovascular System, Vol II View all 4 articles
The stability of wave conduction in the heart is strongly related to the proper interplay between the electrophysiological activation and mechanical contraction of myocytes and extracellular matrix (ECM) properties. In this study, we statistically compare bioengineered cardiac tissues cultured on soft hydrogels (
When the heart’s normal rhythm is out of synchronization, the heart can beat too fast or too slow. Although this can be harmless and just the result of excessive coffee or stress, it can also have life-threatening consequences, causing fibrillation, a stroke, or heart failure (Adam et al., 1984; Konta et al., 1990). During the contraction of a healthy heart, electrical signals are usually transferred between the individual cardiomyocytes in a synchronized way (Gilbert et al., 2020). This process is essentially regulated by calcium (Ca2+), which is responsible for the link between the electrical activation (excitation) and the mechanical contraction, known as excitation–contraction coupling (López-López et al., 1995; Bers, 2002; Pfeiffer et al., 2014). If a malfunction in the calcium dynamics occurs, heart rhythm disorders are one possible result (Pfeiffer et al., 2014). Since these disorders affect many people worldwide, scientists try to investigate the underlying causes.
One field of investigation focuses on alternans, a precursor of cardiac arrhythmia. Alternans appears as heartbeats that alternate between strong and weak despite a constant heart rate (Mitchell et al., 1963; Sipido, 2004). At a cellular level, alternans occurs as beat-to-beat alternations in the contraction amplitude (mechanical alternans), action potential (AP) duration (electrical alternans), or intracellular calcium transient (Ca2+ alternans) (Edwards and Blatter, 2014; Euler, 1999). It is often found in patients with heart diseases, such as myocardial infarction (Ikeda et al., 2000), and can be triggered by factors such as ischemia (Konta et al., 1990; Dilly and Lab, 1988), an elevated heart rate (Schweigmann et al., 2014), or reduced coronary blood flow due to occlusion Green (1935). Tissue culture experiments reveal two different types: spatially concordant alternans (SCA) and spatially discordant alternans (SDA). In the first type, the whole tissue alternates in phase, whereas the latter can have regions that alternate out of phase (Gizzi et al., 2013; Garfinkel, 2007). Both alternans types are induced by an increase in the heart rate, where SCA appears first, followed by SDA at higher rates (Pastore et al., 1999). If the heart frequency increases even further, SDA gets unstable and consequently initiates a wave break, which can lead to arrhythmic dynamics in the form of spiral waves (Pastore et al., 1999; Karma and Gilmour, 2007). These spiral waves are problematic because they suppress normal heart waves and may lead to fibrillation, i.e., chaotic wave dynamics (Karma and Gilmour, 2007). Regarding the onset of alternans, particularly SDA, a relation to the tissue ultrastructure has been identified (Loppini et al., 2022). A high level of spatial heterogeneity between individual cardiac cells promotes SDA formation already at slower heart frequencies (Loppini et al., 2022; Krogh-Madsen and Christini, 2007).
When conducting in vitro experiments, high-frequency electrical pacing represents one commonly used approach to induce contraction in cardiomyocytes and can, therefore, be used to trigger alternans in cell culture or perfused hearts. Studies based on this procedure found that the formation of alternans can be promoted by hypothermia (Gizzi et al., 2017; Loppini et al., 2021), the tissue’s ultrastructure (Loppini et al., 2022), the tissue composition (Kohl and Gourdie, 2014; Bowers et al., 2010), or the substrate rigidity (Hörning et al., 2012a; Hegyi et al., 2021). Considering the rigidity, cardiac cells are more likely to exhibit alternans under high-frequency pacing when cultivated on a substrate that corresponds to the natural rigidity of cardiomyocytes, i.e., 12 kPa (Hörning et al., 2012a; 2013). Similarly, cardiomyocytes embedded in 3D viscoelastic hydrogels, which impose the afterload from vascular resistance during contraction, exhibit both electrical and Ca2+ alternans (Hegyi et al., 2021).
As these last two examples illustrate, cells can actively perceive their surroundings and then react to chemical and mechanical changes in their environment, a process known as mechanosensing. This mechanosensing is closely intertwined with cues of the extracellular matrix (ECM), including features like structure proteins, rigidity, or topology, which together function as a network that aids cells in their adhesion, proliferation, migration, and differentiation (Adams and Watt, 1993; Bornstein and Sage, 2002; Missirlis et al., 2022). With regard to mechanical rigidity, often called the E-modulus, cells respond to the forces exerted by a substrate and adapt to the ECM provided (Hörning et al., 2012a; Engler et al., 2004). During in vitro experiments, the ECM stiffness is often embodied by hydrogels with an adjustable elasticity. Previous studies reveal a correlation between rigidity and the formation of cell focal adhesion; the stiffer a substrate, the more adhesion sites are expressed, resulting in stronger cell adhesion (Balaban et al., 2001). Additionally, substrates with a higher E-modulus induce changes in cell morphology, i.e., cell area and shape (Engler et al., 2004). Considering migration, cells prefer stiffer regions of hydrogels with a rigidity gradient (Lo et al., 2000; Kidoaki and Matsuda, 2008) and migrate toward an interface when a soft hydrogel with encapsulated cells is placed on a rigid surface (Wei et al., 2020).
In a similar way, the ECM proteins also have an influence on cellular reactions (Bornstein and Sage, 2002). Usually, hydrogels are functionalized with structure proteins, such as collagen or fibronectin, to support cell adhesion (Engler et al., 2004; Missirlis et al., 2022). Hence, a combination of both ECM properties takes place in many studies, and the results indicate that mechanosensing is not only dependent on the viscoelastic properties but also on the binding strength of the surface proteins (Missirlis et al., 2022). Along these lines, we analyzed the morphology and proliferation of myoblasts on different elasticity and fibronectin density compositions in a previous study and found an independent regulation of cell characteristics (Brock et al., 2022). Based on these findings, we use hydrogels that resemble the ECM of cardiomyocytes to observe the formation of alternans in a more natural environment.
In this study, we introduce a simple but effective way to identify and quantify alternans on bioengineered cardiac tissues. We use these quantifiers, which distinguish SCA and SDA with simple V- and X-shaped probability phase map distributions, to investigate the critical threshold of alternans, i.e., the minimum pacing period, before the wave conduction destabilizes and leads to wave breakups. We statically compare tissues cultured on soft hydrogel (
Square (
Polyacrylamide (pAAm) hydrogels were prepared from a fresh 1 mL stock solution containing 648.9
Mechanical measurements of the E-modulus of the hydrogels were performed by nanoindentation using an atomic force microscope (AFM, NanoWizard, JPK Instruments, Berlin, Germany). A silicon nitride cantilever with a nominal spring constant of 0.08 N/m with an attached spherical colloidal probe (CP-PNP-BSG; R = 5
where
For the determination of the hydrogel height, hydrogels were stained with a 0.9 mM rose bengal solution (Sigma, 330000) for 1 h in the dark at RT, followed by incubation in distilled
Polyacrylamide gels were functionalized with fibronectin from human plasma (Sigma, F2006) using 3,4-dihydroxy-L-phenylalanine (L-DOPA, Sigma-Aldrich, D9628)) before cells were seeded. L-DOPA was prepared at a final concentration of 2 mg/mL in 10 mM Tris buffer (pH 10, Roth, 4855.1), incubated under shaking conditions for 30 min in dark, and sterile-filtrated through a 0.2-
For the preparation of cardiac tissue sheets, the hearts of 1–3-day-old Wistar rats were isolated. Isolated hearts were cleaned, minced, and enzymatically digested in five cycles using collagenase type I (Thermo Fisher). The isolated cells from the last four cycles were pre-plated for 1 h in plastic dishes to reduce the fraction of fibroblasts (Hörning et al., 2012a; 2017). Cells were plated at a density of
Prior to observation, the contractile cardiac tissue sheets were incubated with 200
Cardiac tissue sheets were electrically stimulated using platinum electrodes (
Selected samples were washed for 5 min with PBS-EGTA (PBS with 2 mM EGTA, Roth, 3054.2), fixed for 5 min in 4% formaldehyde (in PBS, Thermo Scientific, 175 J60401. AK) in PBS-EGTA with 0.1% Triton X-100 (Roth, 3051.3), and washed twice with ice-cold PBS for 5 min. The samples were blocked for 20 min with 400
The fluorescent-stained tissues were imaged using an Axio Observer Z1/7 spinning-disk confocal microscope with a ×40 objective (Plan-Apochromat 1.4 Oil DIC UV, Zeiss) and an Axiocam 503 Mono CCD Camera (Carl Zeiss Microscopy GmbH) at a resolution of
Data were analyzed using customized routines in MATLAB (MATLAB, 2023). The recorded movies were subsequently pre-processed by background subtraction, averaged in time (10 frames), and filtered in space with Gaussian blur (10 px) using ImageJ (1.54f) (Loppini et al., 2022).
Restitution properties and conduction velocity (CV) were extracted from individual waves by the detection of the upstroke and maxima of waves. The calcium transient (CT) was analyzed at a normalized calcium intensity of 50% of each individual wave to obtain the calcium transient duration (CTD) and calcium transient interval (CTI). The CV was calculated from a straight line along the direction of wave propagation. A linear regression fit of all extracted locations along that line was used to calculate the CV for each wave.
The normalized CTD maps were calculated by taking advantage of the periodic signal using the signal oversampling technique (Hörning et al., 2017). The periodic signal is stacked by equidistant time intervals, which reduces the noise ratio as the square root of the number of measurements (Uzelac and Fenton, 2015). Hence, the pixel-wise-averaged CTD was computed from the stacked calcium transient
where
as
for each individual pixel. The normalized CTD is calculated as the mean of
The electromechanical wave conduction stabilizes and alters the offset of alternans initiation when the rigidity of the substrate matches that of the cardiac cells, i.e., Young’s modulus for both the hydrogel and cardiac cells is
In this study, we introduce a stable in vitro platform for cardiac tissues that closely mimics the biological ECM and reliably withstands the strong forces of contractile cardiac cells for the investigation of the electromechanical initiation of alternans. For that, we compare two substrate conditions. On one hand, we use glass substrates that are coated with fibronectin, as glass substrates are still used in most studies that investigate the dynamics of primarily cultured (Entcheva et al., 2000; Hörning et al., 2017) and stem cell-derived cardiac tissues (Klimas et al., 2016; Heinson et al., 2023). On the other hand, we utilize the ECM-mimicking hydrogel platform that has been introduced recently for the study of myocyte proliferation dynamics (Brock et al., 2022). Figure 1A schematically illustrates the difference between both substrates. Although the fibronectin is simply coated on glass and may be influenced by the dynamics of cells, it is covalently bound by L-DOPA to the hydrogel. The hydrogels are bound to the glass substrates using vinyltrimethoxysilane (see Section 2), which reliably withstands the strong contractile forces of the cells during tissue development and subsequent observation. The hydrogels were prepared with a rigidity of
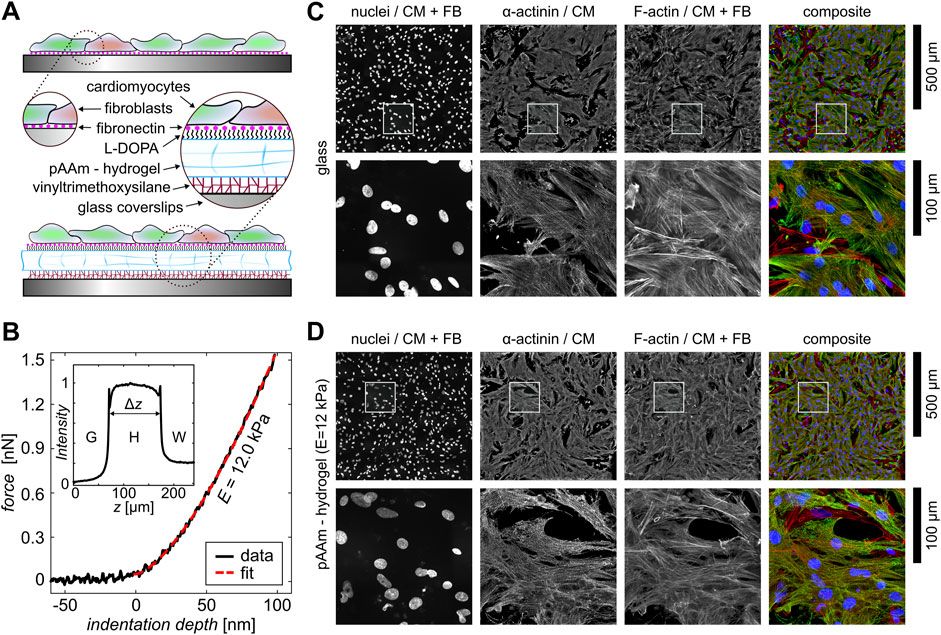
Figure 1. Experimental setup of cardiac monolayers on different substrates. (A) Schematic illustration of the different bioengineered cardiac monolayer constructs on glass and hydrogels. (B) One exemplary nano-indentation curve measured at the pAAm-hydrogel (black data). The red dashed line shows the corresponding fit. The inset shows a rose-bengal-stained signal intensity profile of a hydrogel. The normalized intensity is shown as a function of the height
Primary cardiac tissue culture is naturally composed of cardiac and fibroblast cells. The fraction of both defines the stability of wave conduction (Petrov et al., 2010; Rother et al., 2015), i.e., a lower likelihood of wave breaks that may lead to spiral waves. So, using the proliferation inhibitor ARA-C, we minimize the number of fibroblasts. Figures 1C, D show large, high-resolution image composites of fluorescent-stained, confluent cardiac tissues on glass and hydrogel. The figures include single-channel images of the cell nuclei, the sarcomere-specific
Alternans can occur in high-frequency-entrained (Gizzi et al., 2013) and freely rotating and heterogeneity-pinned spiral waves (Hörning et al., 2017). At low wave frequencies, no alternans is observed as the electrophysiological dynamics recover to their resting state and no wave-to-wave interaction takes place. Higher frequencies, however, can lead to alternans. Figure 2A shows a typical example of glass observed at 37°C. The upper two signals show CTs at pacing periods of
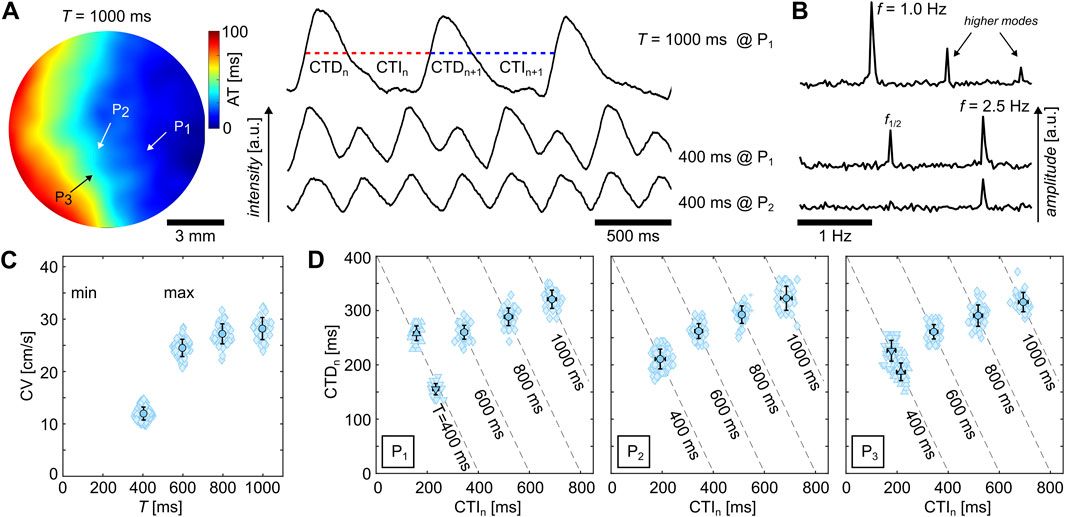
Figure 2. Examples of calcium transient dynamics in cardiac monolayers cultured on glass observed at 37°C. (A) Activation time map of a
Alternans can be observed either exclusively or in combination in the APs, CTs, and CVs (Edwards and Blatter, 2014; Euler, 1999). In the case of the example illustrated in Figure 2, the CV does not exhibit alternans. Figures 2C, D show the restitution and dispersion curves of the sample observed at
In order to visually confirm the presence of SDA, every pixel of the recorded movie generally needs to be analyzed, as shown in Figure 2D, and the mean values have to be pixel-wise recomposed to a single image. However, this might lead to problems with noisy data or alternatively imply the need for stronger spatiotemporal filters since every individual CT must be identified. So, in this study, we use a signal oversampling technique (Hörning et al., 2017) to generate normalized CTD maps as it reduces the noise ratio by the square root of the number of measurements (Uzelac and Fenton, 2015). The repetitive wave patterns are stacked by an equidistant time interval,
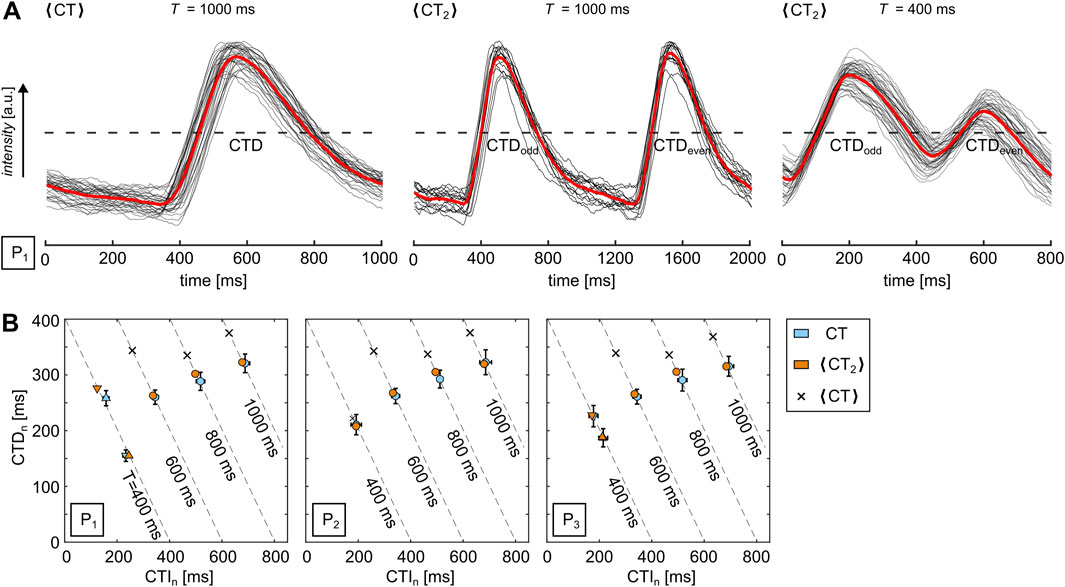
Figure 3. Quantification of alternans via signal oversampling. (A) Examples of normalized calcium transience (red lines) for
However, a disadvantage of this approach is the accumulating time shift
For the spatial quantification of alternans, the pixel-wise analysis of
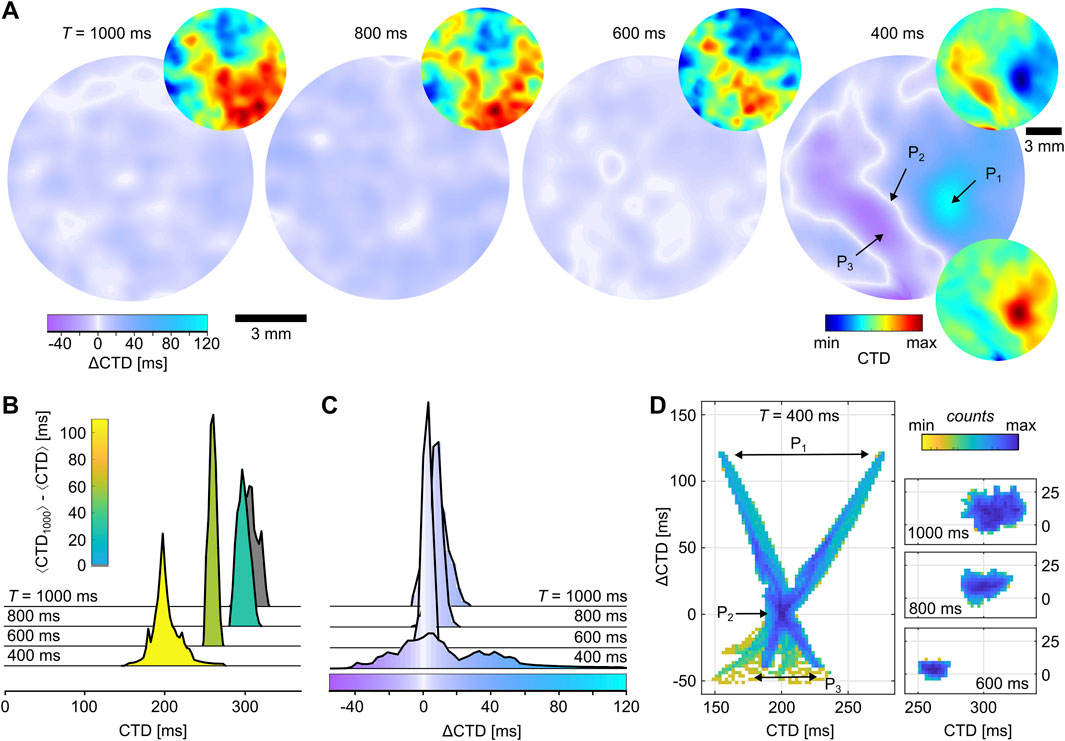
Figure 4. Calcium transient dynamics in cardiac monolayers cultured on glass. (A) Normalized CTD (small) and
Although the normalized CTD and
Following the same approach as shown for the cardiac monolayers cultured on glass, we now investigate exemplarily a cardiac monolayer that is cultured on hydrogel (see Figure 1). Furthermore, we change the observation setup to RT as hypothermia promotes the formation of alternans (Gizzi et al., 2017; Crispino et al., 2024). For identifying the initiation and transition of alternans, we increased the number of stimulation periods in the range of
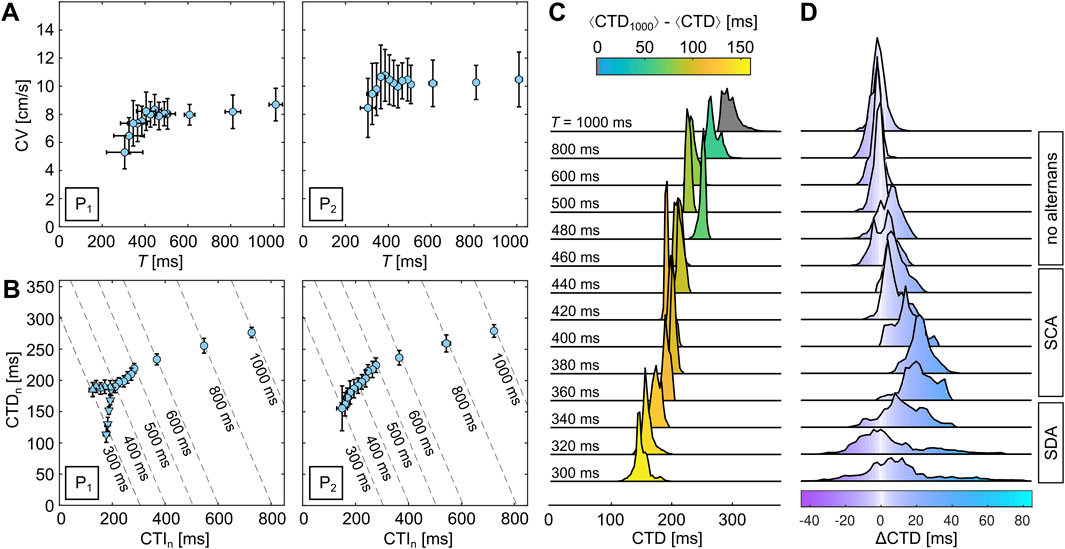
Figure 5. Quantification of calcium transient alternans in cardiac monolayers cultured on hydrogels. (A, B) Dispersion and restitution curves for two locations,
The transitions to SCA and SDA can be visualized using probability phase maps. Figures 6A, B exemplify the transition of alternans to SCA, i.e., from a spherical to a V-shaped distribution. Although the
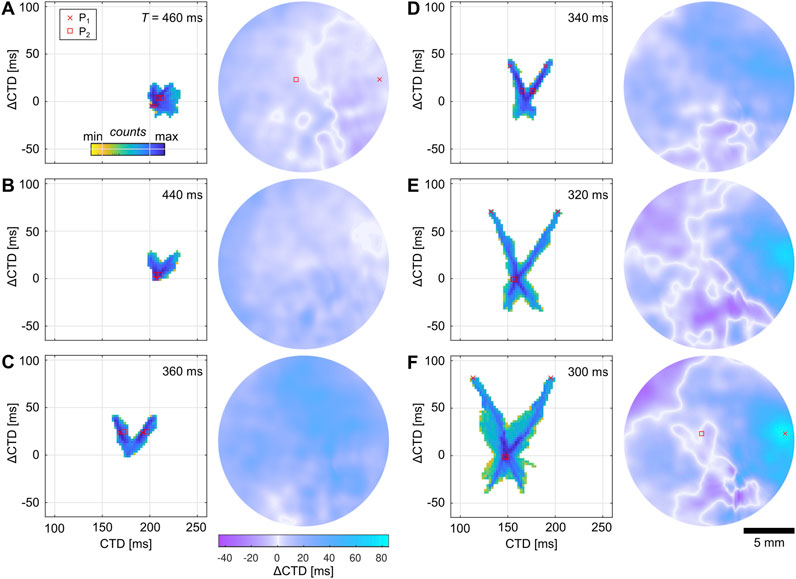
Figure 6. Spatial quantification of calcium transient alternans in cardiac monolayers cultured on hydrogels. (A–F) Probability phase maps (left) and
Activation time maps (ATMs) are used for the visualization of the transition to spiral waves at
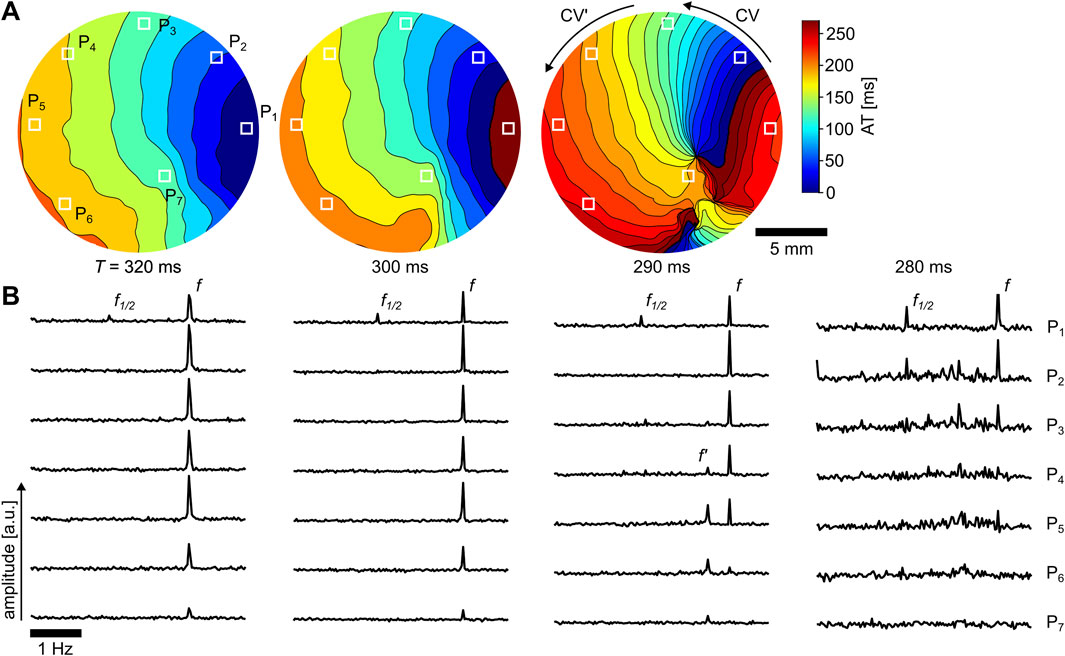
Figure 7. Initiation of spiral wave breakups from alternans. (A) ATMs for stimulation periods of
FDP is a spatiotemporal phenomenon where a single high-frequency source leads to more than one frequency domain within the tissue (Berenfeld et al., 2000). It is caused by tissue structurally induced delays of the propagating AP that may lead to fibrillation (Berenfeld et al., 2002). In the case shown in Figure 7 for
As the initiation of alternans is altered when tissues are cultured on ECMs that mimic the natural tissue environment, i.e., substrate rigidity is equal to the cell rigidity (Hörning et al., 2012a; 2013), we next spatially quantify and statistically compare the network physiological properties of calcium transient alternans on two different substrates—soft hydrogels (
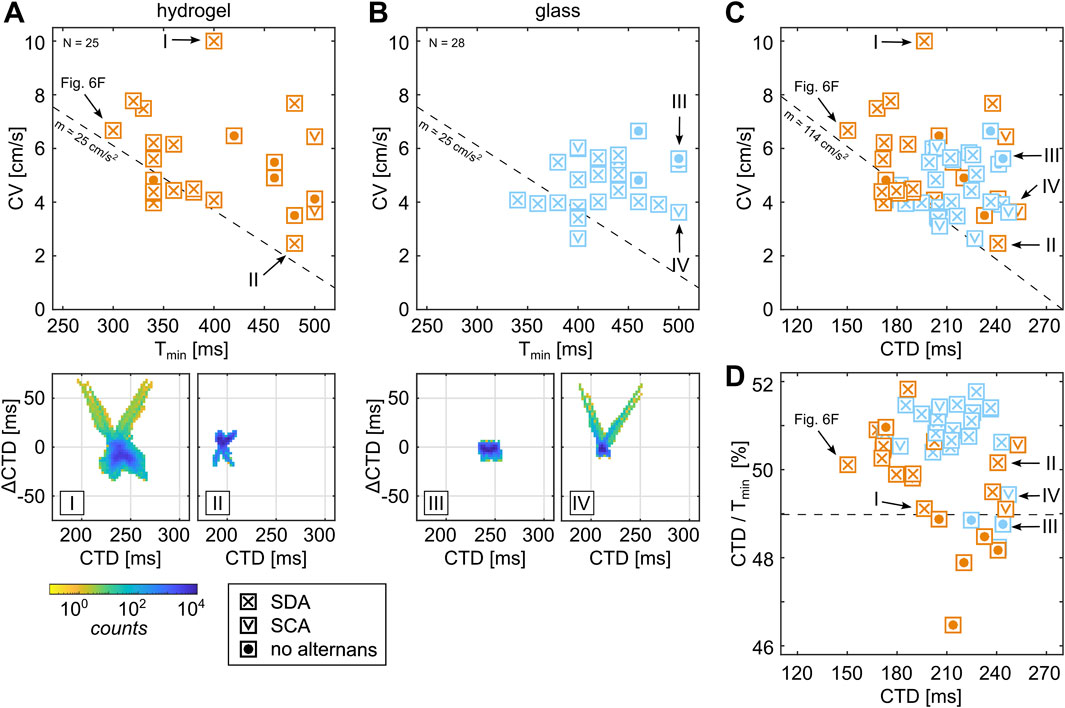
Figure 8. Comparison of the critical pacing period of cardiac tissues on hydrogel and glass. (A, B) CVs of entrained cardiac tissues paced with
Although normal wave conduction (ImgGF [d4]) is observed in the combination of larger
Figure 9 shows the comparison between the restitution and dispersion properties of the tissues shown in Figure 8. Statistically, tissues on hydrogel show slightly higher CVs than those on glass substrates. This is more pronounced for lower pacing periods (
where
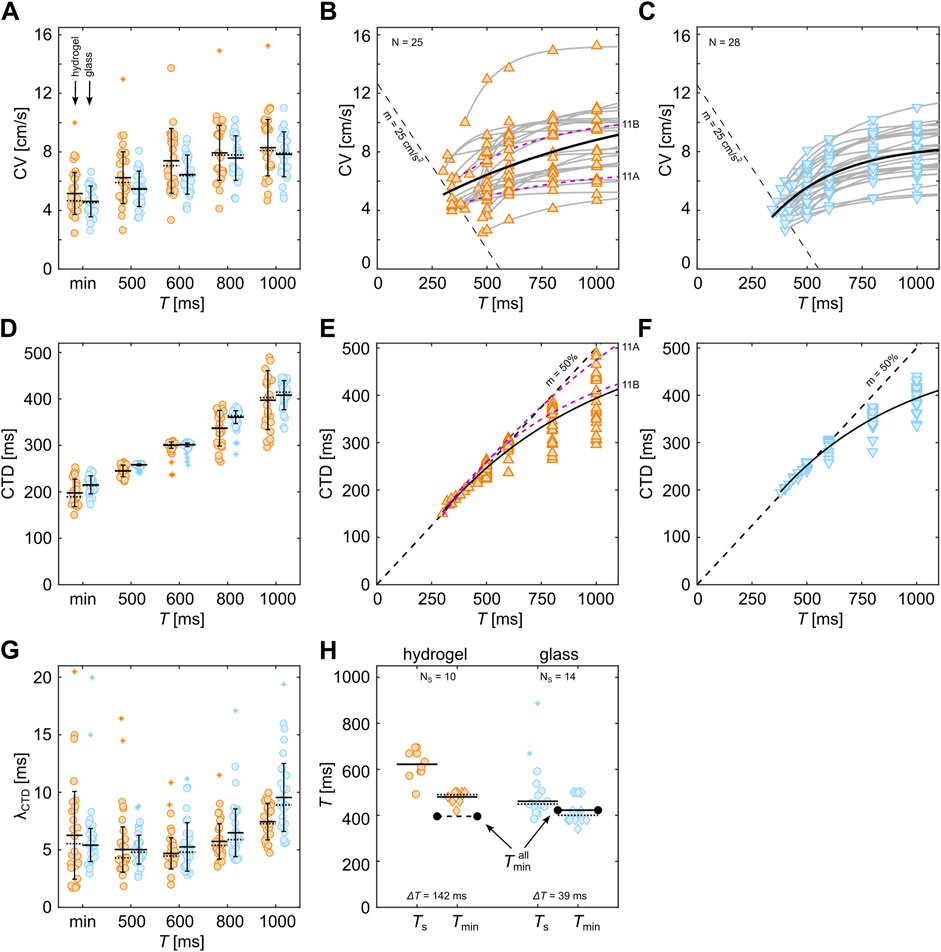
Figure 9. Comparison of restitution and dispersion properties of cardiac tissues on hydrogel and glass. (A–C) Comparison between restitution properties, (D–G) comparison between dispersion properties, and (H) comparison between spiral period

Table 1. Fitting parameter for restitution and dispersion curves of tissues cultured on hydrogels and glass substrates determined using Equation 5. The errors are the standard deviations (68% confidence intervals).
In contrast to the dispersion properties, the restitution properties show much less prominent variability (Figures 9D–F). The average CTDs obtained on hydrogels are comparable to glass but show a slightly larger variability. Figures 9E, F show the restitution curves without the fittings of the individual curves. Only the all-in-all-substrate-dependent fits (solid black lines) are shown. The latter culminates for smaller
Next, we investigate how the variability of CTDs in cells within tissues affects the generation of wave breakups and the formation of stable waves. Figure 9G illustrates this variability by calculating the standard deviation of the measured CTDs in each tissue
After the determination of
In very few tissues (N = 1), the formation of stable alternans was observed. Figure 10 shows the FFI analysis of this spiral. The Fourier phase map of the frequencies

Figure 10. SCA in a spiral wave. (A) Stable spiral wave in cardiac tissue on a glass substrate that exhibits SCA and two calcium transient traces of normal wave conduction (top,
We have introduced a simple but effective way to identify and quantify alternans in bioengineered cardiac tissues by introducing probability maps of CTD and
The statistical analysis of the critical pacing period revealed a common substrate-independent threshold between CTD and CV. As it remains difficult to classify the quality of bioengineered tissues, the general validity remains to be shown for naturally grown tissues and more physiologically relevant temperature ranges as we investigated hypothermic conditions (room temperature) only. We identified common electrophysiological properties when alternans forms (Figure 8D); however, despite very similar electrophysiological and ECM properties, there are cases that defy the odds and do not show alternans. Figure 11A shows such an example where no alternans was detected. For comparison, a tissue that exhibits very expansive SDA at very similar CVs, CTDs, and substrate conditions is shown in Figure 11B. Those two tissues illustrate that there are still unknown properties that may cause alternans. Such a property in the ultrastructure of the tissue could be related to recent findings, such as the extraction of ultrastructure from ex vivo canine ventricles to recover SDA dynamics in silico (Loppini et al., 2022) or the difference in the restitution and dispersion properties (see dashed purple lines in Figures 9B, E). Thus, further investigation is also needed on a theoretical level to study potential instabilities in the intracellular calcium cycling.
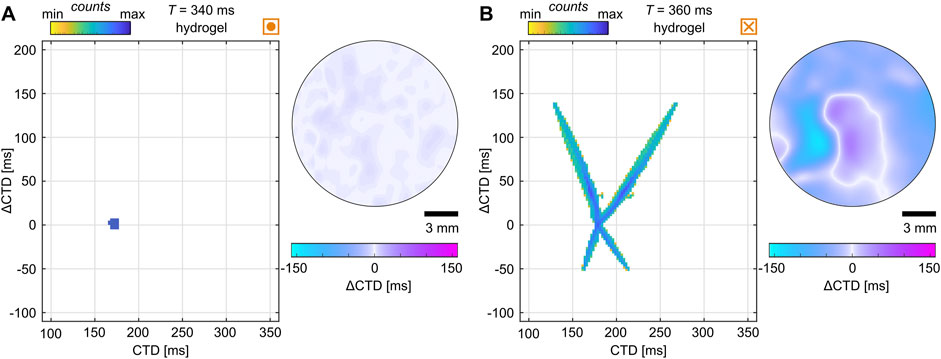
Figure 11. Examples of similar electrophysiological properties but different dynamics. (A, B) Probability phase maps (left) and
The substrate-depending dynamics of CTs revealed their influence on the stability of spiral waves. Myocardial scars have altered structural and mechanical properties compared to healthy tissue (Richardson et al., 2015; Münch and Abdelilah-Seyfried, 2021), which can facilitate the formation and stabilization of spiral waves in cardiac tissue (Connolly and Bishop, 2016; Song, 2023). In line with this, we showed that the enhanced mechanical contractility of cells on soft substrates, which mimic native extracellular matrix properties, lowers the likelihood of forming stable spiral waves; this is due to increased wave stability and change in excitability, leading to larger spiral tip trajectories and a greater chance of self-termination at the boundary of the tissue. Interestingly, reduced contractility on glass substrates seems to promote the formation of SCA and SDA in spiral waves, as observed in this study (see Figure 11) and in Hörning et al. (2017). We have not observed stable spiral waves with alternans in tissues cultured on soft hydrogels.
Although this study focuses on the comparison of CTs in tissues cultured on soft and rigid substrates, the introduced analysis approach can also be potentially applied to ex vivo experiments to visualize alternans dynamics (Berenfeld et al., 2000; Loppini et al., 2022). Additionally, theoretical consideration would be useful to further understand the role of clinically relevant aspects, such as the influence of ectopic beats, the effect of the bidirectional coupling between voltage and calcium signaling, and the role of the electronic coupling between cells (Weiss et al., 2006; Qu and Weiss, 2023). The application to alternans observed in the AP and contraction amplitude remains to be shown, but it might reveal auspicious and useful biomedical insights, especially when using simultaneous records of APs, CTs, and contraction waves in cardiac tissue (Kong et al., 2003; Wang et al., 2014; Liu et al., 2023; Crispino et al., 2024). This would be especially important to further discuss the dynamics and differences of electrical (Courtemanche et al., 1993; Echebarria and Karma, 2002; Bauer et al., 2007) and calcium-driven alternans (Shiferaw et al., 2005; Sato et al., 2006; Skardal et al., 2014) on a theoretical level as only the combination of both may suffice to fully understand alternans instability and the role of the ECM.
The raw data supporting the conclusions of this article will be made available by the authors, without undue reservation.
The animal study was approved by Ramona Böhm, University of Hohenheim, Hohenheim, Germany. The study was conducted in accordance with the local legislation and institutional requirements.
JE: data curation, formal analysis, methodology, visualization, writing–original draft, and writing–review and editing. SL: methodology, software, and writing–review and editing. JB: data curation, methodology, writing–original draft, and writing–review and editing. MH: conceptualization, data curation, formal analysis, funding acquisition, methodology, project administration, software, supervision, visualization, writing–original draft, and writing–review and editing.
The author(s) declare that financial support was received for the research, authorship, and/or publication of this article. This study was funded by the Deutsche Forschungsgemeinschaft (DFG, German Research Foundation)—442207423.
The authors thank Kai Hirzel and Theresa Kühn for their insights and support with hydrogel height determination. They also extend their gratitude to Joachim Spatz and Cornelia Miksch for provision of the AFM at the Max Planck Institute for Intelligent Systems, Stuttgart, Germany. They thank Arnd Heyer, Theresa Kühn, and Ingrid Weiss for the fruitful discussions. They also thank the team at the central facility for biological and biomedical research with animal facility, University of Hohenheim, for the provision of the animals.
The authors declare that the research was conducted in the absence of any commercial or financial relationships that could be construed as a potential conflict of interest.
All claims expressed in this article are solely those of the authors and do not necessarily represent those of their affiliated organizations, or those of the publisher, the editors, and the reviewers. Any product that may be evaluated in this article, or claim that may be made by its manufacturer, is not guaranteed or endorsed by the publisher.
The Supplementary Material for this article can be found online at: https://www.frontiersin.org/articles/10.3389/fnetp.2024.1443156/full#supplementary-material
Adam, D. R., Smith, J. M., Akselrod, S., Nyberg, S., Powell, A. O., and Cohen, R. J. (1984). Fluctuations in T-wave morphology and susceptibility to ventricular fibrillation. J. Electrocardiol. 17, 209–218. doi:10.1016/s0022-0736(84)80057-6
Adams, J., and Watt, F. (1993). Regulation of development and differentiation by the extracellular matrix. Development 117, 1183–1198. doi:10.1242/dev.117.4.1183
Balaban, N. Q., Schwarz, U. S., Riveline, D., Goichberg, P., Tzur, G., Sabanay, I., et al. (2001). Force and focal adhesion assembly: a close relationship studied using elastic micropatterned substrates. Nat. Cell Biol. 3, 466–472. doi:10.1038/35074532
Bauer, S., Röder, G., and Bär, M. (2007). Alternans and the influence of ionic channel modifications: cardiac three–dimensional simulations and one-dimensional numerical bifurcation analysis. Chaos An Interdiscip. J. Nonlinear Sci. 17, 015104. doi:10.1063/1.2715668
Berenfeld, O., Mandapati, R., Dixit, S., Skanes, A. C., Chen, J., Mansour, M., et al. (2000). Spatially distributed dominant excitation frequencies reveal hidden organization in atrial fibrillation in the langendorff-perfused sheep heart. J. Cardiovasc. Electrophysiol. 11, 869–879. doi:10.1111/j.1540-8167.2000.tb00066.x
Berenfeld, O., Zaitsev, A. V., Mironov, S. F., Pertsov, A. M., and Jalife, J. (2002). Frequency-dependent breakdown of wave propagation into fibrillatory conduction across the pectinate muscle network in the isolated sheep right atrium. Circulation Res. 90, 1173–1180. doi:10.1161/01.RES.0000022854.95998.5C
Bers, D. M. (2002). Cardiac excitation–contraction coupling. Nature 415, 198–205. doi:10.1038/415198a
Bien, H., Yin, L., and Entcheva, E. (2006). Calcium instabilities in mammalian cardiomyocyte networks. Biophysical J. 90, 2628–2640. doi:10.1529/biophysj.105.063321
Bornstein, P., and Sage, E. H. (2002). Matricellular proteins: extracellular modulators of cell function. Curr. Opin. Cell Biol. 14, 608–616. doi:10.1016/s0955-0674(02)00361-7
Bowers, S. L., Borg, T. K., and Baudino, T. A. (2010). The dynamics of fibroblast–myocyte–capillary interactions in the heart. Ann. N. Y. Acad. Sci. 1188, 143–152. doi:10.1111/j.1749-6632.2009.05094.x
Brock, J., Erhardt, J., Eisler, S. A., and Hörning, M. (2022). Optimization of mechanosensitive cross-talk between matrix stiffness and protein density: independent matrix properties regulate spreading dynamics of myocytes. Cells 11, 2122. doi:10.3390/cells11132122
Butt, H.-J., Cappella, B., and Kappl, M. (2005). Force measurements with the atomic force microscope: technique, interpretation and applications. Surf. Sci. Rep. 59, 1–152. doi:10.1016/j.surfrep.2005.08.003
Connolly, A. J., and Bishop, M. J. (2016). Computational representations of myocardial infarct scars and implications for arrhythmogenesis. Clin. Med. Insights. Cardiol. 10, 27–40. doi:10.4137/CMC.S39708
Courtemanche, M., Glass, L., and Keener, J. P. (1993). Instabilities of a propagating pulse in a ring of excitable media. Phys. Rev. Lett. 70, 2182–2185. doi:10.1103/PhysRevLett.70.2182
Crispino, A., Loppini, A., Uzelac, I., Iravanian, S., Bhatia, N. K., Burke, M., et al. (2024). A cross species thermoelectric and spatiotemporal analysis of alternans in live explanted hearts using dual voltage-calcium fluorescence optical mapping. Physiol. Meas. 45, 065001. doi:10.1088/1361-6579/ad4e8f
Dilly, S. G., and Lab, M. J. (1988). Electrophysiological alternans and restitution during acute regional ischaemia in myocardium of anaesthetized pig. J. Physiology 402, 315–333. doi:10.1113/jphysiol.1988.sp017206
Domke, J., and Radmacher, M. (1998). Measuring the elastic properties of thin polymer films with the atomic force microscope. Langmuir 14, 3320–3325. doi:10.1021/la9713006
Echebarria, B., and Karma, A. (2002). Instability and spatiotemporal dynamics of alternans in paced cardiac tissue. Phys. Rev. Lett. 88, 208101. doi:10.1103/PhysRevLett.88.208101
Echebarria, B., Röder, G., Engel, H., Davidsen, J., and Bär, M. (2011). Supernormal conduction in cardiac tissue promotes concordant alternans and action potential bunching. Phys. Rev. E 83, 040902. doi:10.1103/PhysRevE.83.040902
Edwards, J. N., and Blatter, L. A. (2014). Cardiac alternans and intracellular calcium cycling. Clin. Exp. Pharmacol. and physiology 41, 524–532. doi:10.1111/1440-1681.12231
Engler, A., Bacakova, L., Newman, C., Hategan, A., Griffin, M., and Discher, D. (2004). Substrate compliance versus ligand density in cell on gel responses. Biophysical J. 86, 617–628. doi:10.1016/S0006-3495(04)74140-5
Entcheva, E., Lu, S. N., Troppman, R. H., Sharma, V., and Tung, L. (2000). Contact fluorescence imaging of reentry in monolayers of cultured neonatal rat ventricular myocytes. J. Cardiovasc. Electrophysiol. 11, 665–676. doi:10.1111/j.1540-8167.2000.tb00029.x
Euler, D. E. (1999). Cardiac alternans: mechanisms and pathophysiological significance. Cardiovasc. Res. 42, 583–590. doi:10.1016/S0008-6363(99)00011-5
Garfinkel, A. (2007). Eight (or more) kinds of alternans. J. Electrocardiol. 40, S70–S74. doi:10.1016/j.jelectrocard.2007.06.011
Gilbert, G., Demydenko, K., Dries, E., Puertas, R. D., Jin, X., Sipido, K., et al. (2020). Calcium signaling in cardiomyocyte function. Cold Spring Harb. Perspect. Biol. 12, a035428. doi:10.1101/cshperspect.a035428
Gizzi, A., Cherry, E., Gilmour, R. F. J., Luther, S., Filippi, S., and Fenton, F. H. (2013). Effects of pacing site and stimulation history on alternans dynamics and the development of complex spatiotemporal patterns in cardiac tissue. Front. Physiology 4, 71. doi:10.3389/fphys.2013.00071
Gizzi, A., Loppini, A., Cherry, E. M., Cherubini, C., Fenton, F. H., and Filippi, S. (2017). Multi-band decomposition analysis: application to cardiac alternans as a function of temperature. Physiol. Meas. 38, 833–847. doi:10.1088/1361-6579/aa64af
Green, H. D. (1935). The nature of ventricular alternation resulting from reduced coronary blood flow. Am. J. Physiology-Legacy Content 114, 407–413. doi:10.1152/ajplegacy.1935.114.2.407
Hegyi, B., Shimkunas, R., Jian, Z., Izu, L. T., Bers, D. M., and Chen-Izu, Y. (2021). Mechanoelectric coupling and arrhythmogenesis in cardiomyocytes contracting under mechanical afterload in a 3D viscoelastic hydrogel. Proc. Natl. Acad. Sci. 118, e2108484118. doi:10.1073/pnas.2108484118
Heinson, Y. W., Han, J. L., and Entcheva, E. (2023). Portable low-cost macroscopic mapping system for all-optical cardiac electrophysiology. J. Biomed. Opt. 28, 016001. doi:10.1117/1.JBO.28.1.016001
Hörning, M., Blanchard, F., Isomura, A., and Yoshikawa, K. (2017). Dynamics of spatiotemporal line defects and chaos control in complex excitable systems. Sci. Rep. 7, 7757. doi:10.1038/s41598-017-08011-z
Hörning, M., Kidoaki, S., Kawano, T., and Yoshikawa, K. (2012a). Rigidity matching between cells and the extracellular matrix leads to the stabilization of cardiac conduction. Biophysical J. 102, 379–387. doi:10.1016/j.bpj.2011.12.018
Hörning, M., Kidoaki, S., Kawano, T., and Yoshikawa, K. (2013). Correction of rigidity matching between cells and the extracellular matrix leads to the stabilization of cardiac conduction. Biophysical J. 104, 2110. doi:10.1016/j.bpj.2013.04.011
Hörning, M., Takagi, S., and Yoshikawa, K. (2012b). Controlling activation site density by low-energy far-field stimulation in cardiac tissue. Phys. Rev. E 85, 061906. doi:10.1103/PhysRevE.85.061906
Hussaini, S., Majumder, R., Krinski, V., and Luther, S. (2023). In silico optical modulation of spiral wave trajectories in cardiac tissue. Pflügers Archiv - Eur. J. Physiology 475, 1453–1461. doi:10.1007/s00424-023-02889-7
Ikeda, T., Sakata, T., Takami, M., Kondo, N., Tezuka, N., Nakae, T., et al. (2000). Combined assessment of T-wave alternans and late potentials used to predict arrhythmic events after myocardial infarction. A prospective study. J. Am. Coll. Cardiol. 35, 722–730. doi:10.1016/s0735-1097(99)00590-2
Karma, A., and Gilmour, R. F. (2007). Nonlinear dynamics of heart rhythm disorders. Phys. Today 60, 51–57. doi:10.1063/1.2718757
Kern, W., and Puotinen, D. A. (1970). Cleaning solutions based on hydrogen peroxide for use in silicon semiconductor technology. RCA Rev. 31, 187–206.
Kidoaki, S., and Matsuda, T. (2008). Microelastic gradient gelatinous gels to induce cellular mechanotaxis. J. Biotechnol. 133, 225–230. doi:10.1016/j.jbiotec.2007.08.015
Kim, T. Y., Woo, S.-J., Hwang, S.-m., Hong, J. H., and Lee, K. J. (2007). Cardiac beat-to-beat alternations driven by unusual spiral waves. Proc. Natl. Acad. Sci. 104, 11639–11642. doi:10.1073/pnas.0704204104
Klimas, A., Ambrosi, C. M., Yu, J., Williams, J. C., Bien, H., and Entcheva, E. (2016). OptoDyCE as an automated system for high-throughput all-optical dynamic cardiac electrophysiology. Nat. Commun. 7, 11542. doi:10.1038/ncomms11542
Kohl, P., and Gourdie, R. G. (2014). Fibroblast–myocyte electrotonic coupling: does it occur in native cardiac tissue? J. Mol. Cell. Cardiol. 70, 37–46. doi:10.1016/j.yjmcc.2013.12.024
Kong, W., Walcott, G. P., Smith, W. M., Johnson, P. L., and Knisley, S. B. (2003). Emission ratiometry for simultaneous calcium and action potential measurements with coloaded dyes in rabbit hearts: reduction of motion and drift. J. Cardiovasc. Electrophysiol. 14, 76–82. doi:10.1046/j.1540-8167.2003.02077.x
Konta, T., Ikeda, K., Yamaki, M., Nakamura, K., Honma, K., Kubota, I., et al. (1990). Significance of discordant ST alternans in ventricular fibrillation. Circulation 82, 2185–2189. doi:10.1161/01.CIR.82.6.2185
Krogh-Madsen, T., and Christini, D. J. (2007). Action potential duration dispersion and alternans in simulated heterogeneous cardiac tissue with a structural barrier. Biophysical J. 92, 1138–1149. doi:10.1529/biophysj.106.090845
Lin, D. C., Dimitriadis, E. K., and Horkay, F. (2006). Robust strategies for automated AFM force curve analysis—I. Non-Adhesive indentation of soft, inhomogeneous materials. J. Biomechanical Eng. 129, 430–440. doi:10.1115/1.2720924
Liu, W., Han, J. L., Tomek, J., Bub, G., and Entcheva, E. (2023). Simultaneous widefield voltage and dye-free optical mapping quantifies electromechanical waves in human induced pluripotent stem cell-derived cardiomyocytes. ACS Photonics 10, 1070–1083. doi:10.1021/acsphotonics.2c01644
Lo, C. M., Wang, H. B., Dembo, M., and Wang, Y. L. (2000). Cell movement is guided by the rigidity of the substrate. Biophysical J. 79, 144–152. doi:10.1016/S0006-3495(00)76279-5
López-López, J. R., Shacklock, P. S., Balke, C. W., and Wier, W. G. (1995). Local calcium transients triggered by single L-type calcium channel currents in cardiac cells. Science 268, 1042–1045. doi:10.1126/science.7754383
Loppini, A., Barone, A., Gizzi, A., Cherubini, C., Fenton, F. H., and Filippi, S. (2021). Thermal effects on cardiac alternans onset and development: a spatiotemporal correlation analysis. Phys. Rev. E 103, L040201. doi:10.1103/PhysRevE.103.L040201
Loppini, A., Erhardt, J., Fenton, F. H., Filippi, S., Hörning, M., and Gizzi, A. (2022). Optical ultrastructure of large mammalian hearts recovers discordant alternans by in silico data assimilation. Front. Netw. Physiology 2, 866101. doi:10.3389/fnetp.2022.866101
MATLAB (2023). MATLAB version: 9.14.0 (R2023b). Natick, Massachusetts, United States: The MathWorks Inc. Available at: https://www.mathworks.com.
Missirlis, D., Heckmann, L., Haraszti, T., and Spatz, J. P. (2022). Fibronectin anchoring to viscoelastic poly(dimethylsiloxane) elastomers controls fibroblast mechanosensing and directional motility. Biomaterials 287, 121646. doi:10.1016/j.biomaterials.2022.121646
Mitchell, J. H., Sarnoff, S. J., and Sonnenblick, E. H. (1963). The dynamics of pulsus alternans: alternating end-diastolic fiber-length as a causative factor. J. Clin. Investigation 42, 55–63. doi:10.1172/JCI104696
Münch, J., and Abdelilah-Seyfried, S. (2021). Sensing and responding of cardiomyocytes to changes of tissue stiffness in the diseased heart. Front. Cell Dev. Biol. 9, 642840. doi:10.3389/fcell.2021.642840
Ott, C., and Jung, T. (2023). The MyoPulser field stimulator, a do it yourself programmable electronic pacemaker for contracting cells and tissues. Sci. Rep. 13, 2461. doi:10.1038/s41598-023-29145-3
Pastore, J. M., Girouard, S. D., Laurita, K. R., Akar, F. G., and Rosenbaum, D. S. (1999). Mechanism linking T-wave alternans to the genesis of cardiac fibrillation. Circulation 99, 1385–1394. doi:10.1161/01.CIR.99.10.1385
Petrov, V. S., Osipov, G. V., and Kurths, J. (2010). Fibroblasts alter spiral wave stability. Chaos An Interdiscip. J. Nonlinear Sci. 20, 045103. doi:10.1063/1.3527996
Pfeiffer, E. R., Tangney, J. R., Omens, J. H., and McCulloch, A. D. (2014). Biomechanics of cardiac electromechanical coupling and mechanoelectric feedback. J. Biomechanical Eng. 136, 021007–02100711. doi:10.1115/1.4026221
Qu, Z., and Weiss, J. N. (2023). Cardiac alternans: from bedside to bench and back. Circulation Res. 132, 127–149. doi:10.1161/CIRCRESAHA.122.321668
Qu, Z., Xie, F., Garfinkel, A., and Weiss, J. N. (2000). Origins of spiral wave meander and breakup in a two-dimensional cardiac tissue model. Ann. Biomed. Eng. 28, 755–771. doi:10.1114/1.1289474
Richardson, W. J., Clarke, S. A., Quinn, T. A., and Holmes, J. W. (2015). Physiological implications of myocardial scar structure. Compr. Physiol. 5, 1877–1909. doi:10.1002/cphy.c140067
Rother, J., Richter, C., Turco, L., Knoch, F., Mey, I., Luther, S., et al. (2015). Crosstalk of cardiomyocytes and fibroblasts in co-cultures. Open Biol. 5, 150038. doi:10.1098/rsob.150038
Sato, D., Shiferaw, Y., Garfinkel, A., Weiss, J. N., Qu, Z., and Karma, A. (2006). Spatially discordant alternans in cardiac tissue: role of calcium cycling. Circulation Res. 99, 520–527. doi:10.1161/01.RES.0000240542.03986.e7
Schweigmann, U., Biliczki, P., Ramirez, R. J., Marschall, C., Takac, I., Brandes, R. P., et al. (2014). Elevated heart rate triggers action potential alternans and sudden death. Translational study of a homozygous KCNH2 mutation. PLOS ONE 9, e103150. doi:10.1371/journal.pone.0103150
Shiferaw, Y., Sato, D., and Karma, A. (2005). Coupled dynamics of voltage and calcium in paced cardiac cells. Phys. Rev. E 71, 021903. doi:10.1103/PhysRevE.71.021903
Sipido, K. R. (2004). Understanding cardiac alternans: the answer lies in the Ca2+ store. Circulation Res. 94, 570–572. doi:10.1161/01.RES.0000124606.14903.6F
Skardal, P. S., Karma, A., and Restrepo, J. G. (2014). Spatiotemporal dynamics of calcium-driven cardiac alternans. Phys. Rev. E 89, 052707. doi:10.1103/PhysRevE.89.052707
Sneddon, I. N. (1965). The relation between load and penetration in the axisymmetric boussinesq problem for a punch of arbitrary profile. Int. J. Eng. Sci. 3, 47–57. doi:10.1016/0020-7225(65)90019-4
Song, E. (2023). Impact of noise on the instability of spiral waves in stochastic 2D mathematical models of human atrial fibrillation. J. Biol. Phys. 49, 521–533. doi:10.1007/s10867-023-09644-0
Uzelac, I., and Fenton, F. H. (2015). “Robust framework for quantitative analysis of optical mapping signals without filtering,” in 2015 computing in cardiology conference (CinC), 461–464. doi:10.1109/CIC.2015.7408686
Wang, L., Myles, R. C., Jesus, N. M. D., Ohlendorf, A. K. P., Bers, D. M., and Ripplinger, C. M. (2014). Optical mapping of sarcoplasmic reticulum Ca2+ in the intact HeartNovelty and significance: ryanodine receptor refractoriness during alternans and fibrillation. Circulation Res. 114, 1410–1421. doi:10.1161/CIRCRESAHA.114.302505
Wei, Q., Young, J., Holle, A., Li, J., Bieback, K., Inman, G., et al. (2020). Soft hydrogels for balancing cell proliferation and differentiation. ACS Biomaterials Sci. and Eng. 6, 4687–4701. doi:10.1021/acsbiomaterials.0c00854
Keywords: alternans, spiral waves, cardiomyocytes, mechano-regulation, calcium transients, mechanical contraction, excitation, pattern formation
Citation: Erhardt J, Ludwig S, Brock J and Hörning M (2024) Native mechano-regulative matrix properties stabilize alternans dynamics and reduce spiral wave stabilization in cardiac tissue. Front. Netw. Physiol. 4:1443156. doi: 10.3389/fnetp.2024.1443156
Received: 03 June 2024; Accepted: 09 September 2024;
Published: 24 September 2024.
Edited by:
Ulrich Parlitz, Max Planck Institute for Dynamics and Self-Organization, GermanyReviewed by:
Markus Baer, Physical-Technical Federal Institute, GermanyCopyright © 2024 Erhardt, Ludwig, Brock and Hörning. This is an open-access article distributed under the terms of the Creative Commons Attribution License (CC BY). The use, distribution or reproduction in other forums is permitted, provided the original author(s) and the copyright owner(s) are credited and that the original publication in this journal is cited, in accordance with accepted academic practice. No use, distribution or reproduction is permitted which does not comply with these terms.
*Correspondence: Marcel Hörning, bWFyY2VsLmhvZXJuaW5nQGJpby51bmktc3R1dHRnYXJ0LmRl
Disclaimer: All claims expressed in this article are solely those of the authors and do not necessarily represent those of their affiliated organizations, or those of the publisher, the editors and the reviewers. Any product that may be evaluated in this article or claim that may be made by its manufacturer is not guaranteed or endorsed by the publisher.
Research integrity at Frontiers

Learn more about the work of our research integrity team to safeguard the quality of each article we publish.