
94% of researchers rate our articles as excellent or good
Learn more about the work of our research integrity team to safeguard the quality of each article we publish.
Find out more
ORIGINAL RESEARCH article
Front. Netw. Physiol. , 22 May 2024
Sec. Networks in the Respiratory System
Volume 4 - 2024 | https://doi.org/10.3389/fnetp.2024.1396383
This article is part of the Research Topic Models of the Lung Based on Network Concepts View all 4 articles
 Joseph K. Hall1
 Jason H. T. Bates2
 Ramaswamy Krishnan3
 Jae Hun Kim1Yuqing Deng4Kenneth R. Lutchen1
 Béla Suki1*
Pulmonary fibrosis is a deadly disease that involves the dysregulation of fibroblasts and myofibroblasts, which are mechanosensitive. Previous computational models have succeeded in modeling stiffness-mediated fibroblasts behaviors; however, these models have neglected to consider stretch-mediated behaviors, especially stretch-sensitive channels and the stretch-mediated release of latent TGF-β. Here, we develop and explore an agent-based model and spring network model hybrid that is capable of recapitulating both stiffness and stretch. Using the model, we evaluate the role of mechanical signaling in homeostasis and disease progression during self-healing and fibrosis, respectively. We develop the model such that there is a fibrotic threshold near which the network tends towards instability and fibrosis or below which the network tends to heal. The healing response is due to the stretch signal, whereas the fibrotic response occurs when the stiffness signal overpowers the stretch signal, creating a positive feedback loop. We also find that by changing the proportional weights of the stretch and stiffness signals, we observe heterogeneity in pathological network structure similar to that seen in human IPF tissue. The system also shows emergent behavior and bifurcations: whether the network will heal or turn fibrotic depends on the initial network organization of the damage, clearly demonstrating structure’s pivotal role in healing or fibrosis of the overall network. In summary, these results strongly suggest that the mechanical signaling present in the lungs combined with network effects contribute to both homeostasis and disease progression.
Fibroblasts and myofibroblasts play an essential role in tissue healing and are disrupted in pulmonary fibrosis (PF), a deadly disease. While healing represents the process whereby tissue returns to its homeostatic condition, PF involves the aberrant remodeling of parenchymal tissue, which produces diverse characteristic structures such as honeycombing and dense fibrotic patches (Tanabe et al., 2020). The rate at which PF progresses is also diverse. For example, idiopathic pulmonary fibrosis (IPF) results in an average lifespan of 3–5 years after diagnosis and has no treatment (Nathan et al., 2011). In contrast, severe post-COVID pulmonary fibrosis (PCPF) sometimes resolves (Lorx et al., 2022), and PF caused by ventilation-induced injuries during acute respiratory distress syndrome can also heal either partially or completely (Herridge et al., 2011). Nevertheless, the mechanisms leading to these different forms of PF, and exactly how fibroblasts and myofibroblasts are involved, are still not fully understood.
It is well established that substrate stiffness can affect how fibroblasts deposit collagen and proliferate, which can result in positive feedback leading to fibrosis (Liu et al., 2010; Moore and Herzog, 2013; Lin et al., 2017; Tschumperlin et al., 2018). In a mechanically dynamic organ such as the lung, the mechanical stimulus provided by cyclical stretch also affects fibroblast behavior by, for example, activating stretch-regulated channels in the cell membrane (Murata et al., 2014). Stretch also contributes to the release of latent TGF-β (Klingberg, F. et al., 2014; Ezzo and Hinz, 2023; Hinz, 2009), a cytokine essential for wound healing that is involved in the transformation from fibroblasts to myofibroblasts (Hinz, 2009). Signaling pathways such as YAP and MRTF-A have also been linked to fibroblast proliferation in response to cyclical stretch (Cui et al., 2015). YAP is essential in regulating ECM deposition (Liu et al., 2015), while MRTF-A contributes to the transition of fibroblasts into a myofibroblast phenotype (Wagner et al., 2020). These various mechanotransduction mechanisms are not only important regulators of fibroblast differentiation and behavior, but also contribute to disease progression in PF.
The above considerations suggest that lung parenchymal homeostasis is maintained via a balance of mechanotransduction signals related to substrate stiffness and stretch, and that when the system is perturbed sufficiently, the self-healing nature of tissue is overpowered by progressive stiffening, leading to PF. We have previously developed several computational models of PF pathogenesis that support this hypothesis (Wellman et al., 2018; Suki et al., 2020; Suki et al., 2020; Hall et al., 2023). In these models, elastic spring networks mimic the structure and mechanics of the parenchymal tissue, while autonomous agents mimic the cellular processes that act on the tissue. These previous models, however, have not investigated how mechanical stretch affects fibroblast and myofibroblast behavior and the emergent pathology that results, and therefore they fail to capture critical features of a dynamic organ like the lung. Therefore, in the present study, we developed an agent-based model (ABM) operating on a non-uniform network of elastic springs to investigate how stretch and substrate stiffness interact to influence fibroblast and myofibroblast behavior, and how this potentially leads to the development of PF.
We developed a computational model in which agents, which represent fibroblasts, move around randomly on a spring network that represents the extracellular matrix (ECM) of the lung. Agents become activated according to the strains and stiffnesses of the springs they traverse during their travels. Positive activation causes an agent to increase the stiffness of any spring it crosses (representing deposition of collagen). A positively activated agent also has a higher likelihood of proliferating. Negative activation causes an agent to reduce the stiffness of any spring it crosses (representing digestion of collagen), and to have a higher likelihood of death. An activation of zero corresponds to an agent at equilibrium.
First, a set of discrete difference equations were developed to drive the behavior of the agents, and the behavior of these equations was evaluated independent of a network. Then, these equations were applied to agents on a network to observe what emergent properties the network would provide.
The springs in our network model of ECM are Hookean, each with its own spring constant
where E is Young’s modulus and L0 is the resting length of the spring.
Whenever an agent traverses a spring during a time step, it evaluates
where
Eq. 3 is a Hill function (Hill, 1910), which makes
Similarly, the strain,
where
The total activation of an agent when it traverses a spring of stiffness
where c is a constant that causes a = 0 when ε = εs and A = A0, and the weighting factors
At homeostasis,
The tissue at homeostasis is well below the fibrotic threshold, meaning
At each time step,
where P is a scaling constant, and
Since
For the set of difference equations, it is necessary to model the strain of a hypothetical spring. Therefore, a spring under a constant external force was utilized, and the strain at any given step for a change in
The corresponding agent activation at the
where
Although we do not define agents as corresponding explicitly to either fibroblasts or myofibroblasts, agents with
where
Eqs 7–10 comprise a set of coupled finite difference equations that represent the interactions between a collection of agents and the springs they traverse.
At each time step as the model is run, these equations are applied to each agent and to each spring that is traversed by an agent. Of course, not all springs in the network are necessarily visited by an agent in a given time step, but all springs will be modified if the model is run for long enough. The overall behavior of the model, therefore, is determined not only by the dynamics inherent in Eqs 7–10 but also by the local dynamics of agent movement over the network.
We created a non-uniform spring network to represent the parenchymal tissue using a method we have described previously (Hall et al., 2023). Briefly, Poisson Disk Sampling was used to create a semi-organized 2D Voronoi diagram. The edges of the diagram represented springs with uniform values of
In the network, the strain on each spring is a result of the solved equilibrium state of the network, and is solved at each iteration. This static strain is used as an approximation of the cyclical strain to limit computational requirements. This equilibrium strain is different from the single element approximation from Eq. 8 due to heterogeneity in strain caused by network effects. In order to recapitulate the reduction in lung volume that occurs in PF as the lungs get stiffer (Plantier et al., 2018), we applied non-fixed boundary conditions to the network by applying external forces to the boundary of the network that were equal to the reaction forces of the pre-stressed network. These reaction forces were kept constant throughout the simulations. Tissue injury was simulated by modifying the value of
Network functionality was quantified in terms of a strain-energy function previously described in Kim et al., 2023. Briefly, the network underwent 5 accumulating stretches of 2% strain each, and the energies in each spring in the network following each stretch were summed. The resulting strain-energy plot was fit with a second-order polynomial function, and the second order constant was as a measure of overall network stiffness. Each network was normalized by its initial stiffness such that the changes in stiffness across all networks were comparable.
We created synthetic histologic images of lung tissue by drawing the networks with edge thicknesses proportional to
At least nine network were run for each
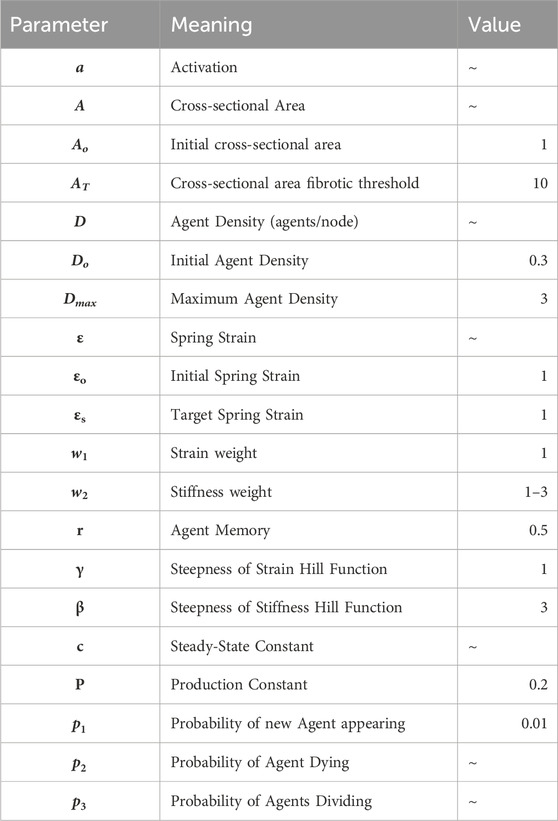
Table 1. List of model parameters and variables. Values are given to symbols representing parameters.
In order to understand the dynamics inherent to the difference equations (Eqs 7–10), the initial conditions provided in Table 1 were used, and the system was run for 2000 iterations. Injury was inflicted by altering the value of

Figure 1. Difference equations responses to perturbations. Each color represents a response to a pertrubation modifying the cross-sectional area (A), ranging from softening (blue) to stiffening (red). Each row corresponds to increasingly fibrotic reactions due to increasing stiffness weight (
Next, we evaluated the behavior of the complete spring network model with the difference equations applied to mobile agents. As with the difference equations, we found that the complete model is also able to self-heal or become fibrotic depending on the severity of the tissue injury, with dynamics that depend on both the amount and severity of injury (Figures 2A–C). The Network heals following all softening injuries and those minor stiffening injuries that are well below the fibrotic threshold, while the network becomes progressively fibrotic for major stiffening injuries clearly above the fibrotic threshold.
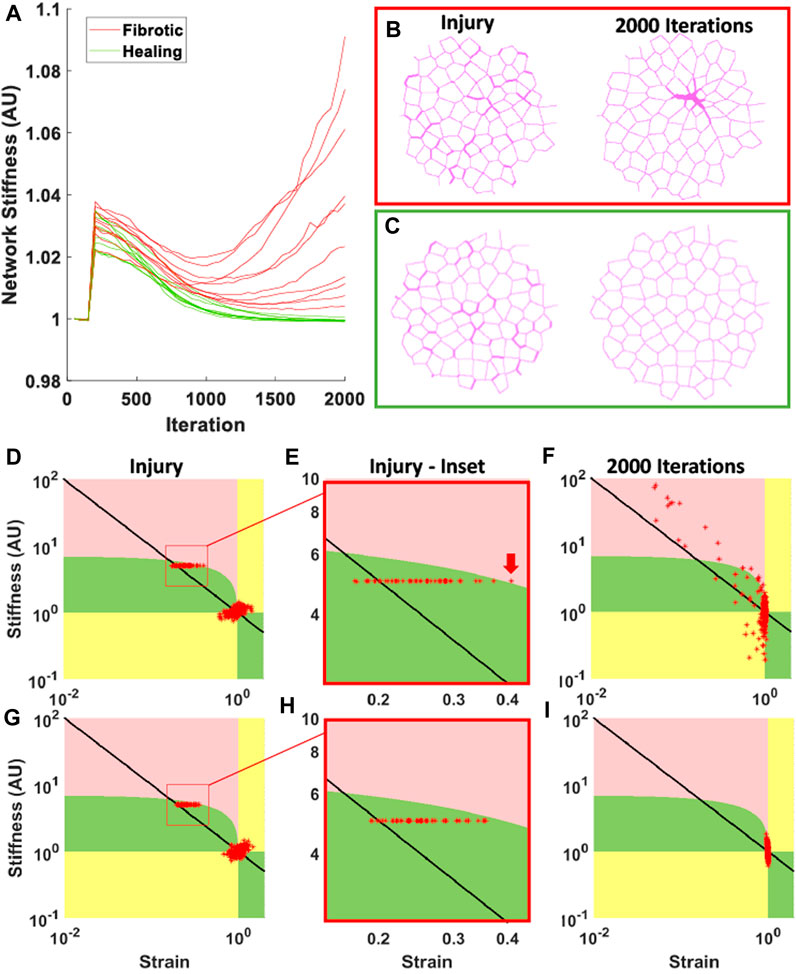
Figure 2. Diverging behavior resulting from network effects. (A) Result of 20 networks where 20% of springs were stiffened to a cross-sectional area (A) 5x the initial cross-sectional area. Green plots indicate self-healing, returning near to the original stiffness, red plots indicate fibrotic responses. (B) and (C) Examples of networks with fibrotic and healing responses respectively. Left shows networks at injury, and right shows networks at 2000 iterations. (D–I) show network phase diagrams corresponding to the networks shown in (B) and (C), where green is self-healing phase, pink is fibrotic phase, yellow is mixed-behavior phase, and steady-state is at the point (1,1). Each red star represents the state of a given spring, and the black line represents the behavior of the difference equations. (D) and (G) show spring states at injury, where injured springs are shown in red boxes. (E) and (H) show these red boxes indicated in panels (D) and (G), and the red arrow indicates a spring that has crossed into the fibrotic phase, causing that network to become fibrotic at 2000 iterations. (F) and (I) show spring state progressions in panels (D) and (G) at 2000 iterations. (D) has turned fibrotic, as many springs can be seen in the fibrotic phase and away from steady-state, while (I) has healed, as all the springs have returned to near the steady-state. For additional details related to panel D, see Supplementary Figure S4.
While the difference equations exhibit a sharp bifurcation behavior between healing and fibrosis, the network model has a range of moderate injury that can lead to either healing of fibrosis. A fibrotic response in this range can be caused, for example, by some springs that are initially very close to the fibrotic threshold being pushed over the threshold by the evolving behavior of nearby springs, as illustrated in Figures 2B–F.
We found that
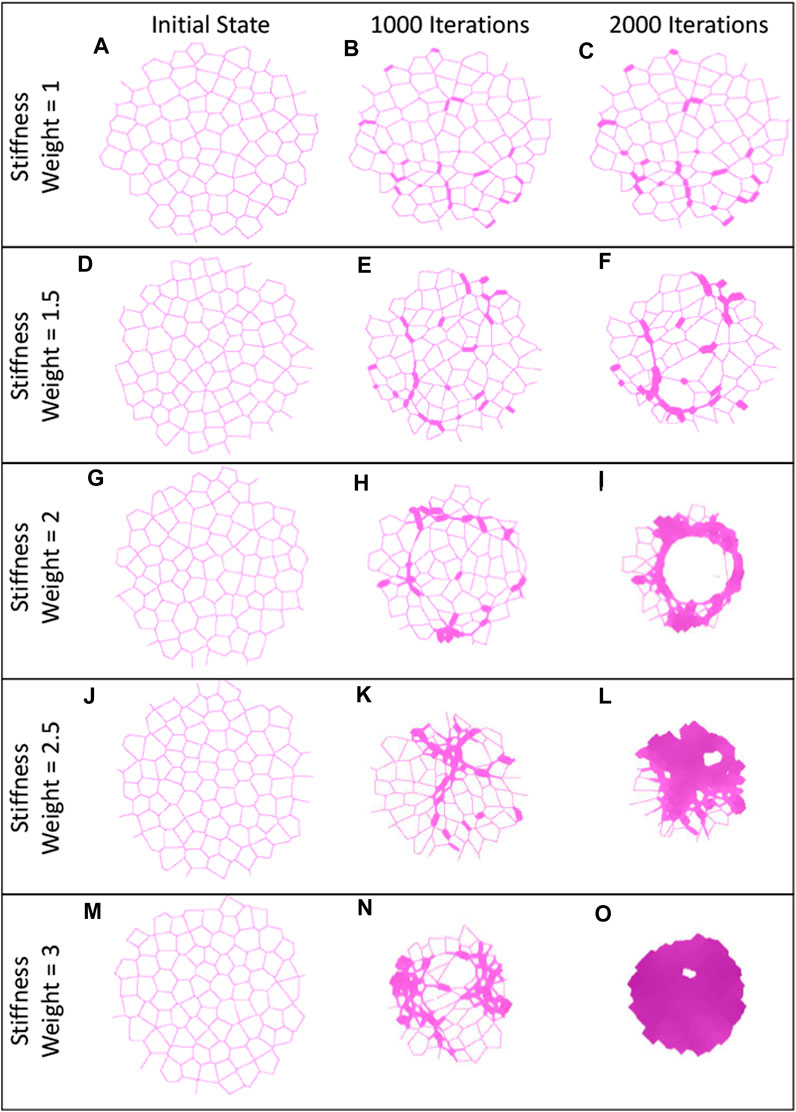
Figure 3. Examples of heterogeneous fibrotic structures. Initially, each of these networks had 10% of the springs stiffened to 10x the initial cross-sectional area. Each row corresponds to increasingly fibrotic reactions due to increasing stiffness weight (
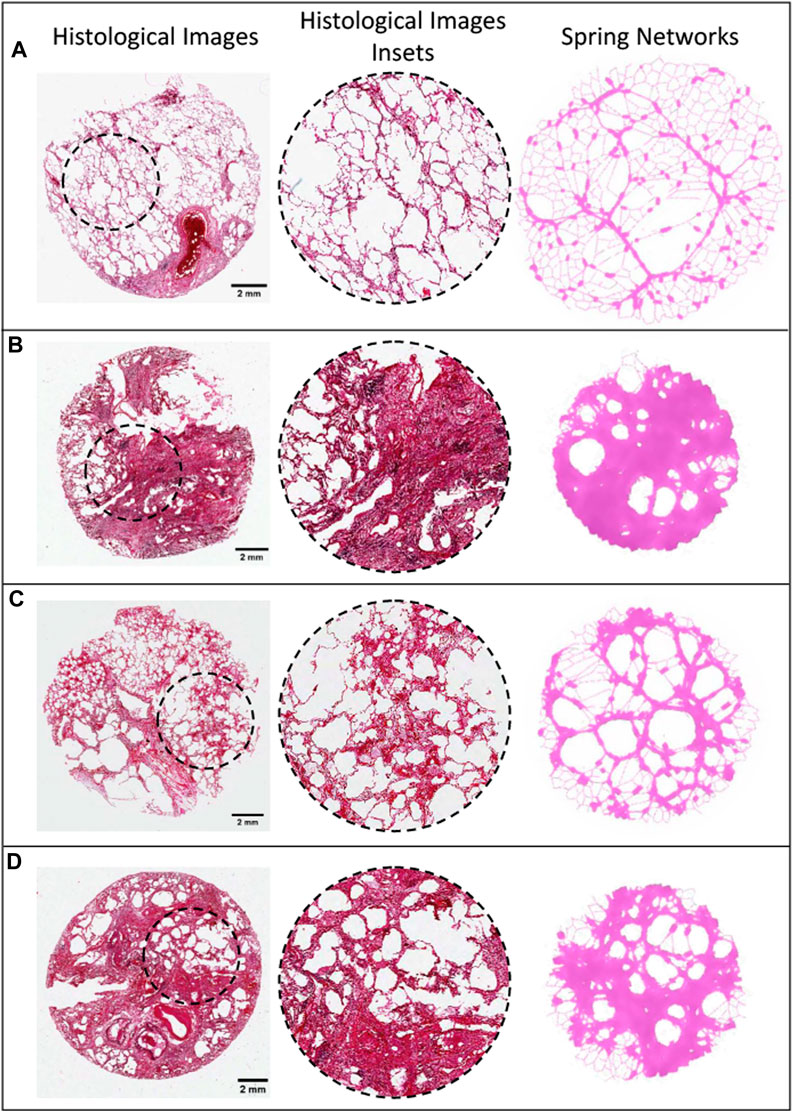
Figure 4. Comparison of IPF histological images and spring networks. The first column shows histological slices of IPF tissue with differing structures, and the second column shows enlarged sections from these slices (Modified with Permission from Tanabe et al., 2020). The third column shows spring networks of varying sensitivity at varying stages of progression that are similar in structure to the images on the same row (A–C).
Figure 5 shows that the progression of fibrosis in the model is characterized by progressive increases in network stiffness (Figure 5A). The networks that were weighted toward a greater fibrotic response (greater values of
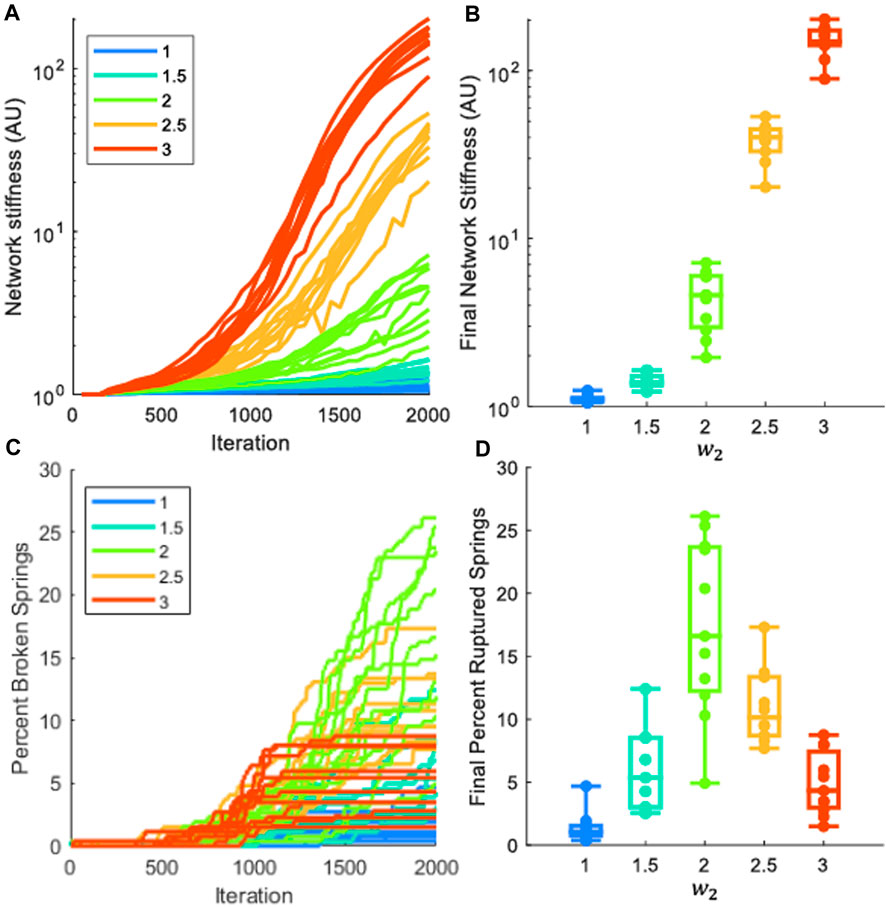
Figure 5. Analysis of mechanics in fibrotic network progression. Each network had 10% of the springs stiffened by 10x the initial cross-sectional area. Each color represents a different stiffness weight (
Figure 6 shows how agent activation level and density vary across the network as a function of time. The parameters of all agents across every simulation of matching
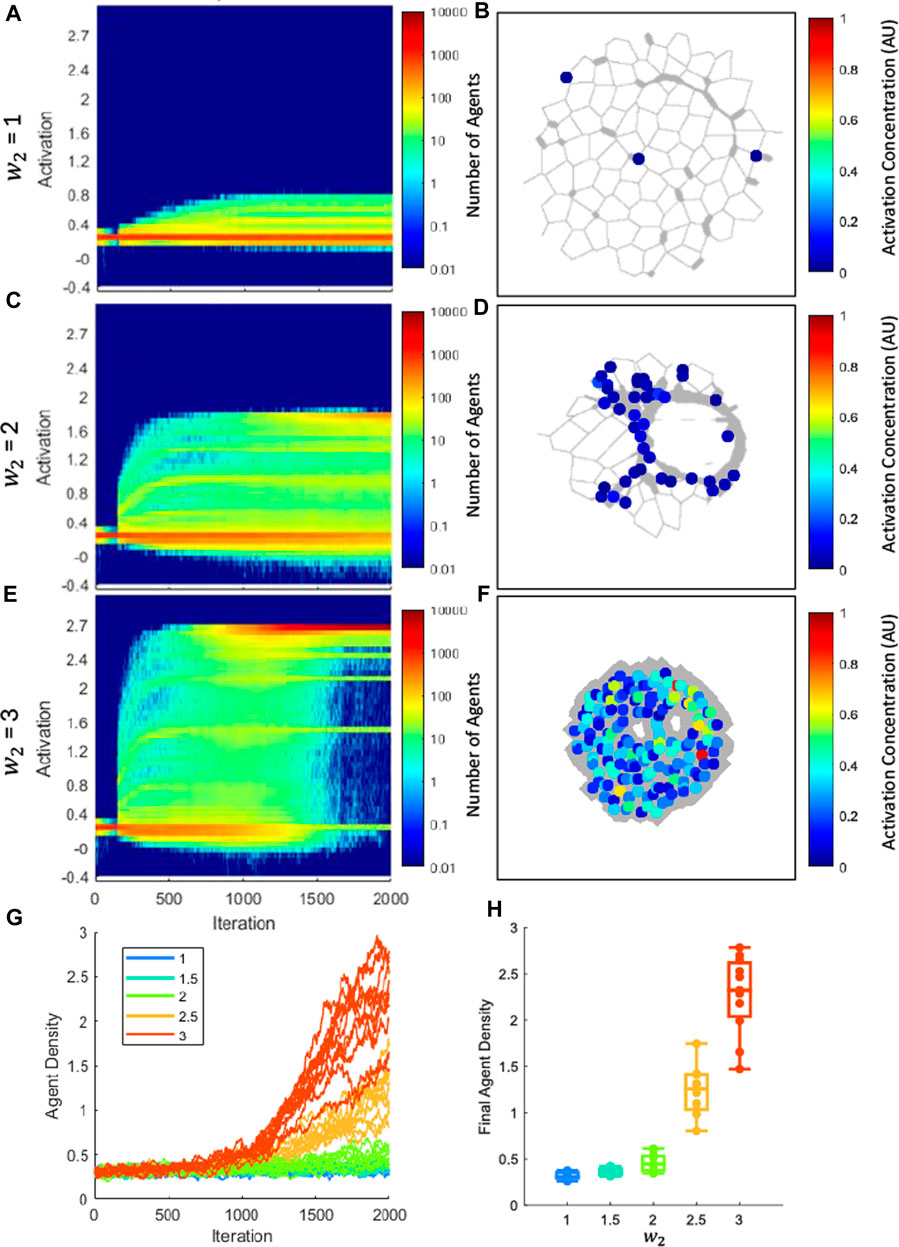
Figure 6. Differentiation of agents from early fibroblast to myofibroblast phenotype. (A, C, E) show activation distribution and number of agents as disease progresses, where color indicates number of agents at a given activation. Each panel is the sum of all agents used in all networks for the listed sensitivity. In (A), the majority of the population stays at the initial activation, indicating that most agents stay in a fibroblast phenotype. In (C) a second population of higher-activated agents is present at 2000 iterations that indicates partial differentiation into myofibroblasts. In (E) the low-activation fibroblast population nearly disappears by 2000 iterations, while the high-activation myofibroblast population has become dominant, indicating differentiation. (B, D, F) Local activation plots superimposed on networks. As fibrosis progresses, it is clear that agents cluster in fibrotic regions and are highly activated. (G) The density vs. iteration for all network simulations. Each color represents a different stiffness weight (
Pulmonary fibrosis is a deadly disease characterized by micromechanical tissue changes. The prevailing hypothesis identifies fibroblasts and myofibroblasts as the key mechanosensory cells involved in disease progression. These cells respond to tissue stiffening by activation, leading to extracellular matrix (ECM) deposition. Less well known is the cellular responses to stretch. Accordingly, we developed an ABM-spring network hybrid model that includes both stiffness and stretch motivated behaviors, and evaluated the resulting structural and mechanical properties of the resulting networks. The main results can be summarized as follows: 1) strain-driven mechanotransduction is important in the inherent self-healing ability of the tissue; 2) sufficient regional stiffening prohibits self-healing and the tissue becomes fibrotic via a positive feedback loop; 3) there is a bifurcation in the system because, depending on the initial configuration of regional stiffening, the system can self-heal or turn fibrotic; and 4) fibrotic phenotype depends on the balance between stiffness-dependent and stretch-related mechanosensitive pathways.
Within the processes of self-healing and fibrosis are myriad interactions between cell types and systems that result in the behaviors and structures observable in tissue (Ezzo and Hinz, 2003; Moore and Herzog, 2013; Pally and Naba, 2024). Many of these interactions are not fully understood, therefore in this paper we did not endeavor to include each of these, but instead created a lumped-parameter model (Brown et al., 2011) that focuses on broad behaviors such as the deposition and digestion of tissue in response to stiffness and stretch. We also focused primarily on 2 cell types, specifically the transition of fibroblasts into myofibroblasts. This lumped-parameter model serves as a means of broadly understanding the contribution of stretch-mediated behavior in addition to the previously established stiffness-mediated behaviors in fibroblast-like agents (Wellman et al., 2018).
In a previous PF model, Wellman et al., 2018 developed a stiffness-motivated migration ABM on a 2D hexagonal spring network with agents’ behavior defined by spring stiffness. The Wellman model included wall rupture, and found that the distribution of Low Attenuation Areas (LAAs) matched that in CT scans, however, it was not able to heal itself or maintain steady-state; that is to say, the Wellman model could only progress towards fibrosis. Suki et al., 2020 developed a self-healing model on a 2D hexagonal network, however induced fibrosis required a constant perturbation of the agents, rather than fibrosis induced from a single insult. Bates et al., 2007 and Hall et al., 2023 explored fibrosis on 2D hexagonal networks and 3D non-uniform networks, respectively, and both observed clustering and mechanics seen in PF, but neither included rupture, gradient in agent behavior, or self-healing.
While many of these previous studies have utilized uniform networks, such as square and hexagonal lattices, it has been shown that non-uniform networks have more geometric and mechanical similarity to lung tissue (Hall et al., 2023), therefore a non-uniform network was used for this model. Comparison of broad characteristics of this fibrotic model appeared similar between non-uniform and hexagonal networks (Supplementary Figure S3). Furthermore, previous models have modeled agents as preferentially migrating towards stiffer substrates based on fibroblast behavior (Liu et al., 2010; Wellman et al., 2018), however, there is the potential for cells to migrate towards high-strain or injured tissue (López-Martínez et al., 2018). To maintain the simplicity of the model, random migration was used in all cases.
Each of these previous models contributed key insights into the mechanics of lung tissue and PF pathogenesis, however, each had key limitations. Furthermore, no previous computational models have investigated how mechanical stretch affects fibroblast and myofibroblast behavior, and the resulting emergent structural behaviors. This indicates that a model that only includes behavior defined by stiffness does not capture all the mechanical properties inherent to a dynamic organ like the lung. The model developed in this work was able to recapitulate many of the essential behaviors, such as both healing and fibrosis, and structures such as honeycombing and fibrotic clustering, while introducing new behaviors, such as shrinkage and clear differentiation. These behaviors are explored more thoroughly in the following sections.
A fibroblast’s primary function is the maintenance of the extracellular matrix (D’Urso and Kurniawan, 2020) through the strategic deposition and digestion of tissue. A key mechanism by which fibroblasts communicate with, migrate through, deform, and are deformed by their environment is through focal adhesions (Mierke et al., 2017; Stutchbury et al., 2017; Tschumperlin et al., 2018). It is known that fibroblasts are able to react in response to a material’s stiffness by depositing more material, and it is hypothesized that the cell is able to measure local tissue stiffness by active contraction (Engler et al., 2006). Together, this led to our first rule: the agent activation has a positive relationship with local stiffness. We also assume that fibroblast cannot perceive anything beyond the grasp of its focal adhesions. In the context of a spring, this means that the agent cannot perceive the length of the whole spring, only the length of the cell. Therefore, for a measured spring constant, the perceived L0 would be approximately the length of the fibroblast itself, and can be considered as a constant for all agents. Furthermore, for simplicity, we make an assumption that the composition of the tissue is mostly collagen, and that therefore the Young’s modulus E of the tissue is uniform. This is what leads to the simplification from Eqs 3, 4.
Next, we must also consider the fibroblast’s ability to perceive stretch. Fibroblasts are affected by stretch via the release of ECM-bound latent TGF-beta, which supports the transition from fibroblasts to myofibroblasts (Hinz, 2009; Ezzo and Hinz, 2023), activates stretch-sensitive channels (Murata et al., 2014), and affects signaling pathways such as YAP and MRTF-A (Cui et al., 2015). Therefore, higher stretch may increase cell activation and lead to increase in collagen deposition (Tschumperlin et al., 2018). In the lungs, the periodic stretching provides a constant signal to the fibroblasts, and we hypothesize that there is an optimal range of stretch that the fibroblasts expect, such that when the stretch is too high, collagen is deposited to stiffen the material and decrease stretch, and when stretch is too low, the tissue is digested to increase stretch, creating a negative-feedback healing response. This led to our second rule: agents increase activation in response to local stretch. This contrasts with the notion that fibroblasts maintain the stiffness of a material. Previous models that only included stiffness-mediated behaviors only turn fibrotic without being able to heal (Wellman et al., 2018). Similarly, our single-element models did not show any healing response to injury when strain sensitivity was removed (Supplementary Figure S1). Fibrosis also did not occur when the stiffness sensitivity was removed (Supplementary Figure S2). Previous self-healing models have been based on stiffness (Suki et al., 2020), however, the mechanism of healing based on stiffness is not supported by the positive feedback between stiffness and ECM deposition observed in fibroblasts (Liu et al., 2010; Moore and Herzog, 2013; Lin et al., 2017). These observations motivated the rationale that the self-healing component of the current model is caused by stretch, and the fibrotic component of the current model is caused by stiffness.
The lungs and other organs in general, are able to sustain minor injuries and heal from them, but once fibrosis begins in diseases such as IPF, the tissue is unable to return to a healing state. In terms of feedback systems, these represent stable and unstable responses, respectively. There are two criteria we consider for what determines the outcome of an injury. The first is predisposition towards IPF, which can be caused by factors such as age, genetics, and smoking habits (American Thoracic Society, 2000), which is accounted for in Eq. 7 as the stiffness weight,
To evaluate these diverse behaviors, we developed a fibrotic threshold, which accounts for both predisposition and environmental factors to determine if a system will become fibrotic. Thresholds such as this have been observed for differentiation into fibroblasts (Hinz, 2009). In this model, this threshold is defined as where the stable system becomes an unstable system and occurs when the stiffness response in Eq. 7 overpowers the strain response; that is to say, for an increase in A, the change in activation will increase, causing a positive-feedback response. In the analysis of the difference equations, this threshold is a single value, which depends on the stiffness sensitivity. In the first column of Figure 1, we observe that the threshold for fibrosis lowers as sensitivity increases, shown by the orange arrows, indicating that for the same injury, a more sensitive subject would develop fibrosis.
In the network model, however, springs interact such that the fibrotic threshold is a range of values, due to non-uniform strain. This means that a network with many springs with a stiffness below the threshold may appear to be fibrotic and much stiffer than a healthy lung, but will be able to heal, as seen in ARDS and PCPF (Herridge et al., 2011; Lorx et al., 2022). This also means that a network with few springs injured beyond the fibrotic threshold may be enough of a spark for the positive-feedback response. In Figure 2, 20% of springs were stiffened by 5x, and both healing and fibrotic responses can occur in the same tissue as a result of network effects. This diverging response cannot be predicted from just the injury or the predisposition; it necessitates a structural analysis of the network. Figure 2 demonstrates this fibrotic threshold as the boundary between the green self-healing response and the pink fibrotic region. Even though the injuries were all below the predicted threshold from the difference equations, shown where the black diagonal line crosses the pink-green boundary, the network effects are enough in some cases to push the network to becoming fibrotic. These results show that the network effects have an integral contribution to the outcome of an injury. Such behavior represents a microscopic bifurcation, and whether the fibrosis percolates to the macroscale depends on the local correlation structure of the injury. Hence, our model is able to recreate both healing and non-healing responses to fibrotic perturbations in ways similar to those observed in real diseases, providing insight into how the severity and spatial distribution of the initial injury as well as predisposition towards PF interact to either heal or not heal.
In PF, there is an observed increase in the population of fibroblasts and myofibroblast populations (Moore and Herzog, 2013). There is debate over where myofibroblasts come from during PF (Moore and Herzog, 2013), so for this lumped-parameter model, we consider only myofibroblasts that occur from differentiation from fibroblasts. Previous models have typically maintained the number of agents for simplicity (Wellman et al., 2018; Suki et al., 2020; Hall et al., 2023); however, this model allows for the proliferation of agents. Additionally, the activation parameter allows us to make a distinction between fibroblasts and myofibroblasts based on their activation. As shown in Figure 6, we were able to capture a diverse set of differentiation responses based on the network’s sensitivity, ranging from partial differentiation (Figure 6A) to full differentiation (Figure 6E). We also analyzed the local activation accumulation in the networks (Figures 6B,D,F), which can be considered as an approximation of α-smooth muscle actin resulting from myofibroblast differentiation. Not only do we observe an increase in activation as fibrosis intensifies, we observe in Figure 6D that these highly activated agents are localized to fibrotic regions.
One of the hallmarks of PF is the diversity of structures observed in the tissue, namely, honeycombing, fibrotic patches and consolidated tissue (Tanabe et al., 2020). In Figures 3, 4, we observe these structures in both networks and images of human tissue. When the network images are compared to the histological images in Figure 4, the similarities are obvious. Models with a high
During the progression of fibrosis in the network models with varying
In models with a fibrotic response, injuries were initially individual patches randomly distributed through the tissue, as shown in Figures 2, 3. As the disease progresses, fibrotic bridges emerge between these patches forming larger fibrotic clusters. This behavior can be seen in the Figure 3,
This fibrotic bridging is similar in behavior to invasion percolation. While 10% of the springs in the network are stiffened by 10x, the initial stiffness of all networks is still near the initial value (Figure 5A), and the final progression of low
This model has a number of limitations that are important to address. First, this model approximates tissue as a set of linear springs with a constant Young’s modulus. In reality, tissue shows characteristic nonlinearity due to recruitment, and the Young’s modulus changes as disease progresses (Marchioni et al., 2021). Both of these characteristics add computational complexity to the simulations. In this context, simplification of constant Young’s modulus and use of linear springs are common assumptions in previous and current spring-network models. Furthermore, spring networks are typically two-dimensional and do not include airways for the same reasons listed above. To further limit computational complexity, the static strain of the network was used as an approximation of the cyclic stretch. For agent-based models, it is difficult to translate biological mechanisms into discrete values that can be applied via agents, which is why lumped-parameter models have been utilized to recreate broad behavior. The current model is no exception, where rather than the precise processes of digestion and deposition, we consider broad characteristic behaviors. The rate at which the agents migrate was determined by discrete steps across springs, rather than a specific speed or distance to cross in a given time. The median time from diagnosis to death for IPF is ∼3 years (Nathan et al., 2011) whereas our model has an approximate time of ∼5 months, however we consider this model, given the computational limitations, to be comparable to the time course of physiological disease progression. Furthermore, we did not consider the interactions of agents with the other fibrosis relevant cell types such as inflammatory cells, epithelial cells and endothelial cells. This simplification is also consistent with previous models that only considered one agent type. Despite these limitations, the current model appears robust and is able to recapitulate complex behaviors comparable to those seen physiologically.
In this work, we developed a mechanosensitive agent-based model and spring network model hybrid that was capable of both fibrosis and healing based on different injury conditions. The inclusion of fibroblast-like-agents that were sensitive to both stiffness and stretch recapitulated these behaviors, and the application onto a network model led to the development of heterogeneous structures typical of PF. These results suggest that the interactive mechanical signals present in the lungs, i.e., stiffness and stretch, play a key role in both homeostatic maintenance and disease progression.
The original contributions presented in the study are included in the article/Supplementary Material, and further inquiries can be directed to the corresponding author.
JH: Conceptualization, Data curation, Formal Analysis, Investigation, Methodology, Validation, Visualization, Writing–original draft. JB: Conceptualization, Investigation, Supervision, Writing–original draft. RK: Conceptualization, Writing–original draft. JK: Conceptualization, Investigation, Writing–original draft. YD: Conceptualization, Investigation, Writing–original draft. Kenneth R KL: Conceptualization, Supervision, Writing–original draft. BS: Conceptualization, Investigation, Methodology, Supervision, Writing–original draft.
The author(s) declare that financial support was received for the research, authorship, and/or publication of this article. BS and JB were partially supported by NIH grant U01 HL-139466 and JKH was funded by the Dean's Discretionary fund.
The authors declare that the research was conducted in the absence of any commercial or financial relationships that could be construed as a potential conflict of interest.
The author(s) declared that they were an editorial board member of Frontiers, at the time of submission. This had no impact on the peer review process and the final decision.
All claims expressed in this article are solely those of the authors and do not necessarily represent those of their affiliated organizations, or those of the publisher, the editors and the reviewers. Any product that may be evaluated in this article, or claim that may be made by its manufacturer, is not guaranteed or endorsed by the publisher.
The Supplementary Material for this article can be found online at: https://www.frontiersin.org/articles/10.3389/fnetp.2024.1396383/full#supplementary-material
American Thoracic Society (2000). American Thoracic Society. Idiopathic pulmonary fibrosis: diagnosis and treatment. International consensus statement. American Thoracic Society (ATS), and the European Respiratory Society (ERS). Am. J. Respir. Crit. Care Med. 161 (2 pt 1), 646–664. doi:10.1164/ajrccm.161.2.ats3-00
Bates, J. H. T., Davis, G. S., Majumdar, A., Butnor, K. J., and Suki, B. (2007). Linking parenchymal disease progression to changes in lung mechanical function by percolation. Am. J. Respir. Crit. care Med. 176 (6), 617–623. doi:10.1164/rccm.200611-1739OC
Brown, B. N., Price, I. M., Toapanta, F. R., DeAlmeida, D. R., Wiley, C. A., Ross, T. M., et al. (2011). An agent-based model of inflammation and fibrosis following particulate exposure in the lung. Math. Biosci. 231 (2), 186–196. doi:10.1016/j.mbs.2011.03.005
Cavalcante, F. S., Ito, S., Brewer, K., Sakai, H., Alencar, A. M., Almeida, M. P., et al. (2005). Mechanical interactions between collagen and proteoglycans: implications for the stability of lung tissue. J. Appl. physiology 98 (2), 672–679. doi:10.1152/japplphysiol.00619.2004
Cui, Y., Hameed, F. M., Yang, B., Lee, K., Pan, C. Q., Park, S., et al. (2015). Cyclic stretching of soft substrates induces spreading and growth. Nat. Commun. 6 (1), 6333. doi:10.1038/ncomms7333
D'Urso, M., and Kurniawan, N. A. (2020). Mechanical and physical regulation of fibroblast-myofibroblast transition: from cellular mechanoresponse to tissue pathology. Front. Bioeng. Biotechnol. 8, 609653. doi:10.3389/fbioe.2020.609653
Engler, A. J., Sen, S., Sweeney, H. L., and Discher, D. E. (2006). Matrix elasticity directs stem cell lineage specification. Cell. 126 (4), 677–689. doi:10.1016/j.cell.2006.06.044
Ezzo, M., and Hinz, B. (2023). Novel approaches to target fibroblast mechanotransduction in fibroproliferative diseases. Pharmacol. Ther. Oxf. 250, 108528. doi:10.1016/j.pharmthera.2023.108528
Hall, J. K., Bates, J. H. T., Casey, D. T., Bartolák-Suki, E., Lutchen, K. R., and Suki, B. (2023). Predicting alveolar ventilation heterogeneity in pulmonary fibrosis using a non-uniform polyhedral spring network model. Front. Netw. physiology 3, 31124223–1124223. doi:10.3389/fnetp.2023.1124223
Herridge, M. S., Tansey, C. M., Matté, A., Tomlinson, G., Diaz-Granados, N., Cooper, A., et al. (2011). Functional disability 5 Years after acute respiratory distress syndrome. N. Engl. J. Med. 364 (14), 1293–1304. doi:10.1056/NEJMoa1011802
Herrmann, J. (2021). springs/springs_matlab_solver. Github. Available at: https://github.com/jakeherrmann/springs/.
Hill, A. V. (1910). The heat produced in contracture and muscular tone. J. Physiol. 40, 389–403. doi:10.1113/jphysiol.1910.sp001377
Hinz, B. (2009). Tissue stiffness, latent TGF-beta1 activation, and mechanical signal transduction: implications for the pathogenesis and treatment of fibrosis. Curr. Rheumatol. Rep. 11 (2), 120–126. doi:10.1007/s11926-009-0017-1
Kim, J. H., Schaible, N., Hall, J. K., Bartolák-Suki, E., Deng, Y., Herrmann, J., et al. (2023). Multiscale stiffness of human emphysematous precision cut lung slices. Sci. Adv. 9 (20), eadf2535. eadf2535–eadf2535. doi:10.1126/sciadv.adf2535
Klingberg, F., Chow, M. L., Koehler, A., Boo, S., Buscemi, L., Quinn, T. M., et al. (2014). Prestress in the extracellular matrix sensitizes latent TGF-β1 for activation. J. Cell. Biol. 207 (2), 283–297. doi:10.1083/jcb.201402006
Lin, Y. C., Sung, Y. K., Jiang, X., Peters-Golden, M., and Nicolls, M. R. (2017). Simultaneously targeting myofibroblast contractility and extracellular matrix cross-linking as a therapeutic concept in airway fibrosis. Am. J. Transplant. 17 (5), 1229–1241. doi:10.1111/ajt.14103
Liu, F., Lagares, D., Choi, K. M., Stopfer, L., Marinković, A., Vrbanac, V., et al. (2015). Mechanosignaling through YAP and TAZ drives fibroblast activation and fibrosis. Am. J. Physiology-Lung Cell. Mol. Physiology 308 (4), L344–L357. doi:10.1152/ajplung.00300.2014
Liu, F., Mih, J. D., Shea, B. S., Kho, A. T., Sharif, A. S., Tager, A. M., et al. (2010). Feedback amplification of fibrosis through matrix stiffening and COX-2 suppression. J. Cell. Biol. 190 (4), 693–706. doi:10.1083/jcb.201004082
López-Martínez, C., Huidobro, C., Albaiceta, G. M., and López-Alonso, I. (2018). Mechanical stretch modulates cell migration in the lungs. Ann. Transl. Med. 6 (2), 28. doi:10.21037/atm.2017.12.08
Lorx, A., Baglyas, S., Podmaniczky, E., Valkó, L., Gál, J., and Suki, B. (2022). Lung mechanics during recovery of a non-invasively ventilated patient with severe COVID-19 pneumonia. Respir. physiology Neurobiol. 306, 103960. doi:10.1016/j.resp.2022.103960
Marchioni, A., Tonelli, R., Cerri, S., Castaniere, I., Andrisani, D., Gozzi, F., et al. (2021). Pulmonary stretch and lung mechanotransduction: implications for progression in the fibrotic lung. Int. J. Mol. Sci. 22 (12), 6443. doi:10.3390/ijms22126443
Mierke, C. T., Fischer, T., Puder, S., Kunschmann, T., Soetje, B., and Ziegler, W. H. (2017). Corrigendum: focal adhesion kinase activity is required for actomyosin contractility-based invasion of cells into dense 3D matrices. Sci. Rep. 7, 46435. [Online] 742780-. doi:10.1038/srep46435
Moore, M. W., and Herzog, E. L. (2013). Regulation and relevance of myofibroblast responses in idiopathic pulmonary fibrosis. Curr. Pathobiol. Rep. 1, 199–208. doi:10.1007/s40139-013-0017-8
Murata, N., Ito, S., Furuya, K., Takahara, N., Naruse, K., Aso, H., et al. (2014). Ca2+ influx and ATP release mediated by mechanical stretch in human lung fibroblasts. Biochem. biophysical Res. Commun. 453 (1), 101–105. doi:10.1016/j.bbrc.2014.09.063
Nathan, S. D., Shlobin, O. A., Weir, N., Ahmad, S., Kaldjob, J. M., Battle, E., et al. (2011). Long-term course and prognosis of idiopathic pulmonary fibrosis in the new millennium. Chest 140 (1), 221–229. doi:10.1378/chest.10-2572
Pally, D., and Naba, A. (2024). Extracellular matrix dynamics: a key regulator of cell migration across length-scales and systems. Curr. Opin. Cell. Biol. 86, 102309. [Online] 86102309–102309. doi:10.1016/j.ceb.2023.102309
Plantier, L., Cazes, A., Dinh-Xuan, A. T., Bancal, C., Marchand-Adam, S., and Crestani, B. (2018). Physiology of the lung in idiopathic pulmonary fibrosis. Eur. Respir. Rev. 27 (147), 170062. [Online]. doi:10.1183/16000617.0062-2017
Stutchbury, B., Atherton, P., Tsang, R., Wang, D. Y., and Ballestrem, C. (2017). Distinct focal adhesion protein modules control different aspects of mechanotransduction. J. Cell. Sci. 130 (9), 1612–1624. [Online]. doi:10.1242/jcs.195362
Suki, B., Herrmann, J., and Bates, J. H. T. (2020). An analytic model of tissue self-healing and its network implementation: application to fibrosis and aging. Front. physiology 11, 583024. [Online] 11583024–583024. doi:10.3389/fphys.2020.583024
Tanabe, N., McDonough, J. E., Vasilescu, D. M., Ikezoe, K., Verleden, S. E., Xu, F., et al. (2020). Pathology of idiopathic pulmonary fibrosis assessed by a combination of microcomputed tomography, histology, and immunohistochemistry. Am. J. pathology 190 (12), 2427–2435. doi:10.1016/j.ajpath.2020.09.001
Tschumperlin, D. J. (2013). Fibroblasts and the ground they walk on. Physiology 28 (6), 380–390. doi:10.1152/physiol.00024.2013
Tschumperlin, D. J., Ligresti, G., Hilscher, M. B., and Shah, V. H. (2018). Mechanosensing and fibrosis. J. Clin. investigation 128 (1), 74–84. doi:10.1172/JCI93561
W. R. Wagner, S. E. Sakiyama-Elbert, G. Zhang, and M. J. Yaszemski (2020). Biomaterials science: an introduction to materials in medicine (Germany: Academic Press).
Keywords: mechanotransduction, mechanosensitive, extracellar matrix, fibroblasts, network effects, bifurcation (mathematics)
Citation: Hall JK, Bates JHT, Krishnan R, Kim JH, Deng Y, Lutchen KR and Suki B (2024) Elucidating the interaction between stretch and stiffness using an agent-based spring network model of progressive pulmonary fibrosis. Front. Netw. Physiol. 4:1396383. doi: 10.3389/fnetp.2024.1396383
Received: 05 March 2024; Accepted: 01 May 2024;
Published: 22 May 2024.
Edited by:
Linhong Deng, Institute of Biomedical Engineering and Health Sciences, ChinaReviewed by:
Bindi Shah Brook, University of Nottingham, United KingdomCopyright © 2024 Hall, Bates, Krishnan, Kim, Deng, Lutchen and Suki. This is an open-access article distributed under the terms of the Creative Commons Attribution License (CC BY). The use, distribution or reproduction in other forums is permitted, provided the original author(s) and the copyright owner(s) are credited and that the original publication in this journal is cited, in accordance with accepted academic practice. No use, distribution or reproduction is permitted which does not comply with these terms.
*Correspondence: Béla Suki, YnN1a2lAYnUuZWR1
Disclaimer: All claims expressed in this article are solely those of the authors and do not necessarily represent those of their affiliated organizations, or those of the publisher, the editors and the reviewers. Any product that may be evaluated in this article or claim that may be made by its manufacturer is not guaranteed or endorsed by the publisher.
Research integrity at Frontiers
Learn more about the work of our research integrity team to safeguard the quality of each article we publish.