
95% of researchers rate our articles as excellent or good
Learn more about the work of our research integrity team to safeguard the quality of each article we publish.
Find out more
ORIGINAL RESEARCH article
Front. Netw. Physiol. , 04 January 2023
Sec. Networks in the Cardiovascular System
Volume 2 - 2022 | https://doi.org/10.3389/fnetp.2022.1007585
This article is part of the Research Topic Network Physiology, Insights into the Cardiovascular System View all 4 articles
Life-threatening cardiac arrhythmias require immediate defibrillation. For state-of-the-art shock treatments, a high field strength is required to achieve a sufficient success rate for terminating the complex spiral wave (rotor) dynamics underlying cardiac fibrillation. However, such high energy shocks have many adverse side effects due to the large electric currents applied. In this study, we show, using 2D simulations based on the Fenton-Karma model, that also pulses of relatively low energy may terminate the chaotic activity if applied at the right moment in time. In our simplified model for defibrillation, complex spiral waves are terminated by local perturbations corresponding to conductance heterogeneities acting as virtual electrodes in the presence of an external electric field. We demonstrate that time series of the success rate for low energy shocks exhibit pronounced peaks which correspond to short intervals in time during which perturbations aiming at terminating the chaotic fibrillation state are (much) more successful. Thus, the low energy shock regime, although yielding very low temporal average success rates, exhibits moments in time for which success rates are significantly higher than the average value shown in dose-response curves. This feature might be exploited in future defibrillation protocols for achieving high termination success rates with low or medium pulse energies.
Sudden cardiac death, in many cases due to ventricular fibrillation (VF) Koplan and Stevenson (2009), causes around 700,000 deaths per year in Europe alone, and hence, remains one of the major public health issues Chugh (2017). In practice, such cardiac arrhythmias are most successfully terminated by applying external electric shocks to the heart, referred to as defibrillation. Demonstrated both experimentally Davy et al. (1987); Kwaku and Dillon (1996) and numerically Boegli et al. (2000); Bragard et al. (2013); Lilienkamp and Parlitz (2020), the dependence of the defibrillation success rate on the strength of the shock applied, which is called dose-response curve (DRC), is given by a sigmoid function. However, high energy shocks, being promising in terms of successful defibrillation, cause severe pain and tissue damage to the patient Holden et al. (2019). Another adverse side effect is that postshock arrythmias are much more probable for high defibrillation field strengths Cates et al. (1994); Fast and Cheek (2002). A major challenge in medical practice is thus, to minimize these tremendous side effects by significantly reducing the shock energy while keeping the probability for successful defibrillation high. Therefore, different types of approaches for energy reduction have been proposed, including a sequential application of low energy pulses Luther et al. (2011) or multi-stage electrotherapy Janardhan et al. (2014). In contrast, the current study points the way to a possible improvement in low-energy single-shock therapy. Using computational methods, we show that the success rate of external shocks may strongly fluctuate, a feature that might be exploited for the defibrillation of arrhythmic dynamics of the heart using low energy shocks. In our study, we used the Fenton-Karma model Fenton and Karma (1998), describing the electrical excitation dynamics of cardiac cells in a 2D computational domain and simulated chaotic spiral waves of cardiac excitation corresponding to fibrillation in a real heart. By means of the concept of virtual electrodes Trayanova et al. (1998); Pumir and Krinsky (1999); Bittihn et al. (2008), we then perturbed the spiral wave dynamics, aiming at terminating it using pulses of low energy. To conduct this study, we generated several trajectories of chaotic spiral wave dynamics and studied the time series of the success rate for terminating the complex dynamics by applying such perturbations. In this way, optimal times for the termination of cardiac arrhythmias were found. In contrast, the rather small success rate for low-energy shocks observed in the DRCs is a consequence of applying shocks at random times and averaging over these attempts. In terms of real-life defibrillation, this would mean that, if external low-energy shocks are applied at the right moment in time, defibrillation success rates might be significantly higher than when applying them at random times. By preventing the aforementioned negative side effects of high-energy defibrillation strengths, this could lead to a major improvement in medical application. The paper is structured as follows. In Section 2, we introduce the Fenton-Karma model, its implementation and how defibrillation is simulated. Section 3 reproduces the DRC qualitatively, which is then extended to a study of how the values of the success rate for fixed perturbation parameters are distributed temporally, i.e., within the time series. Afterwards, we perform a robustness study with respect to the fixed perturbation control parameters chosen herein and show how the waiting times for high success rates are distributed. Finally, in Section 4, we summarize the results obtained and critically discuss their generality and applicability to real-life defibrillation.
In this section, we will describe the model used for the study, as well as how it is implemented numerically. We will furthermore show how the complexity of chaotic cardiac dynamics (corresponding to fibrillation) is quantified in terms of phase singularities and explain how defibrillation is realized in our simulations.
For the study of spatiotemporally chaotic spiral waves of cardiac excitation representing fibrillation, we choose a 2D implementation of the Fenton-Karma model Fenton and Karma (1998). Its dynamics is governed by the following reaction-diffusion equations describing the temporal evolution of the membrane potential Vm and the gating variables, v and w:
where
with the smoothing parameter chosen to be k2 = 10. The fast inward (fi), slow outward (so) and slow inward (si) ion currents appearing in Eq. 1 read:
Note that the Heaviside functions Θ occurring here are again approximated by the hyperbolic tangent function (Eq. 4). The parameter set used is given in Table 1.
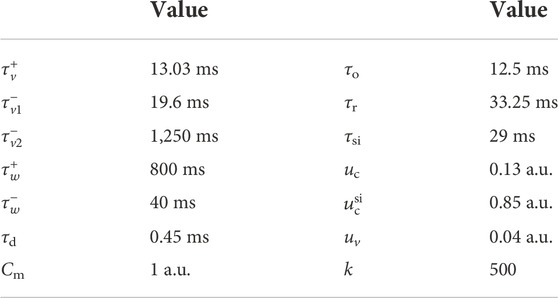
TABLE 1. Fenton-Karma model parameter set used here Fenton et al. (2002).
We chose a 2-dimensional computational domain,
where
We now want to briefly introduce the concept of virtual electrodes which will be used to simulate the defibrillation process. The heart exhibits heterogeneities of different sizes and configurations, caused, e.g., by blood vessels, discontinuities between sheets of fibers and bundles, or collagen existent in the extracellular space, resulting in a change in tissue conductivity Trayanova et al. (1998). When applying an external electrical field for a sufficiently long time, ions in the tissue are exposed to a Lorentz force which, in turn, shifts them such that they assemble at regions of differing conductivities. If the resulting hyper- and depolarization exceeds a certain threshold, an action potential is triggered at the heterogeneities, resulting in excitation waves Pumir and Krinsky (1999); Bittihn et al. (2008); Lilienkamp (2018). In this sense, in the presence of an electric field, the inhomogeneities act as virtual electrodes. The activation threshold of virtual electrodes depends on the shape (curvature) and size Bittihn et al. (2008); Bezekci et al. (2015) of the heterogeneities and the higher the external field strength the more heterogeneities emit a local excitation wave. This relationship between field strength and the number of activated virtual electrodes is exploited in the current study, where the number of local perturbation sites Npert is used as a control parameter representing the applied shock energy.
The perturbation sites (representing heterogeneities) were chosen with a fixed size of 2 × 2 grid points and randomly distributed in space without overlap. The effect of the external electric field is approximated by an instantaneous increase of the membrane potential at the perturbation sites
with an amplitude of
In what follows, we will summarize our results. First of all, we reproduced the typical sigmoid shape of the dose-response curve for the in silico defibrillation attempts. We then analyzed time series of the termination success rates with a focus on their peak structure, followed by a robustness study of the rather specific choice of perturbation parameters made here.
First, we compute the dose-response curve (DRC), describing the dependence of the success rate on the amount of perturbation sites Npert used to terminate the chaotic excitation dynamics and show that the success rate values are broadly distributed around their mean values. Note that, by making use of the concept of virtual electrodes, Npert is here considered to directly correlate with the electric field strength applied to the arrhythmic heart. The defibrillation and the determination of whether the attempt was successful was realized as described in Section 2. As a start, we show an example for an unsuccessful perturbation attempt and an example for a successful one (defibrillation). The failed attempt using Npert = 500 is shown in Figure 1, which also illustrates that the size of the spatial domain is larger than twice the typical diameter of the spiral waves. If, however, not a single phase singularity is detected anymore on

FIGURE 1. An example for an unsuccessful termination attempt for chaotic cardiac excitation using Npert = 500 randomly distributed perturbation sites (visible as yellow dots immediately after the shock at t = 0 ms). White circles indicate phase singularities. At t = 0 ms the phase singularities were computed immediately before the perturbation. After 500 ms, the state still exhibits phase singularities and since they are considered to be the organizing centers of the spiral wave dynamics, they clearly indicate that the termination attempt failed.

FIGURE 2. Successful termination of spiral wave dynamics of cardiac excitation by applying Npert = 1,000 local stimuli to the same state as shown in Figure 1. White circles indicate phase singularities and were computed for t = 0 ms before the perturbation was applied. Even though the number of phase singularities increases shortly after applying the perturbations (not shown here), they died out already 30 ms after applying the perturbations and the remaining excitation converges quickly to the steady state as shown exemplary at t = 100 ms.
For the DRC, we used 30 different fixed numbers of perturbation sites, Npert ∈ {50, 100, 150, … , 1500}. For each of these fixed numbers, we randomly generated 50 different spatial configurations and applied them independently to 20 different chaotic states (CS). Thus, for the DRC, we have a total amount of
termination attempts. The corresponding relation between the success rate and the number of perturbation sites applied, S(Npert), is shown in Figure 3. The shape is indeed sigmoidal and thus qualitatively reproduces the DRCs from experimental Davy et al. (1987); Kwaku and Dillon (1996) and numerical Boegli et al. (2000); Bragard et al. (2013); Lilienkamp and Parlitz (2020) studies.
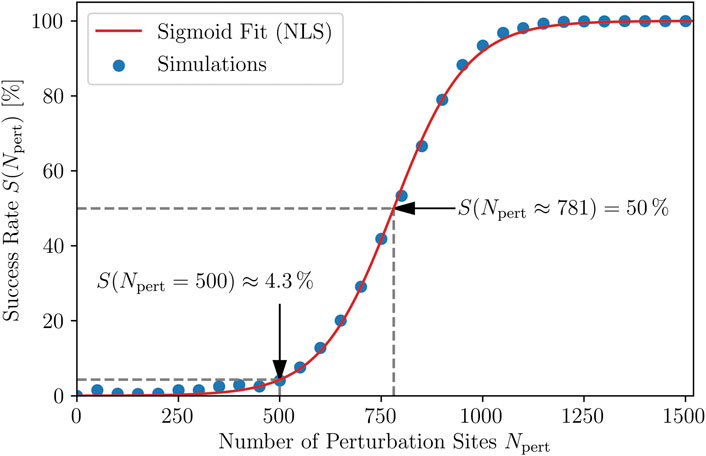
FIGURE 3. Dose-response curve. The dependence of the probability S of a successful termination of the chaotic dynamics on the number of perturbation sites, Npert, corresponding to the strength of the applied shocks. Each point corresponds to 20 × 50 = 1,000 simulations. The simoid fit S = 100/(1 + c exp (−kNpert)) is obtained using nonlinear least squares (NLS) to determine the parameters c = 5,632 and k = 0.01106. The inflection point, as well as the average success rate of 4.3 % for the case of using Npert = 500 perturbation sites are indicated, the latter being referred to in the rest of this study.
Since, due to the averaging over each termination attempt, the representation of the DRC in Figure 3 gives only limited insight into the actual values for the success rate occurring for each fixed Npert, we also investigated the distribution of S(Npert) for all fixed Npert for the same spacing. The resulting success rate distribution DRC is given in Figure 4. It is composed of ten times more defibrillation attempts compared to the averaged DRC shown in Figure 3:
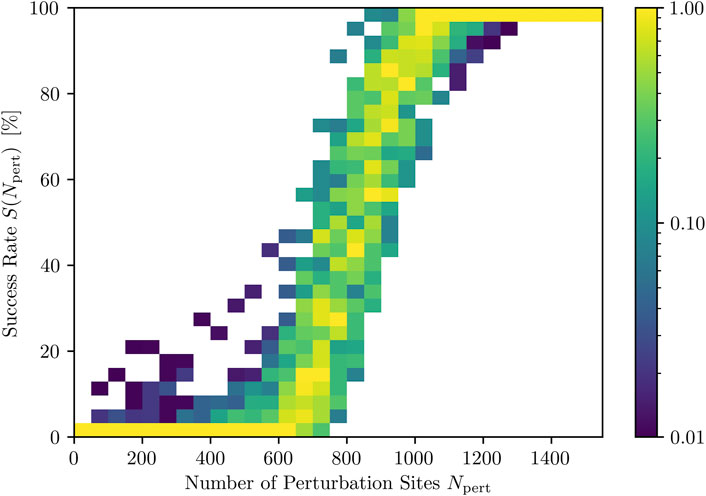
FIGURE 4. Distributions of success rates (color coded) for different numbers of activated perturbation sites, Npert. Note that the colorbar, indicating the occurrence of a success rate range, is chosen logarithmically and normalized to the most frequently occurring success rate range per Npert.
As one can see, perturbations with very low or very high Npert result in narrow distributions of success rate values. Within intermediate ranges of Npert, on the other hand, especially around the inflection point of the DRC, we have a large range of success rates S(Npert). This, in turn, implies that the success of a termination attempt is not only dependent on the number of perturbation sites, Npert, but also on the state (point in time) to which the stimuli are applied.
We now want to show how the success rate is time-dependent or, more specifically, that its time series shows rather high maxima which are not just small deviations around the mean success rate. We will then show that these peaks have a non-vanishing width. As already mentioned in the introduction, the aim of this study is to terminate arrhythmic cardiac excitation waves with perturbation parameters corresponding to low defibrillation field strengths, thus causing less pain and tissue damage due to the shocks, while keeping the termination success rate significantly higher than on average for the same energy. For the perturbations, we chose a fixed number of Npert = 500 perturbation sites and a fixed amplitude of
Given the success rate distribution DRC, Figure 4, we analyze success rate time series S (tappl) in terms of a whether they exhibit a significant peak structure. Compared to both DRCs shown in Figures 3, 4, we strongly increased the amount of realizations for the success rate analyses. First of all, we generated 100 realizations of the time evolution (i.e. 100 trajectories with different initial conditions), each being 10 s long, exhibiting chaotic spiral wave dynamics which were then analyzed time-wise in terms of their response to applied perturbations. The 100 chaotic trajectories were each sampled with a rate of 100.1 Hz, resulting in sequences of states. Each of these states was then perturbed individually 100 times using 100 different, randomly generated fixed spatial distributions of 500 perturbations sites (acting like virtual electrodes). In this way, a success rate was estimated for each of the 1,001 states (or points in time separated by dt = 10 ms) along the chaotic trajectory (CT) respresenting a fibrillation episode. The total amount of termination attempts realized is thus:
First, we want to discuss the structure of the time series and the resulting implications. A typical example of such a time series of the success rate is given in Figure 5. As can be clearly seen, there is a well-established peak structure of the success rate and thus, a time-dependence of it. This means that there are short time intervals within which the termination of chaotic excitation waves is much more probable than on average. As a matter of fact, if external stimuli are applied to the most favorable state of the time series shown in Figure 5, which is at tappl = 3.99 s, the probability to successfully terminate the unwanted dynamics is almost fifteen times higher than when averaging over all success rates of the 1,001 different states the trajectory consists of. On average, such a success rate would be reached only with twice as much perturbations, see Figure 3. The temporally averaged success rate for the trajectory shown in Figure 5 is
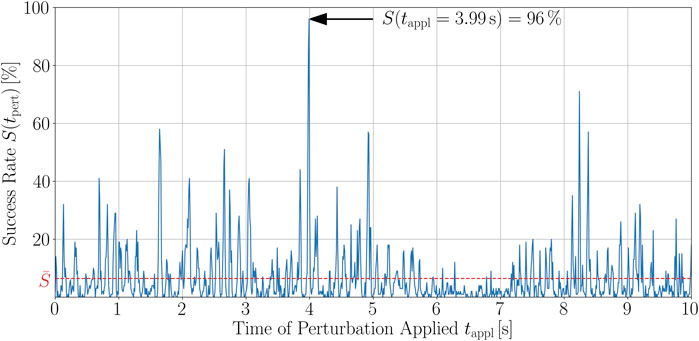
FIGURE 5. Time series of the success rate, S(tappl), for perturbing a trajectory of chaotic cardiac excitation. With a temporal resolution of dtappl = 10 ms, the states along the trajectory are perturbed using 100 different spatial configurations of Npert = 500 perturbation sites that were randomly chosen before starting the analysis and kept fixed along the trajectory. For each of the 100 defibrillation attempts, the success rate was evaluated according to Section 2 and the spiral wave dynamics termination success was estimated in terms of whether phase singularities still exist 500 ms after the perturbation. The temporal average of the success rate over the whole trajectory is
For all of the 100 trajectories, we found qualitatively similar success rate time series. Altogether, the main message of such peak structures for S(tappl) is that, if perturbations are efficiently applied, i.e., at an appropriate time, one can yield success rates being, in parts significantly, higher than the temporal average,
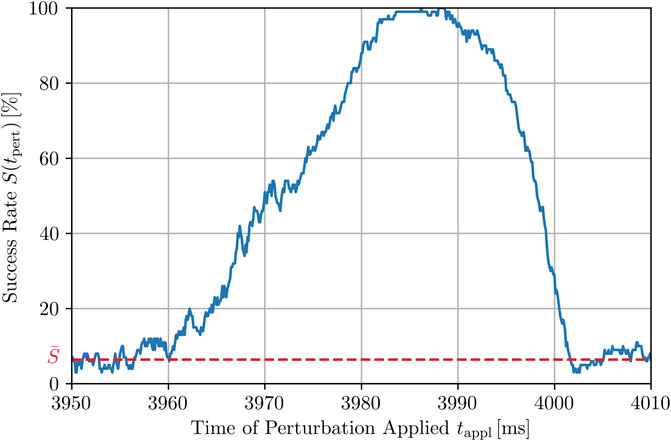
FIGURE 6. Higher-resolution plot of the peak highlighted in Figure 5 at 3.99 s for Npert = 500, using smaller time steps for the application of local stimuli, dtappl = 0.1 ms. The full width at half maximum (FWHM) is roughly 25 ms. However, the whole peak and thus, the time window with a success rate being (in parts significantly) higher than the average success rate
Since the choices of the perturbation parameters, Npert = 500 and
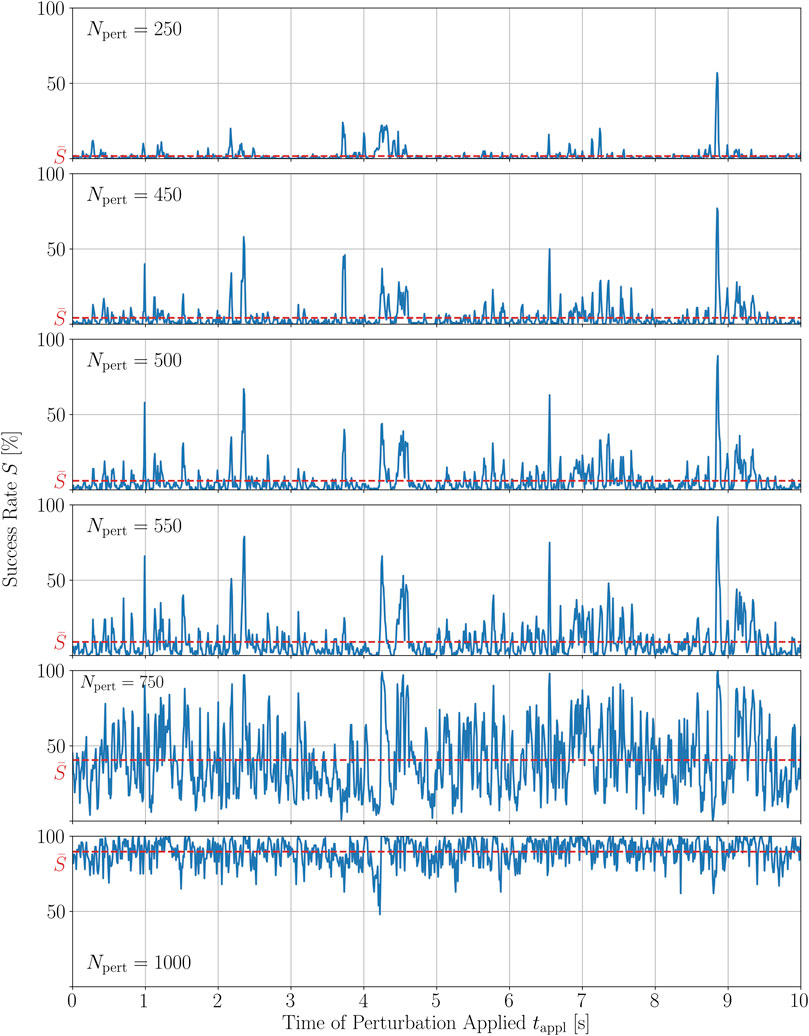
FIGURE 7. Time series of the termination success rate of a single trajectory of chaotic cardiac excitation for different amounts of local stimuli applied Npert to the system.
In order to quantify these observations, we calculated the Spearman and Pearson correlation coefficients, rs and ρp, respectively, between all combinations of time series given in Figure 7. The Spearman correlation is a measure for how well a monotonic function can approximate the relationship between two samples or, in this case, between two time series. In particular, the Spearman coefficients between S(tappl) for Npert = 500 and S(tappl) of the closest numbers investigated here, i.e., 450 and 550, are 0.78 and 0.85, respectively. The complete set of Spearman and Pearson correlation coefficients between the success time series for different numbers of perturbation sites is given in the Supplementary Material. The Pearson correlation coefficient measures the linear dependence of two variables. For small changes in Npert = 500, so again Npert = 450 and Npert = 550, the Pearson correlation coefficient of the corresponding time series S(tappl) is even higher, ρp = 0.93 in both cases, respectively. The relatively large value of the Spearman coefficient and the even larger value for the Pearson coefficient between time series perturbed with similar numbers of perturbation sites, agrees well with the qualitative observation that, most of the peaks are preserved with growing heights, whereas some of them seem to vanish as Npert is increased. Hence, we may conclude that the peak structure is sufficiently robust, especially to small variations in Npert.
We now want to show a similar robustness of S(tappl) to changes in the second perturbation parameter, the amplitude of local stimuli,
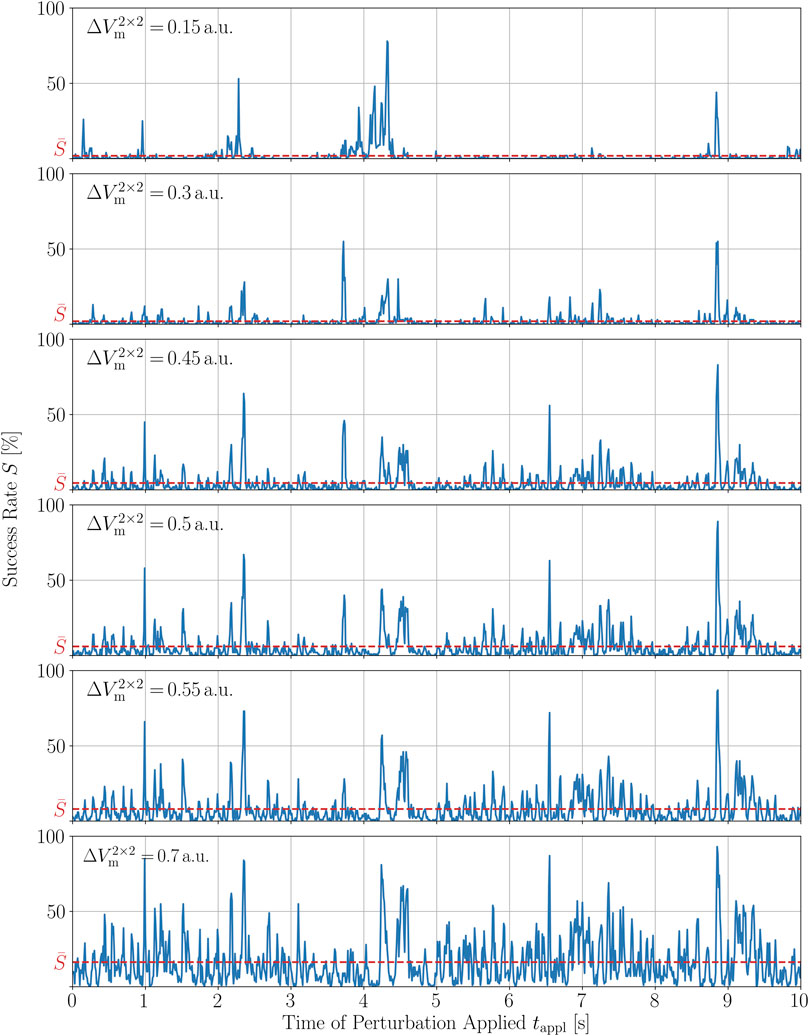
FIGURE 8. Time series of the termination success rate of a single chaotic trajectory for different magnitudes of the perturbations,
Even though most trajectories do exhibit states with relatively large success rates, these peaks do not occur very frequently, as illustrated by the time series shown so far. We therefore show here how waiting times for peaks increase dramatically the larger we require a peak to be and thus, the success rate for defibrillation. For each state of a trajectory investigated, given by its time of occurrence ti, the waiting time is defined as the distance in time from this state to its closest temporally forward peak of the required height h
Note that, if ti itself meets the condition (i.e., is the point in time at which a peak of given height h occurs), then
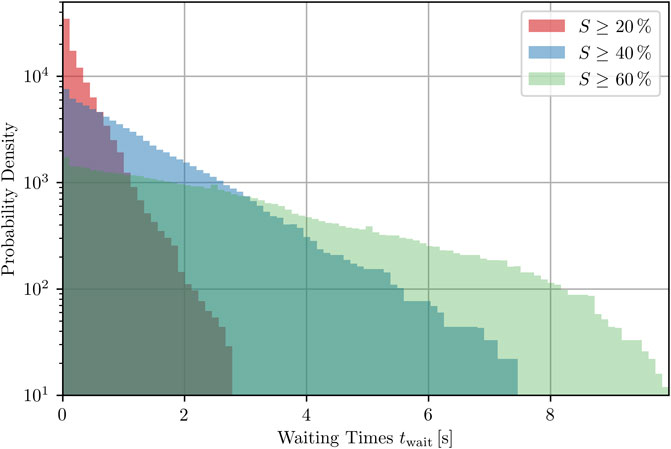
FIGURE 9. Probability density of waiting times for the next peak (with specific minimal heights, respectively) to occur inside one trajectory, averaged over all states of 100 trajectories that do not correspond to a peak of the success rate, see Eq. 10.
Finally, we show here how the peak structure, S(tappl), is characterized in terms of its frequency by comparing the frequency spectra obtained via Fourier transformation (FFT) of both, the success rate and the mean of the membrane potential time series, S(tappl) and
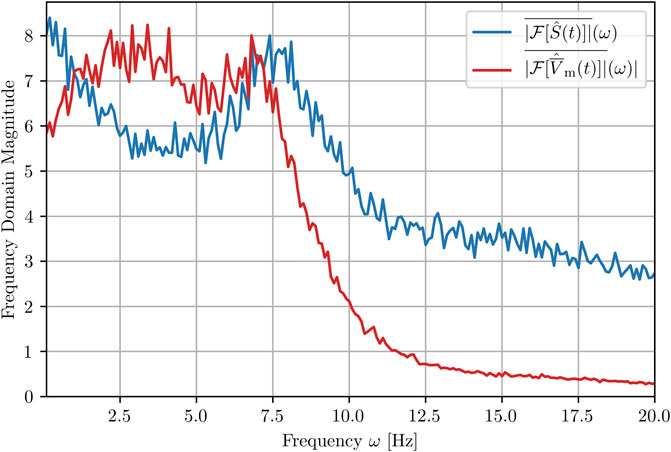
FIGURE 10. Mean amplitude spectra of the success rate and the membrane voltage averaged over 100 realizations (trajectories). Note that the hat denotes the normalization of both quantities before the carrying out the FFT in order to obtain comparable magnitudes and does not itself denote an FFT.
The strongest frequency components of the 100 time series
Defibrillation shocks used to terminate the complex electrical excitation dynamics in the heart during ventricular fibrillation must be of high energy to achieve a high success rate in terminating the arrhythmia, resulting in pain and damage to heart tissue Holden et al. (2019). In practice, these shocks are applied at random times during the fibrillation. Therefore, in this study, we addressed the question of whether there are more favorable times (or states) in the temporal evolution of an arrhythmia at which even medium- or low-energy shocks can terminate the chaotic state corresponding to fibrillation with relatively high probablility. To investigate this question, we performed extensive numerical simulations using the Fenton-Karma model and an implementation of multi-site pacing by virtual electrodes. With these simulations, we were not only able to reproduce the characteristic sigmoidal shape of the dose-response curve, but also found strong fluctuations of the termination success rate during the time evolution of the complex dynamics of cardiac activity resulting in well-established peak structures of success rate time series. In these simulations, it was found that even relatively low energy shocks could terminate the chaotic dynamics if they were applied in short time windows in which the termination success was particularly high. If such fluctuations of termination success could be predicted, they might be exploited in future defibrillation protocols for terminating arrhythmias with low or medium pulse energies.
Since the underlying model represents a simple model for cardiac excitation dynamics, the simulations made here to study success rate time series of trajectories representing arrhythmias only qualitatively describe the dynamics of a real heart. First of all, the Fenton-Karma model is of low to moderate complexity and thus, may not incorporate cardiac dynamics with all desired details. Furthermore, out of several parameter sets suggested for the Fenton-Karma model, we only used a specific one. Thus, the results found in the study presented here need to be confirmed in future investigations. As a starting point, one could repeat the simulations using different parameter sets of the Fenton-Karma model Fenton et al. (2002), corresponding to different properties of cardiac dynamics. Besides being computationally more expensive, the results presented should also be verified using more detailed (ionic) models of cardiac excitation, such as the 4-variable Bueno-Orovio-Cherry-Fenton model Bueno-Orovio et al. (2008), the 8-variable Beeler-Reuter model Beeler and Reuter (1977) or the 17-variable Ten Tusscher-Noble-Noble-Panfilov model ten Tusscher et al. (2004). Future studies may also consider more realistic geometries of the (human) heart Fenton et al. (2005) including fiber orientation Doste et al. (2019) influencing the excitation propagation. Heterogeneities, such as blood vessels and collagen, may not only act as virtual electrodes but also have an impact on the spatio-temporal dynamics Bittihn et al. (2017); Rappel et al. (2022). Modelling this impact in detail requires the use of bidomain models differentiating between intra- and extracellular space. For a more realistic modeling of virtual electrodes, one may use stimuli based on local current injection Feng et al. (2022) and consider perturbation sites of different sizes and shapes where different excitation thresholds due to the strength-extent relation have to be taken into account Bezekci et al. (2015). And again, in all these simulations it has to be checked whether the peaks of high success rate are (still) broad enough to practically apply external shocks precisely within these time frames. Finally, if the findings of the presented study can be confirmed in more detailed simulations of arrhythmic cardiac dynamics and fibrillation, the next challenge will be to predict the peaks in the success rate from measurable observables of the heart.
The raw data supporting the conclusions of this article will be made available by the authors, without undue reservation.
JS, UP, TL, and SL conceived the study, JS performed the simulations and analyzed the data. JS, UP, TL, and SL wrote the manuscript.
The authors acknowledge support by the Max Planck Society (MPG), the German Centre for Cardiovascular Research (DZHK) e.V. and the European High-Performance Computing Joint Undertaking EuroHPC under grant agreement No 955495 (MICROCARD).
The authors declare that the research was conducted in the absence of any commercial or financial relationships that could be construed as a potential conflict of interest.
All claims expressed in this article are solely those of the authors and do not necessarily represent those of their affiliated organizations, or those of the publisher, the editors and the reviewers. Any product that may be evaluated in this article, or claim that may be made by its manufacturer, is not guaranteed or endorsed by the publisher.
The Supplementary Material for this article can be found online at: https://www.frontiersin.org/articles/10.3389/fnetp.2022.1007585/full#supplementary-material
Beeler, G. W., and Reuter, H. (1977). Reconstruction of the action potential of ventricular myocardial fibres. J. Physiology 268, 177–210. doi:10.1113/jphysiol.1977.sp011853
Bezekci, B., Idris, I., Simitev, R. D., and Biktashev, V. N. (2015). Semianalytical approach to criteria for ignition of excitation waves. Phys. Rev. E 92, 042917. doi:10.1103/PhysRevE.92.042917
Bittihn, P., Berg, S., Parlitz, U., and Luther, S. (2017). Emergent dynamics of spatio-temporal chaos in a heterogeneous excitable medium. Chaos 27, 093931. doi:10.1063/1.4999604
Bittihn, P. (2015). Complex structure and dynamics of the heart. 1 edn. Switzerland: Springer International Publishing.
Bittihn, P., Luther, G., Bodenschatz, E., Krinsky, V., Parlitz, U., and Luther, S. (2008). Far field pacing supersedes anti-tachycardia pacing in a generic model of excitable media. New J. Phys. 10, 103012. doi:10.1088/1367-2630/10/10/103012
Boegli, M., Blanc, O., Virag, N., Vesin, J.-M., and Kappenberger, L. (2000). “Study of the defibrillation process in a computer model of human atria,” in Proceedings of the 22nd Annual International Conference of the IEEE Engineering in Medicine and Biology Society (Cat. No.00CH37143), Chicago, IL, USA (IEEE), 1848–1849. doi:10.1109/IEMBS.2000.900446
Bragard, J., Elorza, J., Cherry, E., and Fenton, F. (2013). “Validation of a computational model of cardiac defibrillation,” in Computing in Cardiology 2013, Zaragoza, Spain (IEEE), 851–854.
Bueno-Orovio, A., Cherry, E., and Fenton, F. (2008). Minimal model for human ventricular action potentials in tissue. J. Theor. Biol. 253, 544–560. doi:10.1016/j.jtbi.2008.03.029
Cates, A. W., Wolf, P. D., Hillsley, R. E., Souza, J. J., Smith, W. M., and Ideker, R. E. (1994). The probability of defibrillation success and the incidence of postshock arrhythmia as a function of shock strength. Pacing Clin. Electrophysiol. 17, 1208–1217. doi:10.1111/j.1540-8159.1994.tb01487.x
Chugh, S. S. (2017). Sudden cardiac death in 2017: Spotlight on prediction and prevention. Int. J. Cardiol. 237, 2–5. doi:10.1016/j.ijcard.2017.03.086
Datseris, G., and Parlitz, U. (2022). Nonlinear dynamics - a concise introduction interlaced with code. Springer.
Davy, J.-M., Fain, E. S., Dorian, P., and Winkle, R. A. (1987). The relationship between successful defibrillation and delivered energy in open-chest dogs: Reappraisal of the “defibrillation threshold” concept. Am. Heart J. 113, 77–84. doi:10.1016/0002-8703(87)90012-3
Doste, R., Soto-Iglesias, D., Bernardino, G., Alcaine, A., Sebastian, R., Giffard-Roisin, S., et al. (2019). A rule-based method to model myocardial fiber orientation in cardiac biventricular geometries with outflow tracts. Int. J. Numer. Method. Biomed. Eng. 35, e3185. doi:10.1002/cnm.3185
Fast, V. G., and Cheek, E. R. (2002). Optical mapping of arrhythmias induced by strong electrical shocks in myocyte cultures. Circ. Res. 90, 664–670. doi:10.1161/01.RES.0000013403.24495.CC
Feng, X., Yin, X., Wen, J., Wu, H., and Gao, X. (2022). Removal of spiral turbulence by virtual electrodes through the use of a circularly polarized electric field. Chaos 32, 093145. doi:10.1063/5.0102031
Fenton, F., Cherry, E., Hastings, H., and Evans, S. (2002). Multiple mechanisms of spiral wave breakup in a model of cardiac electrical activity. Chaos (Woodbury, N.Y.) 12, 852–892. doi:10.1063/1.1504242
Fenton, F. H., Cherry, E. M., Karma, A., and Rappel, W.-J. (2005). Modeling wave propagation in realistic heart geometries using the phase-field method. Chaos 15, 013502. doi:10.1063/1.1840311
Fenton, F., and Karma, A. (1998). Vortex dynamics in three-dimensional continuous myocardium with fiber rotation: Filament instability and fibrillation. Chaos (Woodbury, N.Y.) 8, 20–47. doi:10.1063/1.166311
Holden, A. V., Begg, G. A., Bounford, K., Stegemann, B., and Tayebjee, M. H. (2019). Phase entrainment of induced ventricular fibrillation: A human feasibility and proof of concept study. J. Atr. Fibrillation 12, 2217. doi:10.4022/jafib.2217
Iyer, A., and Gray, R. (2001). An experimentalist’s approach to accurate localization of phase singularities during reentry. Ann. Biomed. Eng. 29, 47–59. doi:10.1114/1.1335538
Janardhan, A. H., Gutbrod, S. R., Li, W., Lang, D., Schuessler, R. B., and Efimov, I. R. (2014). Multistage electrotherapy delivered through chronically-implanted leads terminates atrial fibrillation with lower energy than a single biphasic shock. J. Am. Coll. Cardiol. 63, 40–48. doi:10.1016/j.jacc.2013.07.098
Koplan, B., and Stevenson, W. (2009). Ventricular tachycardia and sudden cardiac death. Mayo Clin. Proc. 84, 289–297. doi:10.1016/S0025-6196(11)61149-X
Kwaku, K. F., and Dillon, S. M. (1996). Shock-Induced depolarization of refractory myocardium prevents wave-front propagation in defibrillation. Circ. Res. 79, 957–973. doi:10.1161/01.RES.79.5.957
Lilienkamp, T. (2018). A state space odyssey — the multiplex dynamics of cardiac arrhythmias. Göttingen: University of Göttingen. Dissertation.
Lilienkamp, T., and Parlitz, U. (2020). Terminating transient chaos in spatially extended systems. Chaos 30, 051108. doi:10.1063/5.0011506
Luther, S., Fenton, F., Kornreich, B., Squires, A., Bittihn, P., Hornung, D., et al. (2011). Low-energy control of electrical turbulence in the heart. Nature 475, 235–239. doi:10.1038/nature10216
Mandapati, R., Asano, Y., Baxter, W. T., Gray, R., Davidenko, J., and Jalife, J. (1998). Quantification of effects of global ischemia on dynamics of ventricular fibrillation in isolated rabbit heart. Circulation 98, 1688–1696. doi:10.1161/01.CIR.98.16.1688
Pandit, S. V., and Jalife, J. (2013). Rotors and the dynamics of cardiac fibrillation. Circ. Res. 112, 849–862. doi:10.1161/CIRCRESAHA.111.300158
Press, W. H., Teukolsky, A. S., Vetterling, T. W., and Flannery, B. P. (2007). Numerical recipes 3rd edition: The art of scientific computing. USA: Cambridge University Press.
Pumir, A., and Krinsky, V. (1999). Unpinning of a rotating wave in cardiac muscle by an electric field. J. Theor. Biol. 199, 311–319. doi:10.1006/jtbi.1999.0957
Rappel, W.-J., Krummen, D. E., Baykaner, T., Zaman, J., Donsky, A., Swarup, V., et al. (2022). Stochastic termination of spiral wave dynamics in cardiac tissue. Front. Netw. Physiol. 2, 809532. doi:10.3389/fnetp.2022.809532
ten Tusscher, K. H. W. J., Noble, D., Noble, P. J., and Panfilov, A. V. (2004). A model for human ventricular tissue. Am. J. Physiol. Heart Circ. Physiol. 286, H1573–H1589. doi:10.1152/ajpheart.00794.2003
Keywords: cardiac arrhythmias, defibrillation, electrophysiology, biophysical methods, dose-response curve, spiral waves, spatiotemporal chaos, nonlinear dynamics
Citation: Steyer J, Lilienkamp T, Luther S and Parlitz U (2023) The role of pulse timing in cardiac defibrillation. Front. Netw. Physiol. 2:1007585. doi: 10.3389/fnetp.2022.1007585
Received: 30 July 2022; Accepted: 28 October 2022;
Published: 04 January 2023.
Edited by:
Alessio Gizzi, Campus Bio-Medico University, ItalyReviewed by:
Kristina Berškienė, Lithuanian University of Health Sciences, LithuaniaCopyright © 2023 Steyer, Lilienkamp, Luther and Parlitz. This is an open-access article distributed under the terms of the Creative Commons Attribution License (CC BY). The use, distribution or reproduction in other forums is permitted, provided the original author(s) and the copyright owner(s) are credited and that the original publication in this journal is cited, in accordance with accepted academic practice. No use, distribution or reproduction is permitted which does not comply with these terms.
*Correspondence: Ulrich Parlitz, dWxyaWNoLnBhcmxpdHpAZHMubXBnLmRl
Disclaimer: All claims expressed in this article are solely those of the authors and do not necessarily represent those of their affiliated organizations, or those of the publisher, the editors and the reviewers. Any product that may be evaluated in this article or claim that may be made by its manufacturer is not guaranteed or endorsed by the publisher.
Research integrity at Frontiers

Learn more about the work of our research integrity team to safeguard the quality of each article we publish.