- 1Department of Pathology, The Ohio State University Wexner Medical Center, Columbus, OH, United States
- 2Deparment of Pathology, North District Hospital, Hong Kong, Hong Kong SAR, China
- 3Center for Biostatistics, The Ohio State University Wexner Medical Center, Columbus, OH, United States
- 4Department of Pathology, Nationwide Children Hospital, Columbus, OH, United States
Proteins are filtered from the blood through the glomerular filtration barrier. Filtered proteins are reabsorbed by proximal tubular epithelial cells (PTECs), which have been shown to possess the ability to regulate protein reabsorption. Histologically, these reabsorbed proteins are seen as tubular protein reabsorption droplets (TPRDs). Experimental studies indicate that PTECs play an important role in regulating proteinuria but the correlations between TPRD and the degree of proteinuria in human kidney biopsies have not been investigated in detail. Consecutive native kidney biopsies with non-proliferative glomerular disease performed at the OSUWMC for a 1-year period were analyzed. Cases with acute glomerular diseases and inadequate biopsies were excluded. The staining intensity and the percentage of TPRDs, as well as other morphologic parameters, were assessed. A total of 109 kidney biopsies were included in the study. A reverse correlation was identified between the percentage of albumin TPRDs and proteinuria (p = 0.047). There were positive correlations between proteinuria and the staining intensity for IgG TPRDs (p = 0.05) and the degree of acute tubular necrosis (ATN) (p = 0.015). In patients with no ATN, positive correlations between proteinuria and albumin and IgG TPRDs were seen, whereas in patients with ATN, these correlations were lost. A positive correlation was seen between proteinuria and chronic kidney injury. A strong correlation was noted between the degree of proteinuria and podocyte foot process effacement. Our data indicate that PTECs regulate proteinuria by absorbing proteins from the urine filtrate. Therefore, based on the human renal biopsy material, our study confirms that well-functioning renal PTECs play an important role in the regulation of proteinuria.
Introduction
Proteinuria is a known risk factor for developing chronic kidney disease (CKD) (1). The mechanisms by which the proteins are filtered and handled in the kidney have been extensively studied, mostly in animal models. The glomerular filtration barrier (GFB) determines the amount and type of plasma proteins being filtered into the glomerular filtrate. The GFB consists of three major components: the fenestrated endothelium, the glomerular basement membrane (GBM), and the podocytes that have slit diaphragms in between the interdigitating foot processes (2). Under physiological conditions, most of the filtered proteins are reabsorbed within the first two segments of the proximal tubule by proximal tubular epithelial cells (PTECs) mainly via endocytosis (3).
Proteinuria occurs when the amount of filtered proteins exceeds the reabsorption capacity of the PTECs or when there is a dysfunction of the PTECs. Accordingly, it can be classified into glomerular proteinuria and tubular proteinuria. Glomerular proteinuria is further divided into selective proteinuria and non-selective proteinuria. In selective proteinuria, the GFB allows only the passage of low molecular weight proteins (LMWPs), such as albumin, but not high molecular weight proteins (HMWPs), such as immunoglobulins (Ig) (4, 5). On the contrary, in non-selective proteinuria, both LMWPs and HMWPs pass through the GBM into the ultimate glomerular filtrate (5, 6).
Based on an albumin overload animal model, Molitoris et al. demonstrated that reabsorption in the proximal tubule was the major determinant of urinary albumin excretion, rather than alteration in the glomerular filtration of albumin (7). Furthermore, it was shown that the diphtheria toxin-mediated increase in glomerular permeability to albumin resulted in corresponding increases in the albumin reabsorption in the first two segments of the proximal tubules, indicating that PTECs have the capacity to regulate tubular albumin reabsorption and thus the level of urinary albumin (7).
Excessive amounts of proteins in the glomerular filtrate in pathological proteinuria are toxic to tubular epithelial cells (8). Morphologically, the proteins reabsorbed by PTECs appear as tubular protein reabsorption droplets (TPRDs). We hypothesize that there is a correlation between the level of proteinuria and the protein reabsorption droplets in PTECs and the tubular epithelial cell injury. The aim of this study was to investigate the correlation between proteinuria and histologic markers based on human kidney biopsies.
Materials and methods
Consecutive native kidney biopsies at the Renal and Transplant Pathology Laboratory at the Ohio State University Wexner Medical Center (OSUWMC) that were received from 1 October 2022 to 30 November 2023 were evaluated. Cases with active inflammatory glomerular diseases, such as endocapillary proliferative glomerulonephritis (such as ISN/RPS lupus nephritis class III or IV) or crescentic glomerulonephritis, biopsies with active interstitial inflammation, and biopsies with inadequate sampling or clinical history, were excluded. The cases with active inflammatory glomerular diseases were excluded to avoid the impact of inflammatory cytokines and oxidative stress on the tubular epithelial cells. Each case represented an individual patient. If a patient had several kidney biopsies, then only the first one was used for analysis.
Each kidney biopsy was routinely processed. Three-micrometer-thick paraffin sections were stained with hematoxylin and eosin (H&E), periodic acid-Schiff (PAS), Masson’s trichrome, and Jones’ Methenamine Silver stain. The following histologic parameters were scored: the total number of glomeruli, the percentage of globally sclerosed glomeruli, the percentage of interstitial fibrosis and tubular atrophy (IFTA), the degree of arterial intimal thickening, the degree of arteriolar hyalinosis, and the degree of acute tubular necrosis (ATN). A semiquantitative scale of 0 to 3 was used to quantify the percentage of the lesions (0 = <10%, 1 = 11%–25%, 2 = 26%–50%, 3 = >50%). Routine direct immunofluorescence was performed on the frozen sections. The staining intensity of TPRDs (with a scale of 0 to 3, as illustrated in Figure 1) as well as the percentage of proximal tubules containing these reabsorption droplets was assessed for albumin and IgG. Transmission electron microscopy was performed to assess the extent of podocyte foot process effacement. Demographic data and the levels of proteinuria were collected from clinical records. Urinary protein/creatinine ratio or 24-h proteinuria that was collected within 1 week prior to the kidney biopsy procedure was used.
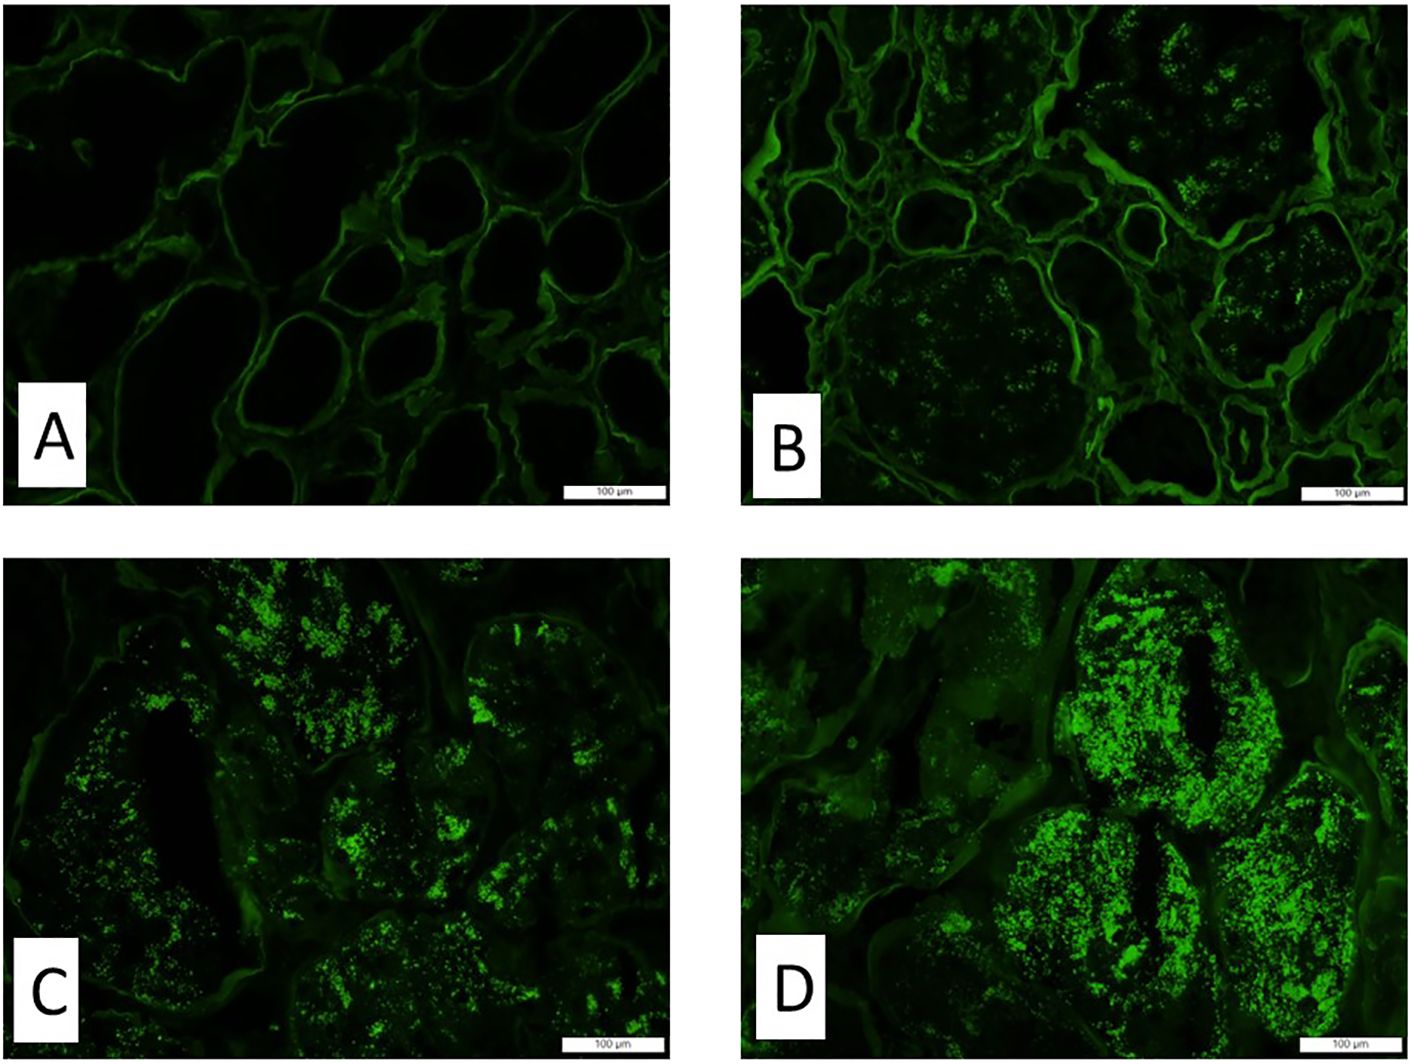
Figure 1. The staining intensity of the tubular protein resorption droplets by immunofluorescence. Representative images of immunofluorescence with antibody and albumin show different staining intensities in tubular protein resorption droplets. (A) Score 0, (B) score 1, (C) score 2, and (D) score 3. Magnification ×200.
Statistical analyses
The data were analyzed using Statistical Analysis Software, version 9.4 (SAS Institute Inc., Cary, NC, USA). The normality of data was assessed after visual inspection of the data and with the Shapiro–Wilk normality test. Continuous data were reported as the median with the interquartile range due to the non-normal distribution of data. Data were analyzed by the Mann–Whitney U test for comparison between the proteinuria <3-g and proteinuria ≥3-g groups. Spearman correlation analysis was used for parametric variables to identify the correlation between variables. Results were considered statistically significant if p-values were <0.05. The chi-square test was used to analyze differences between diagnostic categories; locally weighted regression analysis was used to fit a smooth curve through points in the scatter plots.
Results
Demographic and clinical data
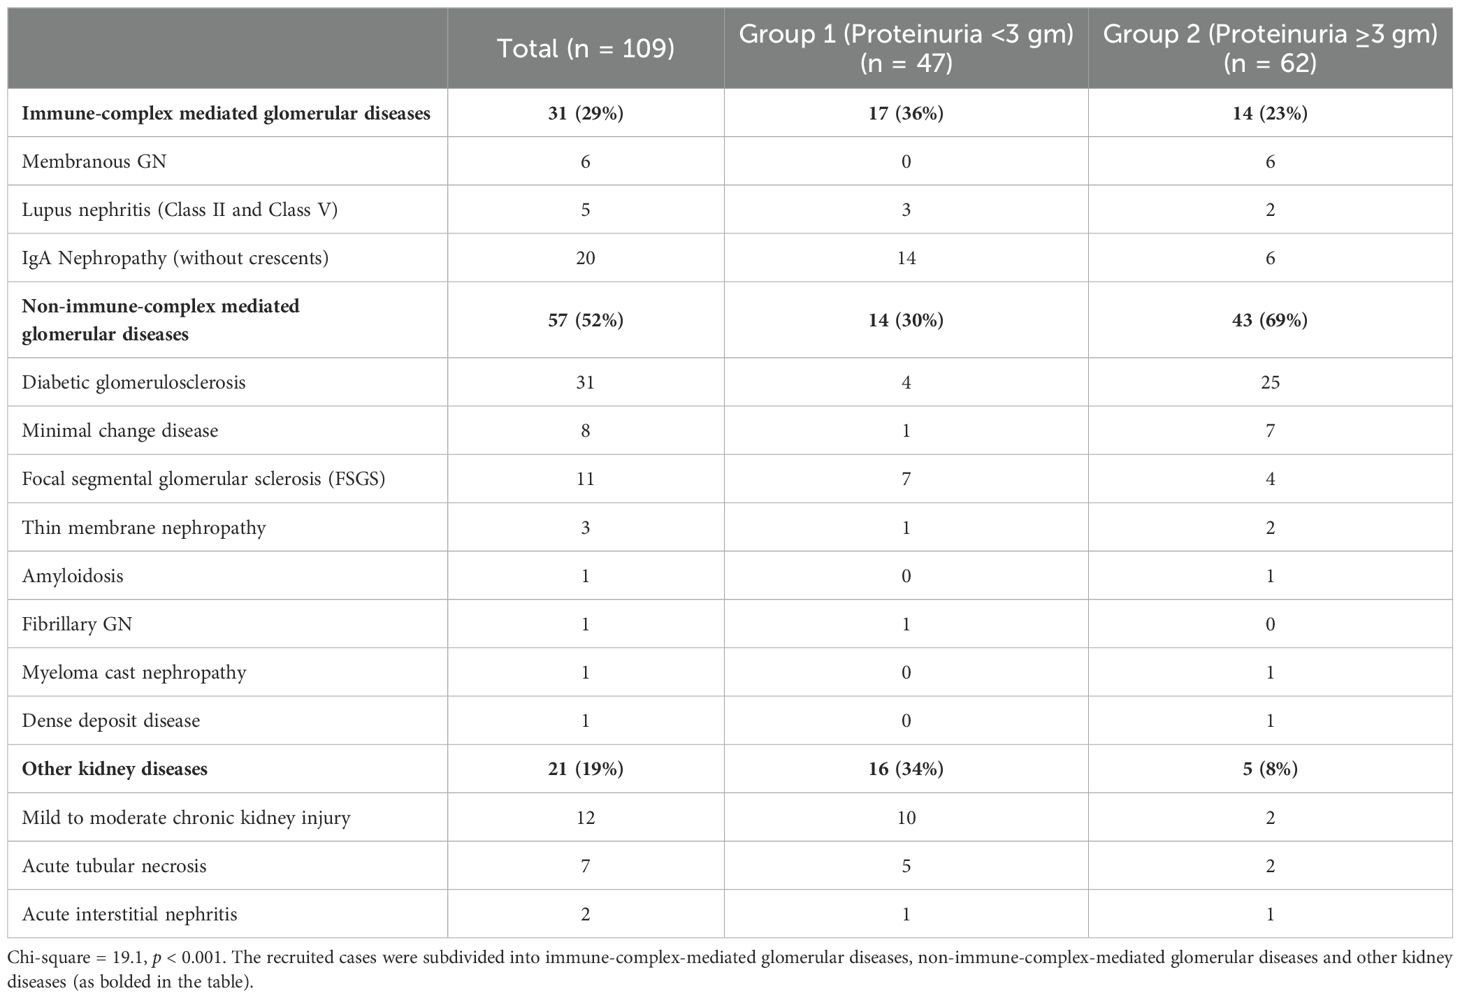
A total of 109 cases were recruited into the study. The major diagnostic categories of the recruited cases are listed in Table 1, and the cases were divided into two groups based on the level of proteinuria: group 1 included patients with proteinuria <3 g (47 patients) and group 2 included those with proteinuria ≥3 g (62 patients). It appears that non-immune complex-mediated glomerular diseases were more prevalent in patients with nephrotic range proteinuria, whereas other diseases were more commonly seen in patients with subnephrotic proteinuria (Table 1, chi-square = 19.1, p < 0.001).
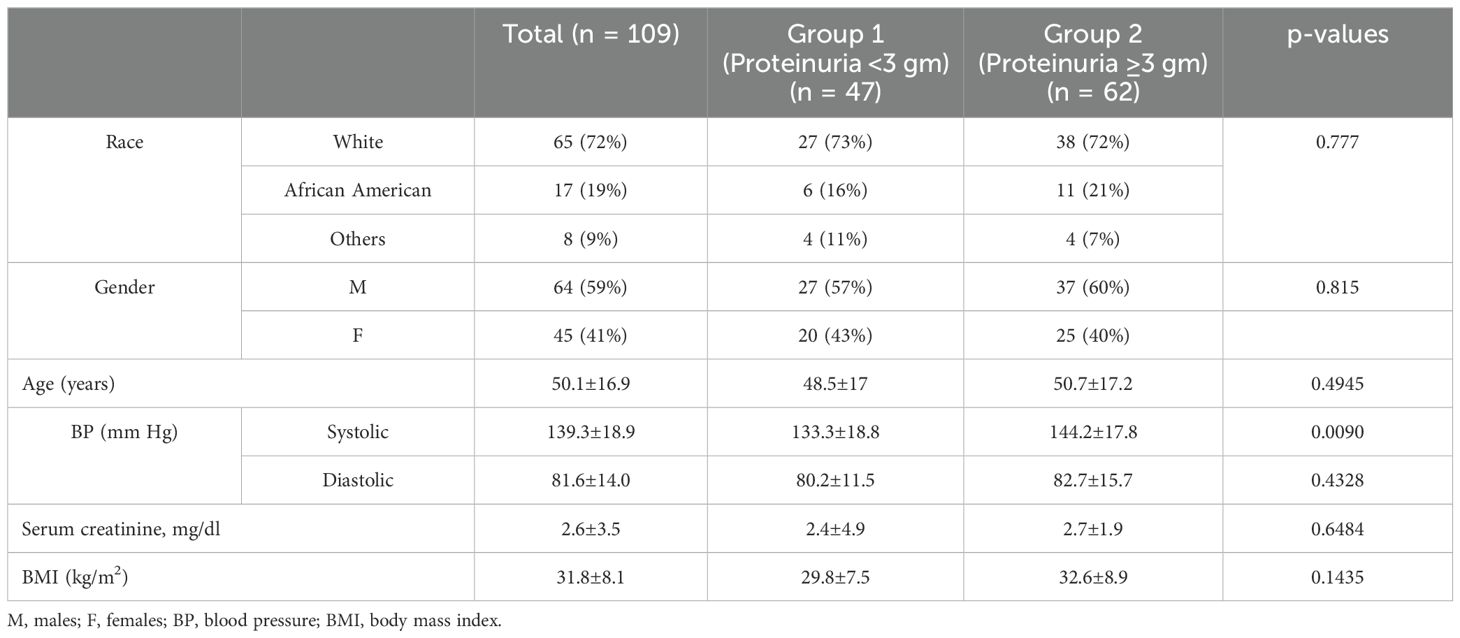
Demographic and clinical data of the patients are presented in Table 2. Patients in both groups were similar with regard to age (group 1: 48.5 ± 17 y.o. vs. group 2: 50.7 ± 17.2 y.o.; p = 0.4945), Ethnicity (p = 0.777), and sex (p = 0.815). Group 2 patients had higher systolic blood pressure than group 1 patients (144.2 ± 17.8 mmHg vs. 133.3 ± 18.8 mmHg, respectively; p = 0.0090).
Correlations between proteinuria and morphologic findings
There was a reverse correlation between the staining for albumin in TPRDs and proteinuria. The correlation reached statistical significance only for the percentage of tubules with albumin TPRDs (p = 0.047) (Figure 2A) but not for the scoring intensity (p = 0.460) (Figure 2D). Subgroup analysis demonstrated that such correlation was stronger in group 2 patients with nephrotic range proteinuria, and similarly, only the correlation for the percentage of tubules with albumin reabsorption droplets reached statistical significance (p = 0.001) (Figures 2C, F). Conversely, such correlation was lost in group 1 patients with subnephrotic range proteinuria (Figures 2B, E).
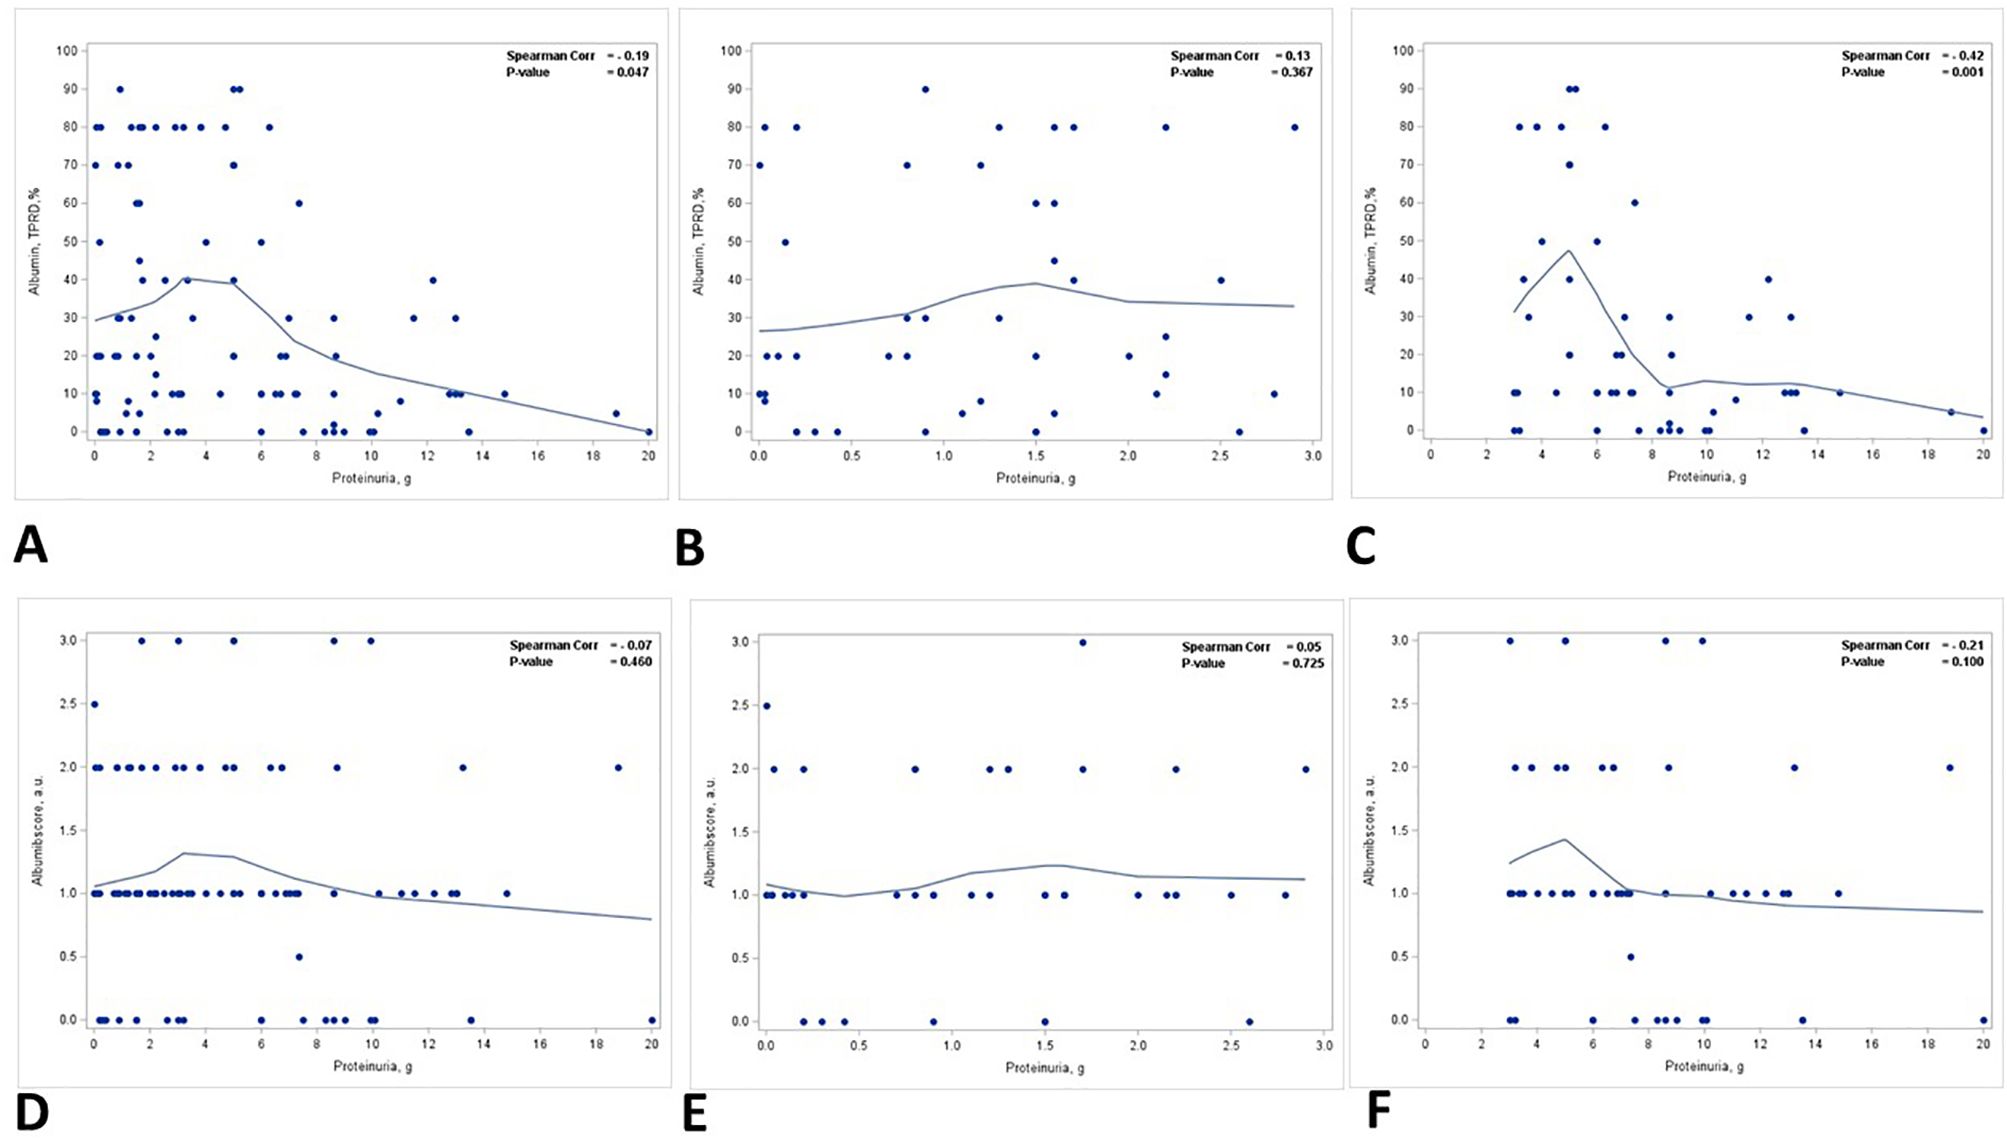
Figure 2. Correlation between proteinuria and immunofluorescence staining for albumin in TPRDs. Correlation between the percentage of tubules positive for albumin in TPRDs and proteinuria (g) in (A) all patients, (B) patients with proteinuria <3 g, and (C) patients with proteinuria ≥3 (g) Correlation between the staining intensity for albumin (graded from 0 to 3) in TPRDs and proteinuria (g) in (D) all patients, (E) patients with proteinuria <3 g, and (F) patients with proteinuria ≥3 (g) Spearman coefficient R and the corresponding p-value are shown on each plot with a fit line.
A positive correlation was identified between the staining intensity for IgG in TPRDs and proteinuria, but not the percentage of IgG TPRDs. In all patients, the correlation between the staining intensity for IgG TPRDs and proteinuria was on the verge of reaching statistical significance (p = 0.05) (Figure 3D) but not for the percentage of tubules with IgG TPRDs (p = 0.207) (Figure 3A). Similar correlations were observed in group 1 patients with subnephrotic range proteinuria (p = 0.05 for both the intensity and the percentage of IgG TPRDs staining, Figures 3B, E). However, this correlation was lost in group 2 patients with nephrotic range proteinuria (Figures 3C, F).
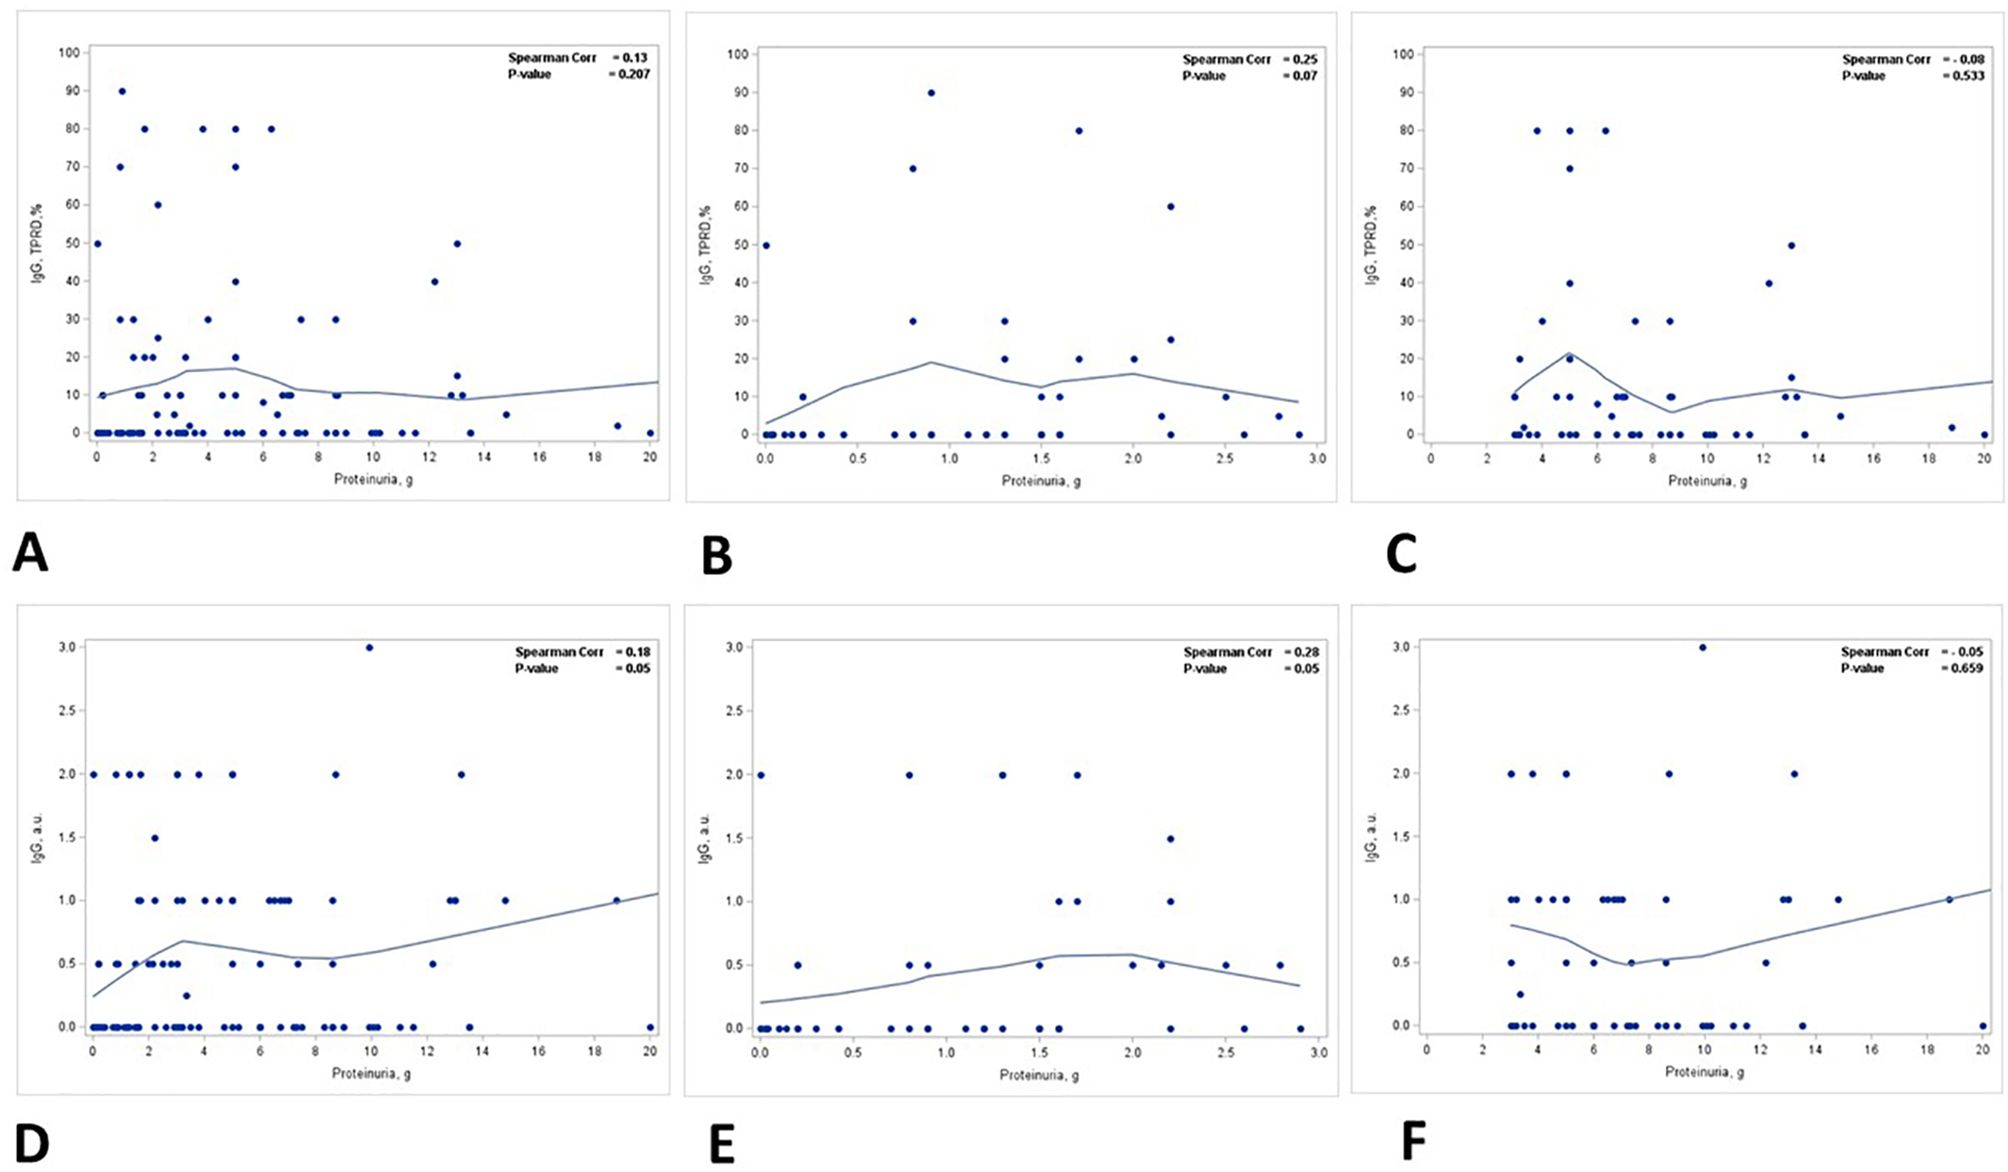
Figure 3. Correlation between proteinuria and immunofluorescence staining for IgG in TPRDs. Correlation between the percentage of tubules positive for IgG in TPRDs and proteinuria (g) in (A) all patients, (B) patients with proteinuria <3 g, and (C) patients with proteinuria ≥3 (g) Correlation between the staining intensity for IgG (graded from 0 to 3) in TPRDs and proteinuria (g) in (D) all patients, (E) patients with proteinuria <3 g, and (F) patients with proteinuria ≥3 (g) Spearman coefficient R and the corresponding p-value are shown on each plot with a fit line.
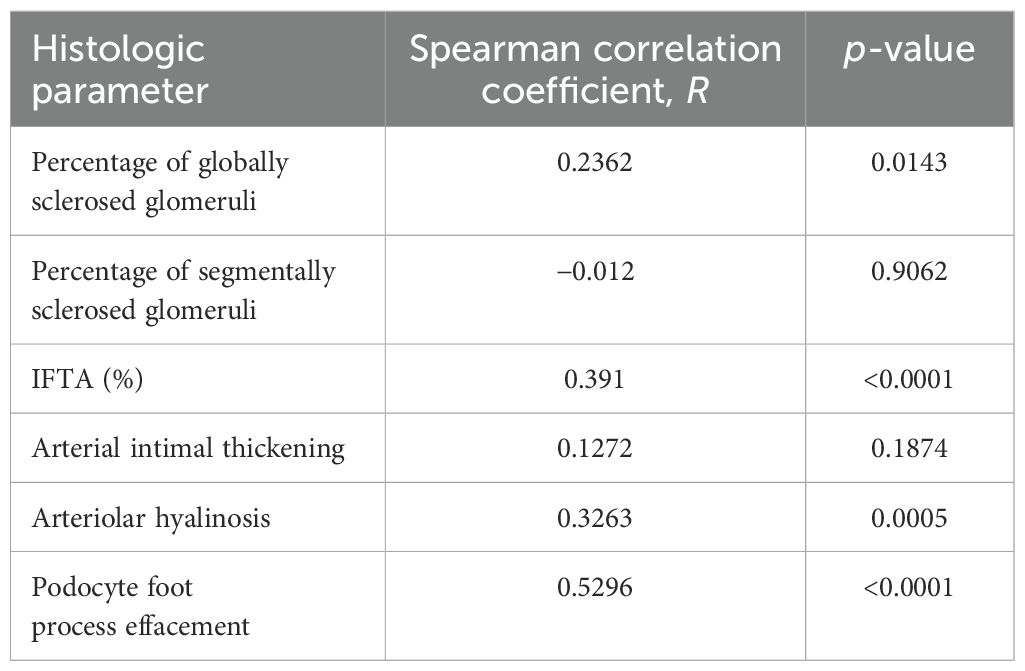
There were positive correlations between the percentage of globally sclerosed glomeruli, IFTA, vascular injury, podocyte foot process effacement, and proteinuria. The correlations were strongest for IFTA (%) and the degree of podocyte foot process effacement (Table 3).
There was a statistically significant positive correlation between the degree of ATN and the level of proteinuria (p = 0.015) (Figure 4A, Table 3). This correlation was noted in patients with nephrotic range proteinuria (group 2) (p = 0.058) (Figure 4C) but was lost in patients with subnephrotic range proteinuria (group 1) (Figure 4B). When the biopsies were stratified based on the presence or absence of ATN, there was a positive correlation between the level of proteinuria and the staining intensity in TPRDs for both albumin and IgG in cases with uninjured tubular epithelial cells (ATN = 0) (Figures 5A, C). This correlation was lost when tubular epithelial cells were injured (ATN ≥ 1) (Figures 5B, D, Table 4).

Figure 4. Correlation between proteinuria and acute tubular necrosis in kidney biopsies. Correlation between acute tubular necrosis (ATN) (graded from 0 to 3) and proteinuria (g) in (A) all patients, (B) patients with proteinuria <3 g, and (C) patients with proteinuria ≥3 (g) Spearman coefficient R and the corresponding p-value are shown on each plot with a fit line.
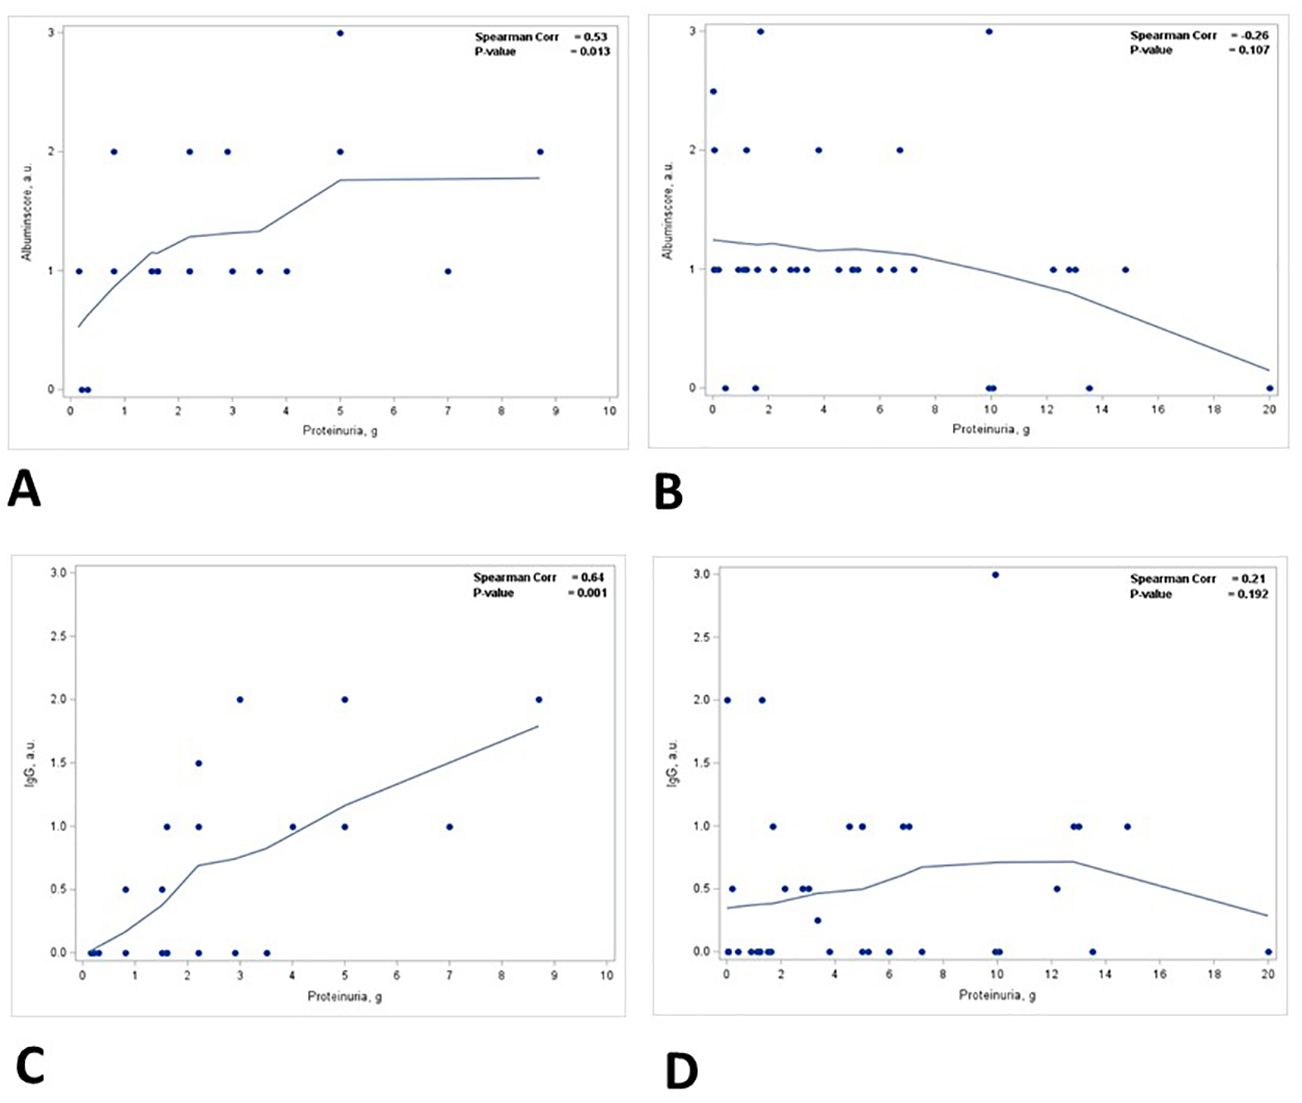
Figure 5. Correlation between proteinuria and staining intensity in TPRDs for albumin and IgG stratified based on the degree of ATN. Correlation between the level of proteinuria and the staining intensity in TPRDs for albumin in (A) cases with uninjured tubular epithelial cells (ATN = 0) and (B) in cases with injured tubular epithelial cells (ATN ≥ 1). Correlation between the level of proteinuria and the staining intensity in TPRDs for IgG in (C) cases with uninjured tubular epithelial cells (ATN = 0) and (D) in cases with injured tubular epithelial cells (ATN ≥ 1). Spearman coefficient R and the corresponding p-value are shown on each plot with a fit line.
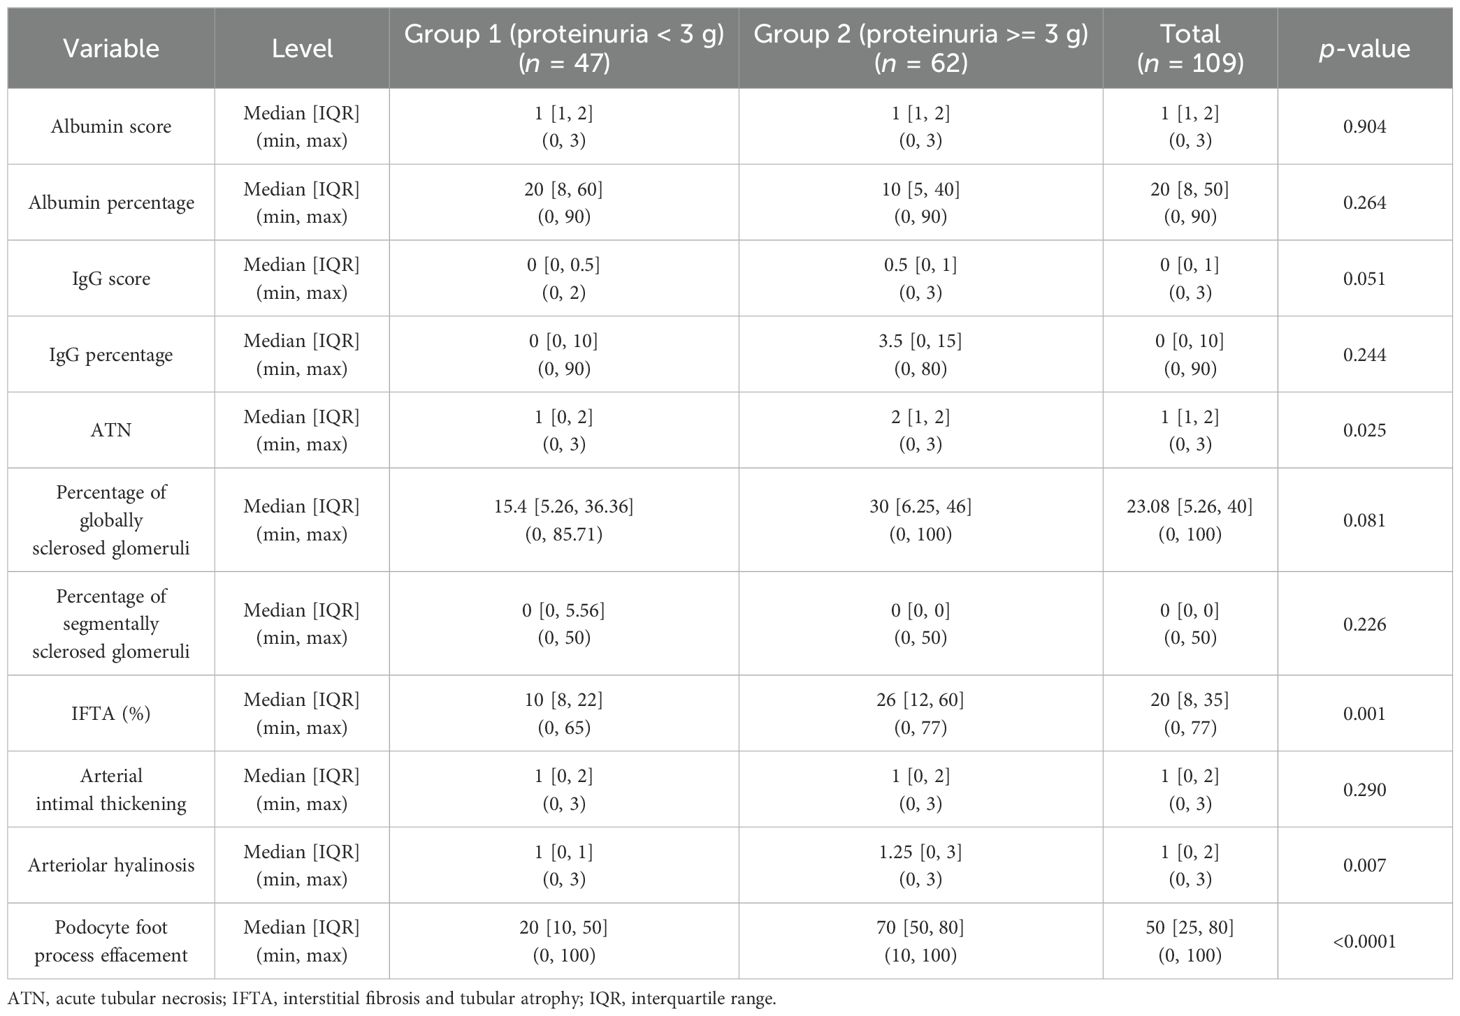
Table 4. Relationship between proteinuria and histologic parameters in patients with non-nephrotic (group 1) and nephrotic range (group 2) proteinuria.
Discussion
To the best of our knowledge, this is the first large-scale study to analyze the correlation between proteinuria and the specific histologic marker (TPRDs in PTECs) based on human kidney biopsies. Our data demonstrate that the extent of TPRDs negatively correlates with the level of proteinuria detected clinically. This is in concordance with the findings of the previous animal studies performed by Russo et al. (9) and Molitoris et al. (7), which have shown that PTECs possess the capacity to regulate albumin uptake and dysfunction of the albumin uptake pathway(s) in PTECs contributes to an increase in urinary albumin. Arafam et al. (10) studied the correlation between morphologically recognizable glomerular podocytes and renal tubular epithelium with reabsorbed proteins and the level of proteinuria in patients with various glomerulopathies. In that study, a total of 22 patients with clinical proteinuria and 3 patients as control were recruited. Similar to our data, the authors showed a negative correlation between the percentage of tubules with albumin protein reabsorption droplets and the level of proteinuria. We further analyze this finding by subdividing patients based on the proteinuria level. Subgroup analysis reveals that such correlation is stronger in group 2 patients with nephrotic range proteinuria.
Our study includes not only albumin tubular reabsorption droplets but also IgG tubular reabsorption droplets, analyzing selective and non-selective proteinuria. There is no clear relationship between IgG staining and proteinuria (Figure 3) until stratified by ATN. The relationship between semiquantitative IgG staining and proteinuria was borderline at p = 0.05. Both the scoring intensity and the percentage of tubules with IgG reabsorption droplets are higher in group 2 patients with nephrotic range proteinuria. IgG is an HMWP with a molecular weight of 150 kDa (11). Under normal physiological conditions, IgG accounts for only a small fraction of urinary proteins (5%–10%) (12) and the presence of a significant amount of urinary IgG signifies non-selective proteinuria (5). The extent of IgG reabsorption droplets in PTECs reflects the severity of proteinuria, and this can be a potential biomarker for non-selective proteinuria.
Our data also show the correlation between the degree of ATN and the level of proteinuria. The degree of ATN is more severe in group 2 patients with nephrotic range proteinuria (p = 0.025). A positive correlation is found between the degree of ATN and the level of proteinuria, but this correlation is present only in group 2 patients with nephrotic range proteinuria. When the biopsies are stratified based on the degree of ATN, there is a positive correlation between the level of proteinuria and the staining intensity in TPRDs for both albumin and IgG in cases without ATN. However, this correlation is lost when tubular epithelial cells are injured (i.e., cases with ATN ≥ 1). These data are supported by previous observations in animals that PTECs regulate the level of urinary albumin by changing its reabsorption (7). In previous animal studies, this was demonstrated by albumin only. Our data demonstrate that similar regulatory mechanisms are present for HMWP as well.
Persistent excessive protein exposure becomes toxic to PTECs by suppressing autophagy, which is an important cellular survival mechanism. Autophagy functions by constantly recycling macromolecules non-selectively to maintain cellular homeostasis, or by degrading certain targeted cellular components selectively to maintain cellular function under oxidative stress or starvation (8, 13). Chronic proteinuria inhibits autophagy in PTECs, resulting in an accumulation of toxic intracellular molecules including damaged mitochondria, thus leading to progressive tubular injury and demise of PTECs (8), which can manifest as IFTA by histology. On the other hand, dysfunction of PTECs in acute kidney injury (AKI) that histologically manifests as ATN (14) can also lead to proteinuria. In either condition, the damaged PTECs lose their ability to reabsorb proteins that are filtered through the GFB, further aggravating the degree of proteinuria and potentially resulting in a vicious cycle. This explains why a positive correlation between the degree of proteinuria and the amount of reabsorbed proteins in the tubules is present in cases without ATN, but this correlation is lost whenever there is any injury to the tubular epithelial cells. Studies performed on rats with doxorubicin-induced nephrosis or age-related proteinuria confirmed that the accumulation of filtered proteins in the PTECs was associated with IFTA and glomerulosclerotic lesions (15, 16). More recent studies have discovered that chronic proteinuria substantially increases the synthesis of reactive oxygen species (ROS) in PTECs, which triggers and exacerbates tubulointerstitial inflammation and fibrosis (8).
Our findings of positive correlations between the percentage of globally sclerosed glomeruli as well as IFTA and the level of proteinuria are in agreement with the results of animal studies. In addition, the percentage of globally sclerosed glomeruli and IFTA is higher in group 2 patients with nephrotic range proteinuria. All these imply that the level of proteinuria depends on the functional renal cortex. This is probably related to the progressive nephron loss with subsequent worsening of glomerular hyperperfusion/hyperfiltration injury at the single nephron level.
As expected, there is a strong positive correlation between the degree of podocyte foot process effacement and the level of proteinuria, and the degree of foot process effacement is more severe among patients with nephrotic range proteinuria (p < 0.0001). The exact significance of the degree of arteriolar hyalinosis in kidney biopsies is yet to be determined. Studies have shown that arteriolar hyalinosis is related to rapid GFR decline (17) and predicts the onset of both macroalbuminuria and eGFR <60 in patients with type 2 diabetes (18). Our data demonstrate a strongly significant positive correlation between the degree of arteriolar hyalinosis and the level of proteinuria (p = 0.0005). Although the precise mechanism underlying this correlation remains unclear, it is possible that hyaline deposition reduces the lumen and elasticity of arterioles. This could interfere with the glomerular filtration pressure and post-glomerular oxygen supply of the tubules, worsening the level of proteinuria both at the levels of glomerular filtration and tubular protein reabsorption.
There are several limitations in our studies. First, for most of the correlations, significance is near p = 0.05 with a low Spearman correlation coefficient (0.1–0.2). These identify weak correlations that could be related to selection criteria or a low number of patients. On the other side, there are strong correlations after the correction for ATN (Spearman > 0.5 and p < 0.001). Second, there are several ways to distinguish selective from non-selective proteinuria (albuminuria vs. immunoglobulinuria). In our studies, we used only general proteinuria because of the limited data regarding the specific composition of the proteins in the urine which is usually not a part of a routine clinical workup. Our results would have been stronger if the correlations had taken into account not only proteinuria but also albuminuria or urinary B2 microglobulin. Third, as it was mentioned above, statistical power is somewhat low, which could be due to possible inclusion bias and sample size. Fourth, due to a lack of data on urinary sediment analysis in many patients, it was not included in the analysis. Urine sediment data could help in determining the degree of ATN. Fifth, the semiquantitative scoring of IgG or albumin uptake (1+ to 3+, etc.) may be unreliable due to subjectivity and the focal nature of proteinuric renal diseases. These data seem to suggest that reporting it as a percentage of proximal tubular cells with TRPDs is a more robust measurement of these underlying mechanisms.
Even though the clinical significance of our findings at this moment is not clear, these data indicate the similarity between the experimental animal studies and human biopsy findings, suggesting that similar mechanisms of renal function regulation are present. Therefore, pharmacological and therapeutic studies on animals are valid for humans as well.
Conclusions
Our data support the hypothesis that PTECs have the ability to regulate protein reabsorption, thus regulating proteinuria. This function depends on the functional integrity of PTECs and such correlation is lost in cases with ATN. Also, the level of proteinuria correlates with the degree of podocyte foot process effacement and the degree of chronic kidney injury.
Data availability statement
The raw data supporting the conclusions of this article will be made available by the authors, without undue reservation.
Ethics statement
The studies involving humans were approved by the Institutional Review Board of the Ohio State University. The studies were conducted in accordance with the local legislation and institutional requirements. The human samples used in this study were acquired from a by-product of routine care or industry. Written informed consent for participation was not required from the participants or the participants’ legal guardians/next of kin in accordance with the national legislation and institutional requirements.
Author contributions
BC: Conceptualization, Data curation, Formal analysis, Investigation, Writing – original draft, Writing – review & editing, Software, Visualization. VY: Data curation, Formal analysis, Visualization, Writing – review & editing, Validation. LB: Data curation, Validation, Writing – review & editing, Investigation. AD: Conceptualization, Methodology, Supervision, Validation, Writing – review & editing. AS: Conceptualization, Formal analysis, Project administration, Writing – review & editing. AC: Data curation, Writing – review & editing, Formal Analysis. TN: Data curation, Writing – review & editing, Conceptualization, Validation, Visualization, Writing – original draft. SB: Conceptualization, Data curation, Writing – original draft, Writing – review & editing, Formal analysis, Investigation, Supervision.
Funding
The author(s) declare financial support was received for the research, authorship, and/or publication of this article. These studies were supported by the NIH NIDDK grant R01DK117102 to SB.
Conflict of interest
The authors declare that the research was conducted in the absence of any commercial or financial relationships that could be construed as a potential conflict of interest.
The author(s) declared that they were an editorial board member of Frontiers, at the time of submission. This had no impact on the peer review process and the final decision.
Publisher’s note
All claims expressed in this article are solely those of the authors and do not necessarily represent those of their affiliated organizations, or those of the publisher, the editors and the reviewers. Any product that may be evaluated in this article, or claim that may be made by its manufacturer, is not guaranteed or endorsed by the publisher.
References
1. Iseki K, Ikemiya Y, Iseki C, Takishita. Proteinuria and the risk of developing end-stage renal disease. Kidney Int. (2003) 63:1468–74. doi: 10.1046/j.1523-1755.2003.00868.x
2. Daehn IS, Duffield JS. The glomerular filtration barrier: a structural target for novel kidney therapies. Nat Rev Drug Discovery. (2021) 20:770–88. doi: 10.1038/s41573-021-00242-0
3. Birn H, Nielsen R, Weyer K. Tubular albumin uptake: is there evidence for a quantitatively important, receptor-independent mechanism? Kidney Int. (2023) 104:1069–73. doi: 10.1016/j.kint.2023.07.030
4. D'Amico G, Bazzi C. Pathophysiology of proteinuria. Kidney Int. (2003) 63:809–25. doi: 10.1046/j.1523-1755.2003.00840.x
5. Liu W, Su ZH, Wan QJ. Proteinuria selectivity index in renal disease. Clin Chim Acta. (2024) 552:1–8. doi: 10.1016/j.cca.2023.117675
6. Fujigaki Y, Nagase M, Hidaka S, Matsui K, Shirai M, Nosaka H, et al. Altered anionic GBM components in monoclonal antibody against slit diaphragm-injected proteinuric rats. Kidney Int. (1998) 54:1491–500. doi: 10.1046/j.1523-1755.1998.00131.x
7. Wagner MC, Campos-Bilderback SB, Chowdhury M, Flores B, Lai X, Myslinski J. Proximal tubules have the capacity to regulate uptake of albumin. J Am Soc Nephrol. (2016) 27:482–94. doi: 10.1681/ASN.2014111107
8. Makhammajanov Z, Gaipov A, Myngbay A, Bukasov R, Aljofan M, Kanbay M. Tubular toxicity of proteinuria and the progression of chronic kidney disease. Nephrol Dial Transpl. (2024) 39:589–99. doi: 10.1093/ndt/gfad215
9. Russo LM, Sandoval RM, McKee M, Osicka TM, Collins AB, Brown D, et al. The normal kidney filters nephrotic levels of albumin retrieved by proximal tubule cells: retrieval is disrupted in nephrotic states. Kidney Int. (2007) 71:504–13. doi: 10.1038/sj.ki.5002041
10. Arafah MM. Proteinuria level and associated changes in glomerular podocytes and renal tubular epithelium. Int J Pathol Clin Res. (2019) 5:1–11. doi: 10.23937/2469-5807/1510088
11. Tojo A. Mechanism underlying selective albuminuria in minimal change nephrotic syndrome. Int J Nephrol. (2019) 2019:5859102. doi: 10.1155/2019/5859102
12. Kobayashi N, Suzuki Y, Tsuge T, Okumura K, Ra C, Tomino Y. FcRn-mediated transcytosis of immunoglobulin G in human renal proximal tubular epithelial cells. Am J Physiol Renal Physiol. (2002) 282:F358–65. doi: 10.1152/ajprenal.0164.2001
13. Nolin AC, Mulhern RM, Panchenko MV, Pisarek-Horowitz A, Wang Z, et al. Proteinuria causes dysfunctional autophagy in the proximal tubule. Am J Physiol Renal Physiol. (2016) 311:F1271–9. doi: 10.1152/ajprenal.00125.2016
14. West BL, Picken MM, Leehey DJ. Albuminuria in acute tubular necrosis. Nephrol Dial Transpl. (2006) 21:2953–6. doi: 10.1093/ndt/gfl197
15. Bertani T, Cutillo F, Zoja C, Broggini M, Remuzzi G. Tubulo-interstitial lesions mediate renal damage in adriamycin glomerulopathy. Kidney Int. (1986) 30:488–96. doi: 10.1038/ki.1986.212
16. Bertani T, Zoja C, Abbate M, Rossini M, Remuzzi G. Age-related nephropathy and proteinuria in rats with intact kidneys exposed to diets with different protein content. Lab Invest. (1989) 60:196–204.
17. Moriya T, Yamagishi T, Yoshida Y, Matsubara M, Ouchi M. Arteriolar hyalinosis is related to rapid GFR decline and long-standing GFR changes observed on renal biopsies in normo-microalbuminuric type 2 diabetic patients. J Diabetes Complications. (2021) 35:107847. doi: 10.1016/j.jdiacomp.2021.107847
Keywords: proteinuria, renal pathology, immunofluorescence, proximal tubular epithelial cells, resorption droplets
Citation: Chow MBCY, Yildiz V, Biederman L, Dasgupta A, Satoskar AA, Chow A, Nadasdy T and Brodsky SV (2024) Proteinuria and proximal tubular epithelial cells: correlation between immunofluorescence, histology, and degree of proteinuria. Front. Nephrol. 4:1469388. doi: 10.3389/fneph.2024.1469388
Received: 23 July 2024; Accepted: 08 October 2024;
Published: 31 October 2024.
Edited by:
Carlo Alfieri, University of Milan, ItalyReviewed by:
Patrick Cunningham, The University of Chicago, United StatesHao Du, UCONN Health, United States
Matteo Abinti, University of Milan, Italy
Copyright © 2024 Chow, Yildiz, Biederman, Dasgupta, Satoskar, Chow, Nadasdy and Brodsky. This is an open-access article distributed under the terms of the Creative Commons Attribution License (CC BY). The use, distribution or reproduction in other forums is permitted, provided the original author(s) and the copyright owner(s) are credited and that the original publication in this journal is cited, in accordance with accepted academic practice. No use, distribution or reproduction is permitted which does not comply with these terms.
*Correspondence: Sergey V. Brodsky, c2VyZ2V5LmJyb2Rza3lAb3N1bWMuZWR1
 Maria Bernadette CY Chow
 Vedat Yildiz
 Laura Biederman
 Alana Dasgupta
 Anjali A. Satoskar
 Aaron Chow1
 Tibor Nadasdy
 Sergey V. Brodsky