


95% of researchers rate our articles as excellent or good
Learn more about the work of our research integrity team to safeguard the quality of each article we publish.
Find out more
HYPOTHESIS AND THEORY article
Front. Neuroenergetics , 27 September 2010
Volume 2 - 2010 | https://doi.org/10.3389/fnene.2010.00130
This article is part of the Research Topic Neurovascular imaging View all 25 articles
The current understanding of fMRI, regarding its vascular origins, is based on numerous assumptions and theoretical modeling, but little experimental validation exists to support or challenge these models. The known functional properties of cerebral vasculature are limited mainly to the large pial surface and the small capillary level vessels. However, a significant lack of knowledge exists regarding the cluster of intermediate-sized vessels, mainly the intracortical, connecting these two groups of vessels and where, arguably, key blood flow regulation takes place. In recent years, advances in MR technology and methodology have enabled the probing of the brain, both structurally and functionally, at resolutions and coverage not previously attainable. Functional MRI has been utilized to map functional units down to the levels of cortical columns and lamina. These capabilities open new possibilities for investigating neurovascular coupling and testing hypotheses regarding fundamental cerebral organization. Here, we summarize recent cutting-edge MR applications for studying neurovascular and functional imaging, both in humans as well as in animal models. In light of the described imaging capabilities, we put forward a theory in which a cortical column, an ensemble of neurons involved in a particular neuronal computation is spatially correlated with a specific vascular unit, i.e., a cluster of an emerging principle vein surrounded by a set of diving arteries. If indeed such a correlation between functional (neuronal) and structural (vascular) units exist as a fundamental intrinsic cortical feature, one could conceivably delineate functional domains in cortical areas that are not known or have not been identified.
All hemodynamic mapping techniques are bound by the underlying vascular network. Functional brain imaging techniques such as functional MRI (fMRI) and optical imaging of intrinsic signals rely on the apparent close coupling between neuronal activity and local changes (typically increases) in blood supply (Roy and Sherrington, 1890). Numerous studies have focused on the relationship between neuronal activity and the mechanisms of local blood flow modulation (e.g., Logothetis et al., 2001; Kim et al., 2004). The ultimate spatial resolution of any hemodynamic-based functional mapping technique will rely on the morphology of the underlying vasculature supplying the region and on the controlling mechanisms regulating the flow to the region. The first direct evidence to support such correlation between neuronal activity (as determined by hemodynamic mapping signals) and the fine vascular system was provided by Harrison et al. (2002). In combined optical imaging and corrosion cast preparation in the auditory cortex, it was demonstrated that intrinsic optical signals were spatially associated with a specific capillary bed. However, because optical imaging is recording signals from the cortical surface, the measured signals are a 2-D representation of a 3-D vascular network system, including non-specific surface vessels.
In general terms, the cortical vasculature system can be described by three basic elements: arteries, veins and the fine vascular network, i.e., the capillary bed. A large body of literature exists describing the morphology and functionality of the pial vessels, mainly using optical methods on the exposed cortical surface. At the other end of the vascular tree, the capillary level, there are ample studies exploring their structural nature using a large arsenal of histochemical approaches. Only recently have the functional properties of the capillaries been investigated, using focal and with limited field-of-view (FOV) optical techniques such as Two-Photon imaging (Kleinfeld et al., 1998; Schaffer et al., 2006). Connecting these two groups is a cluster of intracortical vessels, which branch off from large cortical surface vessels, penetrate the cortex at approximately right angles, and extend down to the capillary level deep within the tissue. However, data describing their morphology is limited, and their functional properties are largely a mystery. This is mainly due to technical limitations of accessing these vessels; the intracortical vessels, as their name implies, are embedded within the tissue. While relatively little is known about them, their strategic positioning within the cortical tissue may play a significant role in blood flow regulation at the sub-millimeter scale – the level of fundamental functional units – the cortical columns (Lorente de No, 1938; Mountcastle, 1957).
Furthermore, the current understanding of the vascular origins of the blood oxygenation level dependent (BOLD) mechanism, the most commonly used fMRI contrast, is based on theoretical modeling and assumptions (Boas et al., 2008); little experimental validation exists to support or challenge such models with regard to its vascular origin (Turner, 2002). Therefore, a better understanding of the vascular system and its spatial correlation with the hemodynamic mapping signal is desperately needed. With the goal of understanding blood flow regulation at the columnar level, we focus our research efforts on these intracortical-level vessels.
In the literature, the intracortical vessels are usually divided into six main groups, following the Duvernoy classification (Duvernoy et al., 1981). Group 1 is composed of vessels which reach layer I (neuronal layer). Group 2 reaches the superficial parts of the pyramidal layers (III). Vessels in group 3 are the most numerous; they penetrate as far down as layer IV, which is also the most heavily vascularized. Group 4 reaches the uniform layer and inner limit of subcortical white matter. Group 5 is comprised of arteries and veins that pass through and vascularize the cortex as well as the adjacent white matter. Group 6 is a special group of arteries including large arteries, which pass through the gray matter without branching and only vascularize the white matter.
The cortical drainage has a surprisingly regular organization (Duvernoy, 1999). The diameters of intracortical veins are, to some extent, less available in the literature than their arterial counterpart. Fixation and embedding the tissue often deform the veins, therefore, diameter measurements taken after sectioning are often lower then those obtained with vascular casting (Roggendorf et al., 1978). The principle intracortical vein (V5) has a diameter of 120–125 μm, where groups 4 (V4), 3 (V3), and 2 (V2) have an average diameter of 65, 45, and 30 μm, respectively (Duvernoy et al., 1981).
Similar to the venous system, the intracortical arteries can be classified into six groups. However, arteries of groups 2 and 3 are by far the most numerous, presumably because these vessels mainly supply the granular layers with the highest metabolic activity. These are followed by arteries in group 4 and then 5 (Duvernoy et al., 1981). Arteries in group 6 are found in relatively low numbers, and those in group 1 are found even less frequently. Arteries, in general, have smaller diameters than their venous counterpart. Arteries in group 6 have a large variability in diameter, ranging from 50 to 240 μm. Arteries of group 5 range from 30 to 75 μm and arteries in groups 2, 3, and 4 have vessels diameters of 15–25, 15–30, and 30–40 μm, respectively (Duvernoy et al., 1981). Within gray matter, capillaries of 3–5 μm diameter (Tieman et al., 2004) and mean length 200 μm drain into venules of 10–20 μm in diameter. In the tangential plane, there are differences in the vascular density according to the cortical layers (Duvernoy et al., 1981; Tieman et al., 2004). Higher capillary density is usually found across the middle layers (layers III/IV). Interestingly, a better correlation was reported between the vascular density and the number of synapses, not the number of neurons (Wolff, 1976).
As described above, our current knowledge of the intracortical vessels are mainly coming from human post-mortem (Duvernoy et al., 1981; Duvernoy, 1991; Reina-De La Torre et al., 1998; Lauwers et al., 2008) or ex vivo animals (Woolsey et al., 1996; Harrison et al., 2002) studies. The majority of columnar (Kim et al., 2000; Duong et al., 2001; Zhao et al., 2005) and laminar (Harel et al., 2002; Silva and Koretsky, 2002; Goense and Logothetis, 2006; Harel et al., 2006; Zhao et al., 2006) fMRI studies are currently done in rats, cats and monkeys, where little is known about the intracortical vessels in these species. More specifically, in the cat model, which is being used extensively in electrophysiology, optical imaging, and fMRI studies for understanding neurovascular coupling (Malonek and Grinvald, 1996; Malonek et al., 1997; Thompson et al., 2003), the literature describing these vessels is generally inadequate or non-existent. Thus, since fMRI is currently the chief investigation tool that can resolve hemodynamic changes transversely across the cortical tissue and without depth limitation, it is crucial to relate the fMRI signal changes with the underlying vascular morphology with the goal of a better understanding of blood flow regulation, which may in turn results in tools for improving the spatial specificity of human brain mapping.
Here, we describe recent advances in MRI methodology that allows for imaging of the intracortical vessels in vivo, at resolutions approaching the macroscopic level. In addition, we describe recent developments in high-resolution fMRI studies in humans that successfully resolved cortical columns.
Utilizing the advantages of high magnetic field (9.4 T) high-resolution 3D gradient echo images were acquired in the cat visual cortex (Figure 1). Using a combination of endogenous BOLD contrast, an exogenous iron-oxide contrast agent and time-of-flight (TOF) micro-angiography we developed an imaging scheme that provided highly detailed image volume with high specificity for distinguishing between arteries and veins within the cortex (see below). The acquisition parameters included: TR/TE = 32.4/5.5 ms, FOV 20 mm × 20 mm × 5 mm, matrix 256 × 256 × 32. The images were reconstructed by windowing with a symmetric Tukey window affecting 20% of pixels on each edge of k-space, zero-filling to twice the native acquisition matrix and Fourier transforming, producing a reconstructed resolution of 39 μm × 39 μm × 78 μm (for more details Bolan et al., 2006).
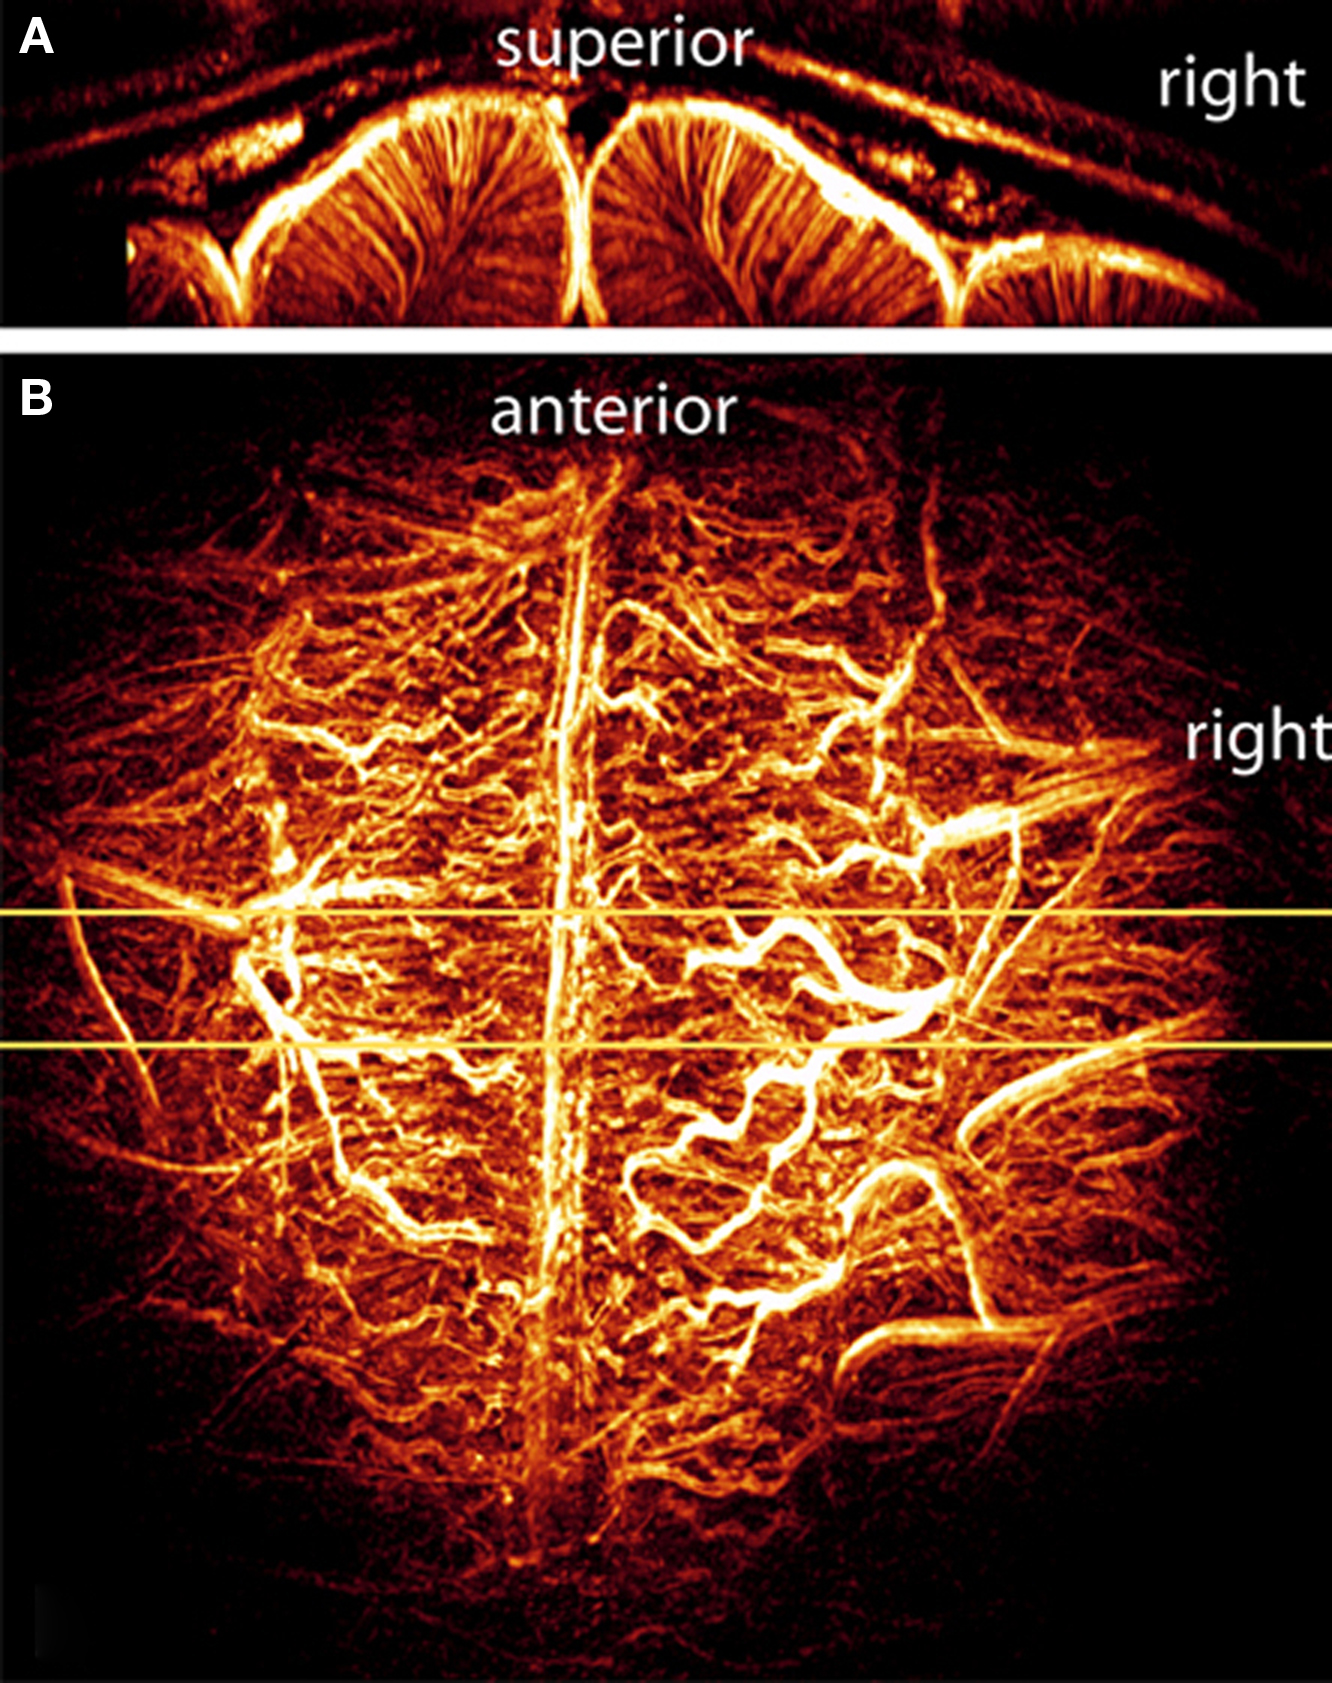
Figure 1. Maximum intensity projections (MIPs) of the 3D volume of a cat brain viewed in (A) coronal and (B) axial orientations. The axial projection (B) was performed over the full acquisition volume, whereas the coronal projection (A) was produced from a narrow slab indicated by the yellow lines in (B). The coronal view clearly shows the uniform organization of intracortical vessels. The axial view is dominated by the vessels on the pial surface. Figure modified from Bolan et al. (2006).
To further enhance the sensitivity to the microvasculature, a bolus administration of monocrystalline iron oxide (MION), an exogenous contrast agent, was used to delineate smaller cortical vessels that are not visible under normal imaging conditions. MION is an intravascular iron-oxide based contrast agent. It is superparamagnetic with a very high R2 relaxivity which remains in the intravascular space (particle size 22 nm) and has a long blood half-life (Shen et al., 1993). When used in high concentrations, as shown here, the increased intravascular T2 relaxation dominates the signals, causing both arteries and veins to appear dark in gradient echo images (Park et al., 2008). Figure 1 demonstrates a reconstruction method used to visualize, in great details, the entire vascular network that can be resolved under the current acquisition resolution. An example of a 3-D image using maximum intensity projection (MIP), commonly employed for visualizing MR angiographic data, is shown. The projections were created directly from the volumetric image with no manual modifications. The axial projection (Figure 1B) was performed over the full acquisition volume, whereas the coronal projection (Figure 1A) was produced from a narrow slab indicated by the yellow lines in (b). These images, particularly the coronal view (Figure 1A), give a good overview of the relatively larger surface vasculature and more intriguing, a view of the intracortical vascular architecture.
Most distinctive are the vessels that penetrate into the cortical tissue, i.e., gray matter, nearly perpendicular to the pial surface, and run down to the white matter and beyond. Furthermore, this data is a clear example, and to some extent, a validation of our earlier findings of the largest BOLD signal changes observed at, or adjacent to, the large surface vessels (Harel et al., 2006). Additionally, the coronal view (Figure 1A) shows the uniformity and orderly organization of the intracortical vessels found in the cat visual cortex (Bolan et al., 2006).
The technique of 3D TOF micro-angiography is used to generate images of the arteries and is demonstrated in Figure 2. In the exact setup as the images shown in Figure 1, a transverse slab (thickness 2 mm) was positioned in the center of the cortex, so that the superior edge of the slice passed through the sagittal sinus (Figure 2A). The vertical position of the slice is critical for producing proper flow weighting in the intracortical arteries running perpendicular to the cortical surface. The flip angle (30°) is greater than the Ernst angle for both blood and cortical gray matter so the spins inside the slice are saturated and show low signal. Blood that flows into the slice is not saturated, and therefore gives a higher signal than blood that has remained inside the slice for one or more excitations. This effect is called the TOF or inflow effect. In Figure 2A, the red arrows show an example of a bright vessel in both views. Other bright vessels are evident, particularly in the axial view in which most of the larger intracortical vessels are oriented perpendicular to the image plane. Blue arrows point to veins which are dark due to the BOLD effect (Figure 2A). Thus, Figure 2 demonstrates the ability to first, image the intracortical vessels and second, differentiate and show a clear separation of arteries and veins within the image volume across (tangential) the tissue. Figure 2B displays a vessel classification map, a single axial slice across primary visual cortex of the cat in which intracortical visible vessels were classified as vein or artery, using the TOF and BOLD effect method as described above. A large number of vessels can be identified in a single slice, as shown in Figure 2A. By combining several imaging schemes, namely susceptibility-weighted and TOF images, along with 3D image-processing and display methods, we have developed a technique by which we can identify and classify the intracortical vessels as veins or arteries in vivo.
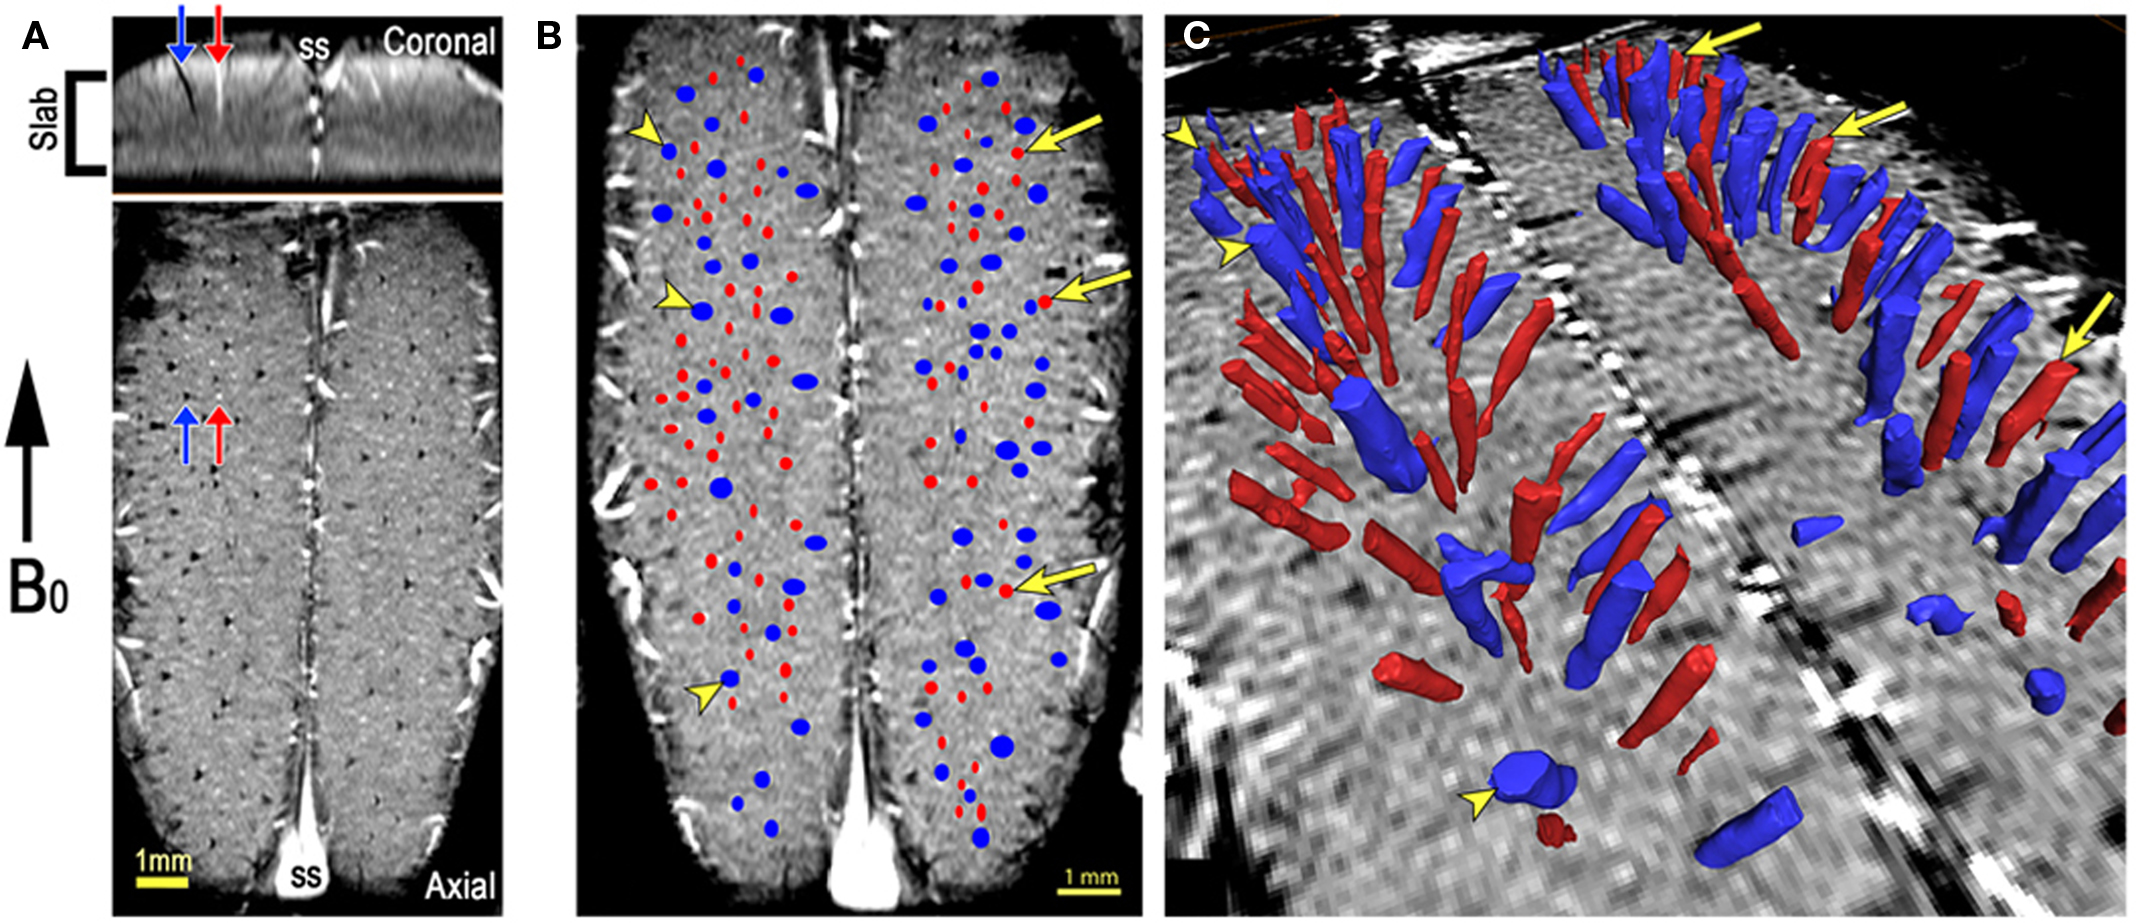
Figure 2. Vascular model of cat visual cortex. (A) An example of 3D time-of-flight (TOF) microangiography in the cat visual cortex. The axial excitation slab (Slab) was positioned so that its superior edge passed through the sagittal sinus (SS), as can be seen in the coronal view. Arteries, indicated by red arrows, are bright due to unsaturated blood flowing into the slab. Veins, indicated by blue arrows, are dark due to their elevated concentration of deoxyhemoglobin (the BOLD effect). (B) A dorsal view close up showing in greater details vessels classifications using the TOF and BOLD techniques; Veins: blue, Arteries: red. (C) 3D surface rendering of the vessels identified throughout the entire imaged volume. Figure modified from Bolan et al. (2006).
With the full 3D information, the extent of each vessel’s penetration into the cortex can be determined as is shown by the 3D surface rendering of the vessels (Figure 2C). Vessels can then be classified using the method of Duvernoy et al. (1981). It appears that the majority of the arteries visible in these images are of classes A4 and A5, meaning they extend into the deep cortical layers (A4) or continue into the underlying white matter (A5). The veins also vary in their penetration, and fall into the classes V4 and V5 of Duvernoy et al. (1981). The smallest vessels that are reliably detectable with this imaging method, the A4 arteries, are reported to have diameters of 30–40 μm in human subjects (Duvernoy et al., 1981). Smaller vessels (A1-3, V1-3) are visible in the post-MION images, but are not clearly identifiable in the flow-weighted images. Based on this reasoning, the majority of the penetrating vessels seen in these images probably have diameters in the 50–100 μm range.
It is obvious from the data that the distribution of arteries and veins is not completely random. The largest veins oriented perpendicular to the cortical surface are the principle intracortical veins. These are spaced 1–1.5 mm apart, and are surrounded by a network of smaller veins and arteries oriented in the same direction (Bolan et al., 2006). This morphological organization is consistent with previous ex vivo studies in cats (McHedlishvili and Kuridze, 1984) and humans (Duvernoy et al., 1981) and is in agreement with the “vascular unit” as was suggested by Duvernoy’s model. Thus, the data shown here suggests an orderly structure of the vascular system found in the cat cortex; Furthermore, they demonstrate the capabilities of high-field MRI to identify and resolve these small vascular features in vivo.
In several cats we obtained functional MR images signals from the primary visual cortex following a visual stimulation task. Eight slices with image resolution of 250 μm × 250 μm × 500 μm were acquired. The functional maps were confined to primary visual cortex and followed the expected pattern of activation (Harel et al., 2002, 2006; Zhao et al., 2004). Figure 3A shows a BOLD functional map for a single axial slice across primary visual cortex (area 18); in addition, a 3-D surface rendering of the vessels (similar to Figure 2C) is displayed (Figure 3B). Several interesting features are evident from the data: first, the pattern of the stimulus-induced MR signal changes in the transverse plane had a patchy appearance and was found to be non-uniform across the cortex. As expected from theoretical and modeling studies, it appears that the regions with larger BOLD changes are associated with regions of large principal veins (blue). More intriguingly, these patterns of activations changed as a function of distance from the surface (i.e., deeper into the gray matter) implying the involvement of different vascular compartments (Harel et al., 2006). These features are more evident when the fMRI signal changes are plotted as iso-amplitude contour lines and are combined with the vascular model as shown in Figure 3B. These preliminary experimental data demonstrate the feasibility of potentially detecting stimulus-induced blood flow changes at extreme high-resolutions and throughout the gray matter volume. Furthermore, these signal changes can now be spatially correlated with the underlying vascular system, relating these blood flow changes to a specific subset of the vascular units within the imaged volume.
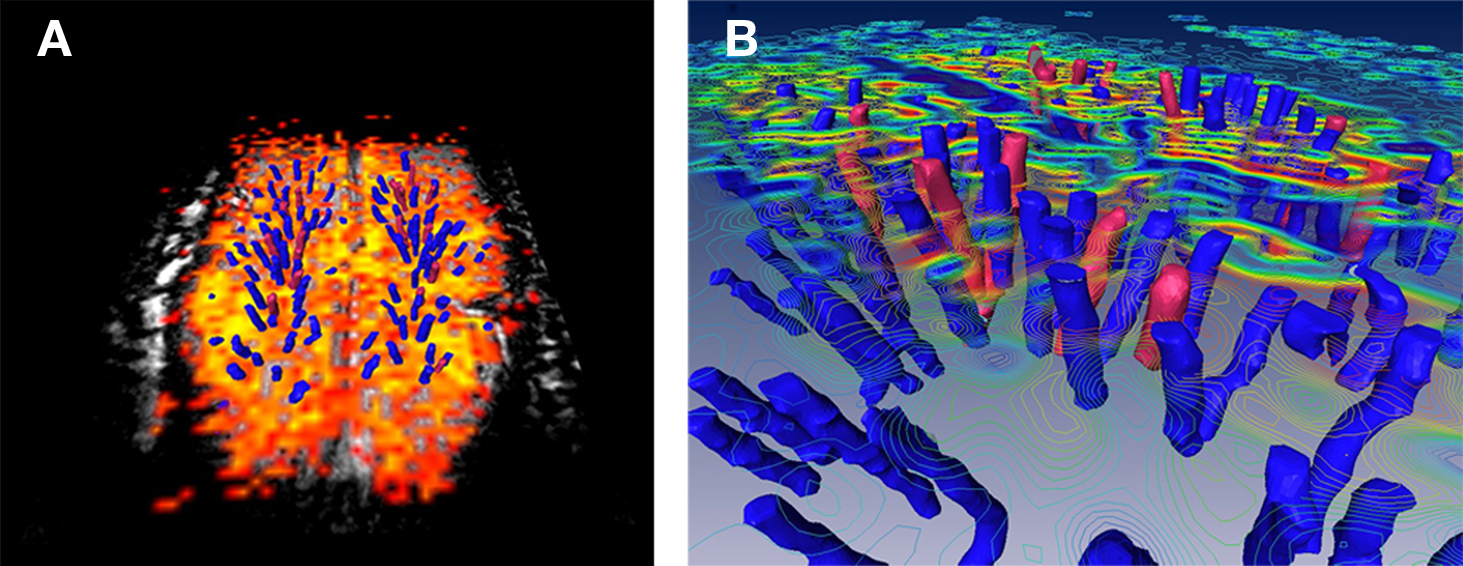
Figure 3. Co-registration of fMRI maps with the underlying vascular model. (A) A representative axial slice across marginal gyrus in the cat primary visual cortex. Orange-to-yellow colors represent voxels that exhibit BOLD signal changes that was correlated with the stimulus paradigm. (B) 3D surface rendering of the veins and arteries (blue and red, respectively) within the imaged volume overlaid with iso-amplitude contour lines of the BOLD signals changes.
Capitalizing on the advantages of high magnetic fields systems, which offers increases in both the sensitivity as well as the specificity of MR detectable functional signals, the spatial and temporal resolutions of fMRI studies continue to be pushed allowing mapping of smaller and smaller functional properties of cerebral cortex.
A fundamental property of the cerebral cortex is the spatial localization of function. Within a defined cortical region, neurons sharing similar functional properties are often clustered together spanning from the pial surface to the white matter, thus forming a column-like functional unit. Initially, Mountcastle (1957) described the columnar organization of the somatic sensory cortex, which was followed by the work of Hubel and Wiesel (1962, 1965), who mapped the columnar organization of the visual cortex. This functional parcellation extends in the millimeter to sub-millimeter domain. In visual cortex, preference to right or left eye (ocular dominance), direction of motion (Weliky et al., 1996), spatial frequency (Issa et al., 2000), and orientation (Hubel and Wiesel, 1963, 1977; Blasdel and Salama, 1986; Bonhoeffer and Grinvald, 1991) have all been characterized in animals. In humans, the first example of such functional domains to be identified was ocular dominance columns (ODCs). Initially, they were observed using anatomical staining techniques in the post-mortem human brain (Horton and Hedley-Whyte, 1984) followed by functional delineation with fMRI (Menon et al., 1997; Dechent and Frahm, 2000; Cheng et al., 2001; Yacoub et al., 2007). They were found to be about 1 mm in width organized in a periodic layout in primary visual cortex. However, the unique anatomical connections from the lateral geniculate nucleus up to the cortex that give rise to this unique feature do not exist for other columnar ensembles. Sun et al. (2007) recently have reported on the delineation of much larger temporal frequency domains in human visual cortex.
From years of invasive animal studies, orientation columns in visual cortex are perhaps the best-known example of such a functional organization in the brain. Building on the accomplishments of a long series of theoretical and experimental studies on the underlying mechanisms of fMRI contrast, combined with extensive validation studies using animal models (Fukuda et al., 2006; Harel et al., 2006), our group has recently demonstrated the feasible to map columnar structures in the human brain (Yacoub et al., 2007, 2008) (Figure 4). Studies were conducted at 7T using slab selective FOV reduction for spin-echo fMRI (Duong et al., 2003), which was found to have better spatial specificity (Harel et al., 2006). The spatial resolution was: 0.5 mm × 0.5 mm× 3 mm with minimal resolution loss due to EPI blurring along the phase encode direction. TR/TE = 6000/50 ms. To minimize motion effects, subjects used a bite bar. Subjects initially participated in ODC studies (Yacoub et al., 2007) and were brought back to map orientation specific regions using the same anatomical slice.
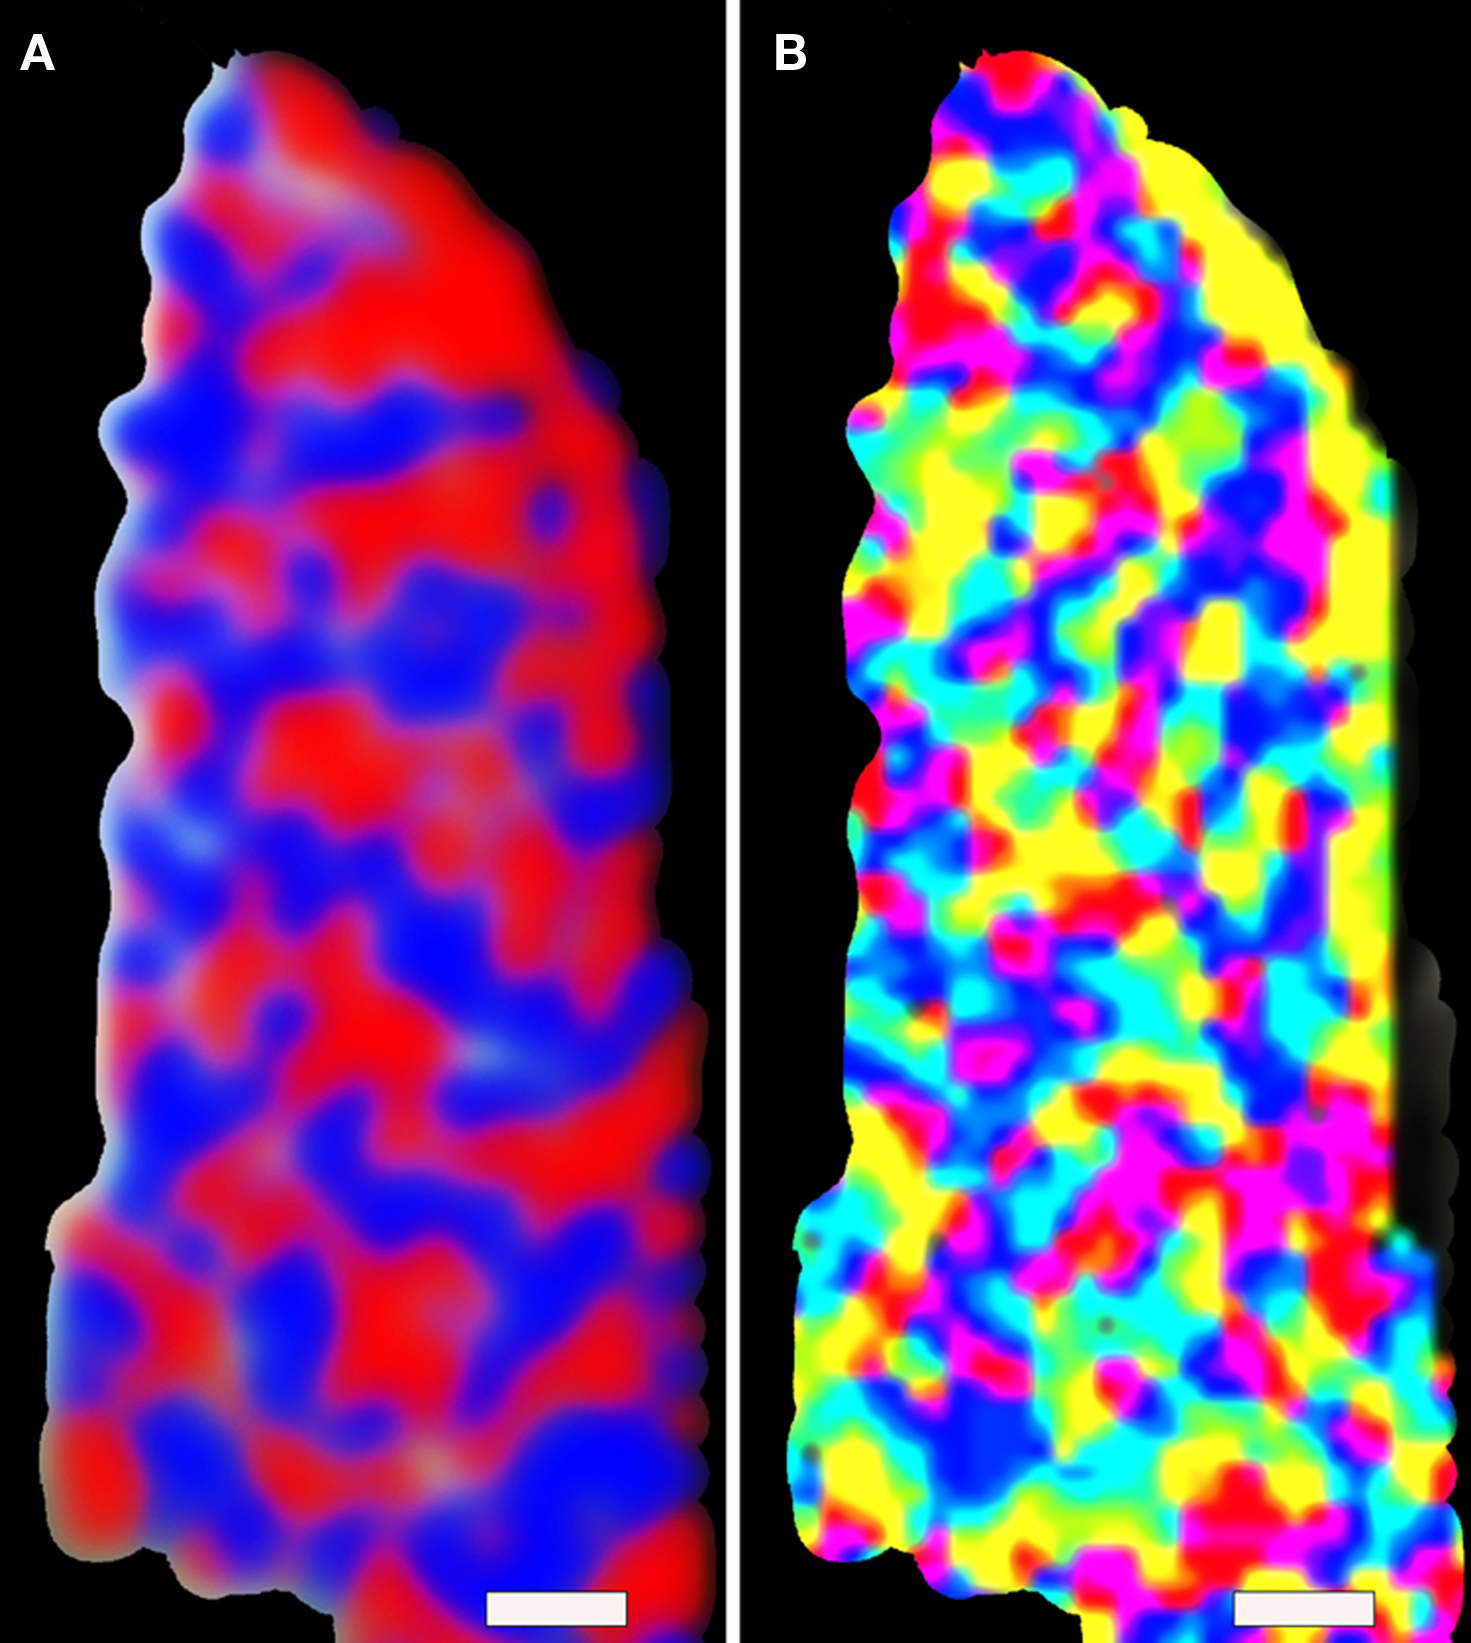
Figure 4. Functional MRI reveals cortical columns in human. An example of ocular dominance (A) and orientation (B) columns fMRI maps obtain in human at 7 T magnet. The red and blue colors in (A) indicate preferences to right or left eye stimulation, whereas the color distribution in (B) represents a given voxel’s preferred stimulus orientation. (Scale bar: 1.0 mm) Figure modified from Yacoub et al. (2008).
Striking similarities were found with the known spatial features and spatial relationships between ODC and orientation columns, as was previously described in monkeys and cat studies using the optical imaging method (Bartfeld and Grinvald, 1992; Blasdel, 1992; Hubener et al., 1997; Shoham et al., 1997). These results demonstrate the ability and maturity of high-field MRI to resolve functional units (cortical columns) in humans (Yacoub et al., 2008), features that were previously shown only via invasive approaches in animal studies.
While this achievement was a substantial leap in human fMRI studies, the methodological aspect was not ideal. Due to technical limitations, all the high-resolution, sub-millimeter fMRI studies were limited to single-slice acquisitions and small FOVs, thus the functional maps are a 2-D representation of a complex 3-D brain structure. The use of a single slice requires an “optimal” slice prescription carefully chosen based on a flat imaged plane with minimal curvature of gray matter, ultimately limiting the general application of these methods to pre-screened subjects. Furthermore, with this limited imaging volume, slight motion by the subject is detrimental, as post-processing motion correction algorithms are very limited under these conditions.
Although advantageous due to increases in spatial specificity and functional sensitivity, high magnetic fields have historically been limited because of short relaxation times (T2*), increased susceptibility artifacts, RF power limits, and non-uniform excitation fields. Thus, the advantages of high fields have been restricted to localized areas in the brain where these problems can be minimized, resulting in highly specific and sensitive fMRI maps. To overcome these limitations, new and more efficient pulse sequences are being developed that will allow mapping these functional domains in 3-D space and over larger volumes, while still maintaining sub-millimeter resolutions (Feinberg et al., 2008). In addition, capitalizing on the advances of gradient hardware, parallel imaging methodology and RF technology, highly accelerated acquisitions (up to 16-fold) (Moeller et al., 2010) have allow for high-resolution imaging of the whole brain on the order of 1 s (see Figure 5) with excellent image SNR and minimal distortions. These new developments to expand the benefits and utility of high field fMRI open the possibility to investigate and probe cortical organization and dynamics at spatial and temporal resolutions over large volumes that are not available by any other imaging technique.
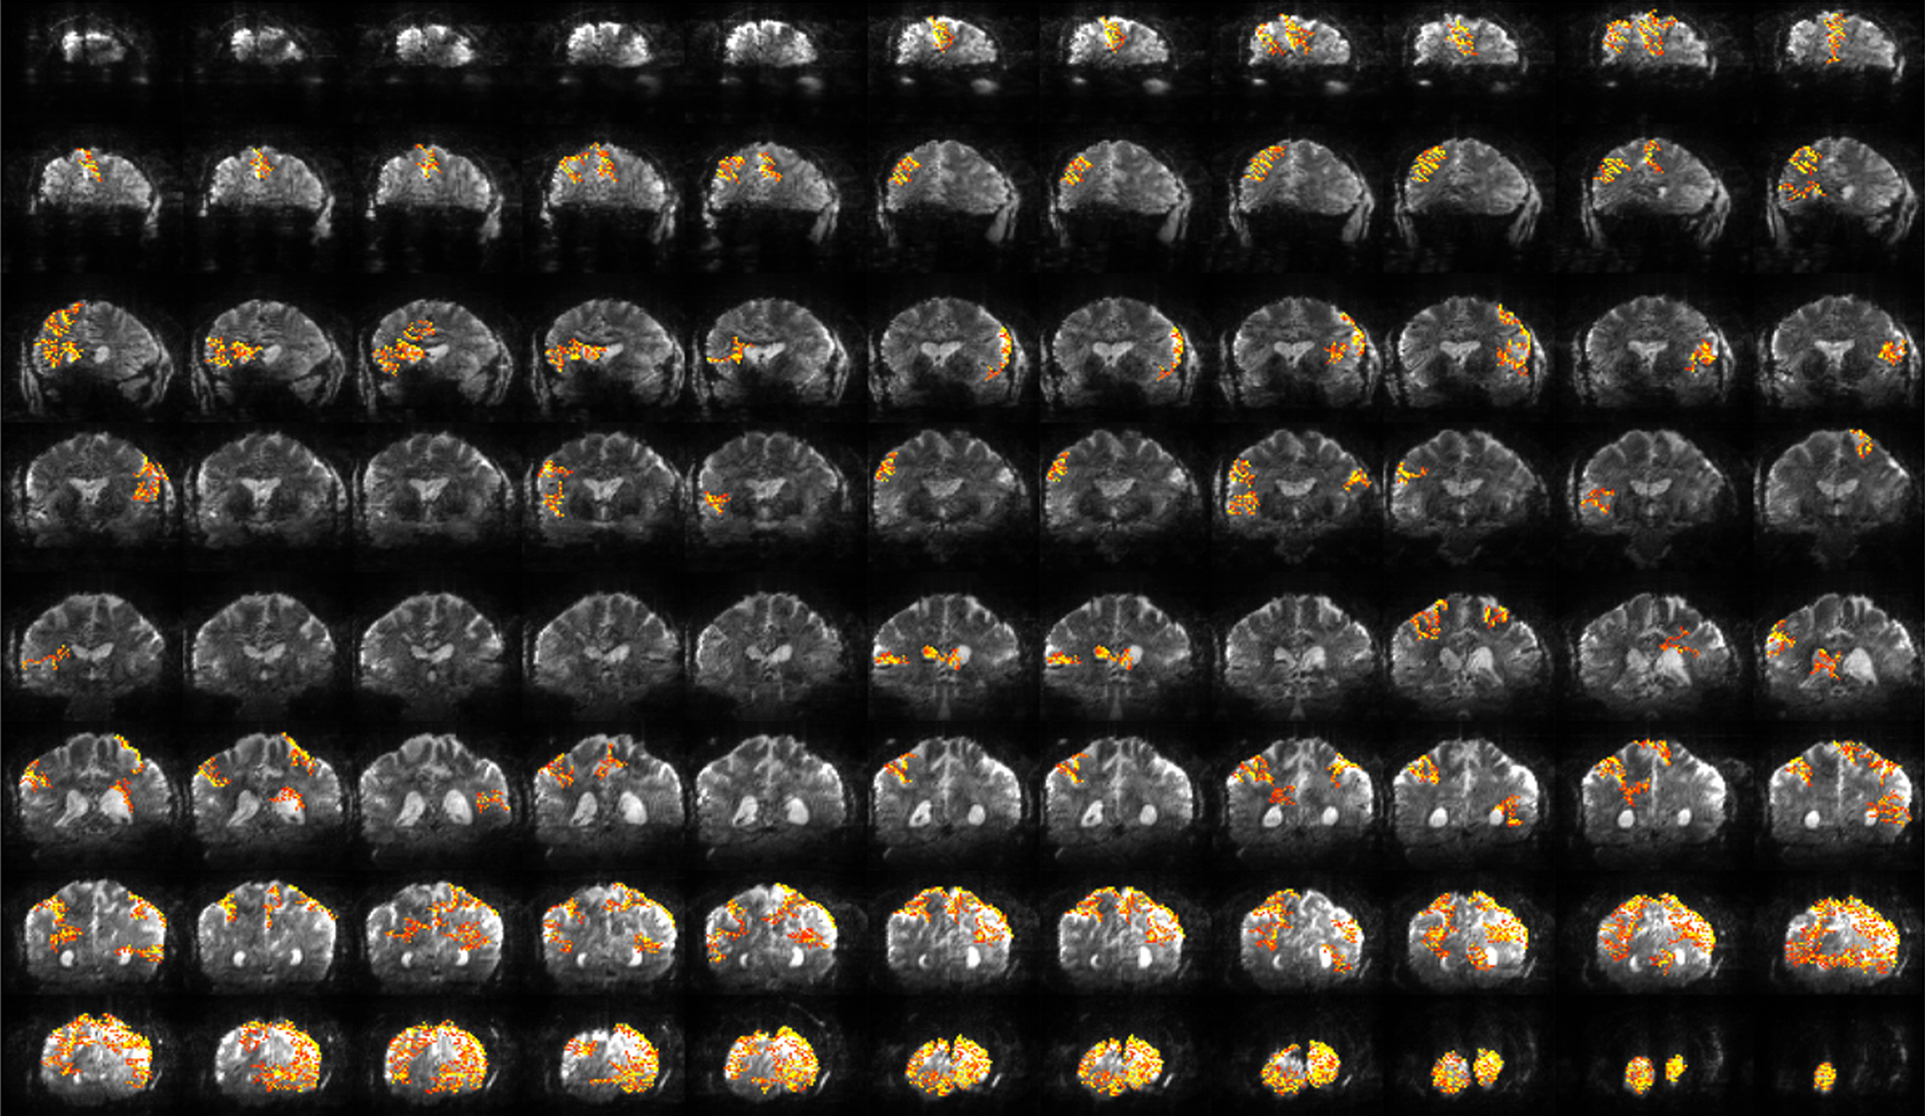
Figure 5. Whole brain fMRI at high resolution. Functional activation maps for a complex visuomotor dissociation task acquired for 88 slices in 1.25 s with 2 mm × 2 mm × 2 mm resolution. Inset: representative coronal slices from a functional scan with 1 mm × 1 mm × 2 mm resolution. Figure modified from Moeller et al. (2010).
Building on the advantages of high-field MRI, we have demonstrated the feasibility to image and classify cortical vasculature, in vivo, at resolutions approaching the microscopic scale. A vascular model describing the intracortical arterial and venous components was reconstructed and their spatial organization across the cortex was described. From a functional perspective, high-resolution fMRI, at high fields (7 and 9.4 T), allows non-invasive mapping of functional domains down to columnar and laminar levels of cortical organization. New imaging capabilities that allow sub-millimeter mapping of 3D functional units with a larger field of view that approaching whole-brain coverage, are currently being developed by several groups.
Building on these new imaging capabilities demonstrated above, one could explore features of cerebral cortex in several planes. On the neurophysiology/neurovascular research standpoint, the in vivo derived vascular model should provide a better understanding of the vascular morphology and its spatial dependency regarding the fMRI contrast mechanism. Such new insights should allow for refinements and improvements of the imaging techniques that hopefully will allow better spatial localization and spatial specificity of the fMRI signals to the site of neuronal activity. Clinical applications such as neurosurgery planning, epilepsy, and brain tumor resections will all benefit from increased accuracy.
Historically, our knowledge of brain function was based solely on anatomical and lesions studies. When Mountcastle (1957) first described the columnar organization of the somatic sensory cortex on the basis of observations made in single neuron recording experiments, his report was met with disbelief by many neuroanatomists (Mountcastle, 1997). This was because the histological methods available at the time revealed no structural counterpart to match the physiological observations (Mountcastle, 1997, 2003). Since Mountcastle’s discovery, followed by many others over the years, cortical columns have been accepted as the basic computational/functional unit of the cortex.
In the whisker barrel cortex of the rat, there is a clear association between the functional unit, in this case the barrel, and the vascular system that supplies and drains the blood with the notion that it optimizes the local interactions between the two (Woolsey et al., 1996). Woolsey summarized his finding as followed: “Matching a functional grouping of neurons with a vascular module is an elegant means of reducing the risk of embarrassment for energy-expensive neuronal activity (ion pumping) while minimizing energy spent for delivery of the energy (cardiac output)” (Woolsey et al., 1996). If Woolsey’s theory of the barrel-vascular unit is indeed correct, one should expect to find similar global arrangements, following the same logic across the entire cerebral cortex. Furthermore, it has been shown, using a rat model and chronic hypoxia that plasticity of cortical capillary density can occur on a time scale of several weeks (LaManna et al., 1992, 2004). Also, a high correlation between the distribution of the vascular density with the cytochrome oxidase blobs was found in the monkey primary visual cortex (Zheng et al., 1991). Therefore, if the vascular system has the capacity to adapt to demand, it is highly likely that there will be strong correlations between functional units, i.e., the neurons, and vascularity.
In post-mortem studies in humans a regular organization of vessels within the cortex, which was found to have a circular nature has been reported (Duvernoy et al., 1981); a principal vein (V5) or several smaller veins (V4 or V3) surrounded by an arterial ring containing a larger number (x4) of arteries (see Figure 6). Also, there appears to be a relatively uniform distribution of these principle veins (V5) spaced every 0.75–1 mm (Wolff, 1976). Thus, it has been suggested that such vascular organization may manifest as a “vascular unit.” Could these vascular units be the equivalent of the vascular units that Woolsey describes in the rat barrel cortex? If so, do they represent a specific functional entity? This “magic” distance in the principal veins, coincidentally or not, is similar to the known sizes and distances between functional cortical columns in visual cortex of cats (Lowel and Singer, 1987; Bonhoeffer and Grinvald, 1993) and humans (Horton et al., 1990; Cheng et al., 2001; Yacoub et al., 2007). Can the spatial arrangement of the vascular system tell us anything about the neuronal properties of the tissue?
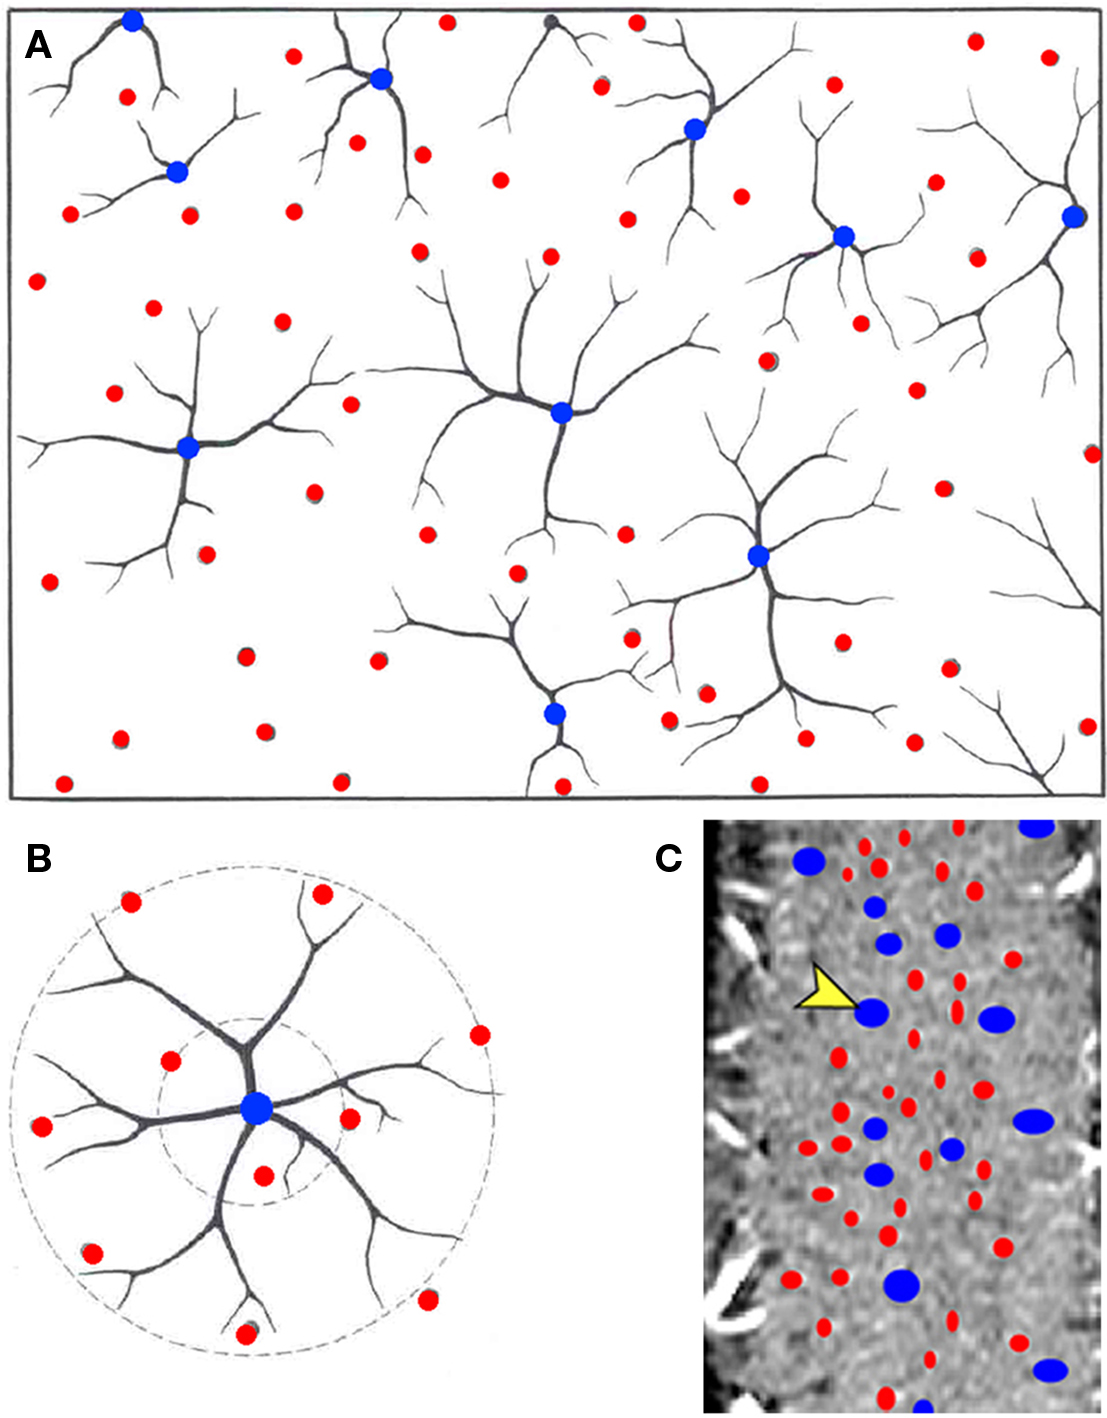
Figure 6. Vascular unit model. A circular nature of the vascular organization. (A) A drawing of a cross-section showing the venous units and their arterial rings. (B) Duvernoy’s proposed spatial organization of the vascular unit; a principle cortical vein (blue) surrounded by several penetrating arteries (red). (C) A vessel classification maps in a tangential section in cat visual cortex derived from the MRI data. A and B were modified from Duvernoy et al. (1981).
We put forward a hypotheses that a cortical column, an ensemble of neurons involved in a particular neuronal computation, is spatially correlated with a specific vascular unit, i.e., a cluster of emerging principal veins surrounded by a set of diving arteries. A “vascular unit” is associated with a known “functional unit” in the cortex. If indeed one can establish a spatial correlation between functional (neuronal) and structural (vascular) units as a basic and fundamental intrinsic cortical feature, this could provide a tool in which one might conceivably delineate functional domains in cortical areas that are not known or have not been identified. For example, columnar structures in V1 are relatively “easy” to resolve using basic stimuli such as eye dominance or drifting bars with altering orientations. However, as one moves to higher visual areas, more complex stimuli are needed to activate functional regions (Tanaka, 1996). Would it be possible in the future to “search” for functional properties based on the vascular layout? Can we use the structural units to foresee the spatial organizations of the functional domains?
Furthermore, what happens in a more “complex” cortical region that processes several computational units? It has been shown in the cat, using optical imaging, that several columnar systems (e.g., ocular dominance, orientation, and spatial frequency) occupy the same cortical tissue. Are each of these functional units associated with their own unique vascular structure? What percent of overlaps exist between units and is there any spatial organization of such overlapping systems?
While these ideas are perhaps hard to comprehend at the present time, the tools and knowledge being developed today will allow us to reach these goals in the future. Perhaps, 1 day, we may even be able to link clinical symptoms of brain disorders (functional properties) with an abnormality of the vascular (structural) unit.
The authors declare that the research was conducted in the absence of any commercial or financial relationships that could be construed as a potential conflict of interest.
This work was supported, in part, by the NIH grants R01EB008645, P41-RR008079, and P30 NS057091. Instrument acquisition was in part funded by the Keck Foundation. This work was carried out in part using computing resources at the University of Minnesota Supercomputing Institute.
Bartfeld, E., and Grinvald, A. (1992). Relationships between orientation-preference pinwheels, cytochrome oxidase blobs, and ocular-dominance columns in primate striate cortex. Proc. Natl. Acad. Sci. U.S.A. 89, 11905–11909.
Blasdel, G. G. (1992). Differential imaging of ocular dominance and orientation selectivity in monkey striate cortex. J. Neurosci. 12, 3115–3138.
Blasdel, G. G., and Salama, G. (1986). Voltage-sensitive dyes reveal a modular organization in monkey striate cortex. Nature 321, 579–585.
Boas, D. A., Jones, S. R., Devor, A., Huppert, T. J., and Dale, A. M. (2008). A vascular anatomical network model of the spatio-temporal response to brain activation. Neuroimage 40, 1116–1129.
Bolan, P. J., Yacoub, E., Garwood, M., Ugurbil, K., and Harel, N. (2006). In vivo micro-MRI of intracortical neurovasculature. Neuroimage 32, 62–69.
Bonhoeffer, T., and Grinvald, A. (1991). Iso-orientation domains in cat visual cortex are arranged in pinwheel-like patterns. Nature 353, 429–431.
Bonhoeffer, T., and Grinvald, A. (1993). The layout of iso-orientation domains in area 18 of cat visual cortex: optical imaging reveals a pinwheel-like organization. J. Neurosci. 13, 4157–4180.
Cheng, K., Waggoner, R. A., and Tanaka, K. (2001). Human ocular dominance columns as revealed by high-field functional magnetic resonance imaging. Neuron 32, 359–374.
Dechent, P., and Frahm, J. (2000). Direct mapping of ocular dominance columns in human primary visual cortex. Neuroreport 11, 3247–3249.
Duong, T. Q., Kim, D. S., Ugurbil, K., and Kim, S. G. (2001). Localized cerebral blood flow response at submillimeter columnar resolution. Proc. Natl. Acad. Sci. U.S.A. 98, 10904–10909.
Duong, T. Q., Yacoub, E., Adriany, G., Hu, X., Ugurbil, K., and Kim, S. G. (2003). Microvascular BOLD contribution at 4 and 7 T in the human brain: gradient-echo and spin-echo fMRI with suppression of blood effects. Magn. Reson. Med. 49, 1019–1027.
Duvernoy, H. M. (1991). The Human Brain: Surface, Three-Dimensional Sectional Anatomy and MRI. Wien, Austria: Springer-Verlag.
Duvernoy, H. M., Delon, S., and Vannson, J. L. (1981). Cortical blood vessels of the human brain. Brain Res. Bull. 7, 519–579.
Feinberg, D., Harel, N., Ramanna, S., Ugurbil, K., and Yacoub, E. (2008). “Sub-millimeter single-shot 3D GRASE with inner volume selection for T2 weighted fMRI applications at 7 Tesla,” in Proceedings of the 16th Annual Meeting of the International Society for Magnetic Resonance in Medicine, Toronto, Abstract 2373.
Fukuda, M., Moon, C. H., Wang, P., and Kim, S. G. (2006). Mapping iso-orientation columns by contrast agent-enhanced functional magnetic resonance imaging: reproducibility, specificity, and evaluation by optical imaging of intrinsic signal. J. Neurosci. 26, 11821–11832.
Goense, J. B., and Logothetis, N. K. (2006). Laminar specificity in monkey V1 using high-resolution SE-fMRI. Magn. Reson. Imaging 24, 381–392.
Harel, N., Lin, J., Moeller, S., Ugurbil, K., and Yacoub, E. (2006). Combined imaging-histological study of cortical laminar specificity of fMRI signals. Neuroimage 29, 879–887.
Harel, N., Zhao, Z., Wang, P., and Kim, S. G. (2002). “Layer specificity of BOLD & CBV fMRI signals at ultra-high resolution,” in 8th International Conference on Functional Mapping of the Human Brain, Sendai Vol. 16, 1221–1223.
Harrison, R. V., Harel, N., Panesar, J., and Mount, R. J. (2002). Blood capillary distribution correlates with hemodynamic-based functional imaging in cerebral cortex. Cereb. Cortex 12, 225–233.
Horton, J., and Hedley-Whyte, E. T. (1984). Mapping of cytochrome oxidase patches and ocular dominance columns in human visual cortex. Philos. Trans. R. Soc. Lond. Biol. B. 304, 255–272.
Horton, J. C., Dagi, L. R., and McCrane, E. P. (1990). Arrangement of ocular dominance columns in human visual cortex. Arch. Opthalmol. 108, 1025–1031.
Hubel, D., and Wiesel, T. N. (1962). Receptive fields, binocular interaction and functional architecture in the cat’s visual cortex. J. Physiol. (Lond.) 160, 106–154.
Hubel, D., and Wiesel, T. N. (1965). Receptive fields and functional architecture in two nonstriate visual areas (18 and 19) of the cat. J. Neurophysiol. 28, 229–289.
Hubel, D. H., and Wiesel, T. N. (1963). Shape and arrangement of columns in cat’s striate cortex. J. Physiol. (Lond.) 165, 559–568.
Hubel, D. H., and Wiesel, T. N. (1977). Functional architecture of macaque monkey visual cortex. Proc. R. Soc. Lond. [Biol.] 198, 1–59.
Hubener, M., Shoham, D., Grinvald, A., and Bonhoeffer, T. (1997). Spatial relationships among three columnar systems in cat area 17. J. Neurosci. 17, 9270–9284.
Issa, N. P., Trepel, C., and Stryker, M. P. (2000). Spatial frequency maps in cat visual cortex. J. Neurosci. 20, 8504–8514.
Kim, D. S., Duong, T. Q., and Kim, S. G. (2000). High-resolution mapping of iso-orientation columns by fMRI. Nat. Neurosci. 3, 164–169.
Kim, D. S., Ronen, I., Olman, C., Kim, S. G., Ugurbil, K., and Toth, L. J. (2004). Spatial relationship between neuronal activity and BOLD functional MRI. Neuroimage 21, 876–885.
Kleinfeld, D., Mitra, P. P., Helmchen, F., and Denk, W. (1998). Fluctuations and stimulus-induced changes in blood flow observed in individual capillaries in layers 2 through 4 of rat neocortex. Proc. Natl. Acad. Sci. U.S.A. 95, 15741–15746.
LaManna, J. C., Chavez, J. C., and Pichiule, P. (2004). Structural and functional adaptation to hypoxia in the rat brain. J. Exp. Biol. 207, 3163–3169.
LaManna, J. C., Vendel, L. M., and Farrell, R. M. (1992). Brain adaptation to chronic hypobaric hypoxia in rats. J. Appl. Physiol. 72, 2238–2243.
Lauwers, F., Cassot, F., Lauwers-Cances, V., Puwanarajah, P., and Duvernoy, H. (2008). Morphometry of the human cerebral cortex microcirculation: general characteristics and space-related profiles. Neuroimage 39, 936–948.
Logothetis, N. K., Pauls, J., Augath, M., Trinath, T., and Oeltermann, A. (2001). Neurophysiological investigation of the basis of the fMRI signal. Nature 412, 150–157.
Lorente de No, R. (1938). “Architectonics and structure of the cerberal cortex,” in Physiology of the Nervous System, ed. J. F. Fulton (New York: Oxford University Press), 291–330.
Lowel, S., and Singer, W. (1987). The pattern of ocular dominance columns in flat-mounts of the cat visual cortex. Exp. Brain Res. 68, 661–666.
Malonek, D., Dirnagl, U., Lindauer, U., Yamada, K., Kanno, I., and Grinvald, A. (1997). Vascular imprints of neuronal activity: relationships between the dynamics of cortical blood flow, oxygenation, and volume changes following sensory stimulation. Proc. Natl. Acad. Sci. U.S.A. 94, 14826–14831.
Malonek, D., and Grinvald, A. (1996). Interactions between electrical activity and cortical microcirculation revealed by imaging spectroscopy: implication for functional brain mapping. Science 272, 551–554.
McHedlishvili, G., and Kuridze, N. (1984). The modular organization of the pial arterial system in phylogeny. J. Cereb. Blood Flow Metab. 4, 391–396.
Menon, R. S., Ogawa, S., Strupp, J. P., and Ugurbil, K. (1997). Ocular dominance in human V1 demonstrated by functional magnetic resonance imaging. J. Neurophysiol. 77, 2780–2787.
Moeller, S., Yacoub, E., Olman, C., Auerbach, E. J., Stupp, J., Harel, N., and Ugurbil, K. (2010). Multiband multislice GE-EPI at 7 tesla, with 16-fold acceleration using partial parallel imaging with application to high spatial and temporal whole-brain fMRI. Magn. Reson. Med. 63, 1144–1153.
Mountcastle, V. B. (1957). Modality and topographic properties of single neurons of cat’s somatic sensory cortex. J. Neurophysiol. 20, 408–434.
Park, S. H., Masamoto, K., Hendrich, K., Kanno, I., and Kim, S. G. (2008). Imaging brain vasculature with BOLD microscopy: MR detection limits determined by in vivo two-photon microscopy. Magn. Reson. Med. 59, 855–865.
Reina-De La Torre, F., Rodriguez-Baeza, A., and Sahuquillo-Barris, J. (1998). Morphological characteristics and distribution pattern of the arterial vessels in human cerebral cortex: a scanning electron microscope study. Anat. Rec. 251, 87–96.
Roggendorf, W., Cervos-Navarro, J., and Lazaro-Lacalle, M. D. (1978). Ultrastructure of venules in the cat brain. Cell Tissue Res. 192, 461–474.
Roy, C., and Sherrington, C. (1890). On the regulation of the blood supply of the brain. J. Physiol. 11, 85–108.
Schaffer, C. B., Friedman, B., Nishimura, N., Schroeder, L. F., Tsai, P. S., Ebner, F. F., Lyden, P. D., and Kleinfeld, D. (2006). Two-photon imaging of cortical surface microvessels reveals a robust redistribution in blood flow after vascular occlusion. PLoS Biol. 4:e22. doi: 10.1073/pnas.0609551104.
Shen, T., Weissleder, R., Papisov, M., Bogdanov, A. Jr., and Brady, T. J. (1993). Monocrystalline iron oxide nanocompounds (MION): physicochemical properties. Magn. Reson. Med. 29, 599–604.
Shoham, D., Hubener, M., Schulze, S., Grinvald, A., and Bonhoeffer, T. (1997). Spatio-temporal frequency domains and their relation to cytochrome oxidase staining in cat visual cortex. Nature 385, 529–533.
Silva, A. C., and Koretsky, A. P. (2002). Laminar specificity of functional MRI onset times during somatosensory stimulation in rat. Proc. Natl. Acad. Sci. U.S.A. 99, 15182–15187.
Sun, P., Ueno, K., Waggoner, R. A., Gardner, J. L., Tanaka, K., and Cheng, K. (2007). A temporal frequency-dependent functional architecture in human V1 revealed by high-resolution fMRI. Nat. Neurosci. 10, 1404–1406.
Thompson, J. K., Peterson, M. R., and Freeman, R. D. (2003). Single-neuron activity and tissue oxygenation in the cerebral cortex. Science 299, 1070–1072.
Tieman, S. B., Mollers, S., Tieman, D. G., and White, J. (2004). The blood supply of the cat’s visual cortex and its postnatal development. Brain Res. 998, 100–112.
Turner, R. (2002). How much cortex can a vein drain? Downstream dilution of activation-related cerebral blood oxygenation changes. Neuroimage 16, 1062–1067.
Weliky, M., Bosking, W. H., and Fitzpatrick, D. (1996). A systematic map of direction preference in primary visual cortex. Nature 379, 725–728.
Wolff, J. R. (1976). Proceedings: an ontogenetically defined angi oarchitecture of the neocortex. Arzneimittelforschung 26, 1239.
Woolsey, T. A., Rovainen, C. M., Cox, S. B., Henegar, M. H., Liang, G. E., Liu, D., Moskalenko, Y. E., Sui, J., and Wei, L. (1996). Neuronal units linked to microvascular modules in cerebral cortex: response elements for imaging the brain. Cereb. Cortex 6, 647–660.
Yacoub, E., Harel, N., and Ugurbil, K. (2008). High-field fMRI unveils orientation columns in humans. Proc. Natl. Acad. Sci. U.S.A. 105, 10607–10612.
Yacoub, E., Shmuel, A., Logothetis, N., and Ugurbil, K. (2007). Robust detection of ocular dominance columns in humans using Hahn Spin Echo BOLD functional MRI at 7 Tesla. Neuroimage 37, 1161–1177.
Zhao, F., Wang, P., Hendrich, K., and Kim, S. G. (2005). Spatial specificity of cerebral blood volume-weighted fMRI responses at columnar resolution. Neuroimage 27, 416–424.
Zhao, F., Wang, P., Hendrich, K., Ugurbil, K., and Kim, S. G. (2006). Cortical layer-dependent BOLD and CBV responses measured by spin-echo and gradient-echo fMRI: insights into hemodynamic regulation. Neuroimage 30, 1149–1160.
Zhao, F., Wang, P., and Kim, S. G. (2004). Cortical depth-dependent gradient-echo and spin-echo BOLD fMRI at 9.4T. Magn. Reson. Med. 51, 518–524.
Keywords: high-resolution, fMRI, cortical vessels, columns, vascular-unit
Citation: Harel N, Bolan PJ, Turner R, Ugurbil K and Yacoub E (2010) Recent advances in high-resolution MR application and its implications for neurovascular coupling research. Front. Neuroenerg. 2:130. doi: 10.3389/fnene.2010.00130
Received: 05 March 2010;
Paper pending published: 19 March 2010;
Accepted: 08 September 2010;
Published online: 27 September 2010
Edited by:
David Boas, Massachusetts General Hospital, USA; Massachusetts Institute of Technology, USA; Harvard Medical School, USAReviewed by:
Larry Wald, Harvard University, USACopyright: © 2010 Harel, Bolan, Turner, Ugurbil and Yacoub. This is an open-access article subject to an exclusive license agreement between the authors and the Frontiers Research Foundation, which permits unrestricted use, distribution, and reproduction in any medium, provided the original authors and source are credited.
*Correspondence: Noam Harel, Center for Magnetic Resonance Research, Department of Radiology, School of Medicine, University of Minnesota, 2021 Sixth Street SE, Minneapolis, MN 55455, USA. e-mail:bm9hbUBjbXJyLnVtbi5lZHU=
Disclaimer: All claims expressed in this article are solely those of the authors and do not necessarily represent those of their affiliated organizations, or those of the publisher, the editors and the reviewers. Any product that may be evaluated in this article or claim that may be made by its manufacturer is not guaranteed or endorsed by the publisher.
Research integrity at Frontiers
Learn more about the work of our research integrity team to safeguard the quality of each article we publish.