- 1Department of Neurology, The Second Xiangya Hospital, Central South University, Changsha, Hunan, China
- 2Department of Neurology, The First People’s Hospital of Changde City, Changde, Hunan, China
- 3Department of Respiratory Medicine, Central South University, Changsha, Hunan, China
Background: Parkinson’s disease (PD) is a common age-related chronic neurodegenerative disease. There is currently no affordable, effective, and less invasive test for PD diagnosis. Metabolite profiling in blood and blood-based gene transcripts is thought to be an ideal method for diagnosing PD.
Aim: In this study, the objective is to identify the potential diagnostic biomarkers of PD by analyzing microarray gene expression data of samples from PD patients.
Methods: A computational approach, namely, Weighted Gene Co-expression Network Analysis (WGCNA) was used to construct co-expression gene networks and identify the key modules that were highly correlated with PD from the GSE99039 dataset. The Least Absolute Shrinkage and Selection Operator (LASSO) regression analysis was performed to identify the hub genes in the key modules with strong association with PD. The selected hub genes were then used to construct a diagnostic model based on logistic regression analysis, and the Receiver Operating Characteristic (ROC) curves were used to evaluate the efficacy of the model using the GSE99039 dataset. Finally, Reverse Transcription-Polymerase Chain Reaction (RT-PCR) was used to validate the hub genes.
Results: WGCNA identified two key modules associated with inflammation and immune response. Seven hub genes, LILRB1, LSP1, SIPA1, SLC15A3, MBOAT7, RNF24, and TLE3 were identified from the two modules and used to construct diagnostic models. ROC analysis showed that the diagnostic model had a good diagnostic performance for PD in the training and testing datasets. Results of the RT-PCR experiments showed that there were significant differences in the mRNA expression of LILRB1, LSP1, and MBOAT7 among the seven hub genes.
Conclusion: The 7-gene panel (LILRB1, LSP1, SIPA1, SLC15A3, MBOAT7, RNF24, and TLE3) will serve as a potential diagnostic signature for PD.
1. Introduction
Parkinson’s disease (PD) is an age-related disease and is the second most common chronic neurodegenerative disorder (Dassati et al., 2021). Its clinical symptoms include static tremors, muscle tension, and loss of smell (Bostantjopoulou et al., 2013). Although Positron Emission Computed Tomography (PET) imaging of dopamine transporter is used in the diagnosis of PD, it is expensive and inconvenient and therefore not suitable for some medical centers (Nicastro et al., 2021). Currently, PD is mainly diagnosed based on physical examination and clinical symptoms, and there are no affordable, effective, and less invasive examination methods (Farotti et al., 2020).
Biomarkers in peripheral blood samples are a good solution to the diagnosis of PD. Early α-synuclein and DJ-1 are considered as possible peripheral biomarkers, but experimental results show that they are not ideal (Chahine et al., 2014). Later studies found that low levels of peripheral uric acid (Weisskopf et al., 2007), epidermal growth factor (Chen-Plotkin et al., 2011), and apolipoprotein A1 protein predicted an increased risk of PD (Qiang et al., 2013). In recent years, with the development of bioinformatics, gene expression microarray, or next generation sequencing technology is an ideal method to screen PD biomarkers from peripheral blood transcripts (Shamir et al., 2017; Falchetti et al., 2020; Jin et al., 2020; Lin et al., 2021). In addition to transcriptomics, epigenetics, and proteomics are also good ways to explore potential biomarkers for the diagnosis of PD (Mayo et al., 2021).
The difficulty in the diagnosis of PD lies not only in the location of the lesion in the central nervous system, where most biological factors are sequestered by the blood-brain barrier, resulting in fewer biomarkers in peripheral blood, but also that the clinical manifestations of PD overlap with other neurodegenerative diseases. In this study, we used bioinformatics methods to screen for potential diagnostic markers of PD in peripheral blood from Gene Expression Omnibus (GEO) datasets in samples containing PD and other neurodegenerative diseases (NDD).
2. Materials and methods
2.1. Microarray data preprocessing
The data of GSE99039 analyzed during the current study are available from the GEO database. The GSE99039 is the largest sample size dataset of all PD peripheral blood transcriptional analysis datasets and contained 205 idiopathic PD patients, 233 healthy controls, and 48 NDD patients [including 27 patients with Huntington disease, and 21 with Multiple System Atrophy (MSA), Corticobasal Degeneration (CBD), progressive supranuclear palsy (PSP), or PD dementia (PDD)] (Shamir et al., 2017). These data were generated using the GPL570 platform (Affymetrix Human Genome U133 Plus 2.0 Array).
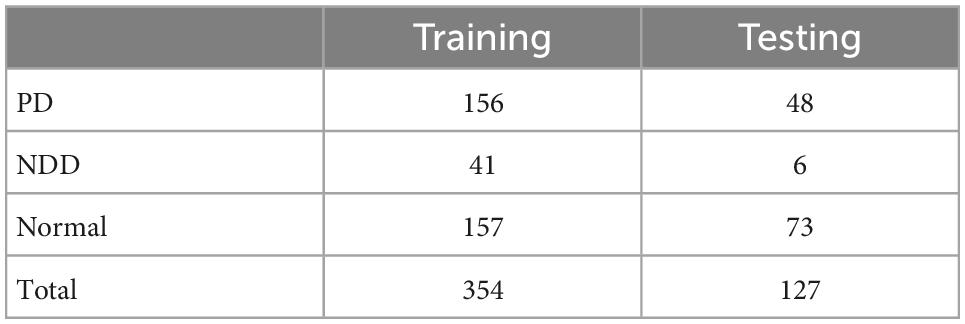
The raw gene expression data and clinical trait data of GSE99039 were downloaded from the GEO database. The Affy package in R was used for background correction and quantile normalization of the raw expression data (Gautier et al., 2004), whereas the ArrayQualityMetrics package was used for quality assessment to remove unqualified samples (Distances between arrays, Boxplots, MA plots, two of the three items are unqualified as unqualified sample: 1 PD, 1 NDD, and 3 control) (Kauffmann et al., 2009). The SVA package in R was used to remove batch effects. Platform annotation files were used to annotate the probes, and the average expression levels of genes represented by more than one probe were calculated (Leek et al., 2012). The GSE99039 dataset was randomly divided into the training set and test set at a ratio of 7:3 (Table 1).
2.2. Construction of co-expression network with WGCNA
WGCNA package in R was used to construct the co-expression network and identify co-expression gene modules. First, genes with the top 25% variance in gene expression from the GSE99039 training set were used to construct scale-free co-expression networks. To construct scale-free networks, we chose the soft threshold power value. Subsequently, we used Pearson correlation matrices to calculate a correlation matrix for the genes. Next, we transformed the correlation matrix into a weighted adjacency matrix using the power function. Finally, we performed step-by-step network construction and module detection using the following major parameters: deepSplit = 2, power = 11, networkType = unsigned, minModuleSize = 30, and mergeCutHeight = 0.20. We identified the key modules that are strongly associated with PD based on the correlation between modules and disease group (Langfelder and Horvath, 2008).
2.3. Gene ontology and KEGG enrichment analysis
ClusterProfiler package was used to perform Gene Ontology (GO) and Kyoto Encyclopedia of Genes and Genomes (KEGG) enrichment analysis of genes in key modules (Yu et al., 2012).
2.4. Identification of hub genes and construction a prediction gene signature
Module membership (MM) represents the intramodular connectivity of any gene in a given module. A higher absolute value of MM indicates that a gene has a higher negative or positive correlation with the module eigengenes (MEs). Gene significance (GS) is used to incorporate external information into the co-expression network, with a higher absolute value of GS indicating the increased biological significance of a gene for a given clinical trait. We selected hub genes in key modules based on the criteria: | MM| > 0.8 and | GS| > 0.2 (Xia et al., 2020). We performed the LASSO regression analysis to extract genes strongly associated with PD in the training dataset via glmnet package in R.
2.5. Construction of the diagnostic model
The selected genes were used to construct a diagnosis model based on multivariate Logistic regression in the training set in the glmnet package in R. To evaluate the ability of the Logistic regression model to identify PD, Receiver Operating Characteristic (ROC) curve analysis conducted by the pROC package and confusion matrix were used in the training set and test set (Robin et al., 2011).
2.6. RT-PCR validation of the hub genes
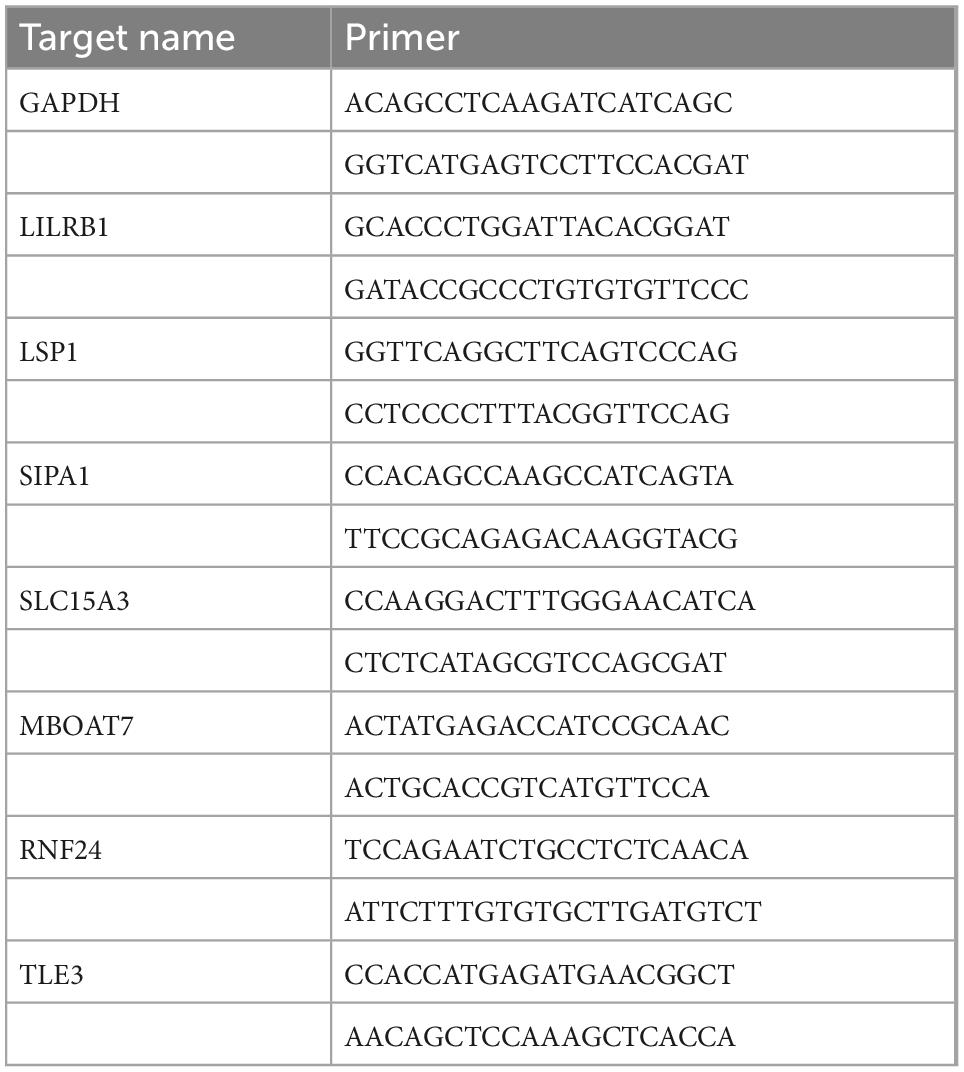
Serum samples from five patients without PD and five patients with PD were collected for Reverse Transcription-Polymerase Chain Reaction (RT-PCR) validation to validate the predictive power of the signature. This protocol was approved by the Ethics Committee or Institutional Review Board of Changde First People’s Hospital (Approval number: 2018-028-01). Total RNA samples were extracted using the TRIzol reagent (Thermo, 15596026) according to the manufacturer’s instructions. The RNA was reverse-transcribed to cDNA which was prepared using the SYBR qPCR reaction system (Thermo, PIKOREAL96, USA) for RT-PCR. Glyceraldehyde-3-phosphate dehydrogenase (GAPDH) served as the internal control. Relative mRNA expression was calculated using the ΔΔCT method. Primers used are shown in Table 2.
2.7. Statistical analysis
T-test was used for RT-PCR data analysis. All statistical analysis was performed in the R software (v. 4.1.2). Unless otherwise stipulated, P < 0.05 was regarded as statistically significant.
3. Results
3.1. Weighted gene co-expression network analysis
Preprocessing of the GSE99039 training dataset resulted in the identification of 21,655 genes expression profiles. Based on genes with the top 25% variance in expression, 5,414 genes were selected for WGCNA. To construct an approximate scale-free topological network, we choose the power 11, which is the lowest power for the scale-free topological fitting exponential curve to flatten out when its value goes beyond 0.8 (Figure 1A) and mean connectivity is close to 0 (Figure 1B). The identified genes were divided into 12 modules, with the gray module consisting of genes that could not be clustered (Figure 1C).
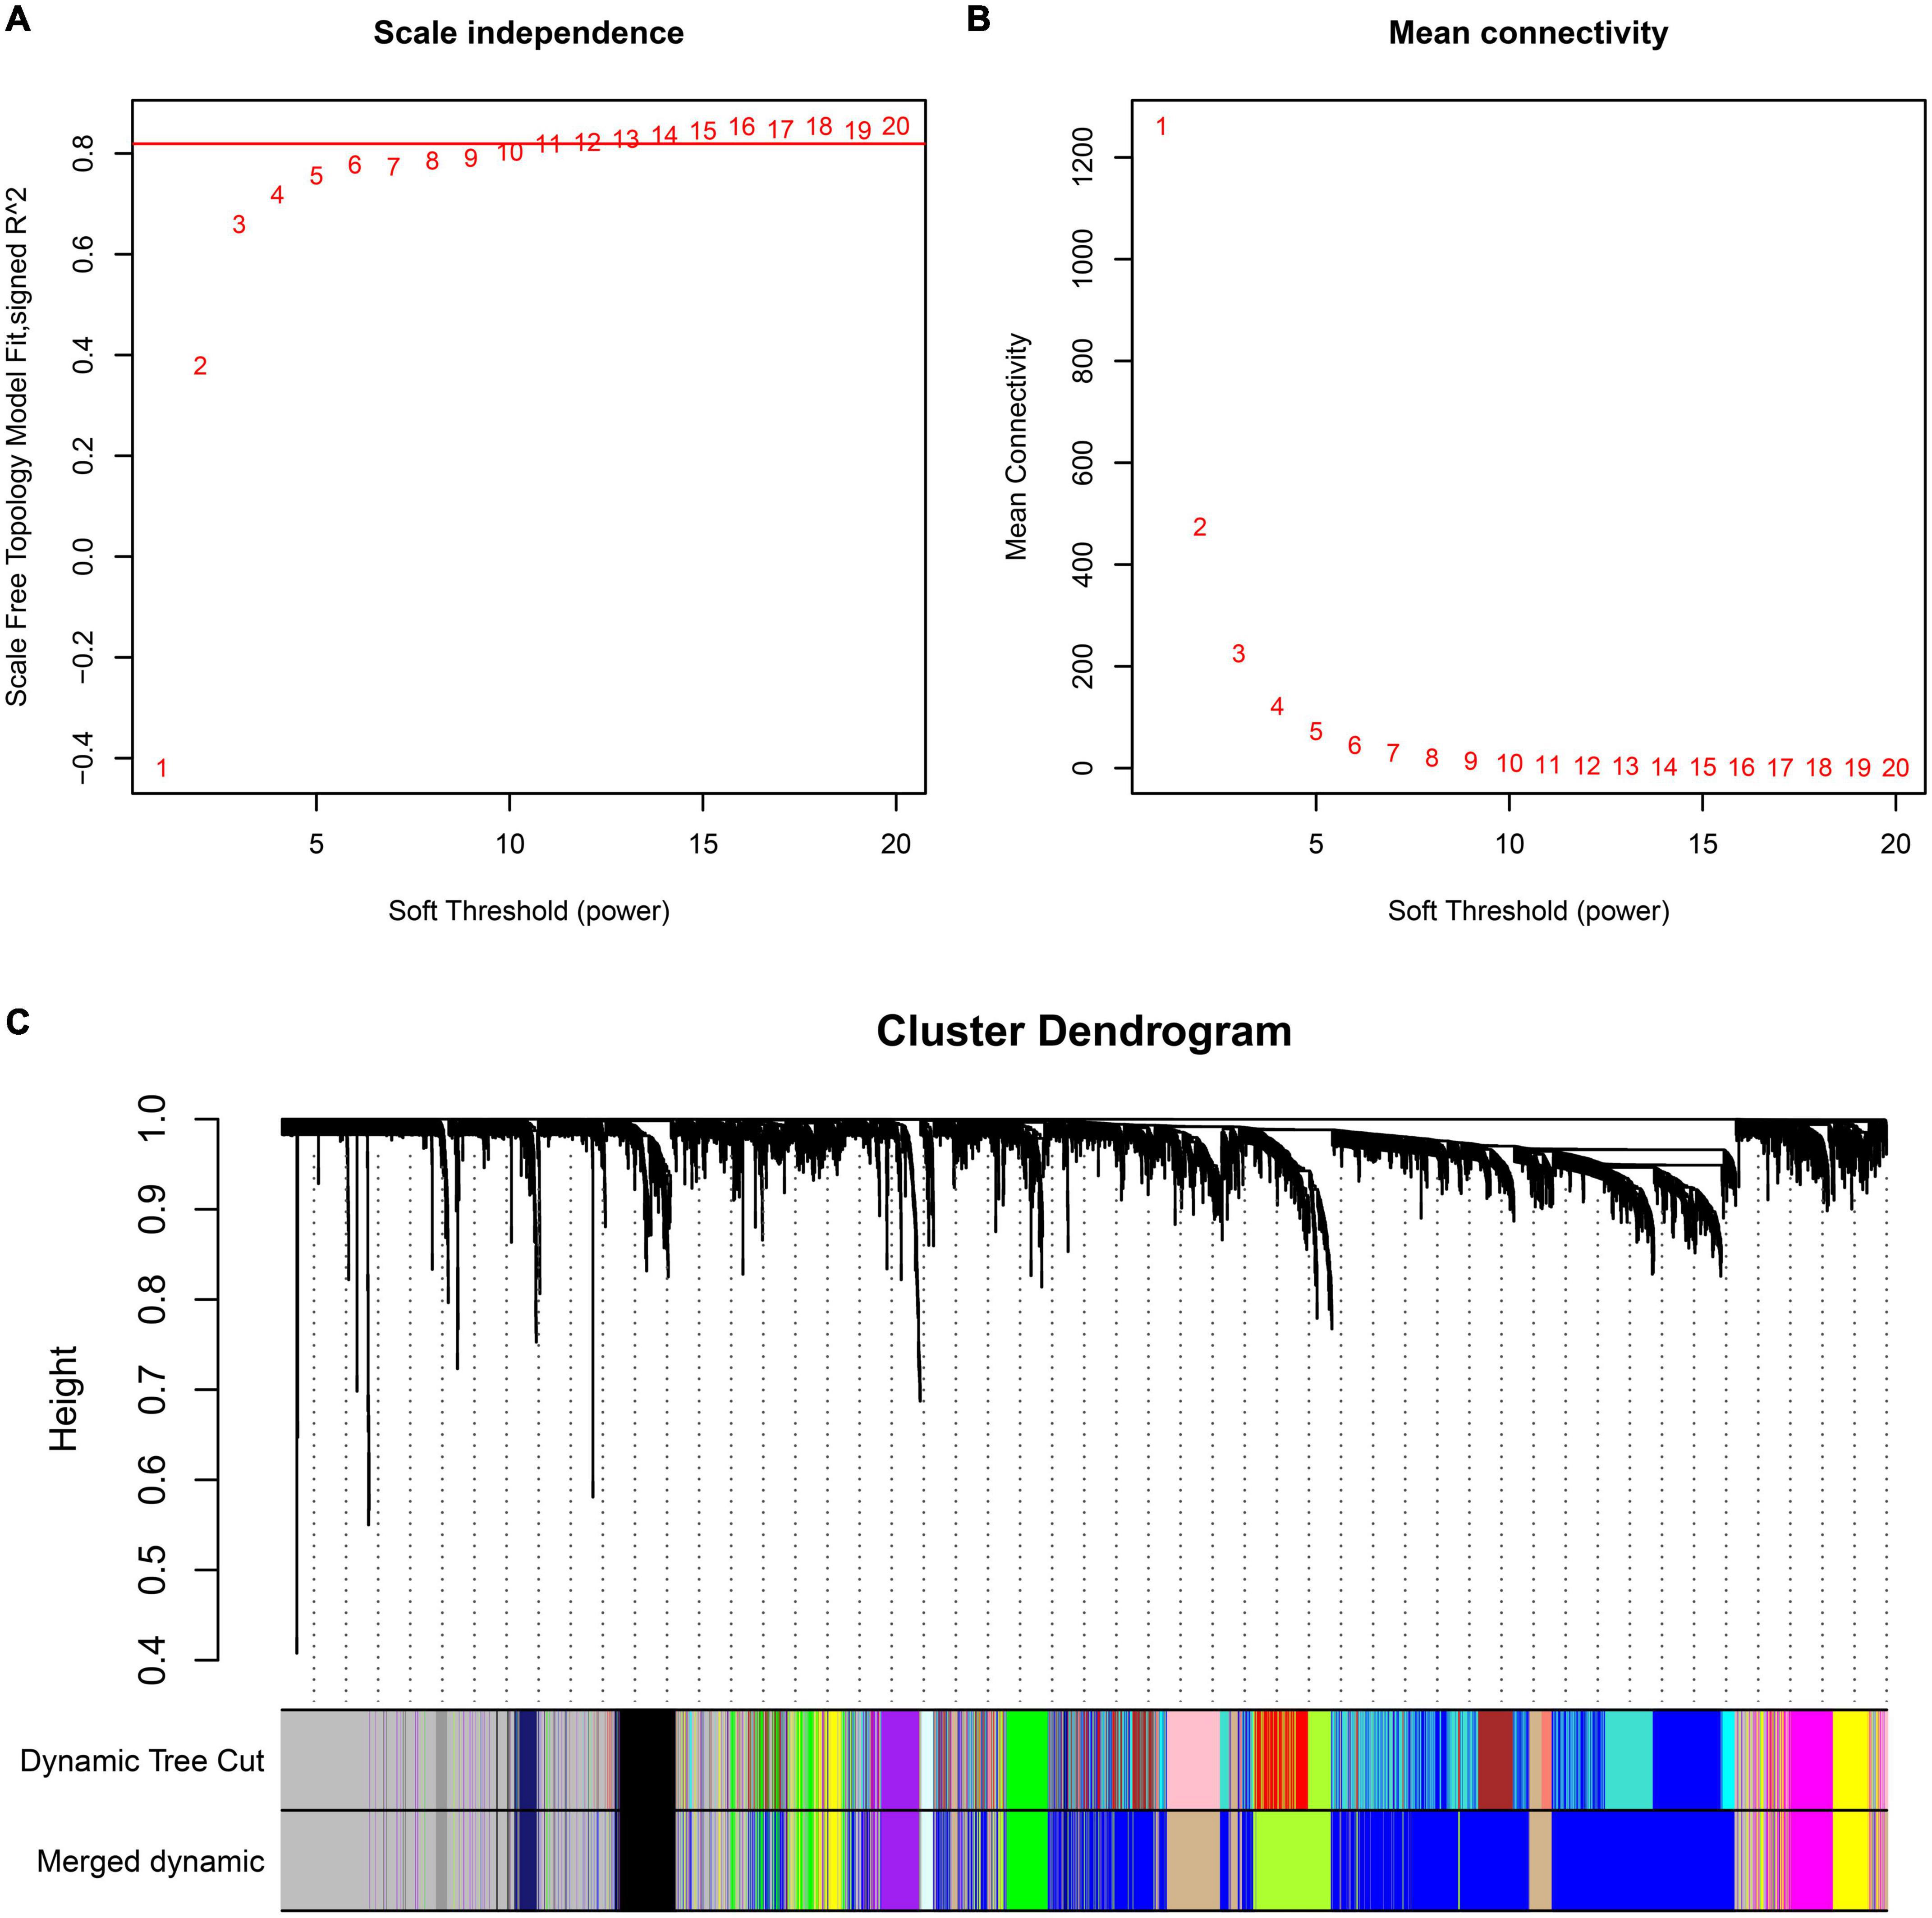
Figure 1. Construction of WGCNA co-expression modules. Analysis of the scale-free fit index (A) and the mean connectivity (B) for various soft-thresholding powers. (C) Dendrogram of all differentially expressed genes clustered based on a dissimilarity measure (1-TOM).
The magenta and yellow modules had the highest correlation with the PD group (r = 0.21, p < 0.01; r = 0.17, p < 0.01) (Figure 2A), and were thus identified as key modules. The interaction relationships among the 11 modules obtained from WGCNA were plotted as network heatmap (Figure 2B). The results showed a high degree of independence between these modules, which means that gene expression among the modules is relatively independent. In addition, to represent the similarity of modules, we performed hierarchical clustering according to the signature gene values of each module (Figure 2C). The results showed that these modules were mainly divided into three clusters, and the results of the module-associated heatmap were consistent (Figure 2D).
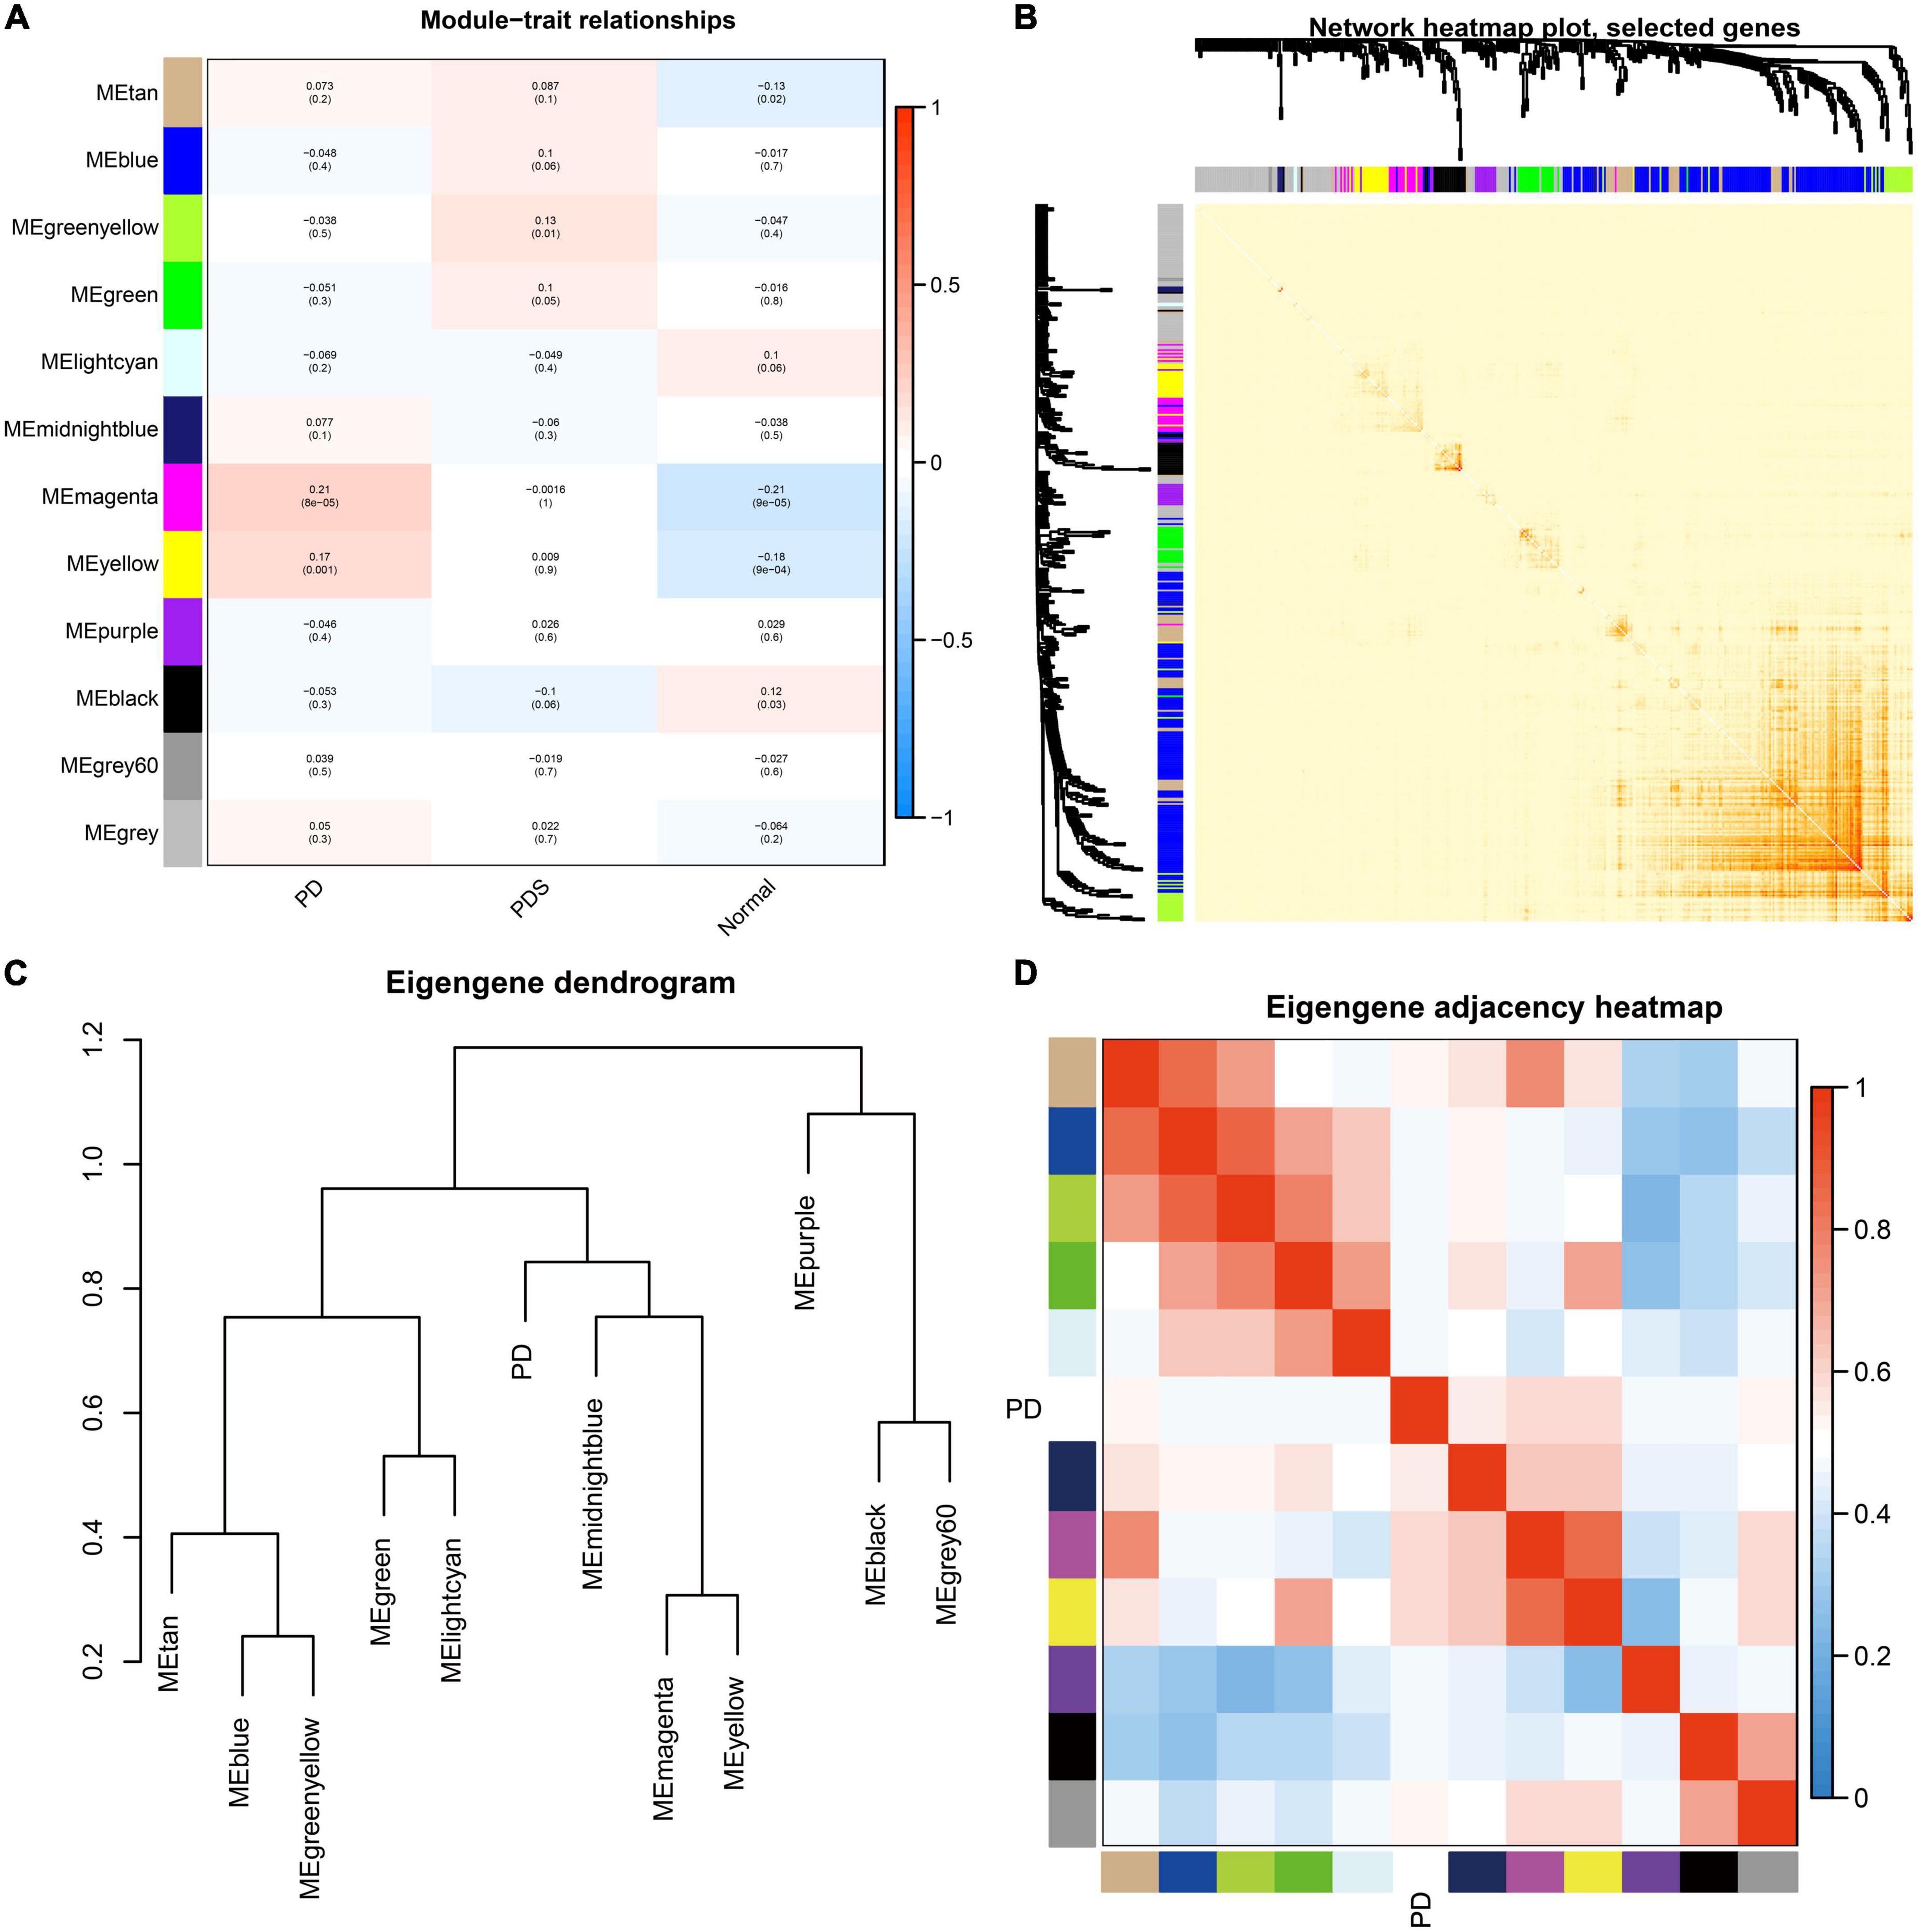
Figure 2. Correlation analysis of modules from weighted gene co-expression network analysis and identification of PD-associated modules. (A) Heatmap of correlation between clinical traits (x-axis) and modules (y-axis). The abscissa represents the clinical information (PD, NDD, Normal) contained in the dataset, and the ordinate represents different modules. The histogram on the right is the color scale. Numbers inside the heatmap signify correlation values and p-values (in parenthesis). (B) Heatmap depicting the interaction of co-expressed genes. Different colors in both axes represent different modules, and the brightness of red in the middle of heatmap indicates the connectivity degree of the corresponding modules. (C) Hierarchical clustering dendrogram displaying the similarity of each module eigengenes value. (D) Heatmap showing correlation between each module, labeled by their corresponding color.
3.2. GO and KEGG enrichment analysis
Gene Ontology and KEGG enrichment analysis was performed on 210 genes in the magenta module and 272 genes in the yellow module. The GO analysis was performed in relation to three aspects: biological process, cellular component, and molecular function.
Magenta module GO terms were enriched in “cytokine-mediated signaling pathway,” “secretory granule membrane,” and “immune receptor activity” (Figure 3A). The KEGG pathway analysis results showed that the genes were enriched in pathways involved in “Osteoclast differentiation” and “Chemokine signaling pathway” in the magenta module (Figure 3B).
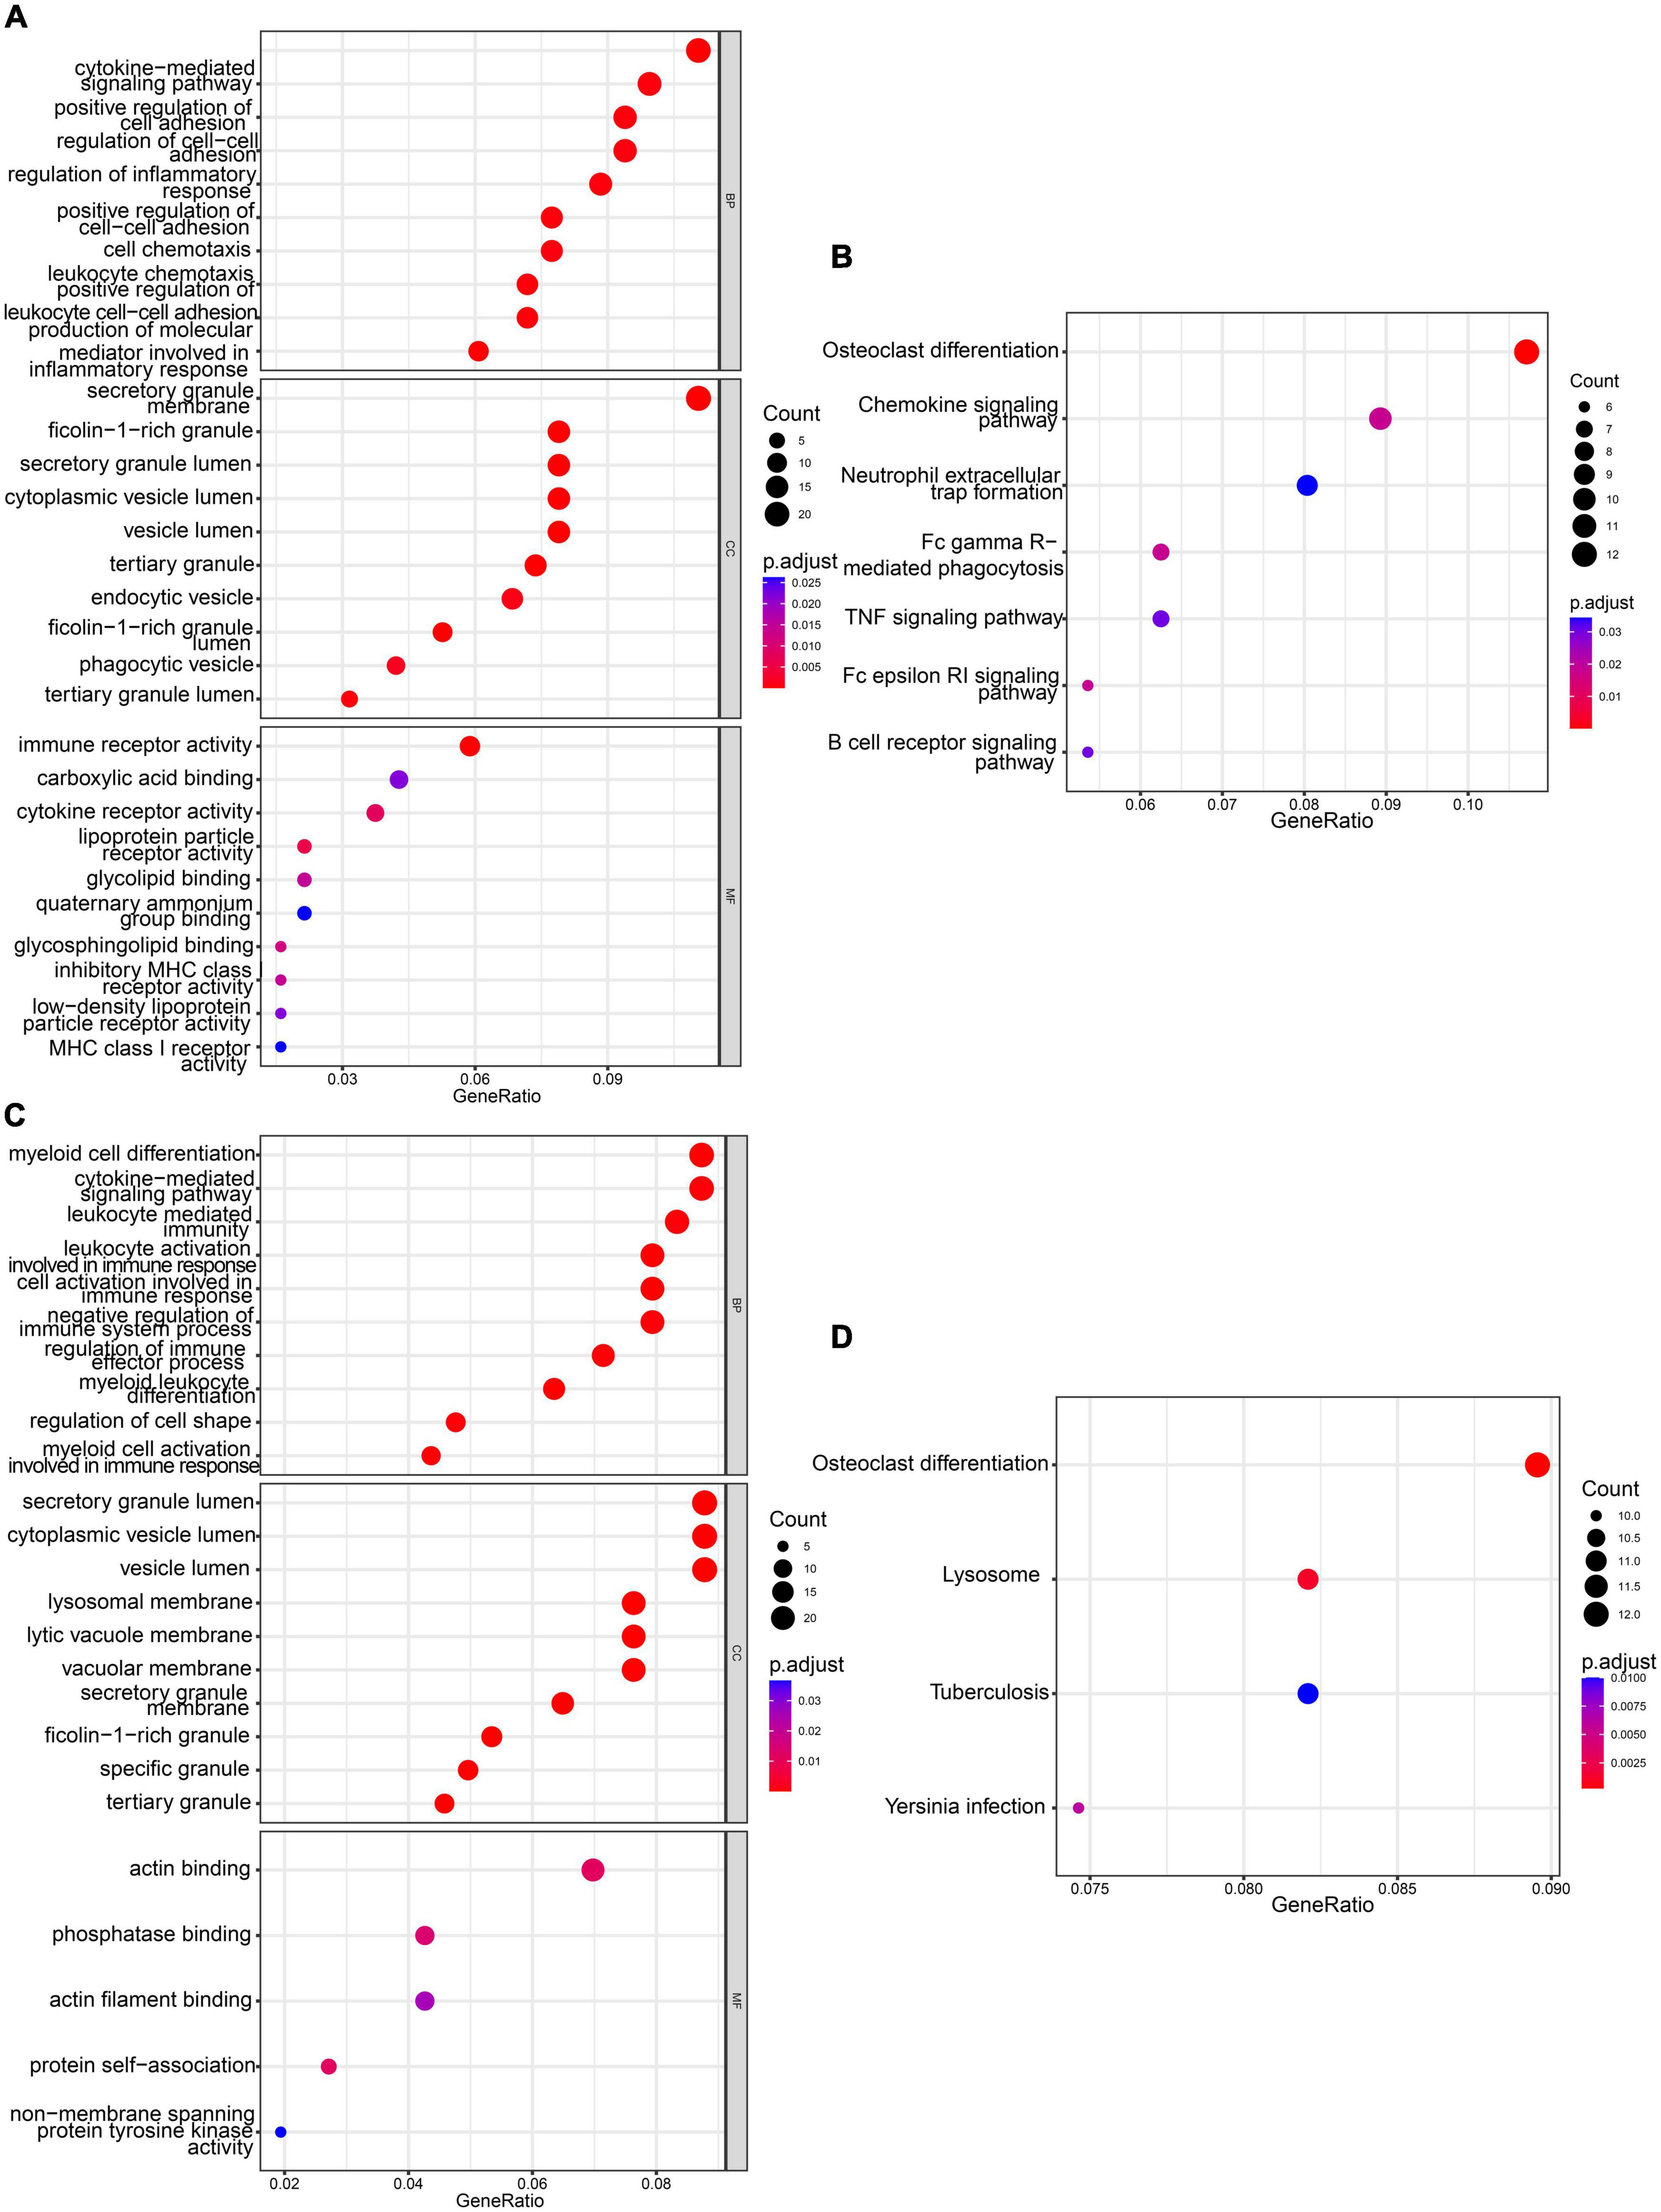
Figure 3. Functional enrichment analyses of magenta and yellow modules. (A) GO analysis of genes in magenta module. (B) KEGG pathway analysis of genes in magenta module. (C) GO analysis of genes in yellow module. (D) KEGG pathway analysis of genes in yellow module.
Yellow module GO terms were enriched in “myeloid cell differentiation,” “secretory granule lumen,” and “actin binding” (Figure 3C). The KEGG pathway analysis results showed that the genes were enriched in “Osteoclast differentiation” and “lysosomal pathways” (Figure 3D).
Results from GO and KEGG enrichment analysis indicated that the genes in the key modules may be involved in the development of PD.
3.2. Selection of potential biomarkers for PD diagnosis
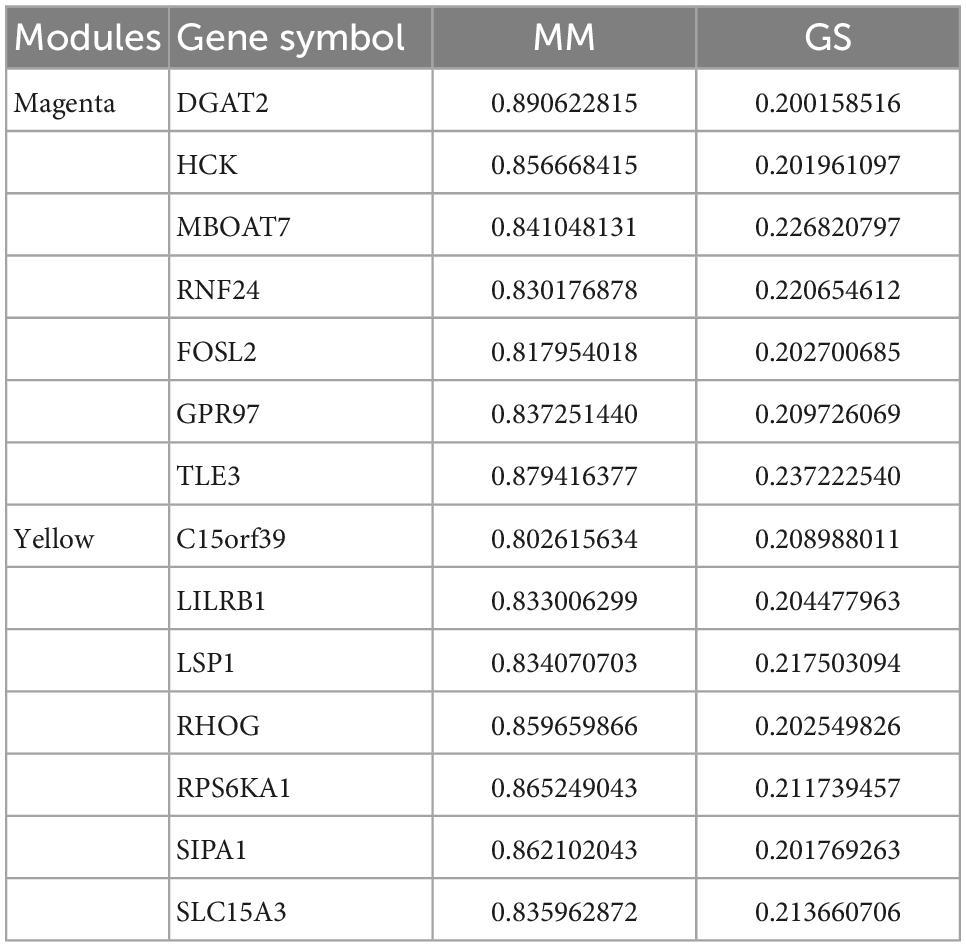
Based on the criterion: | MM| > 0.8 and | GS| > 0.2, we identified seven hub genes from the magenta and yellow modules, respectively (Table 3). Next, we performed the Least Absolute Shrinkage and Selection Operator (LASSO) regression analysis to identify the relationship between genes in key modules and the PD patients and using the glmnet package in R (Figure 4). Consequently, seven genes, LILRB1, LSP1, SIPA1, SLC15A3, MBOAT7, RNF24, and TLE3 were found to be highly associated with PD in the GSE99039 training dataset.
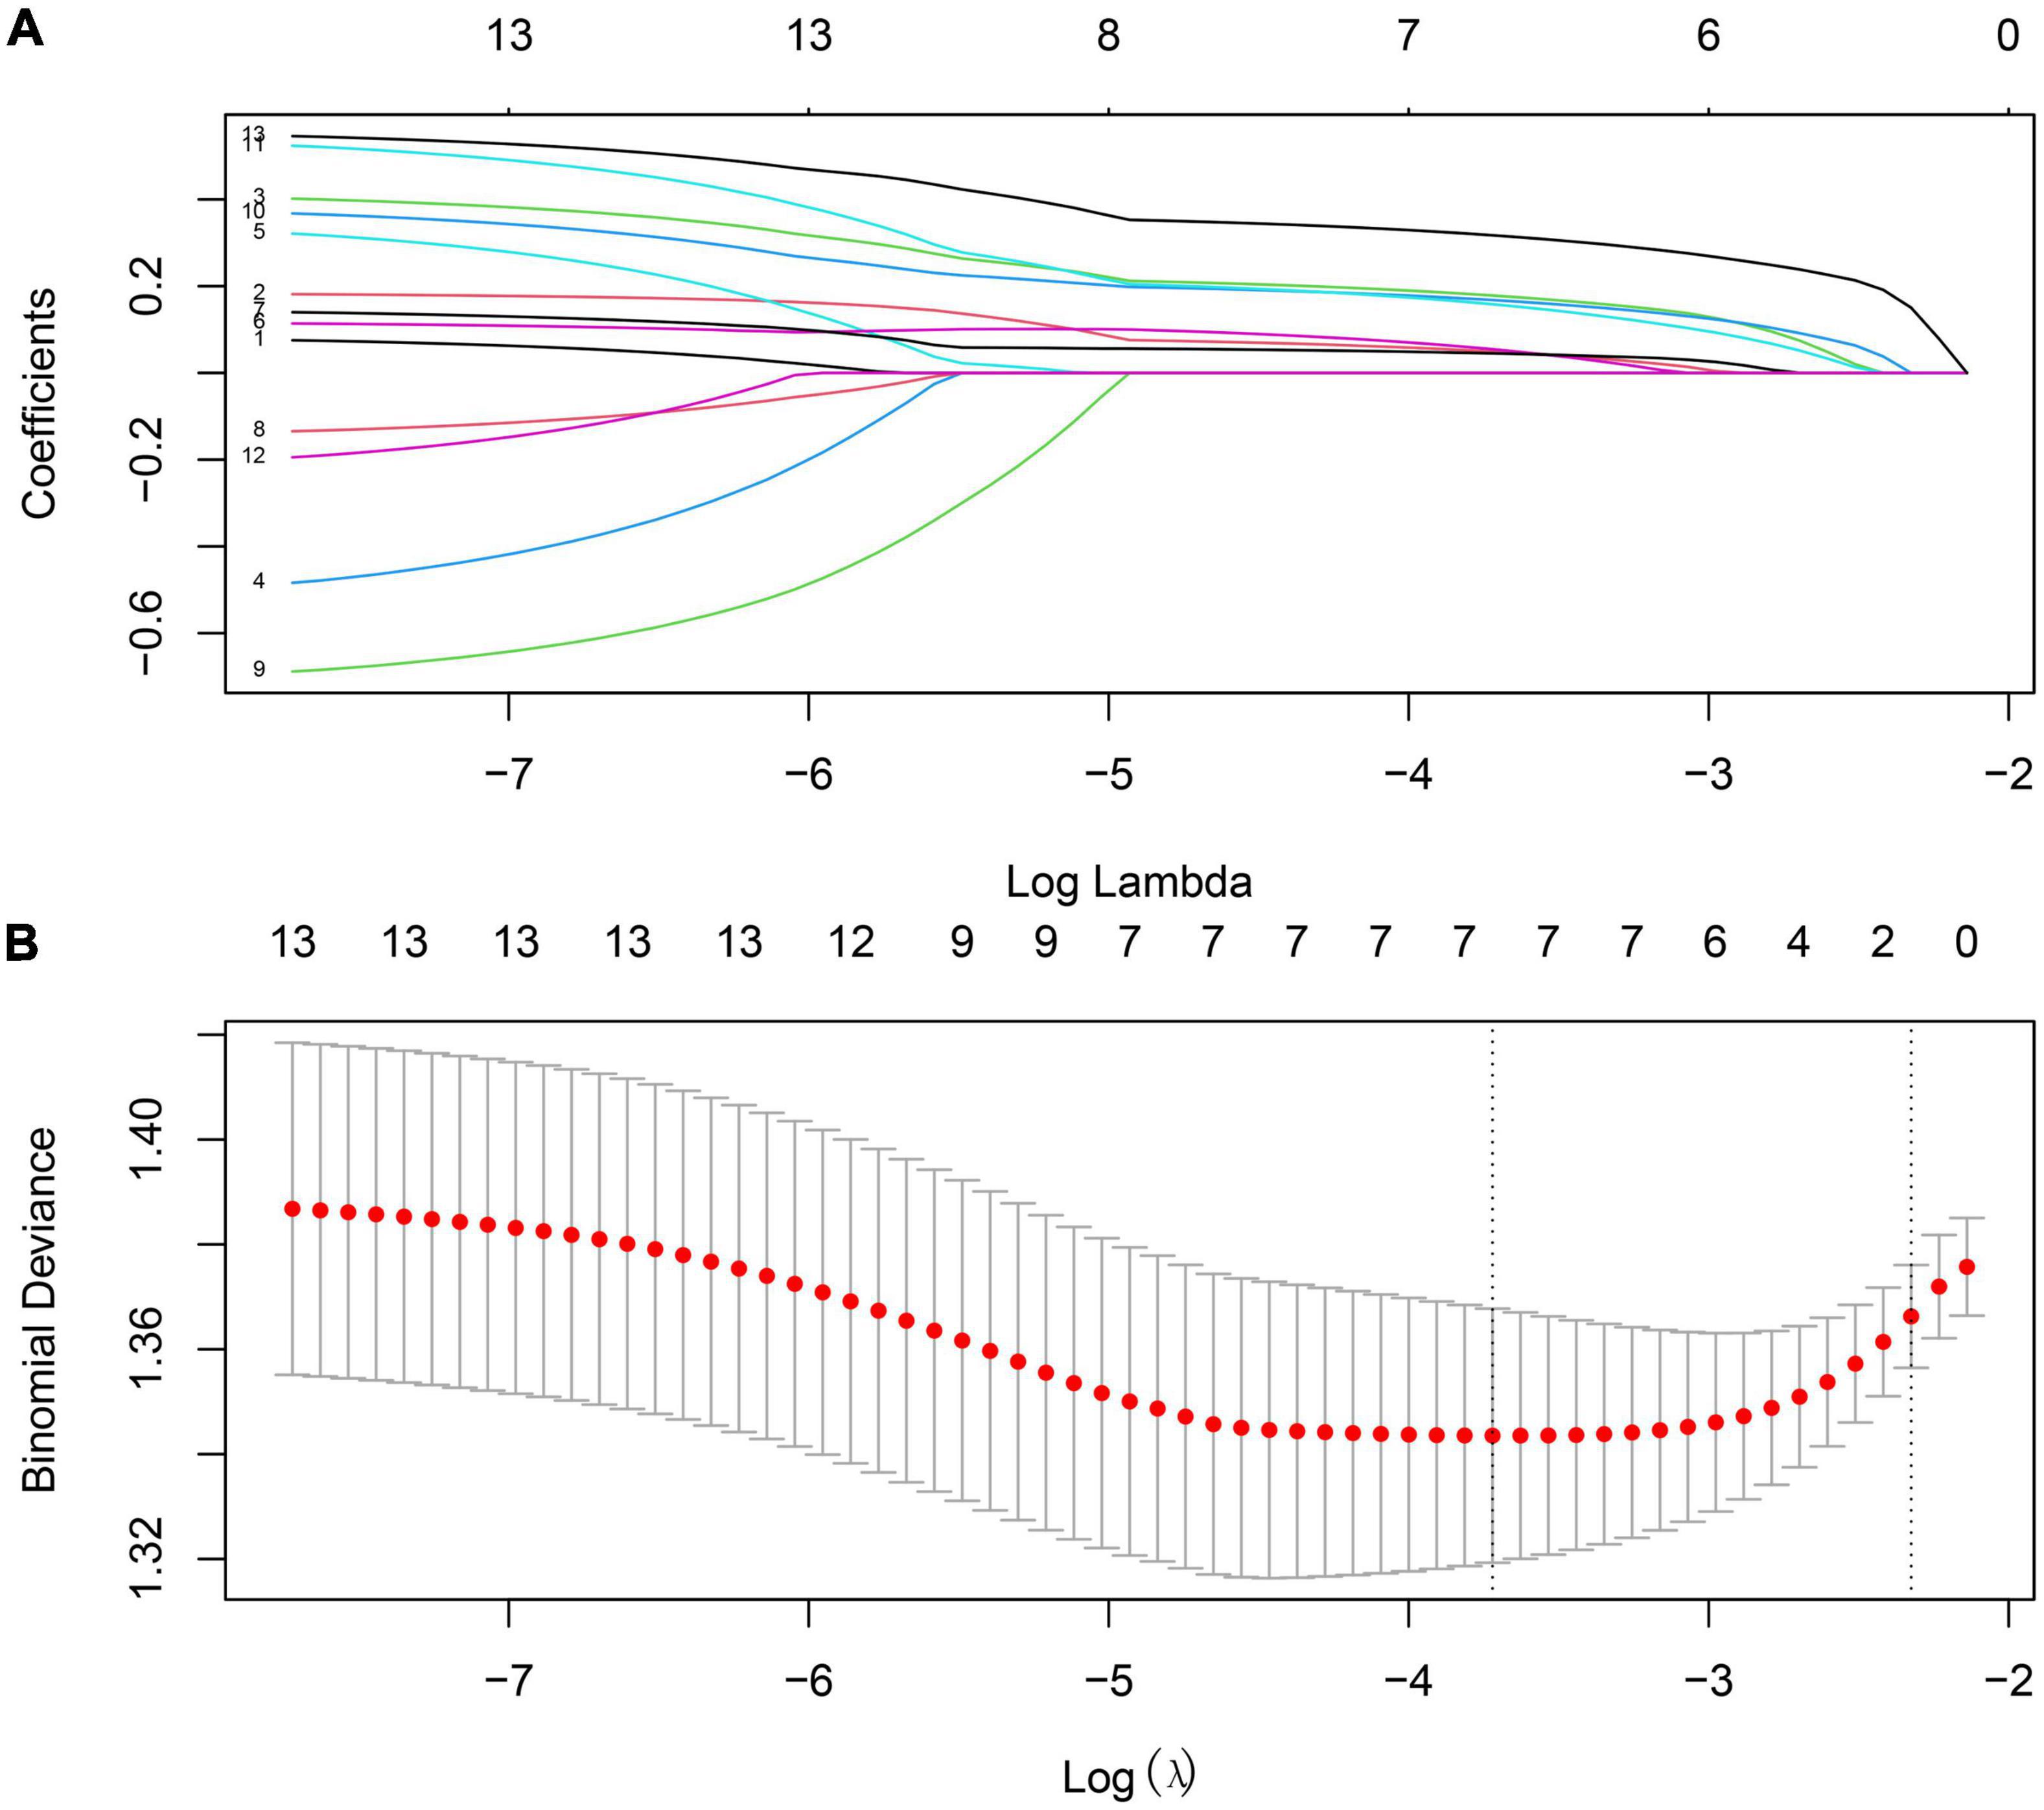
Figure 4. The process of screening genes most associated with prognosis in the training set by Lasso regression. (A) Processes of LASSO regression model fitting. (B) The misclassification error in the jackknife rates analysis.
3.3. Construction of gene diagnosis model
The seven genes were used to construct a diagnosis model using multivariate Logistic regression. The gene-based model index was created according to the following formula: index = (1.09 × expression of LILRB1) + (1.26 × expression of LSP1) + (1.13 × expression of SIPA1) + (1.06 × expression of SLC15A3) + (1.24 × expression of MBOAT7) + (1.25 × expression of RNF24) + (1.45 × expression of TLE3).
Receiver Operating Characteristic curve analysis indicated that the AUC of the 7-gene-based model was 0.65 in the training set and 0.60 in the test set (Figures 5A, B). The confusion matrix results show that the False Positive Rate (FPR), False Negative Rate (FNR), and Error Rate (ER) of the model in the training set are 0.263, 0.545, 0.387, respectively, and 0.241, 0.667, 0.402 in the test set respectively (Tables 4, 5). These suggests that the Logistic regression model had stability.
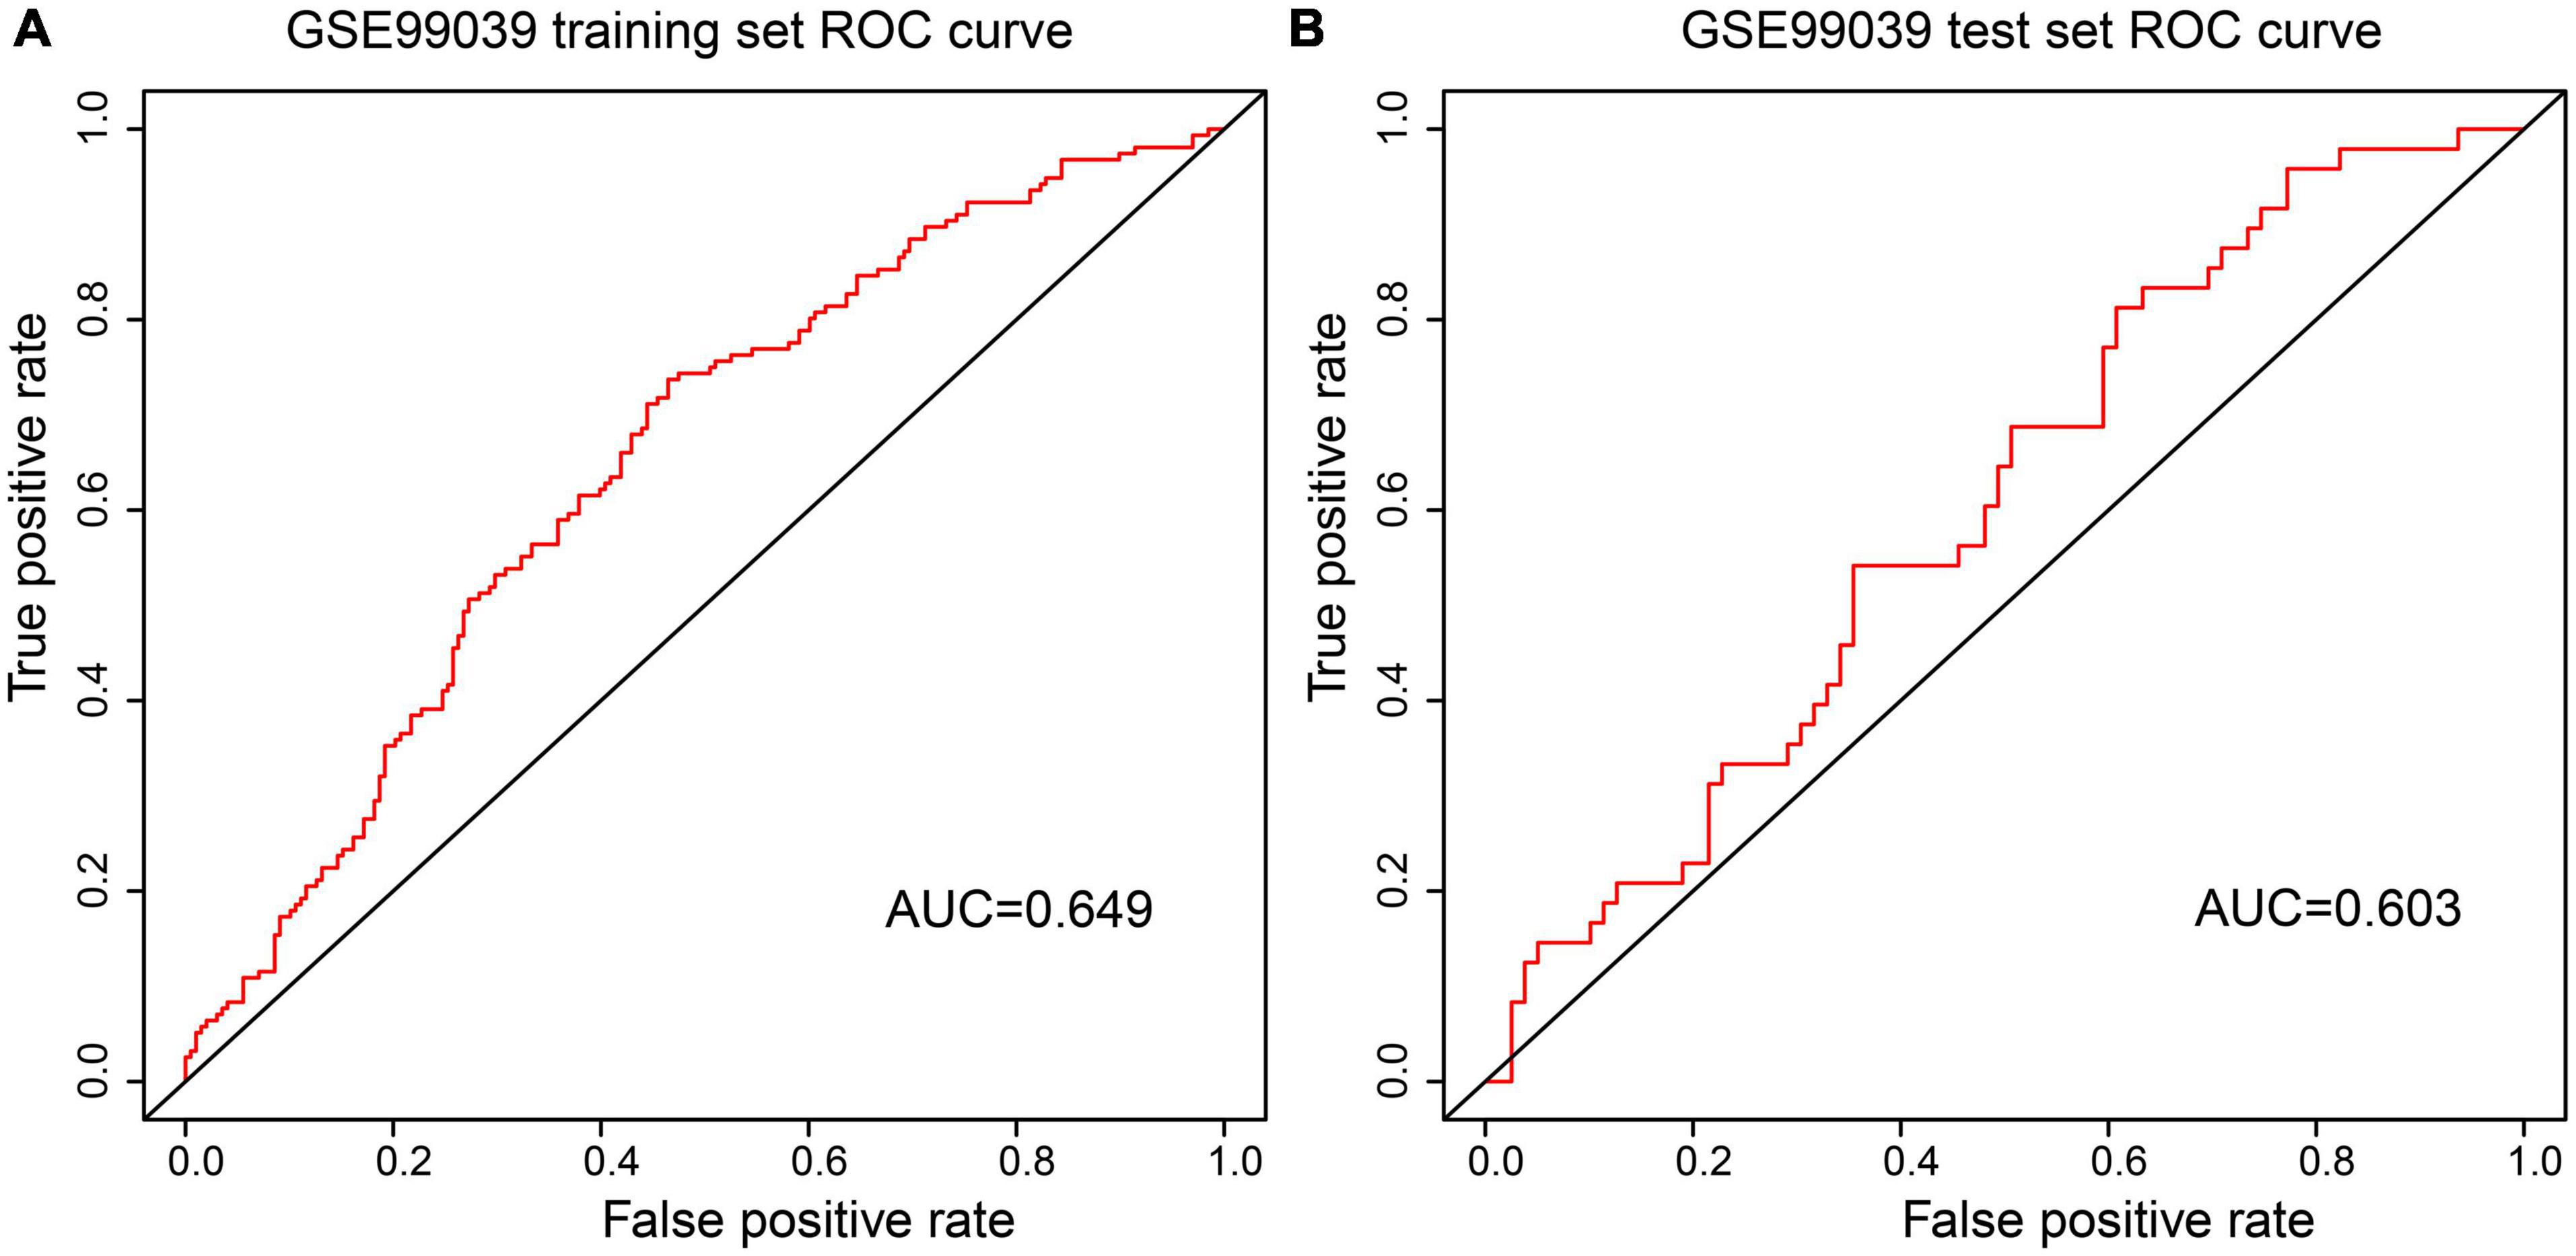
Figure 5. ROC curves were used to evaluate the accuracy of logistic regression model. (A) Analysis of the GES9903 training set. (B) Analysis of the GES9903 test set.
3.4. The experiment of seven hub genes
Reverse Transcription-Polymerase Chain Reaction results of RNAs isolated from peripheral blood samples of PD patients showed that mRNA expression levels of LSP1, LIRB1, and MBOAT7 in the PD group were higher than those in the control group (< 0.05), but the expression levels of SIPA1, SLC15A3, TLE3, and RNF24 was not significantly different between the two groups (Figure 6). The identified seven genes may serve as potential diagnostic biomarkers.
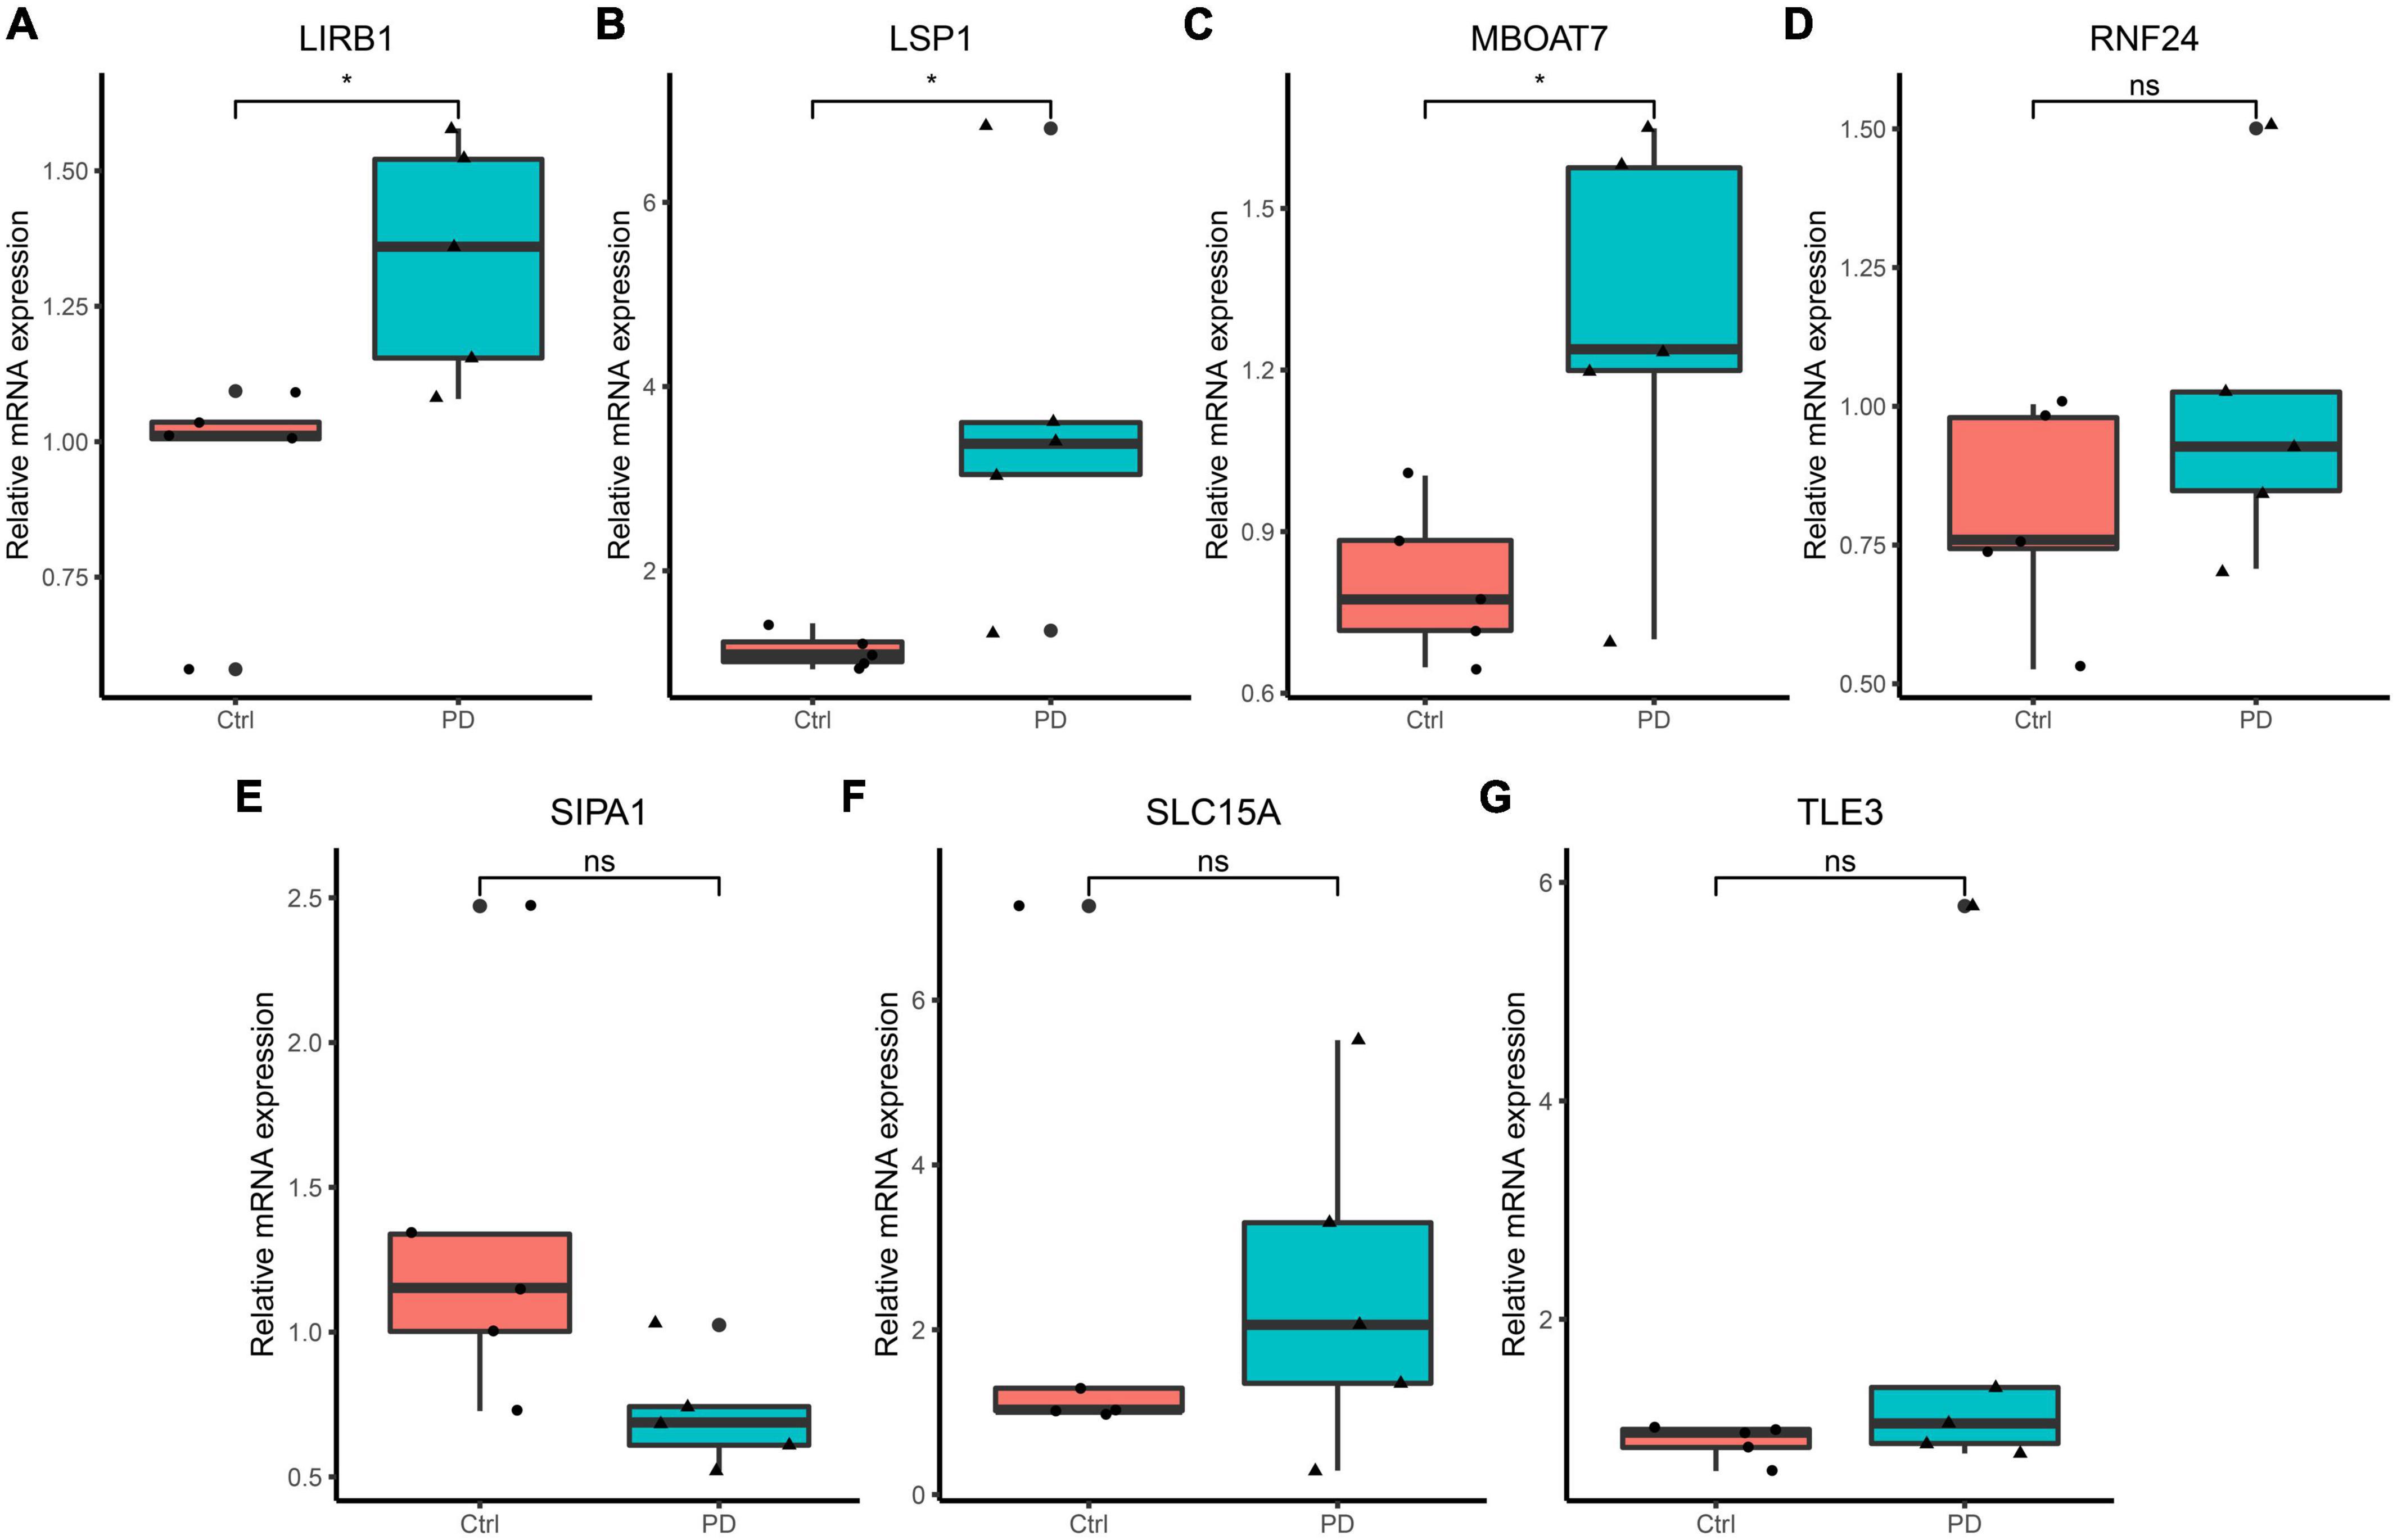
Figure 6. Reverse Transcription-Polymerase Chain Reaction validation of the hub gene between PD and normal controls. (A–G) Relative expression levels of LILRB1, LSP1, MBOAT7, RNF24, SIPA1, SLC15A3, and TLE3. *p < 0.05.
4. Discussion
Parkinson’s disease is a type of NDD commonly seen in the elderly. The main motor symptoms of this disorder are caused by the degeneration of dopamine neurons in the substantia nigra that innervate the striatum (Pajares et al., 2020). Currently, the diagnosis of PD is mainly based on clinical examination. Therefore, there is need to develop a more accurate, widely applicable, and specific diagnostic technique for PD.
Using WGCNA, we identified two key modules that were able to distinguish patients with PD from other NDD patients and healthy individuals. Then we used seven hub genes LSP1, LIRB1, MBOAT7, SIPA1, SLC15A3, TLE3, and RNF24 from the key modules to construct a PD prediction model. GO and KEGG enrichment analysis showed that the genes in the two Hub modules were mainly related to inflammation and immunity. The seven genes in the model, all associated with inflammation or immunity, were highly expressed in the bone marrow, lymph nodes, or brain. Studies have demonstrated that inflammation is an important factor in the development of PD, but the exact underlying mechanism is unclear. The innate immune mechanism of PD patients is dysregulated, microglial cell proliferation can be seen in the brain (McGeer et al., 1988), and there are autoantibodies against α-synuclein protein, dopamine, and melanin in serum and cerebrospinal fluid (Double et al., 2009; Yanamandra et al., 2011), suggesting that humoral immunity may play a role in PD-related neuroinflammation and neurodegeneration. In addition to microglia and astrocyte hyperplasia in the brain of PD patients, peripheral inflammation, and PD risk-related genes can also promote chronic inflammatory responses that lead to the progression of this neurodegenerative disease (Pajares et al., 2020), and cytokine such as IL1β, IL2, IL6, IFN-γ, and TNF-α can be detected in peripheral blood (Reale et al., 2009).
The LSP1 gene encodes an intracellular F-actin binding protein expressed in lymphocytes, neutrophils, macrophages, and endothelial cells (Palker et al., 1998). The protein can regulate the movement of neutrophils, adhesion to fibrinogen matrix proteins, and trans-endothelial migration. It is also expressed in CD8 + T cells and is associated with T-cell maturation, and chemotaxis of neutrophils (Wu et al., 2007). CD8 + T cells play an important role in PD development. In the early stages of PD, infiltration of the substantia nigra of CD8 + T cells precedes synuclein deposition. The infiltration of cytotoxic CD8 + T cell in the substantia nigra takes place before α-synuclein aggregation and neuronal death, and it parallels the progression of neuronal death and synuclein disease in PD (Galiano-Landeira et al., 2020). Oxidative modification of specific proteins associated with PD (i.e., α-syn nitrification) has been implicated in the generation of new epitopes that initiate peripheral blood-driven CD4 + and CD8 + T cell responses (Benner et al., 2008). CD8 (+) T-cells are mainly expressed in the peripheral immune system of PD patients, while the levels of CD4 (+) CD25 (+) T-cells tend to be low (Baba et al., 2005). The LILRB1 gene is a member of the leukocyte immunoglobulin-like receptor (LIR) family, which is present in the gene cluster 19Q13.4 in the chromosome (Truong et al., 2019). The receptor is expressed on immune cells, binds to MHC class I molecules on antigen-presenting cells, and transduces negative signals that inhibit stimulation of immune response. Activation of LIR suppresses NKR expression in late differentiation of CD8 + T cells (Martínez-Rodríguez et al., 2010).
MBOAT7 encodes a membrane-binding protein, lysophosphatidylinositol transferase 1 (LPIAT1), which has 472 amino acids and is present in the inner membranes of organelles such as endoplasmic reticulum and mitochondria (Gijón et al., 2008). It is mainly involved in the metabolism of phospholipids, and is not directly involved in the oxidative energy pathway. MBOAT7 regulates free arachidonic acid (AA) in cells by remodeling phospholipids (Dursun et al., 2020). Free AA is up-regulated in the brain of PD animal models, and metabolism-related COX-2 of AA increases (Lee et al., 2010). LPIAT1 regulates the levels of arachidonic acid in phosphatidylinositol, which is necessary for cortical lamination in mice (Lee et al., 2012). MBOAT7 gene mutation or abnormal expression has been associated with mental impairment, epilepsy (Jacher et al., 2019), and changes in MRI signals of the cerebral pallidus (Ozpinar et al., 2021).
The TLE3 gene encodes transcriptional co-repressors belonging to the transduction protein-like enhancer family (Dehni et al., 1995). Members of this family play a role in the Notch signaling pathway, and TLE3 expression is associated with neurogenesis and epithelial differentiation. Inhibition of the Notch signaling pathway is known to alleviate PD symptoms (Wang et al., 2019). Interestingly, DNER-an activator of the NOTCH1 pathway was higher in PD than in atypical parkinsonisms (Santaella et al., 2020). TLE3 is involved in immune regulation, promotes memory B-cell development (Ascoli et al., 2022), and acts as a predictor of peripheral CD4 + T cell depletion (Laidlaw et al., 2020).
The product of SIPA1 gene is the mitogen-induced GTP-activating protein (GAP), which is located in the perinuclear region and affects mitogen-induced cell cycle progression (Wang et al., 2020). It is associated with lymphocyte proliferation (Minato, 1996) and regulation of T-cell function (Ishida et al., 2003). SLC15A3 contributes to the dipeptide transmembrane transporter, participates in dipeptide input across the plasma membrane, and is located in the inner membranes of the cell organelles (He et al., 2018). Studies have shown that SLC15A3 is regulated by various TLRS and plays an important role in regulating TLR4-mediated inflammatory response (Song et al., 2018). RNF24 gene encodes a complete membrane protein containing ring zinc finger. The encoded proteins may interact with multiple transient receptor potential cationic channel subfamily C (TRPC) proteins and regulate their transport and insertion into the plasma membrane (Lussier et al., 2008). RNF24 gene is associated with viral immunity (Samus et al., 2020).
LSP1 is the one with the highest efficacy value among the differentially expressed genes verified by RT-PCR in the model, and its biological function is consistent with the peripheral inflammation of PD, so it’s considered a critical gene among the seven hub genes. We believe that GO and KEGG pathways implicated by models, the more genes are enriched, the more important they are for PD. Therefore, three GO terms and one KEGG pathway are important for PD in our model. They were myeloid cell differentiation, cytokine mediated signaling pathway, actin binding, and osteoclast differentiation. Among them, studies on osteoclasts and PD have increased in recent years (Malik et al., 2021; Hong et al., 2022), which indicates that osteoclasts may be a new research direction for Parkinson’s mechanism or peripheral biomarkers.
The limitation of this study is that the number of cases included in the verification experiment is relatively small. Increasing the number of verification experiment samples may lead to better experimental results. At the same time, there is a lack of in vitro experiments to study the relevant mechanism. In summary, we found seven genes that are potential biomarkers of PD.
5. Conclusion
Our study identified new potential diagnostic biomarkers for PD in peripheral blood and provided insights for developing effective diagnostic and therapeutic strategies for patients with PD.
Data availability statement
The datasets presented in this study can be found in online repositories. The names of the repository/repositories and accession number(s) can be found in the article/supplementary material.
Ethics statement
The studies involving human participants were reviewed and approved by the Ethics Committee or Institutional Review Board of Changde First People’s Hospital (Approval number: 2018-028-01). The patients/participants provided their written informed consent to participate in this study.
Author contributions
ZW: conceptualization, methodology, visualization, software, and writing—original draft. YX: methodology. XZ: writing and editing. YG: editing and funding acquisition. ZH: supervision and funding acquisition. ZJ: validation. All authors contributed to the article and approved the submitted version.
Funding
This study was supported by the National Natural Science Foundation of China (No. 81974213) and General projects of Changde Science and Technology Bureau (No. 2017S031).
Acknowledgments
This study was posted as preprint in SSRN (https://papers.ssrn.com/sol3/papers.cfm?abstract_id=4053375) but has not been peer reviewed or published.
Conflict of interest
The authors declare that the research was conducted in the absence of any commercial or financial relationships that could be construed as a potential conflict of interest.
Publisher’s note
All claims expressed in this article are solely those of the authors and do not necessarily represent those of their affiliated organizations, or those of the publisher, the editors and the reviewers. Any product that may be evaluated in this article, or claim that may be made by its manufacturer, is not guaranteed or endorsed by the publisher.
References
Ascoli, C., Schott, C. A., Huang, Y., Turturice, B. A., Wang, W., Ecanow, N., et al. (2022). Altered transcription factor targeting is associated with differential peripheral blood mononuclear cell proportions in sarcoidosis. Front. Immunol. 13:848759. doi: 10.3389/fimmu.2022.848759
Baba, Y., Kuroiwa, A., Uitti, R. J., Wszolek, Z. K., and Yamada, T. (2005). Alterations of T-lymphocyte populations in Parkinson disease. Parkinsonism Relat. Disord. 11, 493–498.
Benner, E. J., Banerjee, R., Reynolds, A. D., Sherman, S., Pisarev, V. M., Tsiperson, V., et al. (2008). Nitrated alpha-synuclein immunity accelerates degeneration of nigral dopaminergic neurons. PLoS One 3:e1376. doi: 10.1371/journal.pone.0001376
Bostantjopoulou, S., Katsarou, Z., Karakasis, C., Peitsidou, E., Milioni, D., and Rossopoulos, N. (2013). Evaluation of non-motor symptoms in Parkinson’s disease: An underestimated necessity. Hippokratia 17, 214–219.
Chahine, L. M., Stern, M. B., and Chen-Plotkin, A. (2014). Blood-based biomarkers for Parkinson’s disease. Parkinsonism Relat. Disord. 20, S99–S103.
Chen-Plotkin, A. S., Hu, W. T., Siderowf, A., Weintraub, D., Gross, R. G., Hurtig, H. I., et al. (2011). Plasma epidermal growth factor levels predict cognitive decline in Parkinson disease. Ann. Neurol. 69, 655–663.
Dassati, S., Schweigreiter, R., Buechner, S., and Waldner, A. (2021). Celecoxib promotes survival and upregulates the expression of neuroprotective marker genes in two different in vitro models of Parkinson’s disease. Neuropharmacology 194:108378. doi: 10.1016/j.neuropharm.2020.108378
Dehni, G., Liu, Y., Husain, J., and Stifani, S. (1995). T expression correlates with mouse embryonic segmentation, neurogenesis, and epithelial determination. Mech. Dev. 53, 369–381. doi: 10.1016/0925-4773(95)00452-1
Double, K. L., Rowe, D. B., Carew-Jones, F. M., Hayes, M., Chan, D. K., Blackie, J., et al. (2009). Anti-melanin antibodies are increased in sera in Parkinson’s disease. Exp Neurol. 217, 297–301.
Dursun, A., Yalnızoğlu, D., Özgül, R. K., Karlı Oğuz, K., and ücel-Yılmaz, D. Y. (2020). Clinical highlights of a very rare phospolipid remodeling disease due to MBOAT7 gene defect. Am. J. Med. Genet. B Neuropsychiatr. Genet. 183, 3–4. doi: 10.1002/ajmg.b.32762
Falchetti, M., Prediger, R. D., and Zanotto-Filho, A. (2020). Classification algorithms applied to blood-based transcriptome meta-analysis to predict idiopathic Parkinson’s disease. Comput. Biol. Med. 124:103925. doi: 10.1016/j.compbiomed.2020.103925
Farotti, L., Paolini Paoletti, F., Simoni, S., and Parnetti, L. (2020). Unraveling pathophysiological mechanisms of Parkinson’s disease: Contribution of CSF biomarkers. Biomark Insights 15:1177271920964077. doi: 10.1177/1177271920964077
Galiano-Landeira, J., Torra, A., Vila, M., and Bové, J. (2020). CD8 T cell nigral infiltration precedes synucleinopathy in early stages of Parkinson’s disease. Brain 143, 3717–3733. doi: 10.1093/brain/awaa269
Gautier, L., Cope, L., Bolstad, B. M., and Irizarry, R. A. (2004). affy–analysis of affymetrix genechip data at the probe level. Bioinformatics 20, 307–315. doi: 10.1093/bioinformatics/btg405
Gijón, M., Riekhof, W., Zarini, S., Murphy, R., and Voelker, D. (2008). Lysophospholipid acyltransferases and arachidonate recycling in human neutrophils. J. Biol. Chem. 283, 30235–30245. doi: 10.1074/jbc.M806194200
He, L., Wang, B., Li, Y., Zhu, L., Li, P., Zou, F., et al. (2018). The solute carrier transporter SLC15A3 participates in antiviral innate immune responses against herpes simplex virus-1. J. Immunol. Res. 2018:5214187. doi: 10.1155/2018/5214187
Hong, S. J., Jung, S., Jang, J. S., Mo, S., Kwon, J., Kim, M. K., et al. (2022). PARK2 induces osteoclastogenesis through activation of the NF-κB pathway. Mol. Cells 45, 749–760.
Ishida, D., Yang, H., Masuda, K., Uesugi, K., Kawamoto, H., Hattori, M., et al. (2003). Antigen-driven T cell anergy and defective memory T cell response via deregulated Rap1 activation in SPA-1-deficient mice. Proc. Natl. Acad. Sci. U.S.A. 100, 10919–10924. doi: 10.1073/pnas.1834525100
Jacher, J. E., Roy, N., Ghaziuddin, M., and Innis, J. W. (2019). Expanding the phenotypic spectrum of MBOAT7-related intellectual disability. Am. J. Med. Genet. B Neuropsychiatr. Genet. 180, 483–487. doi: 10.1002/ajmg.b.32749
Jin, X., Li, J., Li, W., Wang, X., Du, C., Geng, Z., et al. (2020). Weighted gene co-expression network analysis reveals specific modules and biomarkers in Parkinson’s disease. Neurosci. Lett. 728:134950. doi: 10.1016/j.neulet.2020.134950
Kauffmann, A., Gentleman, R., and Huber, W. (2009). arrayQualityMetrics–a bioconductor package for quality assessment of microarray data. Bioinformatics 25, 415–416. doi: 10.1093/bioinformatics/btn647
Laidlaw, B., Duan, L., Xu, Y., Vazquez, S., and Cyster, J. (2020). The transcription factor Hhex cooperates with the corepressor Tle3 to promote memory B cell development. Nat. Immunol. 21, 1082–1093. doi: 10.1038/s41590-020-0713-6
Langfelder, P., and Horvath, S. (2008). WGCNA: An R package for weighted correlation network analysis. BMC Bioinformatics 9:559. doi: 10.1186/1471-2105-9-559
Lee, H. C., Inoue, T., Sasaki, J., Kubo, T., Matsuda, S., Nakasaki, Y., et al. (2012). LPIAT1 regulates arachidonic acid content in phosphatidylinositol and is required for cortical lamination in mice. Mol. Biol. Cell 23, 4689–4700. doi: 10.1091/mbc.E12-09-0673
Lee, H. J., Bazinet, R. P., Rapoport, S. I., and Bhattacharjee, A. K. (2010). Brain arachidonic acid cascade enzymes are upregulated in a rat model of unilateral Parkinson disease. Neurochem. Res. 35, 613–619. doi: 10.1007/s11064-009-0106-6
Leek, J. T., Johnson, W. E., Parker, H. S., Jaffe, A. E., and Storey, J. D. (2012). The sva package for removing batch effects and other unwanted variation in high-throughput experiments. Bioinformatics 28, 882–883.
Lin, Z., Zhou, L., Li, Y., Liu, S., Xie, Q., Xu, X., et al. (2021). Identification of potential genomic biomarkers for Parkinson’s disease using data pooling of gene expression microarrays. Biomark. Med. 15, 585–595. doi: 10.2217/bmm-2020-0325
Lussier, M. P., Lepage, P. K., Bousquet, S. M., and Boulay, G. (2008). RNF24, a new TRPC interacting protein, causes the intracellular retention of TRPC. Cell Calcium 43, 432–443. doi: 10.1016/j.ceca.2007.07.009
Malik, A. U., Karapetsas, A., Nirujogi, R. S., Mathea, S., Chatterjee, D., Pal, P., et al. (2021). Deciphering the LRRK code: LRRK1 and LRRK2 phosphorylate distinct rab proteins and are regulated by diverse mechanisms. Biochem. J. 478, 553–578. doi: 10.1042/BCJ20200937
Martínez-Rodríguez, J. E., Saez-Borderías, A., Munteis, E., Romo, N., Roquer, J., and ópez-Botet, M. L. (2010). Natural killer receptors distribution in multiple sclerosis: Relation to clinical course and interferon-beta therapy. Clin. Immunol. 137, 41–50. doi: 10.1016/j.clim.2010.06.002
Mayo, S., Benito-León, J., Peña-Bautista, C., Baquero, M., and Cháfer-Pericás, C. (2021). Recent Evidence in epigenomics and proteomics biomarkers for early and minimally invasive diagnosis of Alzheimer’s and Parkinson’s diseases. Curr. Neuropharmacol. 19, 1273–1303. doi: 10.2174/1570159X19666201223154009
McGeer, P., Itagaki, S., Boyes, B., and McGeer, E. (1988). Reactive microglia are positive for HLA-DR in the substantia nigra of Parkinson’s and Alzheimer’s disease brains. Neurology 38, 1285–1291. doi: 10.1212/wnl.38.8.1285
Minato, N. (1996). [Regulatory mechanisms of lymphocyte proliferation: Roles of Spa-1 gene]. Hum. Cell 9, 11–16.
Nicastro, N., Nencha, U., Burkhard, P. R., and Garibotto, V. (2021). Dopaminergic imaging in degenerative parkinsonisms, an established clinical diagnostic tool. J. Neurochem. [Epub ahead of print]. doi: 10.1111/jnc.15561
Ozpinar, E., Kaytan, I., Topcu, Y., Kılıc, B., and Aydin, K. (2021). a rare cause of globus pallidus and dentate nucleus hyperintensity in childhood: MBOAT mutation. Neurol. India 69, 1838–1840. doi: 10.4103/0028-3886.333478
Pajares, M., Rojo, A. I., Manda, G., Boscá, L., and Cuadrado, A. (2020). Inflammation in Parkinson’s disease: Mechanisms and therapeutic implications. Cells 9:1687.
Palker, T. J., Fong, A. M., Scearce, R. M., Patel, D. D., and Haynes, B. F. (1998). Developmental regulation of lymphocyte-specific protein 1 (LSP1) expression in thymus during human T-cell maturation. Hybridoma 17, 497–507. doi: 10.1089/hyb.1998.17.497
Qiang, J. K., Wong, Y. C., Siderowf, A., Hurtig, H. I., Xie, S. X., Lee, V. M., et al. (2013). Plasma apolipoprotein A1 as a biomarker for Parkinson disease. Ann. Neurol. 74, 119–127.
Reale, M., Iarlori, C., Thomas, A., Gambi, D., Perfetti, B., Nicola, M. D., et al. (2009). Peripheral cytokines profile in Parkinson’s disease. Brain Behav. Immun. 23, 55–63.
Robin, X., Turck, N., Hainard, A., Tiberti, N., Lisacek, F., Sanchez, J. C., et al. (2011). pROC: An open-source package for R and S+ to analyze and compare ROC curves. BMC Bioinformatics 12:77. doi: 10.1186/1471-2105-12-77
Samus, M., Li, Y. T., Sorokin, L., Rottner, K., and Vestweber, D. (2020). Actin-binding protein cortactin promotes pathogenesis of experimental autoimmune encephalomyelitis by supporting leukocyte infiltration into the central nervous system. J. Neurosci. 40, 1389–1404. doi: 10.1523/JNEUROSCI.1266-19.2019
Santaella, A., Kuiperij, H. B., van Rumund, A., Esselink, R., van Gool, A. J., Bloem, B. R., et al. (2020). Inflammation biomarker discovery in Parkinson’s disease and atypical parkinsonisms. BMC Neurol. 20:26. doi: 10.1186/s12883-020-1608-8
Shamir, R., Klein, C., Amar, D., Vollstedt, E. J., Bonin, M., Usenovic, M., et al. (2017). Analysis of blood-based gene expression in idiopathic Parkinson disease. Neurology 89, 1676–1683.
Song, F., Yi, Y., Li, C., Hu, Y., Wang, J., Smith, D. E., et al. (2018). Regulation and biological role of the peptide/histidine transporter SLC15A3 in Toll-like receptor-mediated inflammatory responses in macrophage. Cell Death Dis. 9:770. doi: 10.1038/s41419-018-0809-1
Truong, A. D., Hong, Y., Lee, J., Lee, K., Tran, H. T., Dang, H. V., et al. (2019). Chicken novel leukocyte immunoglobulin-like receptor subfamilies B1 and B3 are transcriptional regulators of major histocompatibility complex class I genes and signaling pathways. Asian Australas. J. Anim. Sci. 32, 614–628. doi: 10.5713/ajas.18.0561
Wang, N., Weng, J., Xia, J., Zhu, Y., Chen, Q., Hu, D., et al. (2020). SIPA1 enhances SMAD2/3 expression to maintain stem cell features in breast cancer cells. Stem Cell Res. 49:102099. doi: 10.1016/j.scr.2020.102099
Wang, Y., Zhou, Y., Wang, X., Zhen, F., Chen, R., Geng, D., et al. (2019). Osthole alleviates MPTP-induced Parkinson’s disease mice by suppressing notch signaling pathway. Int. J. Neurosci. 129, 833–841. doi: 10.1080/00207454.2019.1573171
Weisskopf, M., O’Reilly, E., Chen, H., Schwarzschild, M., and Ascherio, A. (2007). Plasma urate and risk of Parkinson’s disease. Am. J. Epidemiol. 166, 561–567.
Wu, Y., Zhan, L., Ai, Y., Hannigan, M., Gaestel, M., Huang, C. K., et al. (2007). MAPKAPK2-mediated LSP1 phosphorylation and FMLP-induced neutrophil polarization. Biochem. Biophys. Res. Commun. 358, 170–175. doi: 10.1016/j.bbrc.2007.04.104
Xia, Y., Lei, C., Yang, D., and Luo, H. (2020). Identification of key modules and hub genes associated with lung function in idiopathic pulmonary fibrosis. PeerJ. 8:e9848. doi: 10.7717/peerj.9848
Yanamandra, K., Gruden, M., Casaite, V., Meskys, R., Forsgren, L., and Morozova-Roche, L. (2011). α-synuclein reactive antibodies as diagnostic biomarkers in blood sera of Parkinson’s disease patients. PLoS One 6:e18513. doi: 10.1371/journal.pone.0018513
Keywords: Parkinson’s disease, WGCNA, LASSO regression, potential diagnostic predictor, computational approach
Citation: Wu Z, Hu Z, Gao Y, Xia Y, Zhang X and Jiang Z (2023) A computational approach based on weighted gene co-expression network analysis for biomarkers analysis of Parkinson’s disease and construction of diagnostic model. Front. Comput. Neurosci. 16:1095676. doi: 10.3389/fncom.2022.1095676
Received: 11 November 2022; Accepted: 23 December 2022;
Published: 10 January 2023.
Edited by:
Liaqat Ali, University of Science and Technology Bannu, PakistanReviewed by:
Lufeng Zheng, China Pharmaceutical University, ChinaXingru Zhao, Beijing QuantiHealth Technology Co., Ltd., China
Xiaowei Ma, Chinese Academy of Sciences (CAS), China
Copyright © 2023 Wu, Hu, Gao, Xia, Zhang and Jiang. This is an open-access article distributed under the terms of the Creative Commons Attribution License (CC BY). The use, distribution or reproduction in other forums is permitted, provided the original author(s) and the copyright owner(s) are credited and that the original publication in this journal is cited, in accordance with accepted academic practice. No use, distribution or reproduction is permitted which does not comply with these terms.
*Correspondence: Zheng Jiang,  emhlbmdqaWFuZzE4N0Bjc3UuZWR1LmNu
 Zhaoping Wu
 Zhiping Hu
 Yunchun Gao2
 Xiaobo Zhang
 Zheng Jiang