 Mei Yang
 Hailing Yang
 Lang Shen
 Tonghui Xu
94% of researchers rate our articles as excellent or good
Learn more about the work of our research integrity team to safeguard the quality of each article we publish.
Find out more
ORIGINAL RESEARCH article
Front. Neural Circuits, 04 April 2025
Volume 19 - 2025 | https://doi.org/10.3389/fncir.2025.1567036
This article is part of the Research TopicBrain Cell Types, Circuits and DisordersView all 7 articles
The orbitofrontal cortex (ORB) exhibits a complex structure and diverse functional roles, including emotion regulation, decision-making, and reward processing. Structurally, it comprises three distinct regions: the medial part (ORBm), the ventrolateral part (ORBvl), and the lateral part (ORBl), each with unique functional attributes, such as ORBm’s involvement in reward processing, ORBvl’s regulation of depression-like behavior, and ORBl’s response to aversive stimuli. Dysregulation of the ORB has been implicated in various psychiatric disorders. However, the neurocircuitry underlying the functions and dysfunctions of the ORB remains poorly understood. This study employed recombinant adeno-associated viruses (rAAV) and rabies viruses with glycoprotein deletion (RV-ΔG) to retrogradely trace monosynaptic inputs to three ORB subregions in male C57BL/6J mice. Inputs were quantified across the whole brain using fluorescence imaging and statistical analysis. Results revealed distinct input patterns for each ORB subregion, with significant contributions from the isocortex and thalamus. The ORBm received prominent inputs from the prelimbic area, agranular insular area, and hippocampal field CA1, while the ORBvl received substantial intra-ORB inputs. The ORBl exhibited strong inputs from the somatomotor and somatosensory areas. Thalamic inputs, particularly from the mediodorsal nucleus and submedial nucleus of the thalamus, were widespread across all ORB subregions. These findings provide novel insights into the functional connectivity of ORB subregions and their roles in neural circuit mechanisms underlying behavior and psychiatric disorders.
The orbitofrontal cortex (ORB) is situated near the eye socket, in the antero-inferior section of the frontal lobe. It plays a vital role in rewards processing, emotional regulation, and decision-making (Yang et al., 2019; Padoa-Schioppa and Assad, 2006; Salzman and Fusi, 2010; Rolls, 2023). It comprises three distinct subregions: the medial (ORBm), ventrolateral (ORBvl), and lateral (ORBl) parts, each with unique contributions. Research has revealed functional heterogeneity between the ORBm and ORBl in decision-making and visual reversal learning. For instance, rats with ORBm lesions show reduced impulsivity, while rats with ORBl lesions show increased impulsivity (Mar et al., 2011). Inactivation of the ORBl impairs serial visual reversal learning due to perseveration errors, whereas ORBm inactivation enhances it by reducing perseveration (Hervig et al., 2020). Each subregion of the ORB demonstrates unique functions. The ORBm is typically involved in anticipating and evaluating rewards (Critchley and Rolls, 1996; Padoa-Schioppa and Assad, 2006), whereas the ORBl plays a crucial role in processing punishment during rewards-related tasks, with the ORBI’s activation level mirroring punishment severity (O’Doherty et al., 2001). When faced with multiple options, the ORBvl contributes to precise decision-making by relaying information to the dorsomedial striatum (Gore et al., 2023).
The ORB fulfills a range of intricate and diverse functions, and its dysregulation has been directly linked to the onset of various psychiatric disorders, such as major depression (Baxter et al., 1987; Sheng et al., 2020; Zhao et al., 2017), schizophrenia (Núñez et al., 2024), parkinsonism (du Plessis et al., 2018), and obsessive-compulsive disorder (OCD) (Beucke et al., 2013). For example, individuals with schizophrenia show a marked decrease in regional cerebral blood flow within the right ORB (Kanahara et al., 2013). Patients with parkinsonism exhibit impaired ORB activation during both rewards anticipation and outcome processing (du Plessis et al., 2018). The connection between OCD and ORB abnormalities has also become increasingly clear. Patients with OCD have been shown to have reduced ORB volumes and higher ORB metabolic rates (Choi et al., 2004; Baxter et al., 1987). Collectively, these findings underscore a strong correlation between ORB abnormalities and the emergence and progression of some disorders, suggesting that the ORB may be a promising target for treatment.
Given the complexity and significance of ORB function, its neural connections within the brain have been the focus of numerous studies. Rodent research has extensively explored ORB projections using various tracing techniques, revealing widespread targets excluding the hippocampus and cerebellum. These include the primary olfactory cortex (Babalian et al., 2019), piriform cortex (Illig, 2005), caudate putamen (Schilman et al., 2008), amygdala (McDonald et al., 1996), extended amygdala (Reynolds and Zahm, 2005), submedial thalamic nucleus (SMT) and mediodorsal thalamic nuclei (MD) (Yoshida et al., 1992; Reep et al., 1996), parafascicular nucleus (Jones and Leavitt, 1974), claustrum (Zhang et al., 2001), lateral hypothalamus (Hardy, 1994), periaqueductal gray (Hardy, 1986; Babalian et al., 2019), and oculomotor complex (Leichnetz et al., 1987). Concurrently, the ORB integrates diverse inputs from sensory, limbic, and thalamic regions. Anterograde tracing has shown rostral basolateral amygdala nucleus (BLA) projections to ORBl (Kita and Kitai, 1990), while retrograde studies have highlighted subregion-specific thalamocortical connectivity: ORBvl receives dense inputs from the insular cortex and somatosensory areas, whereas ORBm prefers connectivity with the cingulate and posterior parietal cortices. Thalamic afferents are organized subregion-specifically, with ORBvl innervated by the SMT and ORBm/ORBl by the periphery of SMT and specific MD segments (Reep et al., 1996). Recent rodent studies have identified novel pathways, such as postrhinal cortex inputs to ORBvl and reciprocal connectivity between the lateral agranular part of the retrosplenial area (RSPagl) and ORBm (Qi et al., 2019; Xiang et al., 2023). Insular cortex projections preferentially target medial and lateral ORB, sparing ventral subregions (Mathiasen et al., 2023).
In recent years, research on ORB neural circuits has deepened. In 2021, the retrograde tracer cholera toxin subunit B was used to label projections into different ORB subregions, revealing distinct projection patterns from various brain regions to the anterior lateral, posterior lateral, and posterior ventral portions of the ORB (Barreiros et al., 2021). The same year, combining neuronal sparse and bright labeling with whole-brain fluorescence imaging yielded an uninterrupted 3D whole-brain dataset, enabling the morphological reconstruction of 25 ORB pyramidal neurons and revealing divergent projection patterns for information delivery across cortical layers (Wang et al., 2021). In 2022, efferent projections from the five ORB divisions to the thalamus (TH) were studied, demonstrating distinct projection patterns for each division (Vertes et al., 2023). In 2023, inputs to five types of projection-specific ORB neurons and outputs to two types of inhibitory neurons were mapped, revealing that similar cortical and thalamic regions innervate different projection-defined ORB neurons (Zhang et al., 2024).
However, many of these studies, particularly input studies, have relied on traditional tracing strategies that cannot achieve monosynaptic retrograde cellular-level labeling across single synapses like RV. Additionally, they often lack ORB subregion labeling and quantitative brain-wide comparisons. Therefore, our objective is to conduct a quantitative analysis and comparison of whole-brain inputs to various ORB subregions, delineating their similarities and differences and providing new insights into the neural circuit mechanisms underlying their functional characteristics and correlations.
In this study, we employed recombinant adeno-associated viruses (rAAV) and rabies viruses with glycoprotein deletion (RV-ΔG) to achieve retrograde trans-monosynaptic labeling of the ORBm, ORBvl, and ORBl. Fluorescence imaging and detailed quantitative analysis yielded significant insights. Specifically, the ORB subregions receive considerable inputs from both the cerebral cortex (CTX) and TH, with each subregion displaying a distinct pattern of preferential inputs from specific brain areas. These unique input profiles underscore the diverse functional connectivity of the ORB and hint at their potential specialized roles in processing and integrating information within the brain’s complex neural networks.
C57BL/6J male mice (8–12 weeks old, n = 12) were used in this study. These mice were housed under standardized conditions (12 h of light/12 h of darkness, temperature: 21–24°C, humidity: 50%–60%), with free access to food and water. All animal experiments were approved by the Laboratory Animal Center, Fudan University.
The mice were fixed in a stereotaxic apparatus (RWD, China) under anesthesia with isoflurane. All viral tools used in this study were packaged and provided by Brain VTA (China). We mixed the rAAV-hSyn-RG-WPRE-hGB-polyA (titer: 5.47E + 12 vg/ml) and rAAV-hSyn-His-EGFP-2a-TVA-WPRE (titer: 3.21E + 12 vg/ml) in a ratio of 1:1. After drilling a hole in the skull above the target ORB subregion of the right brain, 10 nL of mixed AAV viruses was injected into the target ORB subregion (ORBm, A/P: 2.40 mm, M/L: –0.20 mm, D/V: –2.50 mm; ORBvl, A/P: 2.40 mm, M/L: –0.75 mm, D/V: –2.50 mm; ORBl, A/P: 2.50 mm, M/L: –1.45 mm, D/V: –2.50 mm). A total of 2 weeks later, the same coordinate was injected with 150 nL of RV-CVS-EnvA-N2C(ΔG)-tdTomato (titer: 2.00E + 08 IFU/ml). The virus injection was performed at a rate of 10 nL/min. After the injection, the pipette was held for 10 min before being slowly retracted from the brain to prevent backflow of the virus.
A total of 1 week after the RV virus injection, mice were perfused transcardially with 0.01 M phosphate-buffered saline (PBS), followed by 4% paraformaldehyde (PFA). The perfused brain was removed from the skull and stored in 4% PFA at 4°C overnight. Brains were then embedded with agarose. In our study, the entire mouse brain was sectioned coronally, spanning from +6.0 mm anterior to –8.5 mm posterior relative to bregma, to ensure comprehensive coverage of all potential input regions. Serial sections (50 μm thickness) were cut with VT1200S vibratome (Leica Biosystems, Germany), and every second section was systematically selected for imaging and quantitative analysis to balance resolution with sampling efficiency. All sections were coverslipped using glycerol.
For fluorescence imaging, we acquired overview images of the brain with a 10× objective on a fluorescence scanner (Nikon Ni-E, Japan) or high-magnification images on a confocal microscope (Olympus FV3000, Japan). Imaging utilized two channels: the 575 nm laser line was used to image the tdTomato channel for cells located outside the injection site, and the 488 nm and 575 nm laser lines were used to image the EGFP and tdTomato channels for cells at the injection site. The image post-processing was conducted using ImageJ, Photoshop, and GraphPad Prism software.
We counted the number of cells in each brain region, and excluded cells only showing red in the target ORB subregion. Brain regions are divided according to the Allen Mouse Brain Atlas (Wang Q. et al., 2020). All related subregions and their abbreviations are listed in Table 1. The statistical analysis was performed in GraphPad Prism (United States). One-way repeated measures ANOVA and Student’s t-test were used to determine the significance of the effect. Data were expressed as the Mean ± SEM. P < 0.05 was considered to be statistically significant. *P < 0.05, **P < 0.01, ***P < 0.001.
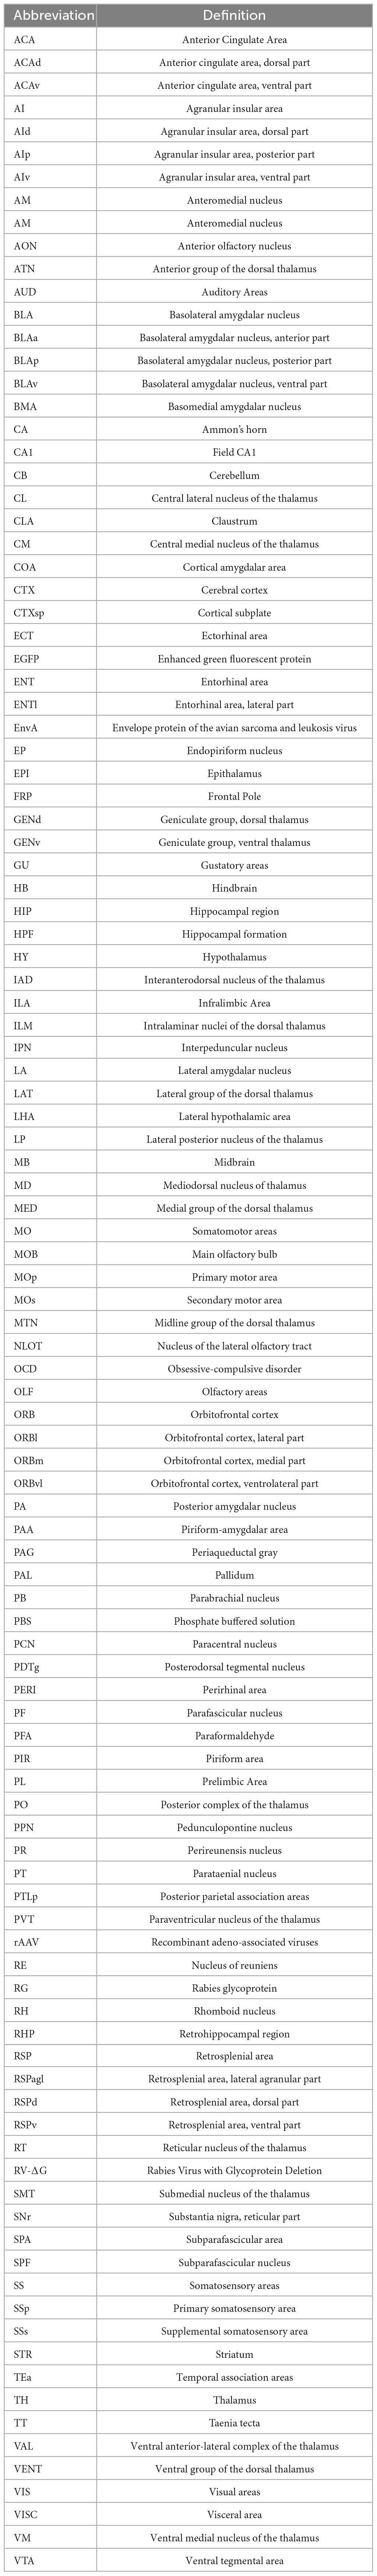
Table 1. Abbreviations.
Our primary objective was to identify the neurons that participate in monosynaptic upstream connections with distinct subregions of the ORB. We employed rAAV-hSyn-RG-WPRE-hGB-polyA (AAV-RG), rAAV-hSyn-His-EGFP-2a-TVA-WPRE (AAV-EGFP-TVA), and RV-CVS-EnvA-N2C(ΔG)-tdTomato (RV-ΔG) vectors to map these connections (Figure 1A). RV-ΔG, a pivotal retrograde tracer, plays a crucial role in delineating neural circuits across monosynaptic connections (Ohara et al., 2013; Gehrlach et al., 2020; Watabe-Uchida et al., 2012; Masaki et al., 2022). This virus initiates an interaction between the envelope protein of the avian sarcoma and leukosis virus (EnvA) and the TVA receptor to infect cells, subsequently traversing synaptic junctions through the utilization of the rabies glycoprotein (RG). We initially injected two AAV viruses into the target ORB subregion. One AAV expressed TVA, allowing RV-ΔG to recognize and infect cells, while the other encoded the RG, enabling RV-ΔG to traverse a single synapse. Following a 2 weeks incubation period, we administered RV-ΔG into the same ORB subregion, which allowed us to identify the upstream neurons that participated in monosynaptic connections with each ORB subregion (Figure 1B). This approach enabled us to identify and trace the neural pathways underlying the complex connectivity of the ORB subregions.
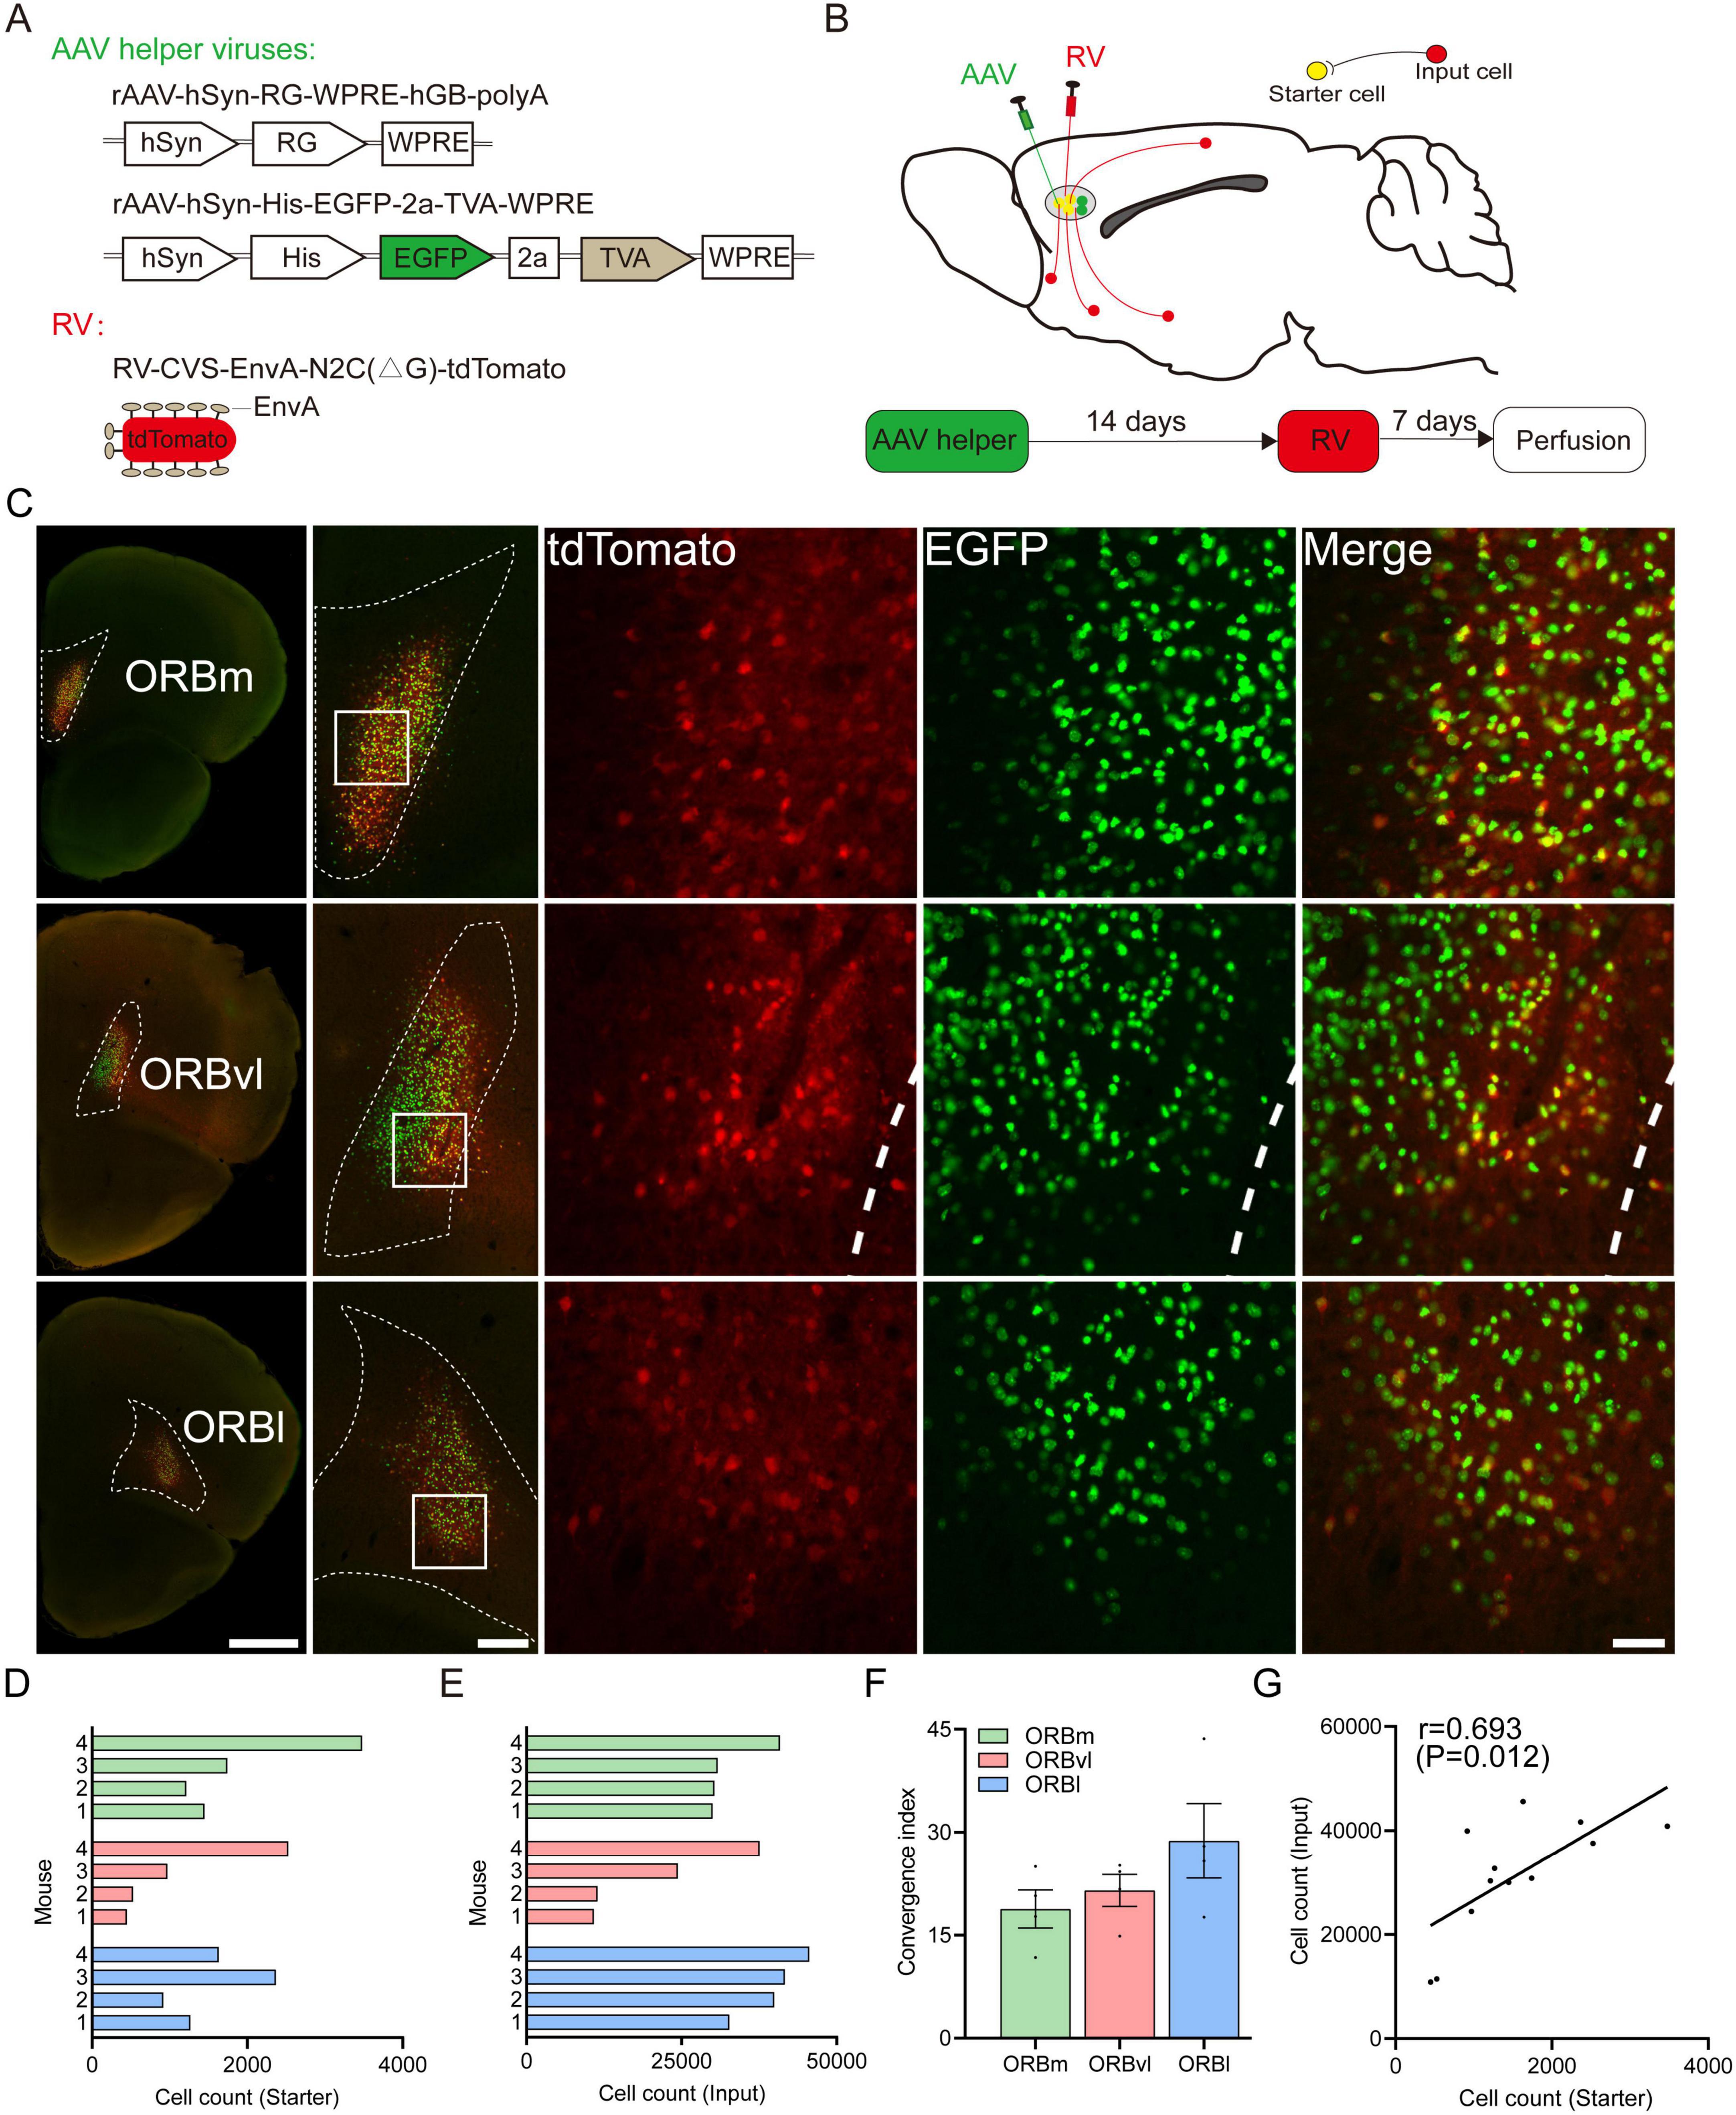
Figure 1. Experimental strategy for identifying monosynaptic inputs to three the orbitofrontal cortex (ORB) subregions. (A) Viral vector design of recombinant adeno-associated viruses (rAAV) and rabies viruses with glycoprotein deletion (RV-ΔG) viruses. (B) Schematic illustration of retrograde trans-synaptic tracing and the experimental timeline. (C) Representative coronal brain sections showing starter cells in the ORB subregions. Scale bars, from left to right, 1,000, 250, 50 μm. (D) Number of starter cells in the medial part (ORBm), the ventrolateral part (ORBvl), and the lateral part (ORBl), respectively (n = 4 mice/group). (E) Number of input cells in the ORB subregions (n = 4 mice/group). (F) Ratio between the number of input cells and starter cells. Data are presented as the Mean ± SEM (n = 4 mice/group). (G) Linear relationship between the number of starter cells and input cells. For abbreviations, see Table 1.
At the injection site, cells infected with AAV-EGFP-TVA served a dual purpose: they expressed 1) TVA to enable subsequent infection by RV-ΔG and 2) enhanced green fluorescent protein (EGFP), which was a reliable marker for identifying TVA-expressing cells and assessing injection accuracy. The RV-ΔG vector also expressed the red fluorescent protein, tdTomato, which enabled the tracing of upstream neuronal connections. When neurons were co-infected with AAV-EGFP-TVA and RV-ΔG, they exhibited yellow fluorescence due to the concurrent expression of EGFP and tdTomato. As such, they were identified as starter cells. Within these starter cells, the RV-ΔG virus continued to replicate and spread in a retrograde trans-synaptic manner, which labeled upstream neurons with red fluorescence. These upstream neurons were identified as input cells (Figure 1B). Notably, our experiments demonstrated that over 85% of starter cells were confined to their target regions (Figure 1C), demonstrating the precision and efficacy of our viral injection technique.
We conducted qualitative and quantitative analyses of these input cells to identify the whole-brain input patterns of the ORB subregions. We started by counting the number of starter cells within each ORB subregion, respectively (Figures 1D, E). The ratios of input cells to starter cells varied significantly across the subregions (ORBm: 18.80 ± 2.79, ORBvl: 21.50 ± 2.33, ORBl: 28.75 ± 5.44, Figure 1F). However, a robust and consistent correlation was observed between the number of input cells and starter cells of all animal samples (Figure 1G), validating the reliability of our data despite sample variations.
We analyzed the brain-wide input distribution to the ORB subregions by quantifying the input intensity originating from the ipsilateral and contralateral brain areas vis-a-vis our injection sites. The ORB subregions received strong inputs from multiple brain regions, with the majority originating from the ipsilateral side (Figure 2). To validate the precision of viral targeting, representative EGFP fluorescence images of the injection sites for all three samples shown in Figure 2 are provided in Supplementary Figure 1. Specifically, the ipsilateral side provided 76.96 ± 0.96%, 75.24 ± 3.74%, and 67.50 ± 3.68% of the total inputs to the ORBm, ORBvl, and ORBl, respectively. The input neurons received by ORBm, ORBvl, and ORBl are not randomly distributed. They are primarily located in the ipsilateral cerebral cortex and TH region, while the contralateral input neurons are predominantly distributed in the contralateral ORB (Supplementary Figure 2).
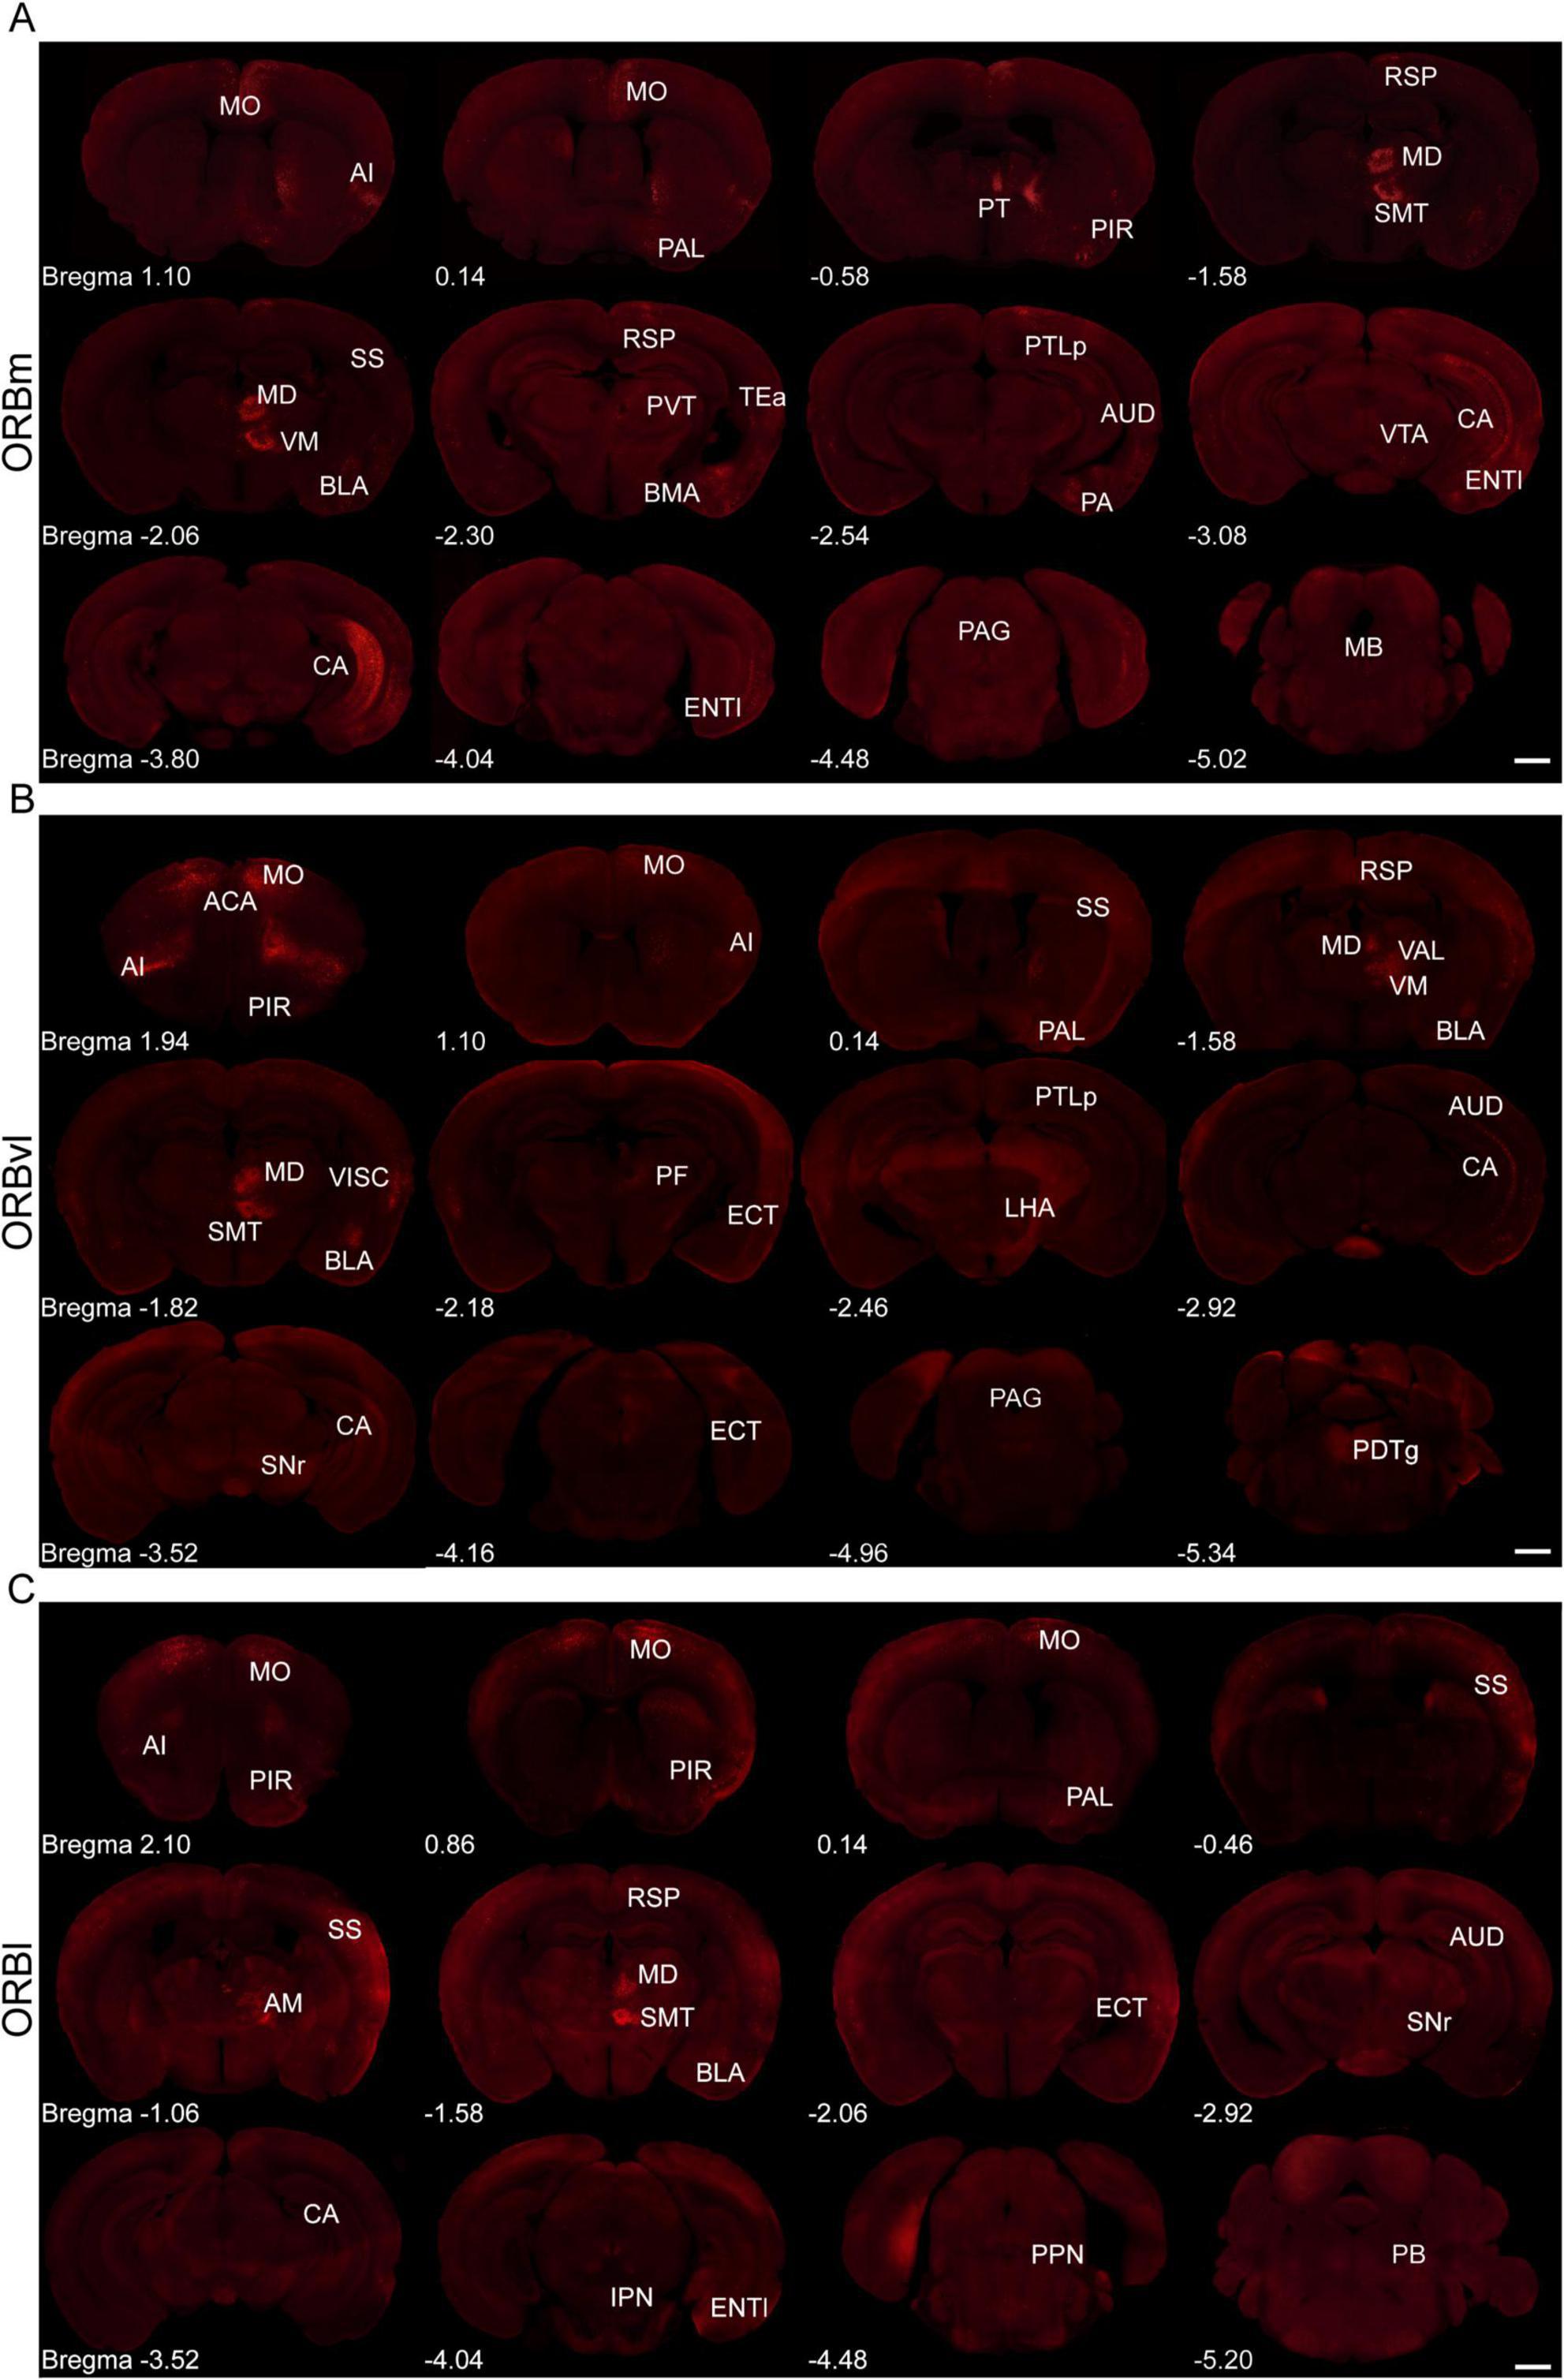
Figure 2. Representative fluorescence images depicting input cells within whole-brain regions for the medial part (ORBm), the ventrolateral part (ORBvl), and the lateral part (ORBl) groups. (A–C) Representative fluorescence images of the ORBm, ORBvl, and ORBl groups (Scale bar, 1,000 μm).
The ORB received (Table 2) inputs of varying intensities from 167 distinct brain regions, which can be grouped into 11 major areas: the isocortex, olfactory areas (OLF), hippocampal formation (HPF), cortical subplate (CTXsp), TH, pallidum (PAL), striatum (STR), hypothalamus (HY), midbrain (MB), hindbrain (HB), and cerebellum (CB) (Figure 3). The input patterns observed in the ORB subregions exhibited certain similarities. The isocortex emerged as the predominant input region, accounting for over half of the total inputs. The isocortex was followed by the TH, which contributed approximately 15%. There were relatively fewer inputs from the PAL, STR, HY, and MB, all with comparable intensity. The three ORB subregions also exhibited input patterns that were significantly different from one another. For example, the ORBm received considerably more inputs from the HPF, CTXsp, STR, and HY compared to the ORBvl or ORBl (Figure 3, P < 0.01). Since the primary inputs to the ORB originated from the CTX (through the isocortex, OLF, HPF, and CTXsp), and TH, we subsequently focused our analysis on these brain regions.

Table 2. The list of 167 brain regions projecting to the orbitofrontal cortex (ORB).
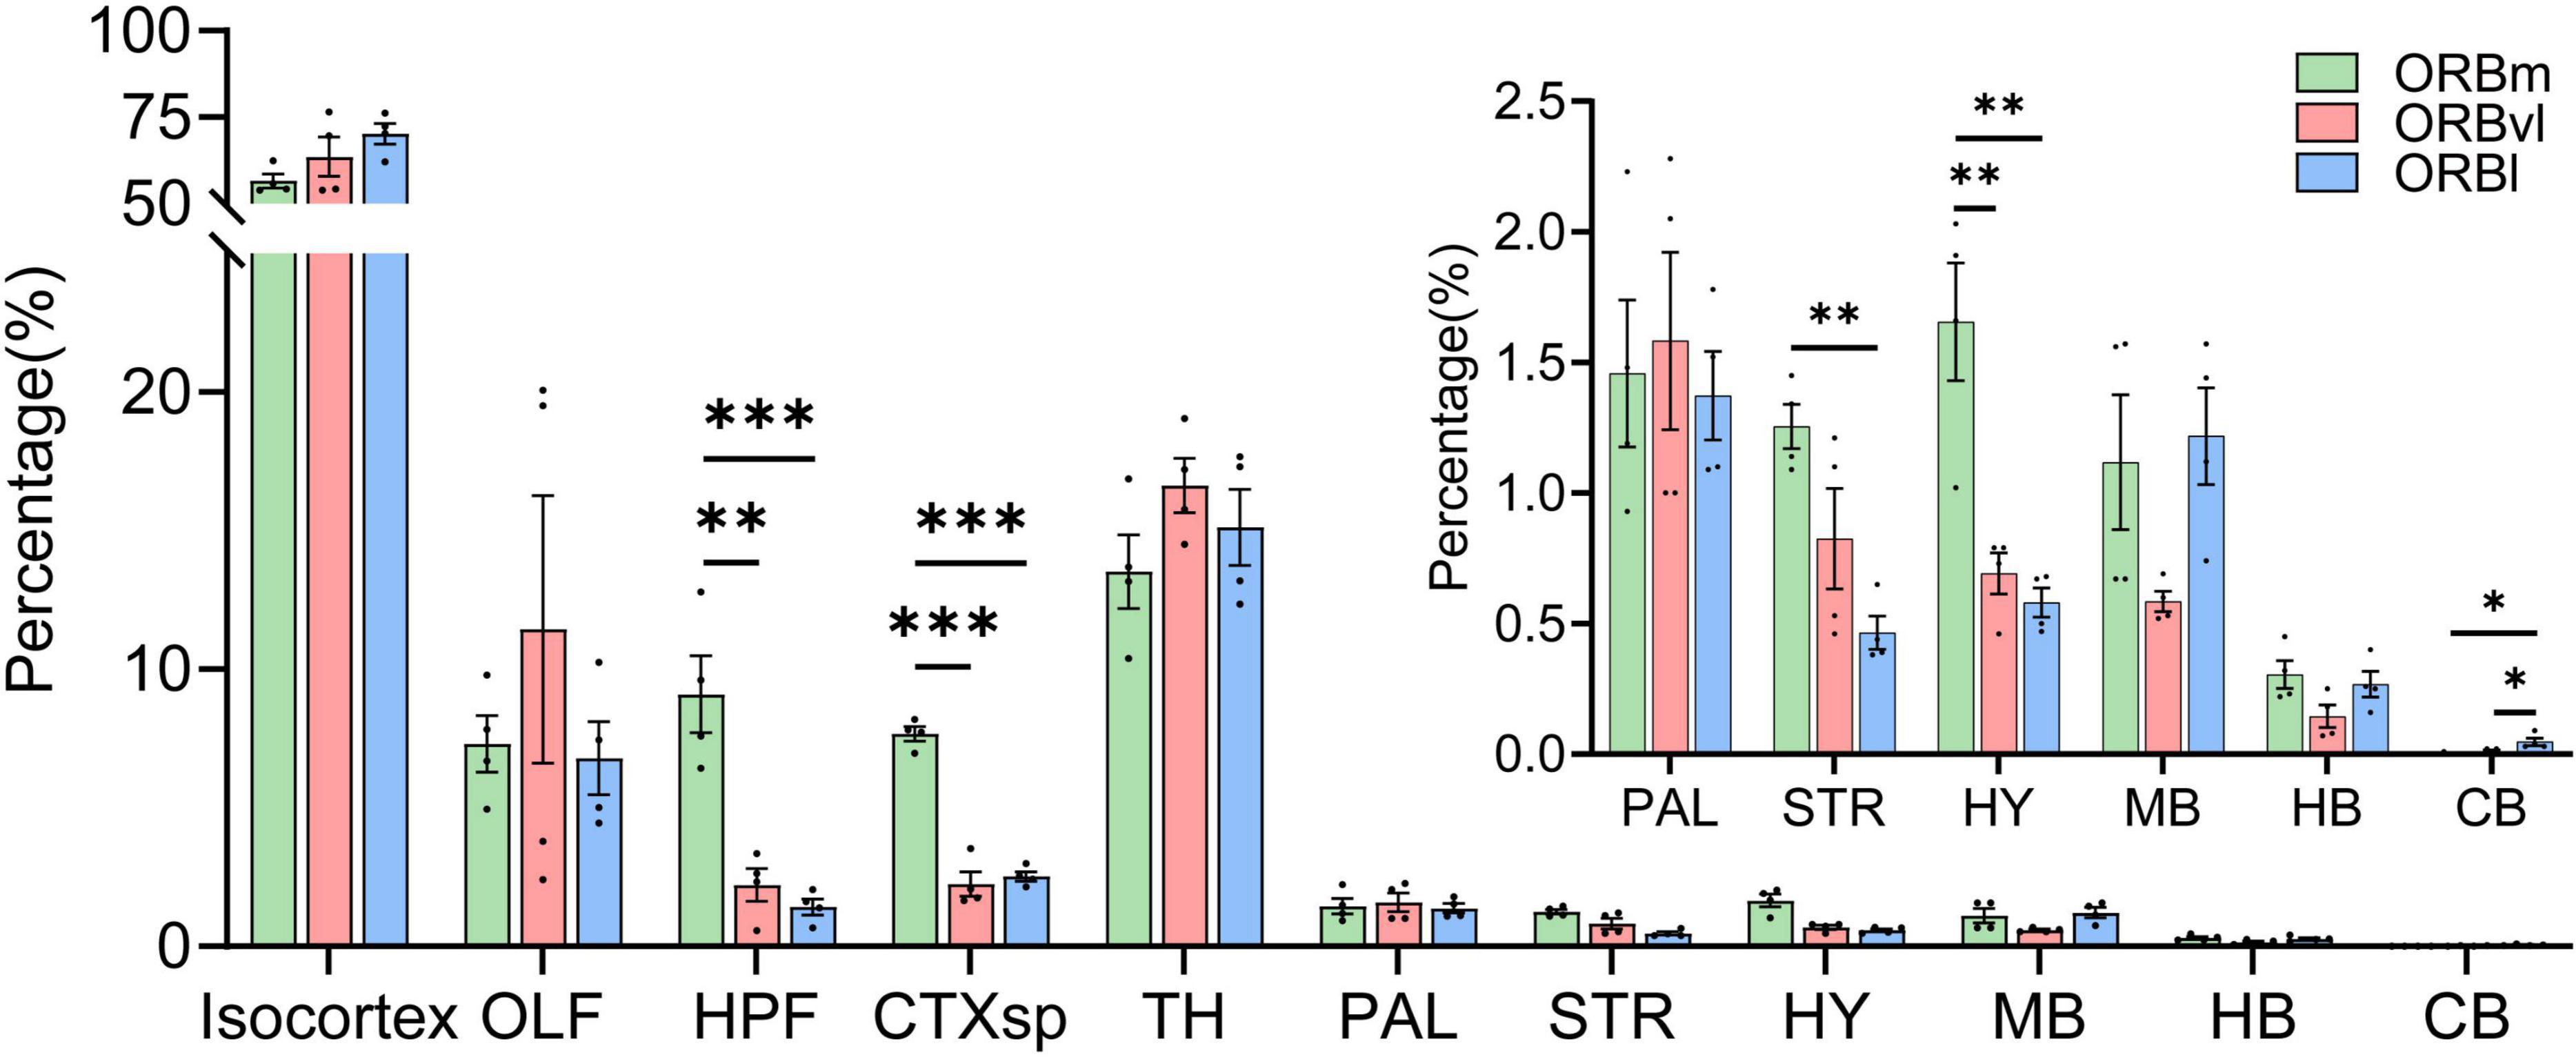
Figure 3. Distribution of input cells projecting to the orbitofrontal cortex (ORB) subregions. *P < 0.05, **P < 0.01, ***P < 0.001. Data are presented as the Mean ± SEM (n = 4 mice/group). One-way ANOVA combined with Tukey’s multiple comparisons test.
We identified 38 regions within the CTX that projected into the ORB. Seventeen of these regions originated from the isocortex, whereas nine, six, and six originated from the OLF, HPF, and CTXsp, respectively. To increase the accuracy and precision of our study, we focused on the 19 cortical regions that each provided > 1% of the input to the ORB subregions (Figure 4A).
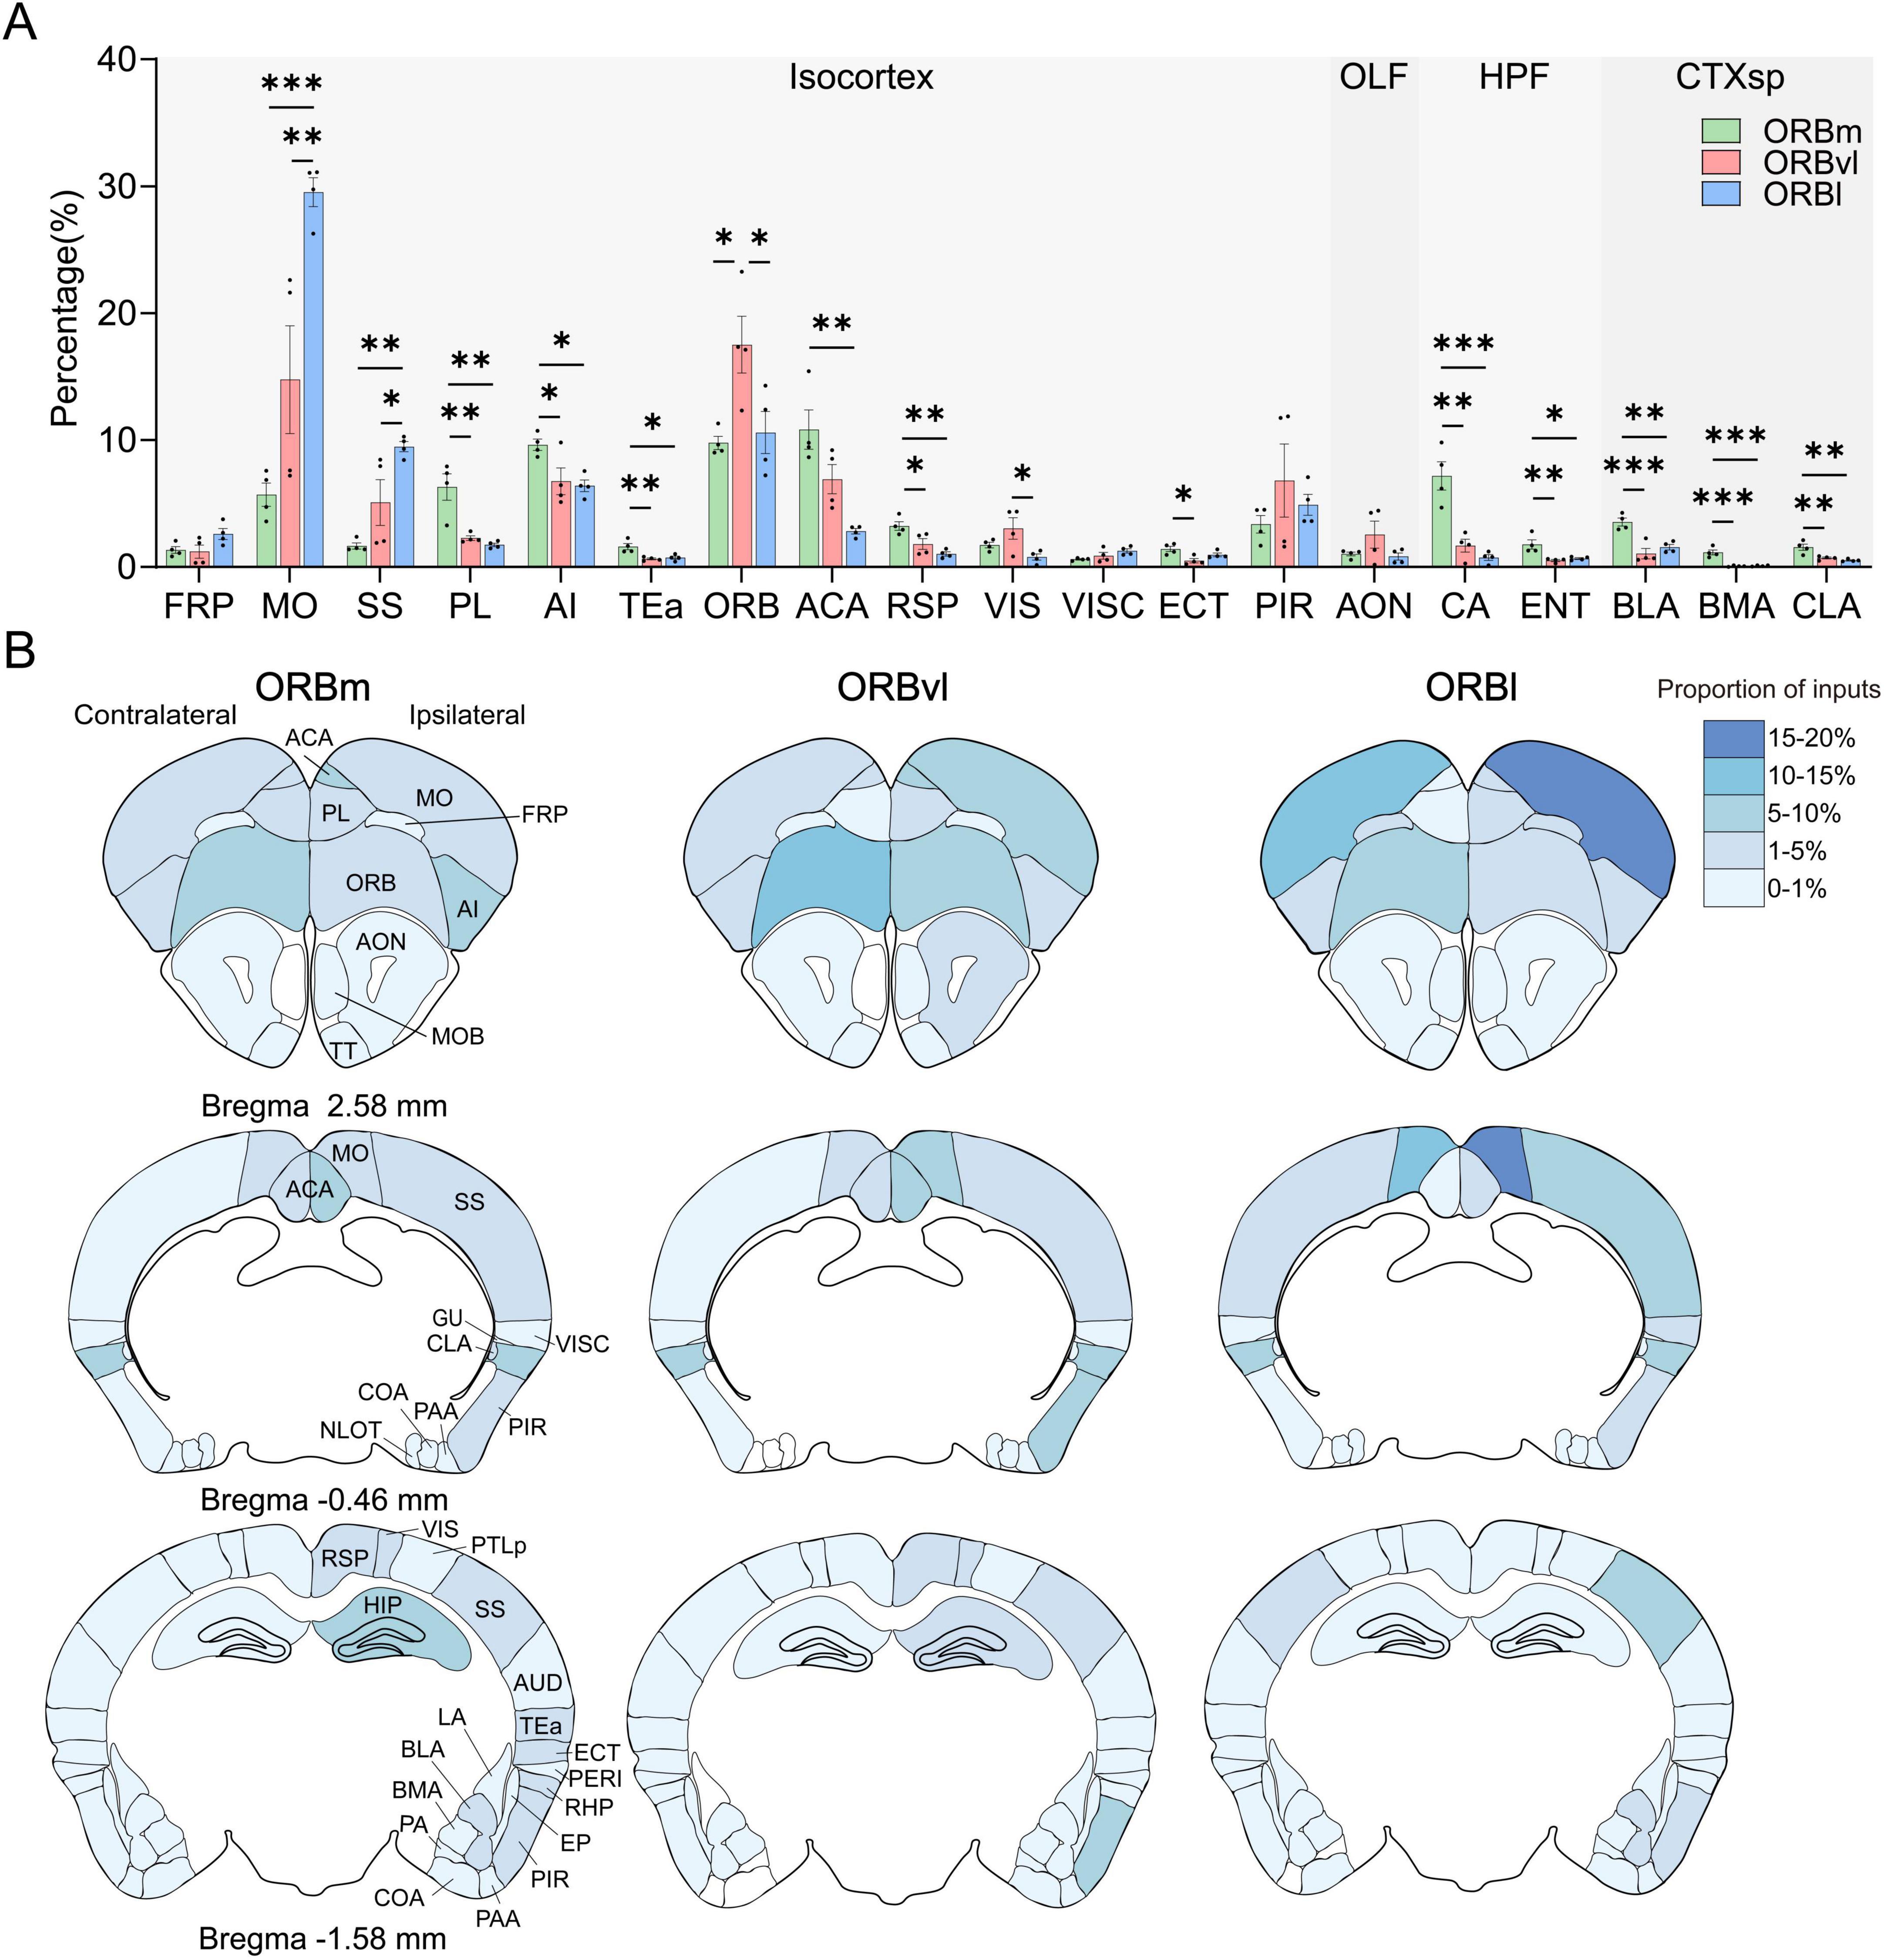
Figure 4. Cerebral cortex (CTX) inputs to the the orbitofrontal cortex (ORB) subregions. (A) Distribution of input cells projecting to the ORB subregions in the CTX. (B) Mean proportion of inputs from different CTX regions to the ORB. The input ratio shown in white is 0%. *P < 0.05, **P < 0.01, ***P < 0.001. Data are presented as the Mean ± SEM (n = 4 mice/group). One-way ANOVA combined with Tukey’s multiple comparisons test.
Distinct cortical brain regions demonstrated preferential connectivity patterns with the ORB. For example, the prelimbic area (PL), agranular insular area (AI), retrosplenial area (RSP), ammon’s horn (CA), and BLA were significantly more likely to provide inputs to the ORBm compared to the ORBvl or ORBl (Figures 4A, P < 0.05). There were also consistent inputs observed from the MO and SS to the ORB subregions, with the highest input directed toward the ORBl, followed by the ORBvl and ORBm (Figures 4A, P < 0.05). The ORB itself provided more inputs toward the ORBvl (Figure 4A, P < 0.05).
We subsequently computed for the number of ipsilateral and contralateral input cells relative to the total number of input cells. Figure 4B illustrates the intensity distribution of inputs to the ORB subregions across the entire brain. The majority of inputs originated from ipsilateral areas, whereas contralateral inputs were predominantly observed in the MO and ORB. Notably, the proportion of inputs from the contralateral ORB to the three ORB subregions surpassed that from the ipsilateral ORB to the same subregions (contralateral ORB-ORBm, ORBvl, ORBl: 6.94 ± 0.28%, 12.47 ± 1.26%, 9.59 ± 1.65%, ipsilateral ORB-ORBm, ORBvl, ORBl: 2.84 ± 0.25%, 5.04 ± 1.01%, 1.00 ± 0.18%, Supplementary Figure 3).
The MO, SS, AI, anterior cingulate area (ACA), RSP, and BLA preferentially provided inputs to the ORB (Figure 5A). Specifically, the primary (MOp), secondary motor areas (MOs), primary (SSp), and supplemental somatosensory areas (SSs) exhibited comparable input tendencies, with the most inputs directed toward the ORBl, followed by the ORBvl and ORBm (Figure 5A). Conversely, the ventral part of the agranular insular area (AIv), the dorsal part of the anterior cingulate area (ACAd), the ventral part of the anterior cingulate area (ACAv), the RSPagl, and the anterior part of the basolateral amygdalar nucleus (BLAa) provided inputs primarily to the ORBm, followed by the ORBvl and ORBl (Figure 5A, P < 0.05). Figure 5B illustrates the bilateral input patterns of these brain subregions to the ORB. There is a notable predominance of the ipsilateral hemisphere (Supplementary Figure 4).
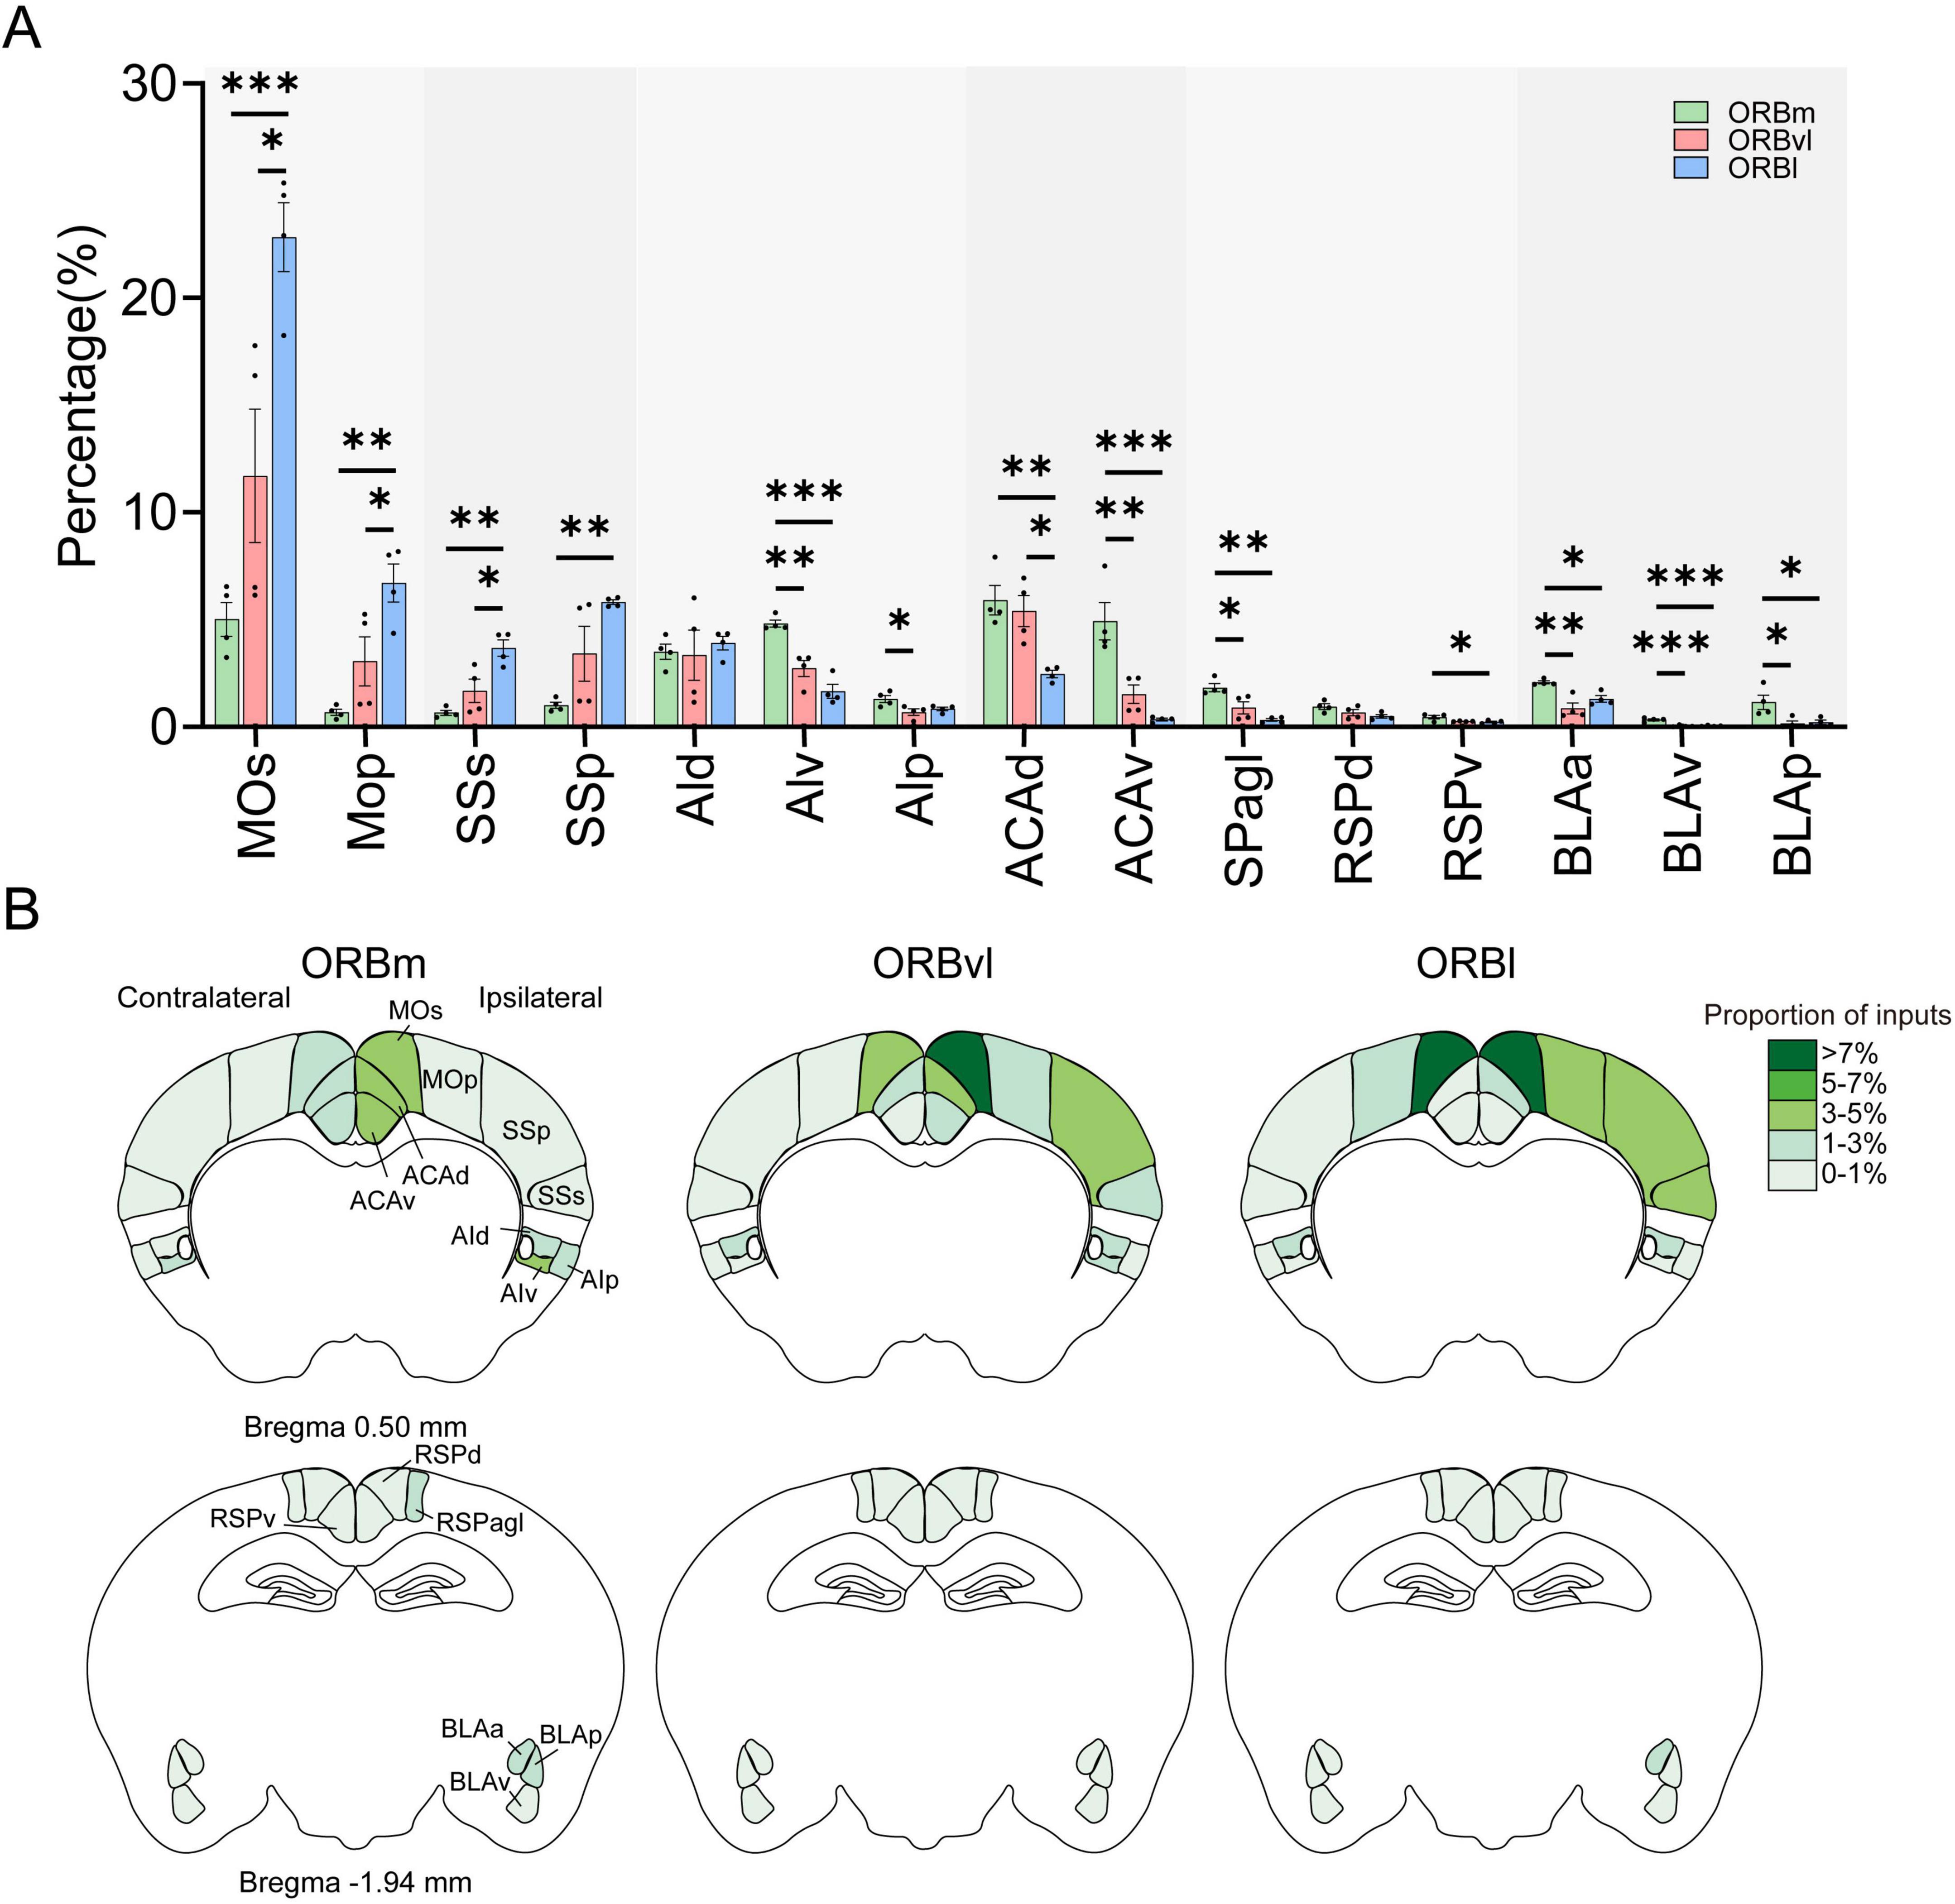
Figure 5. Input cells to the orbitofrontal cortex (ORB) subregions from the MO, SS, AI, ACA, RSP, and BLA. (A) Distribution of input cells projecting to the ORB subregions from the MO, SS, AI, ACA, RSP, and BLA. (B) Mean proportion of inputs to the ORB subregions from the MO, SS, AI, ACA, RSP, and BLA. *P < 0.05, **P < 0.01, ***P < 0.001. Data are represented by the Mean ± SEM (n = 4 mice/group). One-way repeated measures ANOVA followed by Tukey’s multiple comparisons test.
We also conducted a quantitative analysis of the input strength of distinct cortical regions within their respective subregions to the ORB. Some brain subregions exhibited consistent input patterns to the three ORB subregions. For instance, the MOs, ACAd, and BLAa exhibited more intense inputs to each ORB subregion compared to other brain subregions within their respective regions. All other brain subregions exhibited various input patterns to the ORB subregions. For example, the AIv provided the most inputs to the ORBm, followed by the dorsal (AId) and posterior (AIp) parts of the AI. In comparison, the AId provided the most inputs to the ORBl, followed by the AIv and AIp (Supplementary Figure 5).
To further delineate hippocampal inputs to the ORB subregions, we quantified contributions from specific HPF subregions. Over 90% of HPF-derived inputs originated from the Field CA1 (CA1) (ORBm: 77.16 ± 2.65%, ORBvl: 66.16 ± 5.65%, ORBl:46.72 ± 9.16%) and lateral part of the entorhinal area (ENTl) (ORBm: 19.43 ± 2.86%, ORBvl: 28.05 ± 7.24%, ORBl:51.82 ± 8.61%), whereas inputs from Field CA2 (ORBm: 0.67 ± 0.28%, ORBvl: 2.46 ± 2.34%, ORBl:0.38 ± 0.38%), Field CA3 (ORBm: 1.06 ± 0.16%, ORBvl: 2.53 ± 2.40%, ORBl:0.38 ± 0.38%) and the subiculum (SUB) (ORBm: 0.36 ± 0.12%, ORBvl: 0.46 ± 0.24%, ORBl:0.12 ± 0.12%) were minimal (Supplementary Figure 6). Additionally, CA1 and ENTl provide preferential input to ORBm.
Our results demonstrated the presence of strong intra-ORB projections. Strikingly, each subregion received more inputs from the contralateral hemisphere than the ipsilateral hemisphere. We conducted a more detailed analysis of these internal projections but excluded the input cells originating from each target subregion. The ORB subregions received significant inputs from bilateral ORB, with the ORBm, ORBvl, and ORBl receiving 9.78 ± 0.53%, 17.51 ± 2.24%, and 10.60 ± 1.66%, respectively. The ipsilateral ORBvl sent more projections to the ORBm than ORBl, whereas the ipsilateral ORBl sent more projections to the ORBvl than ORBm (Figure 6A, P < 0.01). Notably, the contralateral ORB subregions provided the most input to their respective ORB subregions, with the contralateral ORBm, ORBvl, and ORBl providing the largest inputs to the ORBm, ORBvl, and ORBl, respectively (Figure 6A, P < 0.01). These findings suggest that ORB subregions receive strong inputs from their contralateral counterparts, implying that the ORB may regulate its activity through internal connections. Figure 6B provides an intuitive illustration of the connectivity strengths among the various subregions within the ORB.
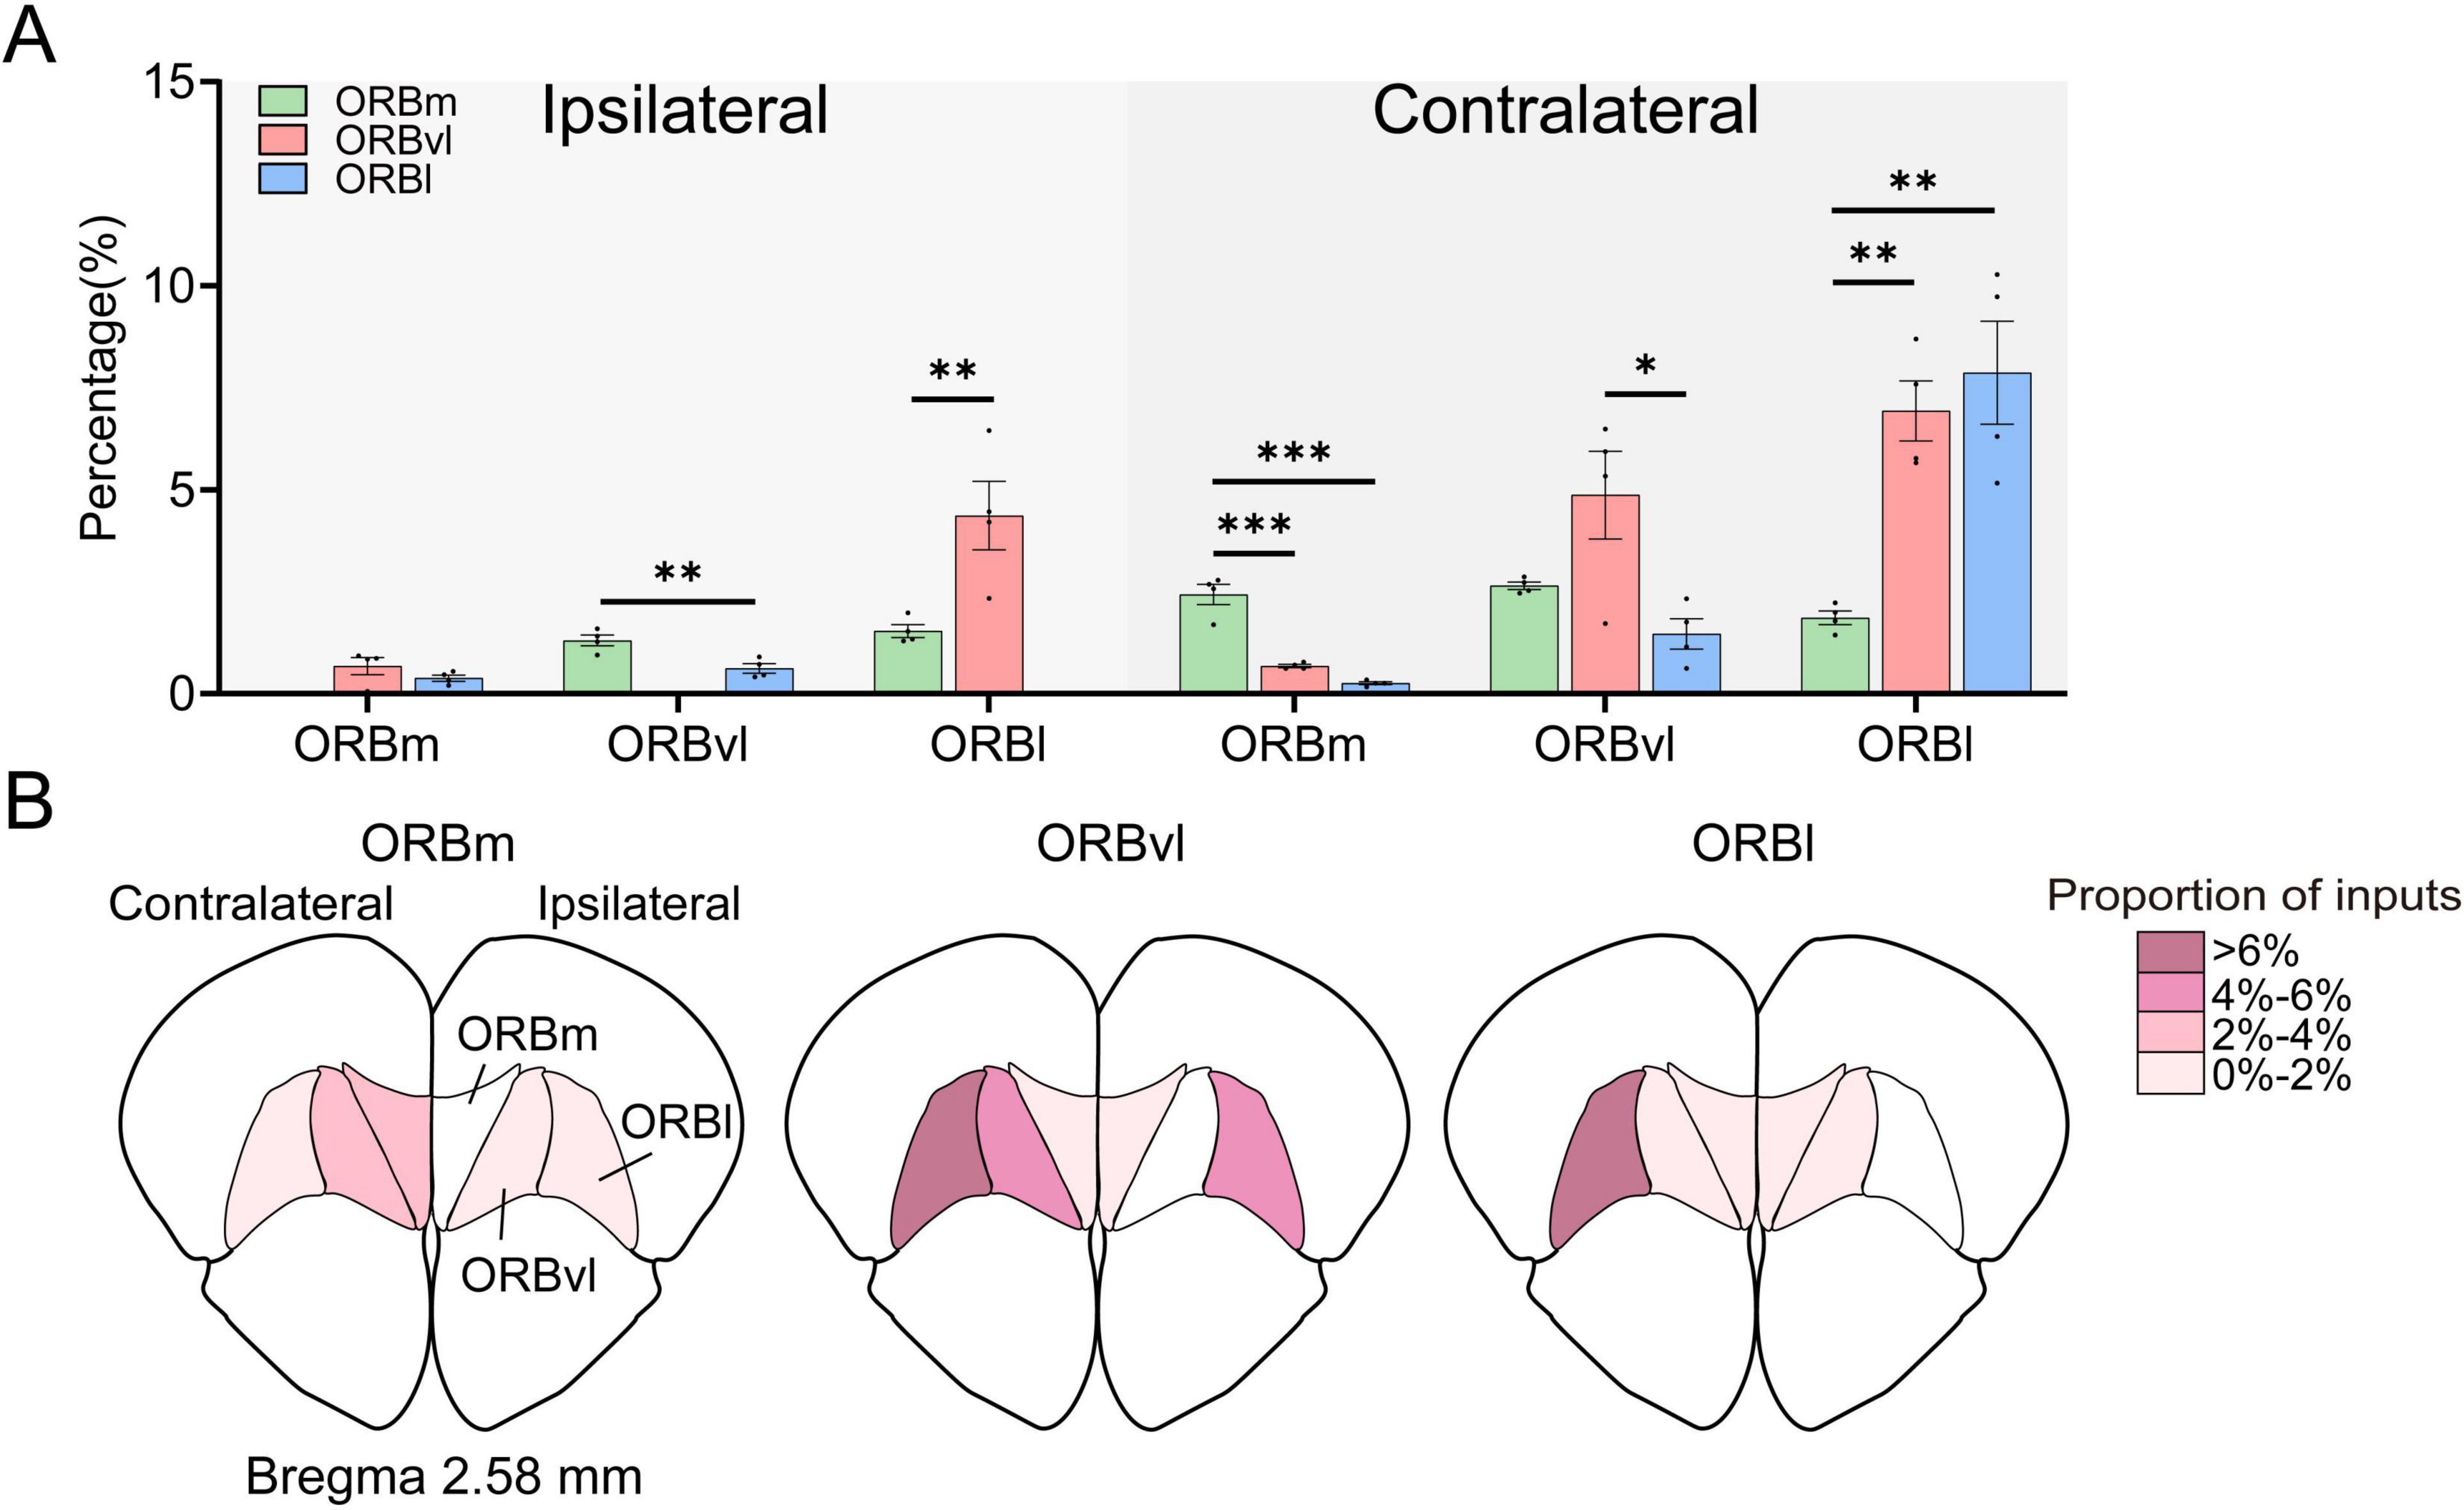
Figure 6. Local inputs to the orbitofrontal cortex (ORB) subregions. (A) Distribution of input cells projecting to the ORB subregions from the ipsilateral and contralateral ORB subregions. The horizontal coordinate represents the input brain subregion. (B) Mean proportion of inputs within the ORB subregions. The total number of input cells calculated for each subregion excluded the input cells native to the target ORB subregion for injection administration. *P < 0.05, **P < 0.01, ***P < 0.001. Data are presented as the Mean ± SEM (n = 4 mice/group). One-way ANOVA combined with Tukey’s multiple comparisons test.
The ORB subregions received substantial inputs from the CTX and TH. The TH is segmented into 13 distinct regions, seven of which obviously participate in ORB signaling: (1) the ventral group of the dorsal TH (VENT), (2) lateral group of the dorsal TH (LAT), (3) anterior group of the dorsal TH (ATN), (4) medial group of the dorsal TH (MED), (5) midline group of the dorsal TH (MTN), (6) intralaminar nuclei of the dorsal TH (ILM), and (7) the reticular nucleus of the TH (RT) (Figure 7A). A deeper analysis of these seven regions revealed that the MED’s inputs to the ORB primarily originate from the MD and SMT of the TH, with the perireunensis nucleus (PR) contributing a minor input ratio. Within the MTN, the paraventricular nucleus (PVT) and parataenial nucleus (PT) of the TH preferentially provided inputs to the ORBm, while the nucleus of reuniens (RE) provided the highest proportion of inputs to the ORBvl. The remaining thalamic subregions provided minimal inputs to the ORB subregions (Figure 7B). Our data further showed that the ipsilateral TH provided the majority of inputs to the ORB (Figure 7C), with sparse inputs originating from the contralateral TH (Supplementary Figure 7) and some contralateral thalamic subregions did not innervate ORB at all.

Figure 7. Thalamic inputs to the orbitofrontal cortex (ORB) subregions. (A) Distribution of input cells from the thalamus (TH) to the ORB subregions. (B) Distribution of input cells from the TH to the ORB subregions at the finer level of organization. (C) Mean proportion of inputs to the ORB subregions within the different thalamic regions. *P < 0.05, **P < 0.01, ***P < 0.001. Data are presented as the Mean ± SEM (n = 4 mice/group). One-way ANOVA combined with Tukey’s multiple comparisons test.
In this study, we utilized a rabies virus-based method to create a comprehensive map of the whole-brain input distribution of ORB neurons. This approach allowed us to identify the distinct input patterns for each ORB subregion, as well as any differences in their whole-brain connectivity. Our research findings indicate that the upstream neurons providing input to the ORB stem from a variety of brain regions, encompassing the BLA, TH, OLF, gustatory areas, auditory areas, AI, and RSPagl (Figure 8). These findings align with earlier anterograde and retrograde tracing studies carried out in rodents (Kita and Kitai, 1990; Reep et al., 1996; Carmichael and Price, 1996; Price, 2007; Zingg et al., 2014; Xiang et al., 2023). Furthermore, our results provide a more detailed illustration of the differential proportions of inputs to the three ORB subregions from these brain areas. Notably, while the BLA predominantly innervates ORBm, thalamic inputs to ORBl clearly originate from the SMT, in contrast to the weak SMT projections to ORBm and ORBvl. Additionally, we have uncovered novel input pathways to the ORB, including robust projections from both the RSPd and RSPv to all three subregions, the minimal inputs from visceral area to all three ORB subregions, as well as inputs from the CA1 to ORBvl and ORBl. Most importantly, the primary contribution of our work lies in the quantitative analysis, comparison, and interpretation of input cells to the three ORB subregions across the entire brain (Figure 8), revealing the overall pattern of whole-brain inputs to the ORB: Ipsilateral brain regions provided more inputs; however, some contralateral regions also provided neural innervation to ORB. Our data also demonstrated that the ORB is composed of complex internal circuitry. For example, the ORB comprises abundant local projections, among which contralateral inputs are particularly prominent. While there is a general similarity in the input patterns across the ORB subregions, we identified notable variations in the proportional contribution of specific brain regions. For example, the ORBm received more inputs from regions, such as the PL, AI, and CA, compared to the ORBvl and ORBl. In contrast, the ORBvl received more inputs from within the ORB itself, whereas the ORBl exhibited a higher proportion of inputs from the MO, SS, and SMT. These patterns offer valuable insights into the respective roles of each subregion and provide robust support for existing functional studies.
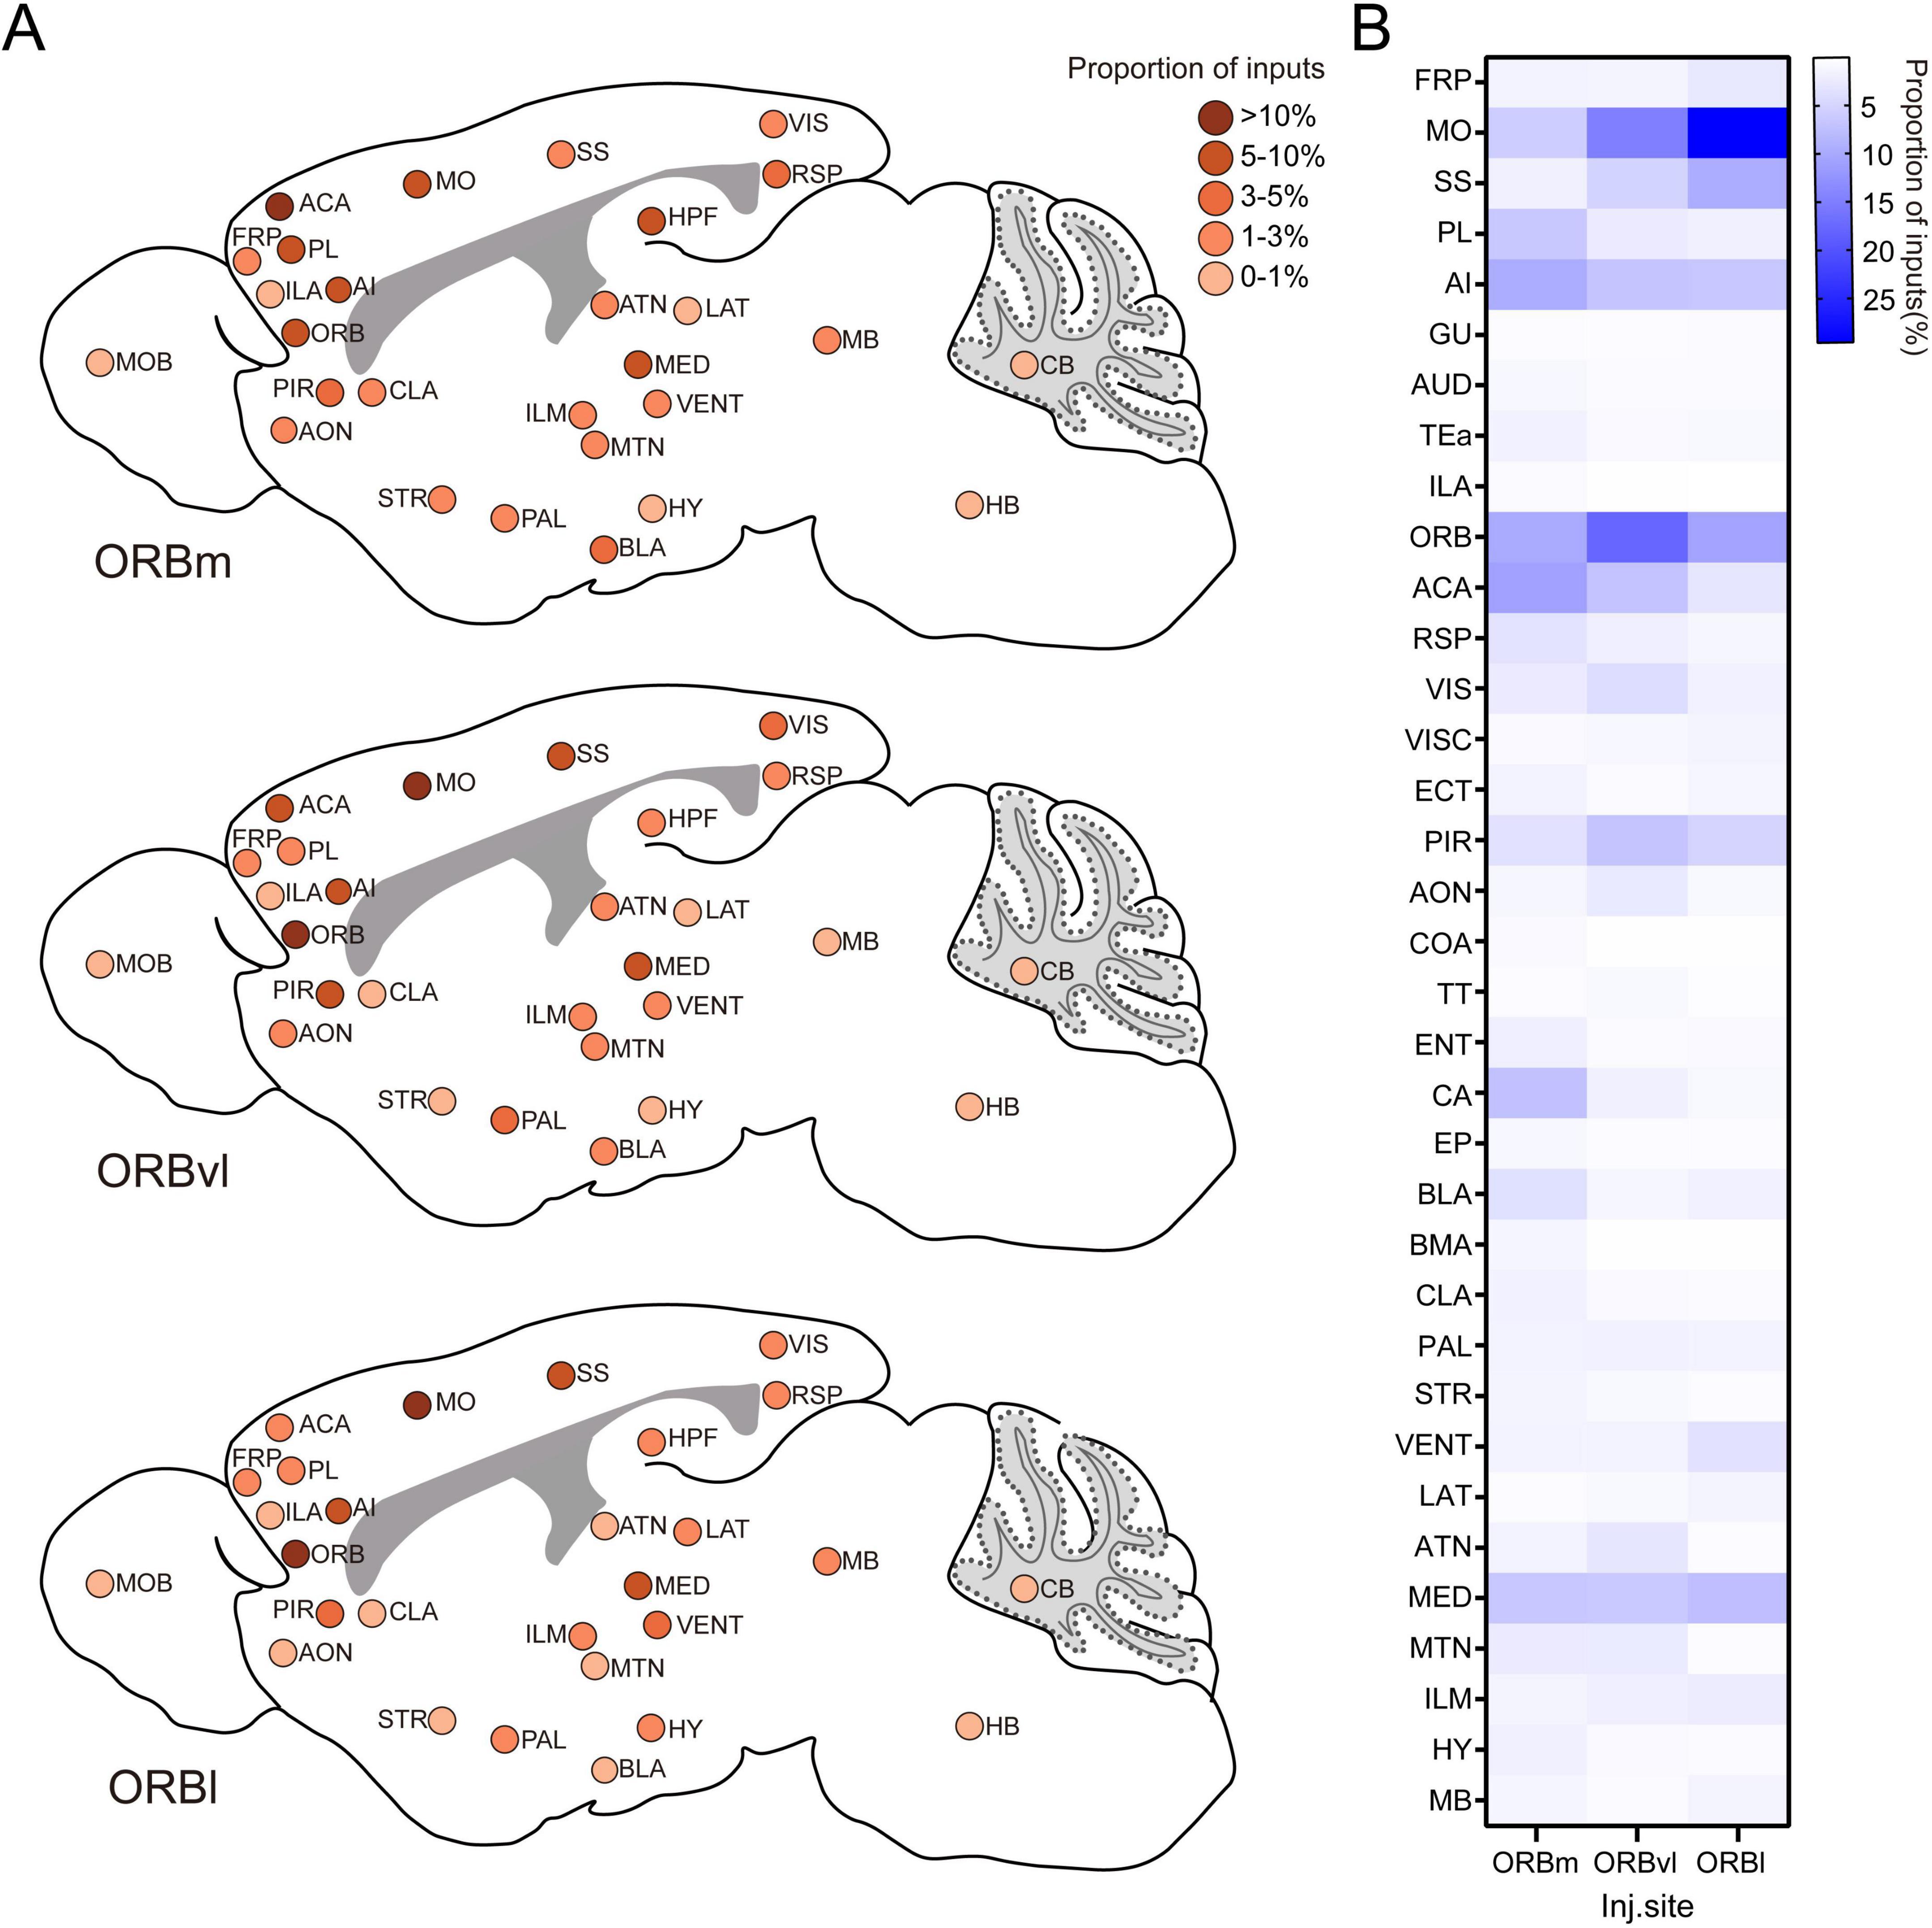
Figure 8. Whole-brain input patterns of the orbitofrontal cortex (ORB) subregions. (A) Schematic representation of whole-brain inputs to the ORB subregions. This illustration highlights the predominant input sources of the medial part (ORBm), the ventrolateral part (ORBvl), and the lateral part (ORBl). The input intensities from various brain regions are denoted by the different colors, reflecting the relative contributions of each brain region to the overall input patterns of the ORB. (B) Comparison of the input intensity of the ORB subregions. This graph summarizes the quantitative analysis of input cells from various brain regions to the ORBm, ORBvl, and ORBl.
It should be noted that some of our results are also inconsistent with previous findings. For example, while our data identified input neurons to the ORB across RSPagl, RSPd, and RSPv, anterograde tracing studies only show that the rodent homolog of posterior cingulate area 23 (approximating RSPagl) projects to the ORB (Xiang et al., 2023). Moreover, studies using the anterograde tracer Phaseolus vulgaris-leucoagglutinin have shown that the SUB in the HPF has extensive projections to the ORBm within the ORB, but no inputs to the ORBvl and ORBl (Jay and Witter, 1991). However, our results indicate that both ORBm and ORBvl receive extremely sparse inputs from the SUB, while ORBl receives no input from the SUB. Such discrepancies likely stem from methodological distinctions inherent in distinct labeling strategies. For instance, Cao’s lab demonstrated that rAAV2-retro preferentially labels cortical inputs to the lateral hypothalamic area and medial preoptic nucleus, whereas RV-ΔG favors subcortical regions like the basal ganglia and hypothalamus (Sun et al., 2019). In addition, Deisseroth’ lab utilized RV-tdTomato retrograde tracing and AAV5-eYFP anterograde labeling to identify ACA projections to the hippocampus region (HIP) (Rajasethupathy et al., 2015). In contrast, Zhuo’ lab employing AAV2/9 anterograde tracing, failed to detect ACA→HIP connectivity (Shi et al., 2022). These tropism differences may lead to incomplete or biased circuit mapping. To resolve such ambiguities, future studies should adopt multimodal validation strategies, combining intersectional genetic tools (e.g., Cre-dependent AAV/RV systems) with functional interrogation (optogenetics, pharmacogenetics). So, neuroanatomical conclusions must account for tracer-specific biases, and cross-methodological consistency remains paramount for robust circuit validation.
Our study has shown that the isocortex projects extensively into the ORB, which is consistent with prior research (Reep et al., 1996; Ongür and Price, 2000). These projections are broadly distributed among the various regions of the isocortex. Known for its role in processing sensory information, the isocortex engages in several functions, including motor command generation and execution, sensory perception, cognitive processing, and emotional responses (Van Essen and Glasser, 2018; Felleman and Van Essen, 1991; Rakic, 2009). Our findings emphasize the vital importance of the ORB in the brain’s handling of these informational pathways and the performance of these diverse functions.
Our analysis further demonstrated the distribution of inputs from the isocortex to the ORB. The PL, AI, RSP, CA, and BLA were notable for providing preferential inputs to the ORBm. Considering the functions of these isocortical regions, their contribution to the ORBm hints at the subregion’s potentially pivotal role in emotional regulation and cognitive mapping. Conversely, ORBvl neurons received a greater share of inputs from within the ORB itself, suggesting its heightened involvement in intraregional interactions and possible role in complex emotional processing. Meanwhile, ORBl neurons received more inputs from the MO and SS, implying their integral role in motor control, sensory processing, and the modulation of learned behaviors.
These results underscore the distinct roles of the ORB subregions in mediating isocortex-driven functions. The varied input patterns from isocortex regions suggest specialized contributions of the ORBm, ORBvl, and ORBl to emotional regulation, motor control, and other cognitive processes. Further exploration of the functional interplay between these ORB subregions and their isocortical inputs is needed to fully decipher their roles in brain function.
All three ORB subregions received considerable inputs from the AI, with the ORBm receiving particularly strong inputs. The AI and ORBm are closely associated with emotional regulation; the AI deals with emotional responses (Nieuwenhuys, 2012; Butti and Hof, 2010), while the ORBm specializes in emotional processing (Rolls, 2019; O’Doherty et al., 2003). Previous studies have established a bidirectional relationship between all three AI subregions and the ORB (Gehrlach et al., 2020). While they did not study the projection weights between these ORB subregions, our research provides valuable structural insights into their interconnections. It also raises the intriguing question of whether this bidirectional projection forms a closed loop for integrating and regulating information between the AI and ORB. Understanding this loop is crucial in further understanding the complex roles of AI and ORB pathways in emotional regulation mechanisms. Advanced methodologies like optogenetics may be instrumental in verifying their functional contributions.
All three ORB subregions received robust inputs from the ORB itself. This may be evidence of self-regulation or a mechanism by which the ORB can maintain functional stability and adaptability in complex, dynamic environments. Notably, the ORBvl received substantially more inputs from the ORB than the ORBm and ORBl, highlighting its key role in integrating internal ORB information. In decision-making scenarios, the ORBvl relays choice-related signals to the dorsomedial STR, which contributes to decision-making (Gore et al., 2023). Furthermore, the ORB-ORBvl pathway may integrate rewards and emotional inputs from various ORB subregions to modulate dorsomedial STR activity. The ORBvl also exhibited strong innervation from the contralateral ORBvl and ORBl. This interhemispheric connection aids in synchronizing and integrating information during complex cognitive and emotional processing. The ORBl has been shown to participate in processing punishment information and its activation levels correlate with punishment severity (O’Doherty et al., 2001). Inputs from the contralateral ORBvl and ORBl may enrich the ORBvl’s capacity for punishment processing and decision-making.
Structural and functional abnormalities within the ORB have been documented in patients with depression. Patients in depressive states exhibit more functional connectivity between the right inferior frontal gyrus and the ORB (Rolls et al., 2020). Adults diagnosed with depression demonstrate increased cortical thinning within the gray matter of the ORB (Yang and Kwan, 2021). Adolescents with depression exhibit a similar decrease in total surface area (Yang and Kwan, 2021). Additionally, patients with depression exhibit increased functional connectivity in the ORBl but decreased connectivity in the ORBm (Rolls et al., 2018). Recent research supports a connection between the ORBvl and depression, with studies demonstrating the area’s involvement in depressive behaviors and the response to anti-depressants like valproic acid, a mood stabilizer (Xing et al., 2011). Other studies have also shown that impairment of the ORBvl is associated with a reduction in depressive behavior (Chu et al., 2021). All these contribute to highlighting the ORB as a promising therapeutic target for depression. Ultimately, our data showed that the ORBvl receives extensive projections from the other ORB subregions, particularly the contralateral ORBvl. Elucidating how these projections contribute to the pathogenesis of depression may improve our understanding of the disease, as well as propose novel treatment strategies.
The ORBm, ORBvl, and ORBl all received substantial inputs from the MO, with the ORBl receiving significantly more inputs than the ORBm and ORBvl. The MOs are primarily responsible for associating prior decisions and sensory stimuli with upcoming motor actions (Yang and Kwan, 2021). Given the central role of the ORBl in processing punishment information, the MO-ORBl pathway may similarly participate in intricate cognitive-motor integration processes by (1) receiving sensory and motor information from the MOs and (2) integrating this information with other internal signals from the ORB to generate precise and comprehensive cognitive information. This information may serve as a guide for performing appropriate motor actions based on past experiences and decisions.
The present study identified similar input patterns between the SS and MO and the ORB subregions. Both brain regions provided preferential inputs to the ORBl, followed by the ORBvl and ORBm. Further analysis revealed that subregions of the SS, the SSp and the SSs, provided significantly more inputs to the ORBl compared to the ORBm, with the SSp providing the majority of these inputs. Prior research has indicated that the ORBl-SSp pathway may regulate value prediction, which can contribute to flexible decision-making (Banerjee et al., 2020). The data from our study further suggest that there are bidirectional projections between the ORBl and SSp. This may lay the neural groundwork for value prediction, which can help integrate somatosensory information with emotional and cognitive processes to guide behavior.
Our research has also revealed that the CA region of the hippocampus projects to the ORB, specifically the ORBm. Over 90% of the CA neurons participating in this connection originate from the CA1. Previous studies have shown that CA neurons are crucial for learning, memory, and spatial navigation (Rolls, 2022; Chowdhury et al., 2022). The studies have demonstrated a connection between the ORB and hippocampus, which allows the ORB to convey rewards information to the hippocampus, thereby facilitating episodic memory function (Rolls, 2022). The potential role of the CA-ORBm pathway in transmitting rewards information and integrating episodic memory is a good topic for future study.
Our findings demonstrate that thalamic inputs to the ORB predominantly originate from MD, posterior complex of the thalamus (PO), SMT, PVT, ventral medial nucleus of the thalamus (VM), RE and rhomboid nucleus (RH), which aligns with prior anatomical studies (Reep et al., 1996; Barreiros et al., 2021; Zhang et al., 2024). Specifically, MD and SMT exhibited robust projections to all three ORB subregions (ORBm, ORBvl, ORBl), while PVT, VM, RH, and RE provided comparatively weaker inputs.
Previous work reported that the posterior lateral ORB receives inputs from parataenial nucleus (PT) and RE, while the posterior ventral ORB is innervated by RE (Barreiros et al., 2021). Our results further revealed minor PT projections to ORBl and ORBvl, expanding current knowledge of thalamo-ORB connectivity.
Our quantitative comparisons of thalamic subregional input preferences revealed that MD contributed the highest proportion of thalamic inputs to the ORB, with no significant differences in input intensity across the three ORB subregions. MD is critically implicated in advanced cognitive functions, including cognitive control (DeNicola et al., 2020), working memory (Watanabe and Funahashi, 2012; Oyama et al., 2021), and decision-making (Ding et al., 2024). Intriguingly, silencing the ORB-MD pathway impairs inference-based value updating (Oyama et al., 2024), raising critical questions: What roles do MD-to-ORB projections play in MD-mediated cognitive processes such as working memory and decision-making? Given the bidirectional connectivity between ORB and MD (Oyama et al., 2024), how do these reciprocal circuits orchestrate higher-order cognitive functions? Future studies should address these gaps.
We also observed distinct thalamic input patterns: SMT exhibited stronger inputs to all ORB subregions compared to PO and PVT, while the ventral anterior-lateral complex (VAL) and SMT preferentially innervated ORBl. In contrast, PVT and PT displayed biased projections to ORBm. Although the anteromedial nucleus (AM) and RE provided modest overall inputs to the ORB, both regions exhibited a consistent hierarchy of innervation—highest to ORBvl, followed by ORBm and ORBl—with AM and RE inputs to ORBvl significantly exceeding those to ORBl. Functional implications of these patterns warrant further exploration. PO, SMT, and PVT are implicated in nociceptive modulation (Wang H. et al., 2020; Tang et al., 2009; Liu et al., 2025; Li et al., 2024), while AM and RE regulate fear memory (Ramanathan and Maren, 2019; Troyner and Bertoglio, 2021; Lv et al., 2021). The thalamo-ORB pathways identified here may serve as anatomical substrates for integrating nociceptive or fear-related signals with ORB-mediated decision-making and emotional processing. Elucidating these functional interactions will deepen our understanding of ORB-TH circuitry in both health and disease.
Future research should delve deeper into the functional implications of the input patterns to each ORB subregion. In particular, future efforts may explore how these inputs contribute to value prediction, decision-making, and the integration of somatosensory, emotional, and cognitive processes.
Our study focused exclusively on male mice, a design choice that inherently limits insights into potential sex-dependent circuit organization of the ORB. This limitation is particularly salient given emerging evidence for functional and structural sexual dimorphism in the ORB. For instance, recent studies demonstrate that cocaine self-administration induces sex-specific alterations in synaptic properties of parvalbumin interneurons within the ORB (Wright et al., 2021). Additionally, female rats exhibit slower acquisition but more robust, stress-resistant contextual control over rewards-seeking behavior, accompanied by heightened ORB activation—a finding that highlights sex-divergent neural mechanisms potentially linked to psychiatric vulnerabilities (Peterson et al., 2024). These observations raise fundamental questions about whether sex differences in ORB-dependent behaviors arise from structural or functional disparities in its connectivity. While our current work establishes a foundational map of ORB subregion connectivity in males, systematic comparisons of whole-brain input-output patterns across sexes will be essential to unravel the circuit basis of these functional divergences.
The original contributions presented in this study are included in this article/Supplementary material, further inquiries can be directed to the corresponding author.
The animal study was approved by Laboratory Animal Center, Fudan University. The study was conducted in accordance with the local legislation and institutional requirements.
MY: Writing – original draft, Writing – review and editing. HY: Writing – review and editing. LS: Writing – review and editing. TX: Resources, Writing – review and editing.
The author(s) declare that financial support was received for the research and/or publication of this article. This work was sponsored by the Natural Science Foundation of Shanghai under Grant Nos. 22ZR1414500, 21ZR1407700 (to TX).
The authors declare that the research was conducted in the absence of any commercial or financial relationships that could be construed as a potential conflict of interest.
The authors declare that no Generative AI was used in the creation of this manuscript.
All claims expressed in this article are solely those of the authors and do not necessarily represent those of their affiliated organizations, or those of the publisher, the editors and the reviewers. Any product that may be evaluated in this article, or claim that may be made by its manufacturer, is not guaranteed or endorsed by the publisher.
The Supplementary Material for this article can be found online at: https://www.frontiersin.org/articles/10.3389/fncir.2025.1567036/full#supplementary-material
Babalian, A., Eichenberger, S., Bilella, A., Girard, F., Szabolcsi, V., Roccaro, D., et al. (2019). The orbitofrontal cortex projects to the parvafox nucleus of the ventrolateral hypothalamus and to its targets in the ventromedial periaqueductal grey matter. Brain Struct. Funct. 224, 293–314. doi: 10.1007/s00429-018-1771-5
Banerjee, A., Parente, G., Teutsch, J., Lewis, C., Voigt, F., and Helmchen, F. (2020). Value-guided remapping of sensory cortex by lateral orbitofrontal cortex. Nature 585, 245–250. doi: 10.1038/s41586-020-2704-z
Barreiros, I. V., Panayi, M. C., and Walton, M. E. (2021). Organization of afferents along the anterior-posterior and medial-lateral axes of the rat orbitofrontal cortex. Neuroscience 460, 53–68. doi: 10.1016/j.neuroscience.2021.02.017
Baxter, L. R., Phelps, M. E., Mazziotta, J. C., Guze, B. H., Schwartz, J. M., and Selin, C. E. (1987). Local cerebral glucose metabolic rates in obsessive-compulsive disorder. A comparison with rates in unipolar depression and in normal controls. Arch. Gen. Psychiatry 44, 211–218. doi: 10.1001/archpsyc.1987.01800150017003
Beucke, J., Sepulcre, J., Talukdar, T., Linnman, C., Zschenderlein, K., Endrass, T., et al. (2013). Abnormally high degree connectivity of the orbitofrontal cortex in obsessive-compulsive disorder. JAMA Psychiatry 70, 619–629. doi: 10.1001/jamapsychiatry.2013.173
Butti, C., and Hof, P. R. (2010). The insular cortex: A comparative perspective. Brain Struct. Funct. 214, 477–493. doi: 10.1007/s00429-010-0264-y
Carmichael, S. T., and Price, J. L. (1996). Connectional networks within the orbital and medial prefrontal cortex of macaque monkeys. J. Comp. Neurol. 371, 179–207. doi: 10.1002/(SICI)1096-9861(19960722)371:2<179::AID-CNE1<3.0.CO;2-#
Choi, J. S., Kang, D. H., Kim, J. J., Ha, T. H., Lee, J. M., Youn, T., et al. (2004). Left anterior subregion of orbitofrontal cortex volume reduction and impaired organizational strategies in obsessive-compulsive disorder. J. Psychiatr. Res. 38, 193–199. doi: 10.1016/j.jpsychires.2003.08.001
Chowdhury, A., Luchetti, A., Fernandes, G., Filho, D., Kastellakis, G., Tzilivaki, A., et al. (2022). A locus coeruleus-dorsal CA1 dopaminergic circuit modulates memory linking. Neuron 110, 3374–3388.e8. doi: 10.1016/j.neuron.2022.08.001
Chu, Z., Han, W., Liu, P., Liu, F., Lei, G., Deng, L., et al. (2021). Electrolytic lesions of the bilateral ventrolateral orbital cortex not only directly reduce depression-like behavior but also decreased desperate behavior induced by chronic unpredicted mild stress in rats. BMC Neurosci. 22:69. doi: 10.1186/s12868-021-00677-6
Critchley, H. D., and Rolls, E. T. (1996). Hunger and satiety modify the responses of olfactory and visual neurons in the primate orbitofrontal cortex. J. Neurophysiol. 75, 1673–1686. doi: 10.1152/jn.1996.75.4.1673
DeNicola, A., Park, M., Crowe, D., MacDonald, A., and Chafee, M. (2020). Differential roles of mediodorsal nucleus of the thalamus and prefrontal cortex in decision-making and state representation in a cognitive control task measuring deficits in Schizophrenia. J. Neurosci. 40, 1650–1667. doi: 10.1523/JNEUROSCI.1703-19.2020
Ding, T., Hu, Y., Li, J., Sun, C., and Ma, C. (2024). Mediodorsal thalamus nucleus-medial prefrontal cortex circuitry regulates cost-benefit decision-making selections. Cereb. Cortex 34:bhae476. doi: 10.1093/cercor/bhae476
du Plessis, S., Bossert, M., Vink, M., van den Heuvel, L., Bardien, S., Emsley, R., et al. (2018). Reward processing dysfunction in ventral striatum and orbitofrontal cortex in Parkinson’s disease. Parkinsonism Relat. Disord. 48, 82–88. doi: 10.1016/j.parkreldis.2017.12.024
Felleman, D. J., and Van Essen, D. C. (1991). Distributed hierarchical processing in the primate cerebral cortex. Cereb. Cortex 1, 1–47. doi: 10.1093/cercor/1.1.1-a
Gehrlach, D., Weiand, C., Gaitanos, T., Cho, E., Klein, A., Hennrich, A., et al. (2020). A whole-brain connectivity map of mouse insular cortex. Elife 9:e55585. doi: 10.7554/eLife.55585
Gore, F., Hernandez, M., Ramakrishnan, C., Crow, A., Malenka, R., and Deisseroth, K. (2023). Orbitofrontal cortex control of striatum leads economic decision-making. Nat. Neurosci. 26, 1566–1574. doi: 10.1038/s41593-023-01409-1
Hardy, S. (1986). Projections to the midbrain from the medial versus lateral prefrontal cortices of the rat. Neurosci. Lett. 63, 159–164. doi: 10.1016/0304-3940(86)90054-6
Hardy, S. (1994). Anatomical data supporting the concept of prefrontal influences upon hypothalamo-medullary relays in the rat. Neurosci. Lett. 169, 17–20. doi: 10.1016/0304-3940(94)90346-8
Hervig, M., Fiddian, L., Piilgaard, L., Božič, T., Blanco-Pozo, M., Knudsen, C., et al. (2020). Dissociable and paradoxical roles of rat medial and lateral orbitofrontal cortex in visual serial reversal learning. Cereb. Cortex 30, 1016–1029. doi: 10.1093/cercor/bhz144
Illig, K. (2005). Projections from orbitofrontal cortex to anterior piriform cortex in the rat suggest a role in olfactory information processing. J. Comp. Neurol. 488, 224–231. doi: 10.1002/cne.20595
Jay, T. M., and Witter, M. P. (1991). Distribution of hippocampal CA1 and subicular efferents in the prefrontal cortex of the rat studied by means of anterograde transport of Phaseolus vulgaris-leucoagglutinin. J. Comp. Neurol. 313, 574–586. doi: 10.1002/cne.903130404
Jones, E. G., and Leavitt, R. Y. (1974). Retrograde axonal transport and the demonstration of non-specific projections to the cerebral cortex and striatum from thalamic intralaminar nuclei in the rat, cat and monkey. J. Comp. Neurol. 154, 349–377. doi: 10.1002/cne.901540402
Kanahara, N., Sekine, Y., Haraguchi, T., Uchida, Y., Hashimoto, K., Shimizu, E., et al. (2013). Orbitofrontal cortex abnormality and deficit schizophrenia. Schizophr. Res. 143, 246–252. doi: 10.1016/j.schres.2012.11.015
Kita, H., and Kitai, S. T. (1990). Amygdaloid projections to the frontal cortex and the striatum in the rat. J. Comp. Neurol. 298, 40–49. doi: 10.1002/cne.902980104
Leichnetz, G. R., Hardy, S. G., and Carruth, M. K. (1987). Frontal projections to the region of the oculomotor complex in the rat: A retrograde and anterograde HRP study. J. Comp. Neurol. 263, 387–399. doi: 10.1002/cne.902630306
Li, D., Mai, J. W., Deng, J., Chen, L., Fan, H. T., and Zhang, W. L. (2024). A neural circuit from thalamic paraventricular nucleus via zona incerta to periaqueductal gray for the facilitation of neuropathic pain. Neurobiol. Dis. 202:106699. doi: 10.1016/j.nbd.2024.106699
Liu, X., Zhang, X., Wang, D., Cao, Y., Zhang, L., Li, Z., et al. (2025). A neural circuit from paraventricular nucleus of the thalamus to the nucleus accumbens mediates inflammatory pain in mice. Brain Behav. 15:e70218. doi: 10.1002/brb3.70218
Lv, Y., Chen, P., Shan, Q. H., Qin, X. Y., Qi, X. H., and Zhou, J. N. (2021). Regulation of cued fear expression via corticotropin-releasing-factor neurons in the ventral anteromedial thalamic nucleus. Neurosci. Bull. 37, 217–228. doi: 10.1007/s12264-020-00592-6
Mar, A. C., Walker, A. L., Theobald, D. E., Eagle, D. M., and Robbins, T. W. (2011). Dissociable effects of lesions to orbitofrontal cortex subregions on impulsive choice in the rat. J. Neurosci. 31, 6398–6404. doi: 10.1523/JNEUROSCI.6620-10.2011
Masaki, Y., Yamaguchi, M., Takeuchi, R. F., and Osakada, F. (2022). Monosynaptic rabies virus tracing from projection-targeted single neurons. Neurosci. Res. 178, 20–32. doi: 10.1016/j.neures.2022.01.007
Mathiasen, M. L., Aggleton, J. P., and Witter, M. P. (2023). Projections of the insular cortex to orbitofrontal and medial prefrontal cortex: A tracing study in the rat. Front. Neuroanat. 17:1131167. doi: 10.3389/fnana.2023.1131167
McDonald, A. J., Mascagni, F., and Guo, L. (1996). Projections of the medial and lateral prefrontal cortices to the amygdala: A Phaseolus vulgaris leucoagglutinin study in the rat. Neuroscience 71, 55–75. doi: 10.1016/0306-4522(95)00417-3
Nieuwenhuys, R. (2012). The insular cortex: A review. Prog. Brain Res. 195, 123–163. doi: 10.1016/B978-0-444-53860-4.00007-6
Núñez, C., Stephan-Otto, C., Roldán, A., Grasa, E. M., Escartí, M. J., Aguilar García-Iturrospe, E. J., et al. (2024). Orbitofrontal cortex hypergyrification in hallucinating schizophrenia patients: Surface ratio as a promising brain biomarker. Eur. Neuropsychopharmacol. 89, 47–55. doi: 10.1016/j.euroneuro.2024.09.006
O’Doherty, J., Kringelbach, M., Rolls, E., Hornak, J., and Andrews, C. (2001). Abstract reward and punishment representations in the human orbitofrontal cortex. Nat. Neurosci. 4, 95–102. doi: 10.1038/82959
O’Doherty, J., Winston, J., Critchley, H., Perrett, D., Burt, D., and Dolan, R. (2003). Beauty in a smile: The role of medial orbitofrontal cortex in facial attractiveness. Neuropsychologia 41, 147–155. doi: 10.1016/s0028-3932(02)00145-8
Ohara, S., Sato, S., Oyama, K., Tsutsui, K., and Iijima, T. (2013). Rabies virus vector transgene expression level and cytotoxicity improvement induced by deletion of glycoprotein gene. PLoS One 8:e80245. doi: 10.1371/journal.pone.0080245
Ongür, D., and Price, J. L. (2000). The organization of networks within the orbital and medial prefrontal cortex of rats, monkeys and humans. Cereb. Cortex 10, 206–219. doi: 10.1093/cercor/10.3.206
Oyama, K., Hori, Y., Nagai, Y., Miyakawa, N., Mimura, K., Hirabayashi, T., et al. (2021). Chemogenetic dissection of the primate prefronto-subcortical pathways for working memory and decision-making. Sci. Adv. 7:eabg4246. doi: 10.1126/sciadv.abg4246
Oyama, K., Majima, K., Nagai, Y., Hori, Y., Hirabayashi, T., Eldridge, M. A. G., et al. (2024). Distinct roles of monkey OFC-subcortical pathways in adaptive behavior. Nat. Commun. 15:6487. doi: 10.1038/s41467-024-50505-8
Padoa-Schioppa, C., and Assad, J. A. (2006). Neurons in the orbitofrontal cortex encode economic value. Nature 441, 223–226. doi: 10.1038/nature04676
Peterson, S., Maheras, A., Wu, B., Chavira, J., and Keiflin, R. (2024). Sex differences in discrimination behavior and orbitofrontal engagement during context-gated reward prediction. Elife 12:R93509. doi: 10.7554/eLife.93509
Price, J. (2007). Definition of the orbital cortex in relation to specific connections with limbic and visceral structures and other cortical regions. Ann. N. Y. Acad. Sci. 1121, 54–71. doi: 10.1196/annals.1401.008
Qi, X., Du, Z. J., Zhu, L., Liu, X., Xu, H., Zhou, Z., et al. (2019). The glutamatergic postrhinal cortex-ventrolateral orbitofrontal cortex pathway regulates spatial memory retrieval. Neurosci. Bull. 35, 447–460. doi: 10.1007/s12264-018-0325-4
Rajasethupathy, P., Sankaran, S., Marshel, J., Kim, C., Ferenczi, E., Lee, S., et al. (2015). Projections from neocortex mediate top-down control of memory retrieval. Nature 526, 653–659. doi: 10.1038/nature15389
Rakic, P. (2009). Evolution of the neocortex: A perspective from developmental biology. Nat. Rev. Neurosci. 10, 724–735. doi: 10.1038/nrn2719
Ramanathan, K. R., and Maren, S. (2019). Nucleus reuniens mediates the extinction of contextual fear conditioning. Behav. Brain Res. 374, 112114. doi: 10.1016/j.bbr.2019.112114
Reep, R. L., Corwin, J. V., and King, V. (1996). Neuronal connections of orbital cortex in rats: Topography of cortical and thalamic afferents. Exp. Brain Res. 111, 215–232. doi: 10.1007/BF00227299
Reynolds, S. M., and Zahm, D. S. (2005). Specificity in the projections of prefrontal and insular cortex to ventral striatopallidum and the extended amygdala. J. Neurosci. 25, 11757–11767. doi: 10.1523/JNEUROSCI.3432-05.2005
Rolls, E. (2019). The orbitofrontal cortex and emotion in health and disease, including depression. Neuropsychologia 128, 14–43. doi: 10.1016/j.neuropsychologia.2017.09.021
Rolls, E. (2022). The hippocampus, ventromedial prefrontal cortex, and episodic and semantic memory. Prog. Neurobiol. 217:102334. doi: 10.1016/j.pneurobio.2022.102334
Rolls, E. (2023). Emotion, motivation, decision-making, the orbitofrontal cortex, anterior cingulate cortex, and the amygdala. Brain Struct. Funct. 228, 1201–1257. doi: 10.1007/s00429-023-02644-9
Rolls, E. T., Cheng, W., Du, J., Wei, D., Qiu, J., Dai, D., et al. (2020). Functional connectivity of the right inferior frontal gyrus and orbitofrontal cortex in depression. Soc Cogn. Affect. Neurosci. 15, 75–86. doi: 10.1093/scan/nsaa014
Rolls, E., Cheng, W., Gilson, M., Qiu, J., Hu, Z., Ruan, H., et al. (2018). Effective connectivity in depression. Biol. Psychiatry Cogn. Neurosci Neuroimaging 3, 187–197. doi: 10.1016/j.bpsc.2017.10.004
Salzman, C. D., and Fusi, S. (2010). Emotion, cognition, and mental state representation in amygdala and prefrontal cortex. Annu. Rev. Neurosci. 33, 173–202. doi: 10.1146/annurev.neuro.051508.135256
Schilman, E., Uylings, H., Galis-de Graaf, Y., Joel, D., and Groenewegen, H. (2008). The orbital cortex in rats topographically projects to central parts of the caudate-putamen complex. Neurosci. Lett. 432, 40–45. doi: 10.1016/j.neulet.2007.12.024
Sheng, H. Y., Lv, S. S., Cai, Y. Q., Shi, W., Lin, W., Liu, T. T., et al. (2020). Activation of ventrolateral orbital cortex improves mouse neuropathic pain-induced anxiodepression. JCI Insight 5:e133625. doi: 10.1172/jci.insight.133625
Shi, W., Xue, M., Wu, F., Fan, K., Chen, Q. Y., Xu, F., et al. (2022). Whole-brain mapping of efferent projections of the anterior cingulate cortex in adult male mice. Mol. Pain 18:17448069221094529. doi: 10.1177/17448069221094529
Sun, L., Tang, Y., Yan, K., Yu, J., Zou, Y., Xu, W., et al. (2019). Differences in neurotropism and neurotoxicity among retrograde viral tracers. Mol. Neurodegener. 14:8. doi: 10.1186/s13024-019-0308-6
Tang, J. S., Qu, C. L., and Huo, F. Q. (2009). The thalamic nucleus submedius and ventrolateral orbital cortex are involved in nociceptive modulation: A novel pain modulation pathway. Prog. Neurobiol. 89, 383–389. doi: 10.1016/j.pneurobio.2009.10.002
Troyner, F., and Bertoglio, L. J. (2021). Nucleus reuniens of the thalamus controls fear memory reconsolidation. Neurobiol. Learn. Mem. 177:107343. doi: 10.1016/j.nlm.2020.107343
Van Essen, D. C., and Glasser, M. F. (2018). Parcellating cerebral cortex: How invasive animal studies inform noninvasive mapmaking in humans. Neuron 99, 640–663. doi: 10.1016/j.neuron.2018.07.002
Vertes, R., Hoover, W., Witter, M., Yanik, M., Rojas, A., and Linley, S. (2023). Projections from the five divisions of the orbital cortex to the thalamus in the rat. J. Comp. Neurol. 531, 217–237. doi: 10.1002/cne.25419
Wang, H., Dong, P., He, C., Feng, X. Y., Huang, Y., Yang, W. W., et al. (2020). Incerta-thalamic circuit controls nocifensive behavior via cannabinoid type 1 receptors. Neuron 107, 538–551.e7. doi: 10.1016/j.neuron.2020.04.027
Wang, J., Sun, P., Lv, X., Jin, S., Li, A., Kuang, J., et al. (2021). Divergent projection patterns revealed by reconstruction of individual neurons in orbitofrontal cortex. Neurosci. Bull. 37, 461–477. doi: 10.1007/s12264-020-00616-1
Wang, Q., Ding, S., Li, Y., Royall, J., Feng, D., Lesnar, P., et al. (2020). The allen mouse brain common coordinate framework: A 3D reference atlas. Cell 181, 936–953.e20. doi: 10.1016/j.cell.2020.04.007
Watabe-Uchida, M., Zhu, L., Ogawa, S., Vamanrao, A., and Uchida, N. (2012). Whole-brain mapping of direct inputs to midbrain dopamine neurons. Neuron 74, 858–873. doi: 10.1016/j.neuron.2012.03.017
Watanabe, Y., and Funahashi, S. (2012). Thalamic mediodorsal nucleus and working memory. Neurosci. Biobehav. Rev. 36, 134–142. doi: 10.1016/j.neubiorev.2011.05.003
Wright, A., Zapata, A., Hoffman, A., Necarsulmer, J., Coke, L., Svarcbahs, R., et al. (2021). Effects of withdrawal from cocaine self-administration on rat orbitofrontal cortex parvalbumin neurons expressing cre recombinase: Sex-dependent changes in neuronal function and unaltered serotonin signaling. eNeuro 8:ENEURO.0017–ENEURO.21. doi: 10.1523/ENEURO.0017-21.2021
Xiang, X., Chen, S., Zhang, X., Chen, C., Zhang, S., Cai, H., et al. (2023). Possible rodent equivalent of the posterior cingulate cortex (area 23) interconnects with multimodal cortical and subcortical regions. Front. Neurosci. 17:1194299. doi: 10.3389/fnins.2023.1194299
Xing, B., Zhao, Y., Zhang, H., Dang, Y., Chen, T., Huang, J., et al. (2011). Microinjection of valproic acid into the ventrolateral orbital cortex exerts an antidepressant-like effect in the rat forced swim test. Brain Res. Bull. 85, 153–157. doi: 10.1016/j.brainresbull.2011.03.007
Yang, D., Chi, M., Chu, C., Lin, C., Hsu, S., Chen, K., et al. (2019). Orbitofrontal dysfunction during the reward process in adults with ADHD: An fMRI study. Clin. Neurophysiol. 130, 627–633. doi: 10.1016/j.clinph.2019.01.022
Yang, J. H., and Kwan, A. C. (2021). Secondary motor cortex: Broadcasting and biasing animal’s decisions through long-range circuits. Int. Rev. Neurobiol. 158, 443–470. doi: 10.1016/bs.irn.2020.11.008
Yoshida, A., Dostrovsky, J. O., and Chiang, C. Y. (1992). The afferent and efferent connections of the nucleus submedius in the rat. J. Comp. Neurol. 324, 115–133. doi: 10.1002/cne.903240109
Zhang, X., Hannesson, D., Saucier, D., Wallace, A., Howland, J., and Corcoran, M. (2001). Susceptibility to kindling and neuronal connections of the anterior claustrum. J. Neurosci. 21, 3674–3687. doi: 10.1523/JNEUROSCI.21-10-03674.2001
Zhang, Y., Zhang, W., Wang, L., Liu, D., Xie, T., Le, Z., et al. (2024). Whole-brain mapping of inputs and outputs of specific orbitofrontal cortical neurons in mice. Neurosci. Bull. 40, 1681–1698. doi: 10.1007/s12264-024-01229-8
Zhao, Y., Wang, S., Chu, Z., Dang, Y., Zhu, J., and Su, X. (2017). MicroRNA-101 in the ventrolateral orbital cortex (VLO) modulates depressive-like behaviors in rats and targets dual-specificity phosphatase 1 (DUSP1). Brain Res. 1669, 55–62. doi: 10.1016/j.brainres.2017.05.020
Keywords: orbitofrontal cortex, neural circuit, monosynaptic tracing, whole-brain inputs, rabies virus tracing
Citation: Yang M, Yang H, Shen L and Xu T (2025) Anatomical mapping of whole-brain monosynaptic inputs to the orbitofrontal cortex. Front. Neural Circuits 19:1567036. doi: 10.3389/fncir.2025.1567036
Received: 26 January 2025; Accepted: 18 March 2025;
Published: 04 April 2025.
Edited by:
Xiangmin Xu, University of California, Irvine, United StatesReviewed by:
Song-Lin Ding, Allen Institute for Brain Science, United StatesCopyright © 2025 Yang, Yang, Shen and Xu. This is an open-access article distributed under the terms of the Creative Commons Attribution License (CC BY). The use, distribution or reproduction in other forums is permitted, provided the original author(s) and the copyright owner(s) are credited and that the original publication in this journal is cited, in accordance with accepted academic practice. No use, distribution or reproduction is permitted which does not comply with these terms.
*Correspondence: Tonghui Xu, eHVfdG9uZ2h1aUBmdWRhbi5lZHUuY24=
Disclaimer: All claims expressed in this article are solely those of the authors and do not necessarily represent those of their affiliated organizations, or those of the publisher, the editors and the reviewers. Any product that may be evaluated in this article or claim that may be made by its manufacturer is not guaranteed or endorsed by the publisher.
Research integrity at Frontiers
Learn more about the work of our research integrity team to safeguard the quality of each article we publish.