
95% of researchers rate our articles as excellent or good
Learn more about the work of our research integrity team to safeguard the quality of each article we publish.
Find out more
BRIEF RESEARCH REPORT article
Front. Neural Circuits , 06 September 2023
Volume 17 - 2023 | https://doi.org/10.3389/fncir.2023.1214959
This article is part of the Research Topic Brain Stimulation Mechanisms and Therapeutic Effects in Neural Circuits View all 11 articles
 Jennifer Y. Cho1
 Sybren Van Hoornweder2
 Christopher T. Sege3
 Michael U. Antonucci4
 Lisa M. McTeague3,5
 Kevin A. Caulfield1,3*
Background: Electric field (E-field) modeling is a valuable method of elucidating the cortical target engagement from transcranial magnetic stimulation (TMS) and transcranial electrical stimulation (tES), but it is typically dependent on individual MRI scans. In this study, we systematically tested whether E-field models in template MNI-152 and Ernie scans can reliably approximate group-level E-fields induced in N = 195 individuals across 5 diagnoses (healthy, alcohol use disorder, tobacco use disorder, anxiety, depression).
Methods: We computed 788 E-field models using the CHARM–SimNIBS 4.0.0 pipeline with 4 E-field models per participant (motor and prefrontal targets for TMS and tES). We additionally calculated permutation analyses to determine the point of stability of E-fields to assess whether the 152 brains represented in the MNI-152 template is sufficient.
Results: Group-level E-fields did not significantly differ between the individual vs. MNI-152 template and Ernie scans for any stimulation modality or location (p > 0.05). However, TMS-induced E-field magnitudes significantly varied by diagnosis; individuals with generalized anxiety had significantly higher prefrontal and motor E-field magnitudes than healthy controls and those with alcohol use disorder and depression (p < 0.001). The point of stability for group-level E-field magnitudes ranged from 42 (motor tES) to 52 participants (prefrontal TMS).
Conclusion: MNI-152 and Ernie models reliably estimate group-average TMS and tES-induced E-fields transdiagnostically. The MNI-152 template includes sufficient scans to control for interindividual anatomical differences (i.e., above the point of stability). Taken together, using the MNI-152 and Ernie brains to approximate group-level E-fields is a valid and reliable approach.
Transcranial magnetic stimulation (TMS) and transcranial electrical stimulation (tES) are two methods of non-invasively stimulating the human brain (Barker et al., 1985; Nitsche and Paulus, 2000; Dayan et al., 2013). Using electromagnetic (i.e., TMS) or direct electrical energy (i.e., tES), non-invasive brain stimulation can excite or inhibit the different brain regions via long-term potentiation (LTP) or long-term depression (LTD)-like effects (Chervyakov et al., 2015; Kronberg et al., 2017). Researchers have utilized TMS and tES to stimulate various neural circuits to understand how exciting or inhibiting different brain regions within networks causally affects brain activity (Sack, 2006; Hobot et al., 2021; Grover et al., 2022). In addition, both TMS and tES have been used clinically for treating multiple neurological and psychiatric diagnoses. Most notably, TMS is US FDA-approved to treat depression (O’Reardon et al., 2007; George et al., 2010), depression with anxiety, obsessive compulsive disorder (OCD) (Carmi et al., 2019), migraine headaches, and tobacco use disorder (Zangen et al., 2021). However, while TMS is FDA-approved to treat these four diagnoses, it is not consistently effective for every patient. For instance, once daily TMS for depression has response rates in a naturalistic setting of approximately 50–70% (Carpenter et al., 2012, 2021). While impressive, there is still room for improvement. In addition, tES studies have reported varying results (Horvath et al., 2015), with multiple well-designed clinical trials reporting mixed findings in the treatment of depression (Brunoni et al., 2017; Loo et al., 2018) and in other domains such as working memory (Brunoni and Vanderhasselt, 2014; Papazova et al., 2018; Westwood and Romani, 2018). Thus, there is an ongoing need to further understand and develop more effective TMS and tES treatments for multiple diagnoses. A key consideration to improve TMS and tES efficacy is determining whether a therapeutic level of stimulation engages the cortical target and neural circuit of interest (Zmeykina et al., 2020; Turi et al., 2021). A tool that can elucidate the amount of target and circuit engagement, and potentially improve clinical responses via personalized dosing, is electric field (E-field) modeling.
E-field modeling is a method of accurately estimating how much non-invasive brain stimulation applied at the scalp reaches the cortical level using magnetic resonance imaging (MRI) scans, tissue segmentations/meshing, and tissue conductivity values (Huang et al., 2017; Saturnino et al., 2019). As the magnitude of the E-field affects brain activity in a specific region or network, variability in the induced E-field can subsequently impact clinical response (Suen et al., 2020; Caulfield et al., 2022b; Zhang et al., 2022; Deng et al., 2023). Seminal studies in clinical TMS described how older individuals with larger scalp-to-cortex distances did not respond to treatments suggesting that the induced E-field magnitude is key to maximizing therapeutic response (Kozel et al., 2000; Nahas et al., 2004). Regarding tES, researchers have reported varying effects at differing scalp stimulation intensities in 0.5 mA increments (Moliadze et al., 2012; Batsikadze et al., 2013), highlighting the need for dose standardization and more advanced understanding of tES-induced E-fields at the cortical level. E-field modeling can elucidate dose-response relationships between E-field magnitude and therapeutic response and has broad applications including prospective dosing to ensure patients receive similar E-field intensities at specific brain regions (Caulfield et al., 2020, 2021; Saturnino et al., 2021; Dannhauer et al., 2022). However, most clinical brain stimulation providers do not implement E-field modeling for a variety of reasons, including the difficulty of obtaining structural MRI scans, lack of E-field modeling expertise, and need for advanced equipment such as neuronavigation (Caulfield et al., 2022a).
A possible proxy for using individual MRI scans that has not yet been systematically investigated is whether using a template MRI scan would be a suitable method of approximating group-average E-field values. While a group-level E-field model is incapable of explaining interindividual variability, it is highly informative in the search for what E-field intensities are clinically meaningful, in which populations and setting. As many researchers also retrospectively report the induced E-fields in template or standard brains included in E-field modeling packages (e.g., Konakanchi et al., 2020; Cobb et al., 2021), we sought to assess the accuracy of utilizing template brains to estimate group-level E-field averages. Moreover, utilizing template MRI scans could be useful for exploring general, non-patient specific properties of non-invasive brain stimulation such as the effects of novel tES electrode placements, coil architecture or angle, or estimating group-level effects such as in grant applications or to demonstrate the feasibility of tES or TMS in particular populations.
In this study, our goal was to assess whether using the MNI-152 brain or Ernie brain included in E-field modeling software packages would produce similar E-field values to N = 195 TMS participants with T1w MRI scans. If template scan and group-average E-field values were similar, researchers and clinical providers without access to individual MRI scans could still inform and approximate E-field modeling derived values with greater certainty than would be afforded in the absence of computational approaches.
In total, we included the MRI scans of 195 participants in this E-field modeling study from an initial dataset of N = 197; two participants were deemed to have poor segmentation integrity and were excluded from further analysis. Each participant was treated with TMS in six Medical University of South Carolina IRB-approved protocols and provided written informed consent. The 195 participants were comprised of 106 men and 89 women, with an average age = 39.3 ± 14.0 years old and age range = 20–69 years old. Participants had the following five diagnoses: healthy controls (N = 31), alcohol use disorder (N = 87), tobacco use disorder (N = 31), generalized anxiety (N = 25), and depression (N = 21).
In addition, we utilized the MRI scans of the MNI-152 template brain (Fonov et al., 2011) and Ernie, an MRI scan and head model included in the SimNIBS software package that is commonly used to approximate E-fields. The MNI-152 template is an averaged structural MRI template based on 152 people, including 86 male/66 female brains with an average age = 25.02 ± 4.90 and age range = 18–44 years old. While the demographical information of the Ernie dataset has not been previously published due to PHI considerations, this head model has been used in several E-field modeling studies (e.g., Kalloch et al., 2020; Gomez et al., 2021).
Using a MagVenture MagPro R30 or X100 machine and Cool-B65 TMS coil, TMS operators acquired resting motor threshold (rMT) values for each of the 195 participants using a visual approach. We defined the motor threshold as 5/10 visible anterior pollicis brevis (APB) muscle twitches. The rMT values were an average of 50.46 ± 8.91% (range = 31–78%) of maximal machine output. Therefore, the average 120% rMT stimulation intensity was 60.55 ± 10.70% of maximal machine output. Both TMS machines have a maximal dI/dt stimulator-coil output of 150e6 A/s, ensuring that each participant was stimulated with the same intensity across machines.
As rMTs were not acquired for the MNI-152 and Ernie brains, we simulated TMS using 120% of the group average rMT from the N = 195 experimentally determined values to the closest percentage point. This equated to 61% of machine output on the MagVenture MagPro systems with Cool-B65 TMS coil.
Individual MRI scans were acquired at MUSC on a Siemens PRISMA 3T scanner and 32-channel head coil. Each participant underwent an MPRAGE structural T1w MRI scan with 0.9 mm × 0.9 mm × 0.9 mm isotropic voxels, image size: 256 × 256 × 256 voxels, TR: 2,300 ms, TE: 2.32 ms, TI: 900 ms, acceleration factor PE: 2, 192 slices, fat suppression off. The MNI-152 template brain is an open access composite brain comprised of 152 individuals with 1 mm × 1 mm × 1 mm voxels and image size: 182 × 238 × 282 voxels (Fonov et al., 2011). The Ernie T1w scan was acquired with 1 mm × 1 mm × 1 mm voxels with image size 182 × 238 × 282 voxels.
We utilized SimNIBS 4.0.0 (Saturnino et al., 2019) and the CHARM segmentation and meshing pipeline (Puonti et al., 2020) for E-field modeling based on individual MRI scans acquired in each participant and the MNI-152 and Ernie scans (Figure 1). In total, we created N = 195 individual head models and one head model each for the MNI-152 brain and the Ernie brain. CHARM segments and meshes MRI scans into anatomically accurate tetrahedral head models comprised of 9 tissue layers: scalp, compact bone, spongy bone, cerebrospinal fluid (CSF), gray matter, white matter, eyeballs, blood vessels, and muscle. We assigned standard tissue conductivity values (Wagner et al., 2004; Opitz et al., 2015; Saturnino et al., 2015) to each tissue type (Scalp: 0.465 S/m, compact bone: 0.008 S/m, spongy bone: 0.025 S/m, CSF: 1.654 S/m, gray matter: 0.275 S/m, white matter: 0.126 S/m, eyeballs: 0.5 S/m, blood vessels: 0.6 S/m, and muscle: 0.16 S/m). As each tissue is assigned a different conductivity value, E-field modeling can accurately estimate the magnitude of stimulation that reaches the cortex in both TMS and tES. We visually inspected each head model to ensure the accuracy of segmentation and meshing. Due to this process, the head models for two individuals from an initial 197 scans were excluded due to noticeable intersections between tissue layers.
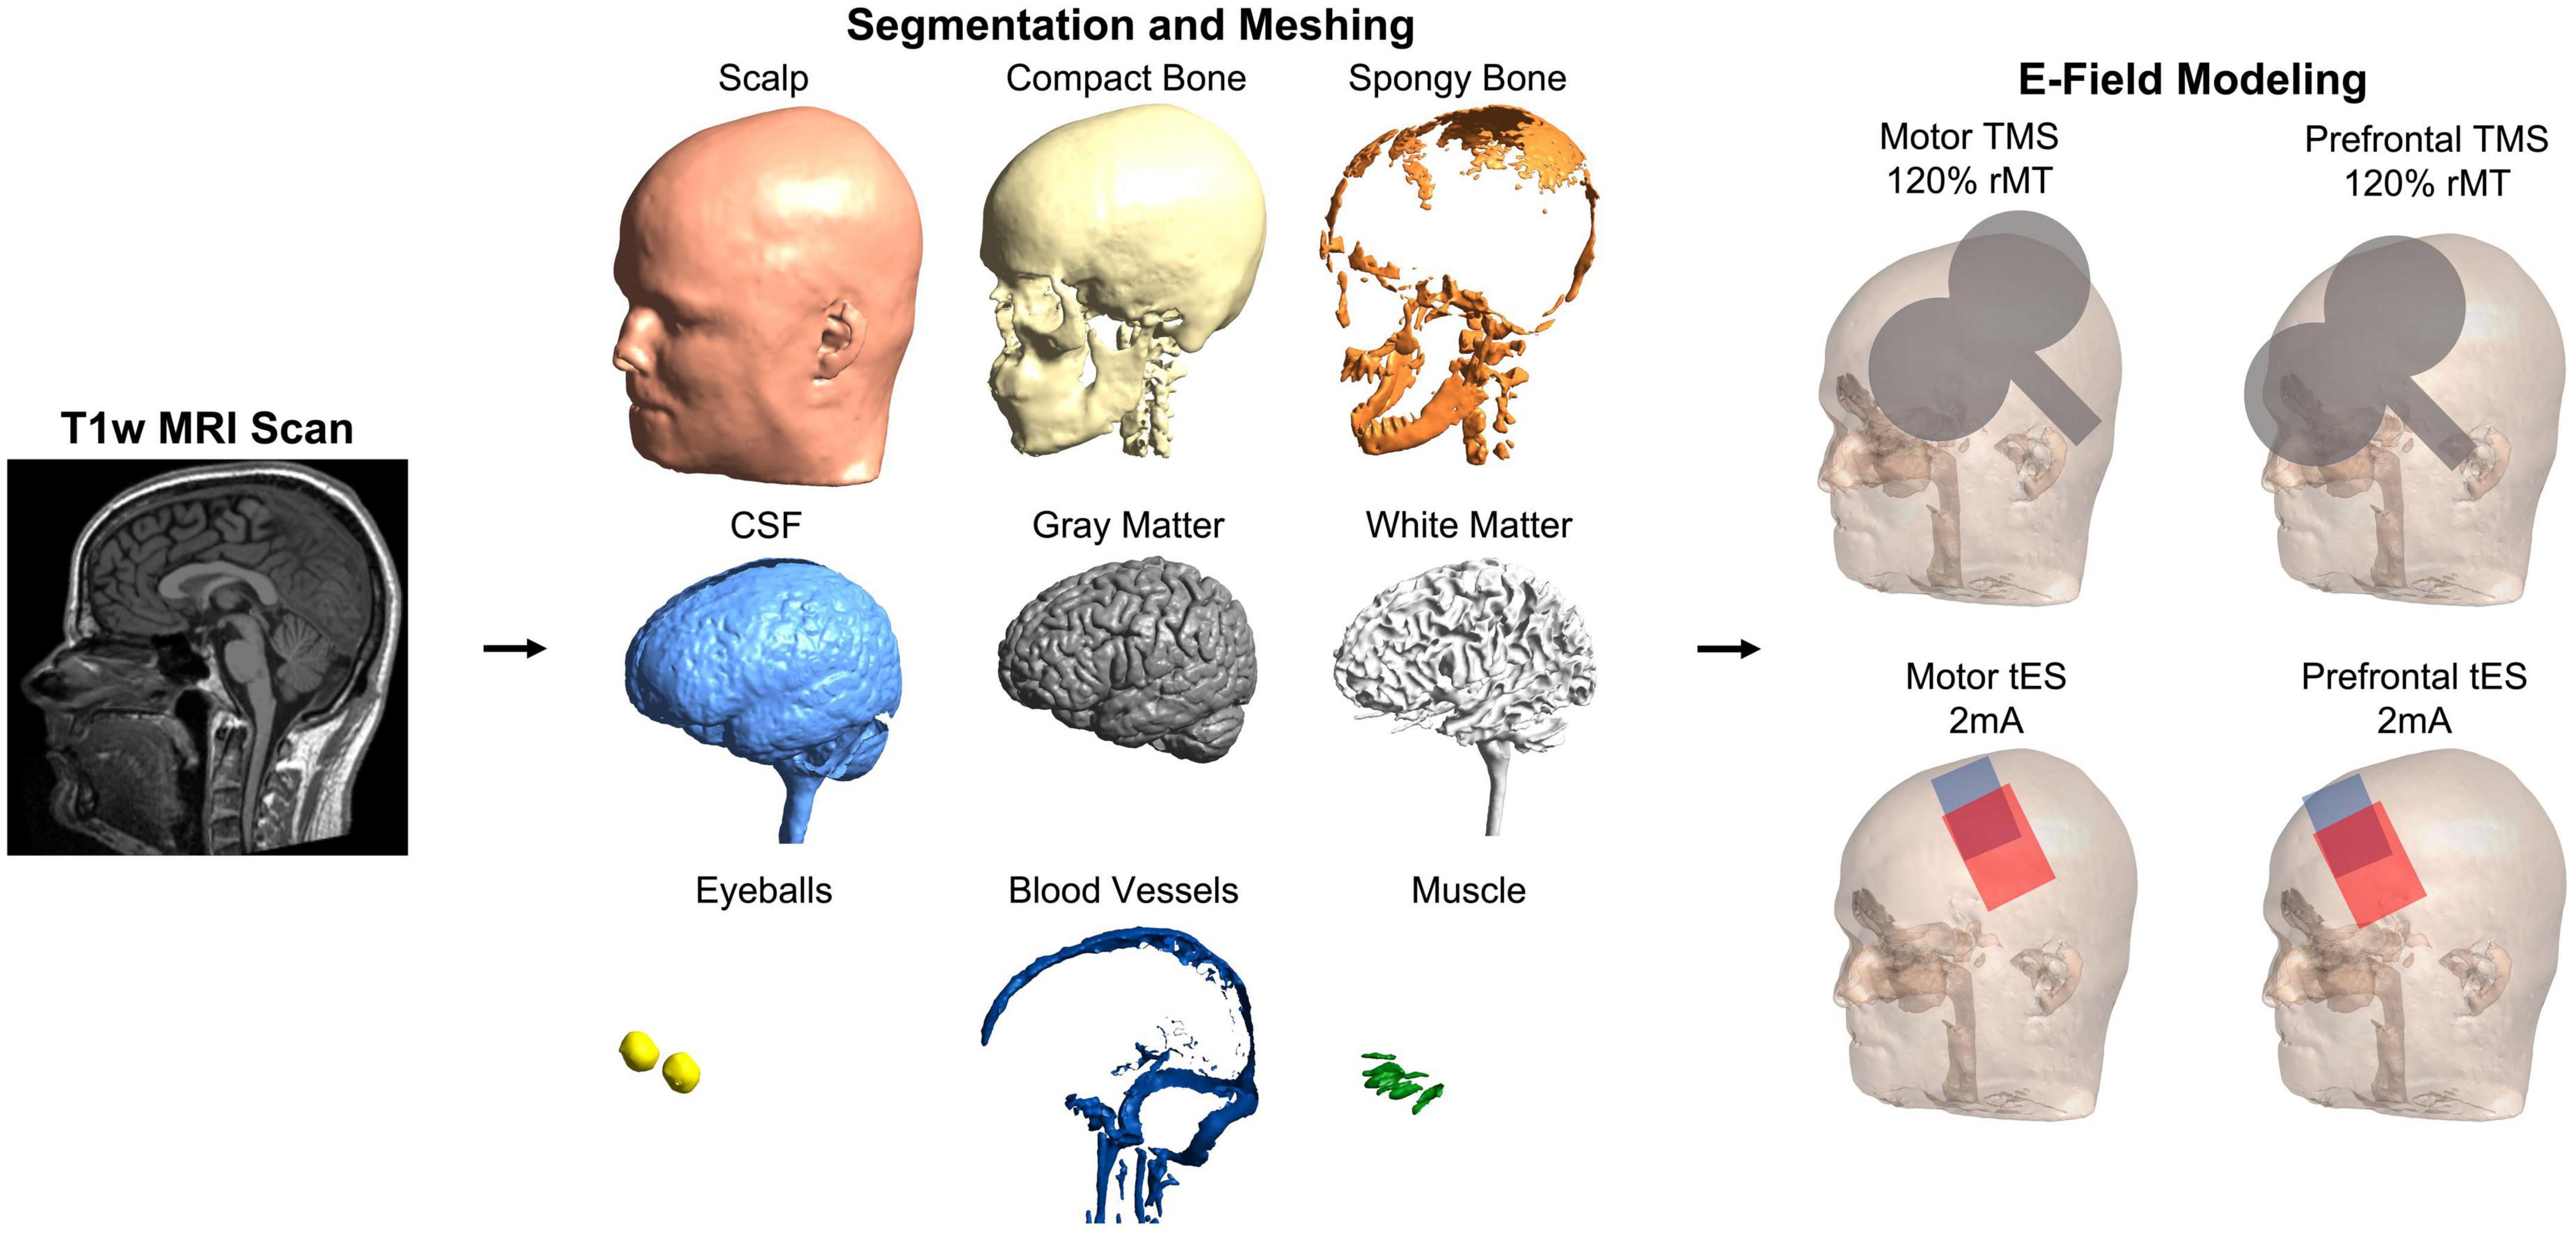
Figure 1. Electric field modeling pipeline. We created 195 individual head models and head models for the MNI-152 template brain and Ernie, an included mesh in the SimNIBS example folder. For each person, we computed four E-field models to simulate the effects of stimulation over the motor and prefrontal cortices with TMS and tES. This figure shows the pipeline in a representative participant.
Using the 10-10_UI_Jurak_2007 EEG coordinate file output in SimNIBS (Jurcak et al., 2007), we centered the simulated MagVenture_Cool-B65 coil model over C3 (motor) and F3 (prefrontal) (Beam et al., 2009) stimulation targets in two E-field models (Figures 1, 2). For stimulation intensity, we calculated the dI/dt value in A/s, with a maximum stimulator-coil output of 150e6 A/s. Using the motor threshold values, we calculated the 120% motor threshold stimulator output and multiplied this value by the maximum stimulator output (e.g., 50% stimulator output = 75e6 A/s). Custom MATLAB scripts ensured that the coil angle was oriented exactly 45° relative to the sagittal plane in each model.
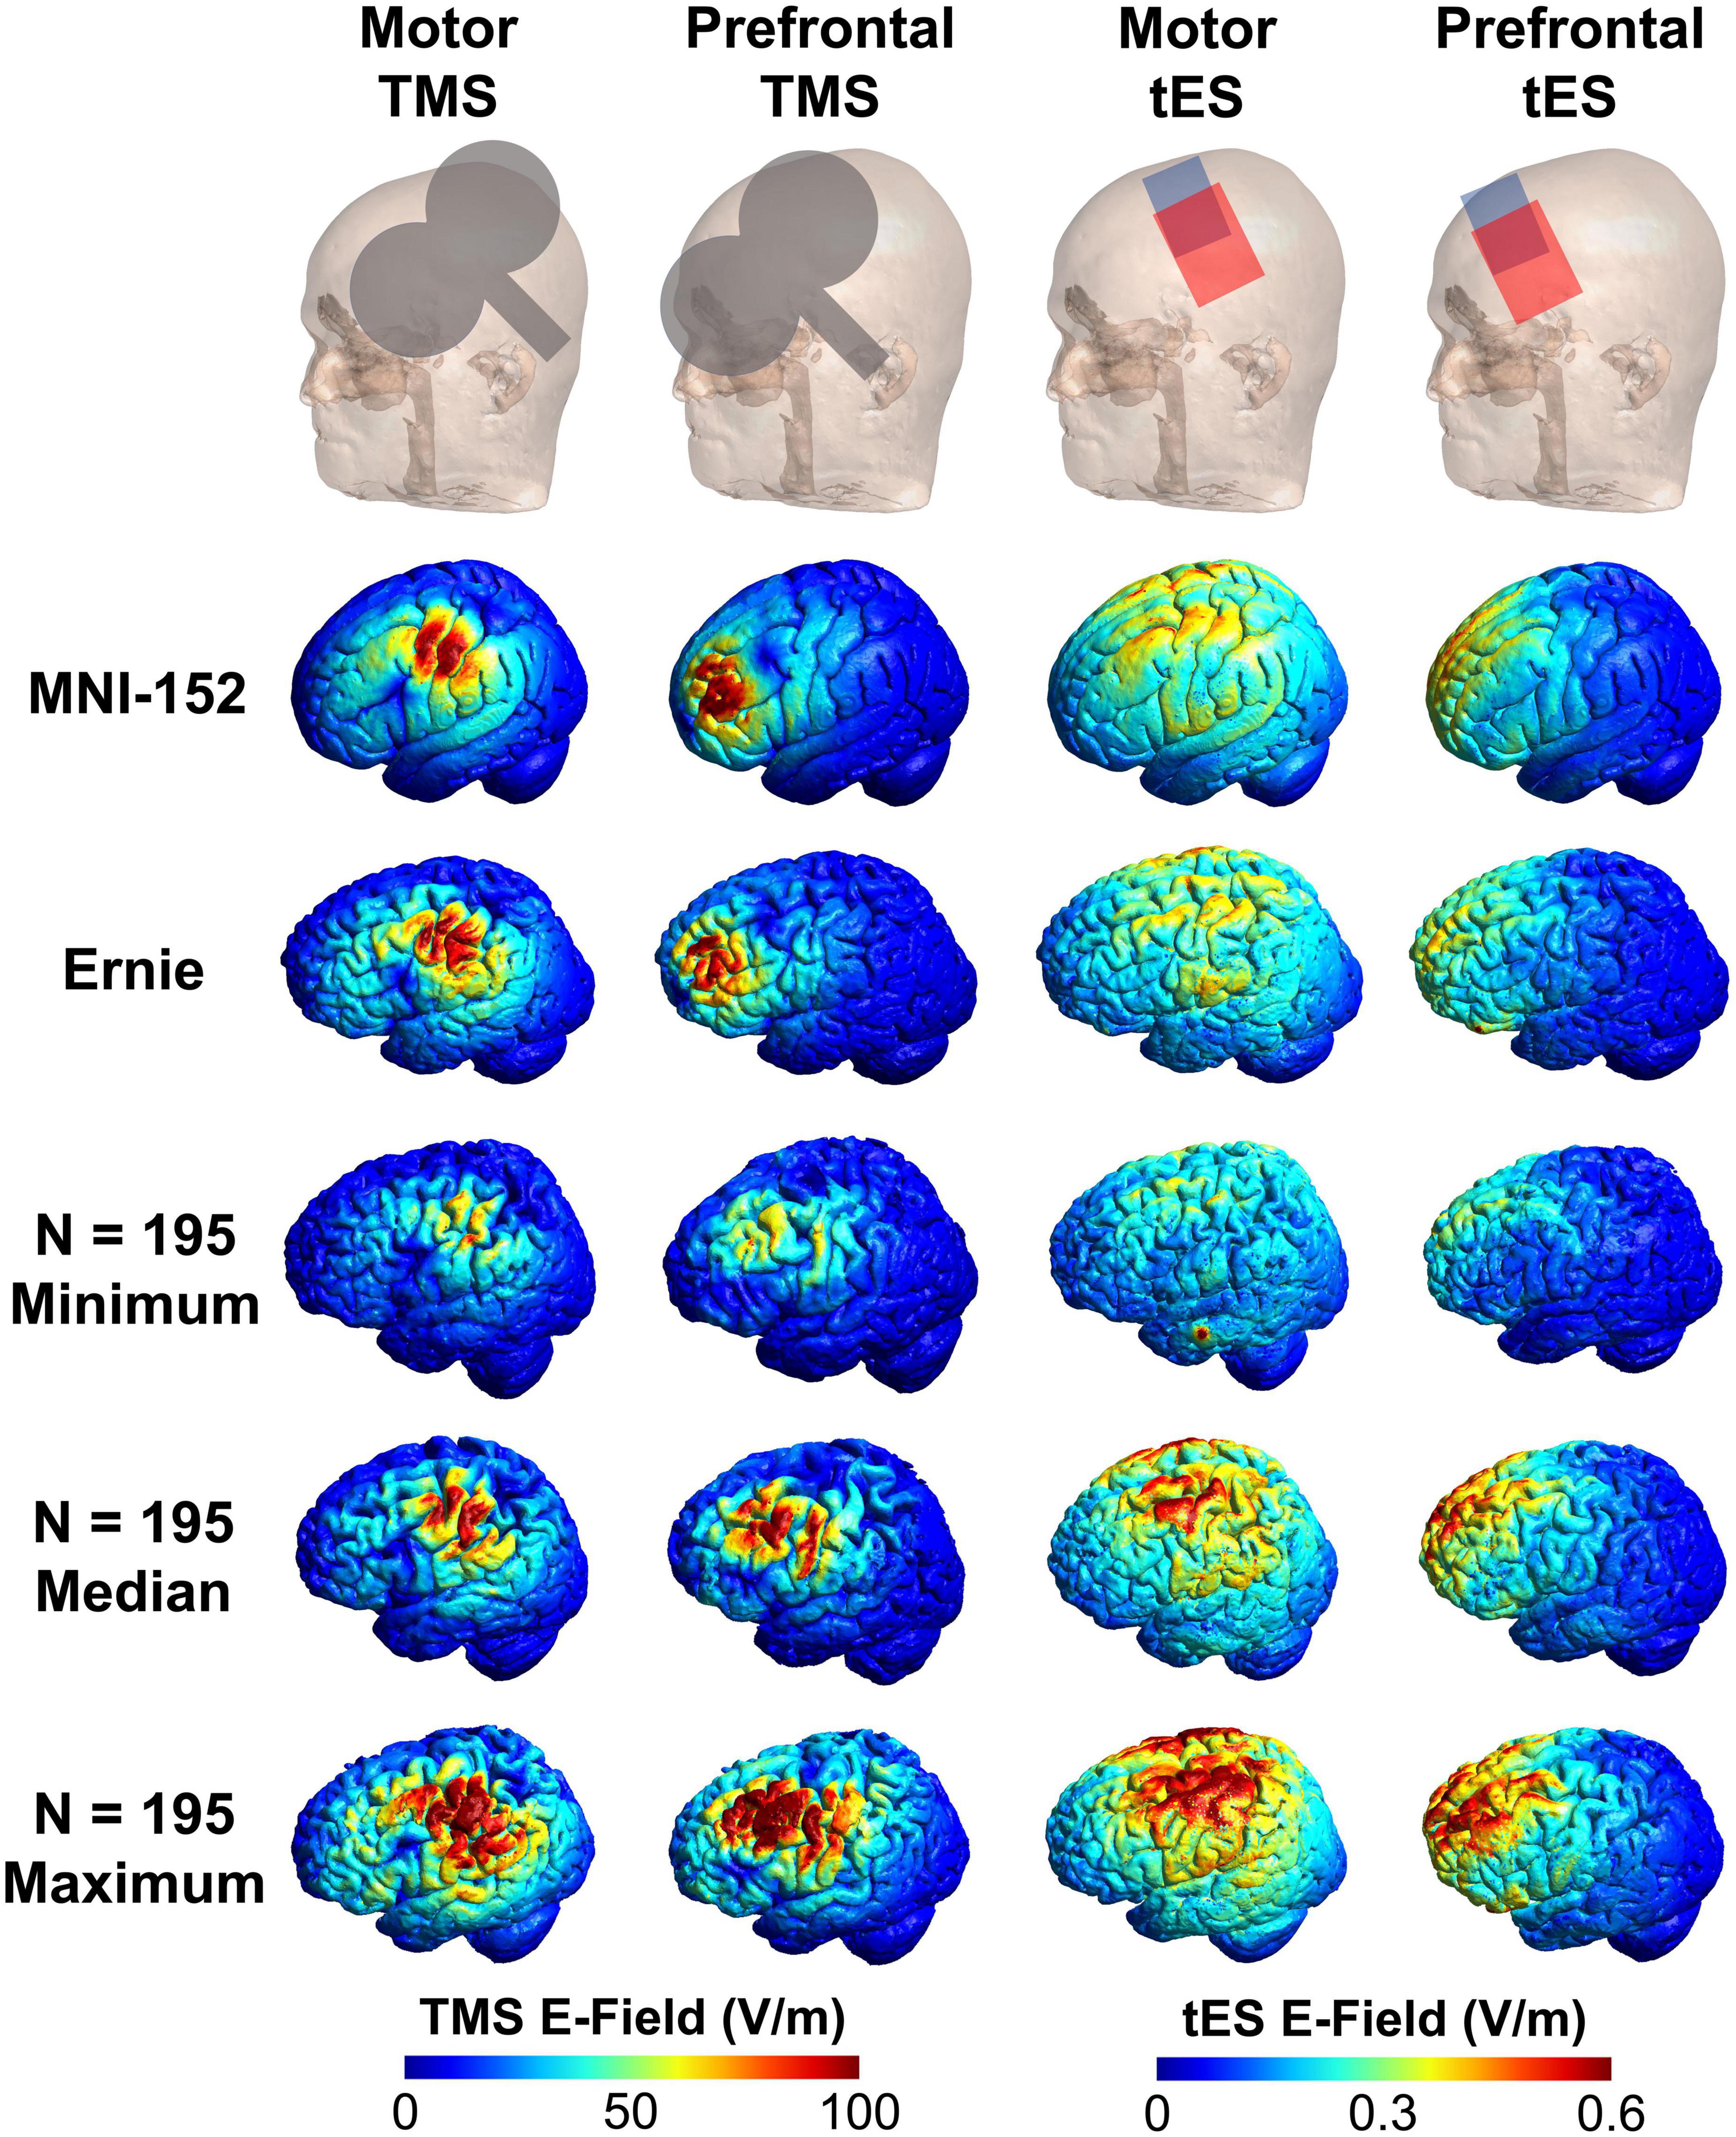
Figure 2. Visual comparison of the MNI-152, Ernie, and N = 195 individual E-field models. Here, we show the TMS coil and tES electrode placements, and E-field models in the MNI-152 and Ernie brains, as well as the E-field models in the N = 195 participants with the minimum, median, and maximum E-fields. Qualitatively, the MNI-152 and Ernie brains produce similar E-field magnitudes as the median models for each of the four stimulation types.
For tES simulations, we bilaterally centered electrodes over the motor (C3 and C4) or prefrontal (F3 and F4) cortices using the same 10-10_UI_Jurak_2007 EEG coordinate file (Figures 1, 2). We used conventional 7 cm × 5 cm pad electrodes with the longer electrode axis oriented left/right on each participant’s scalp. tES was simulated using 2 mA electrical current with the anodal electrode placed over the left hemisphere (C3 and F3) and the cathodal electrode placed over the right hemisphere (C4 and F4). While there are other commonly used electrode placements such as C3-supraorbital (SO) and F3-SO, we chose bilateral placements as they are commonly used and previous reports have found no significant differences in large-scale modeling between bilateral C3-C4 and C3-SO placements with 7 cm × 5 cm pad electrodes (Caulfield and George, 2022).
To examine the E-field at the cortical target, we utilized two region of interest (ROI) analyses for both the TMS and tES models. Both ROIs extracted the average E-field within a spherical volume with a radius of 10 mm with a gray matter mask, as has been previously reported in the literature (e.g., Caulfield et al., 2022a; Caulfield and George, 2022). At a post-processing step, the CHARM segmentation pipeline fits the MNI template brain to the individual scan enabling researchers to perform analyses using standardized MNI coordinates across participants. Notably, this MNI template fitting does not affect the segmentation and meshing process as CHARM was trained on N = 20 individual head models.
For each person, the ROIs were centered over the stimulation target in the left hemisphere at motor MNI coordinate: −52.2, −16.4, 57.8 and prefrontal MNI coordinate at −35.5, 49.4, 32.4, based on publications reporting the locations of the cortical projections from scalp locations C3 (motor cortex) and F3 (prefrontal cortex) (Okamoto et al., 2004; Okamoto and Dan, 2005).
We conducted two types of statistical analyses to assess the suitability of utilizing the MNI-152 and Ernie scans and head models in lieu of having individual MRI scans. First, we used four one-way ANOVAs to assess the group-level differences between individual MRI scan E-field models and the MNI-152 and Ernie E-field models (four ANOVAs; one ANOVA each for motor TMS, prefrontal TMS, motor tES, and prefrontal tES). In addition, we computed additional one-way ANOVAs measuring the effects of diagnosis or sex on E-field results and differences between individual, MNI-152, and Ernie scans (eight total ANOVAs; one set of four ANOVAs for diagnosis and one set of four ANOVAs for sex). For sex, we accounted for conditions of men in the N = 195 sample, women in the N = 195 sample, the MNI-152 template, and Ernie. We chose to not examine the effects age on E-field magnitudes due to the collinearity of age and increased scalp-to-cortex distances already inherently being accounted for in E-field models and the unknown age of Ernie. All ANOVAs were calculated using SPSS 27.0 (IBM Corp., Armonk, NY, USA). For all statistical measures, the significance level was set to α = 0.05 (two-tailed).
Second, to determine the minimum number of E-field models on individual scans to obtain a stable E-field value, we performed four permutation statistical analyses on the 195 individual E-field models in MATLAB R2022b (The Mathworks Inc., Natick, MA, USA). Our approach was based on the work of Van Hoornweder et al. (2022a). In the sample of N = 195 E-field models for each stimulation paradigm (i.e., motor TMS, prefrontal TMS, motor tES, and prefrontal tES), we randomly selected subsamples with increasing size from N = 1 to N = 195, repeating the procedure 10,000 times per subsample (i.e., 1,950,000 subsamples for each permutation). We chose to combine the heterogenous populations to maximize the likelihood of determining a corridor of stability since each individual diagnostic population had only N = 21 to N = 87 participants. We defined a corridor of stability between the 5 and 95th percentile range of the entire sample. In line with prior methodology, we calculated the “point of stability” which we defined as the point where the mean of the randomly selected subsample enters the corridor of stability and does not leave it at increasing subsample sizes. Our primary goal in determining the point of stability was to assess how many individual scans and subsequent E-field models would be needed to produce stable E-field values on the group level; if this number were larger than 152, it would suggest that a template brain with more scans than the MNI-152 composite scan would be necessary to accurately estimate group-level E-field models. All data are reported as mean ± standard deviation (SD).
For both motor and prefrontal TMS-induced E-fields, the 195 individual MRI scans did not significantly differ from the MNI-152 and Ernie brains (Figures 3A, B). TMS-induced motor E-fields did not significantly differ amongst the individual brains (85.3 ± 15.5 V/m), MNI-152 template (78.2 V/m), and Ernie brain (81.5 V/m), F(2, 194) = 0.13, p = 0.88, ηp2 = 0.001 (Figure 3A and Table 1). Similarly, TMS-induced prefrontal E-fields did not significantly differ between individual brains (80.3 ± 14.9 V/m), the MNI-152 template (80.1 V/m), and Ernie brain (72.6 V/m), F(2, 194) = 0.14, p = 0.87, ηp2 = 0.001 (Figure 3B).
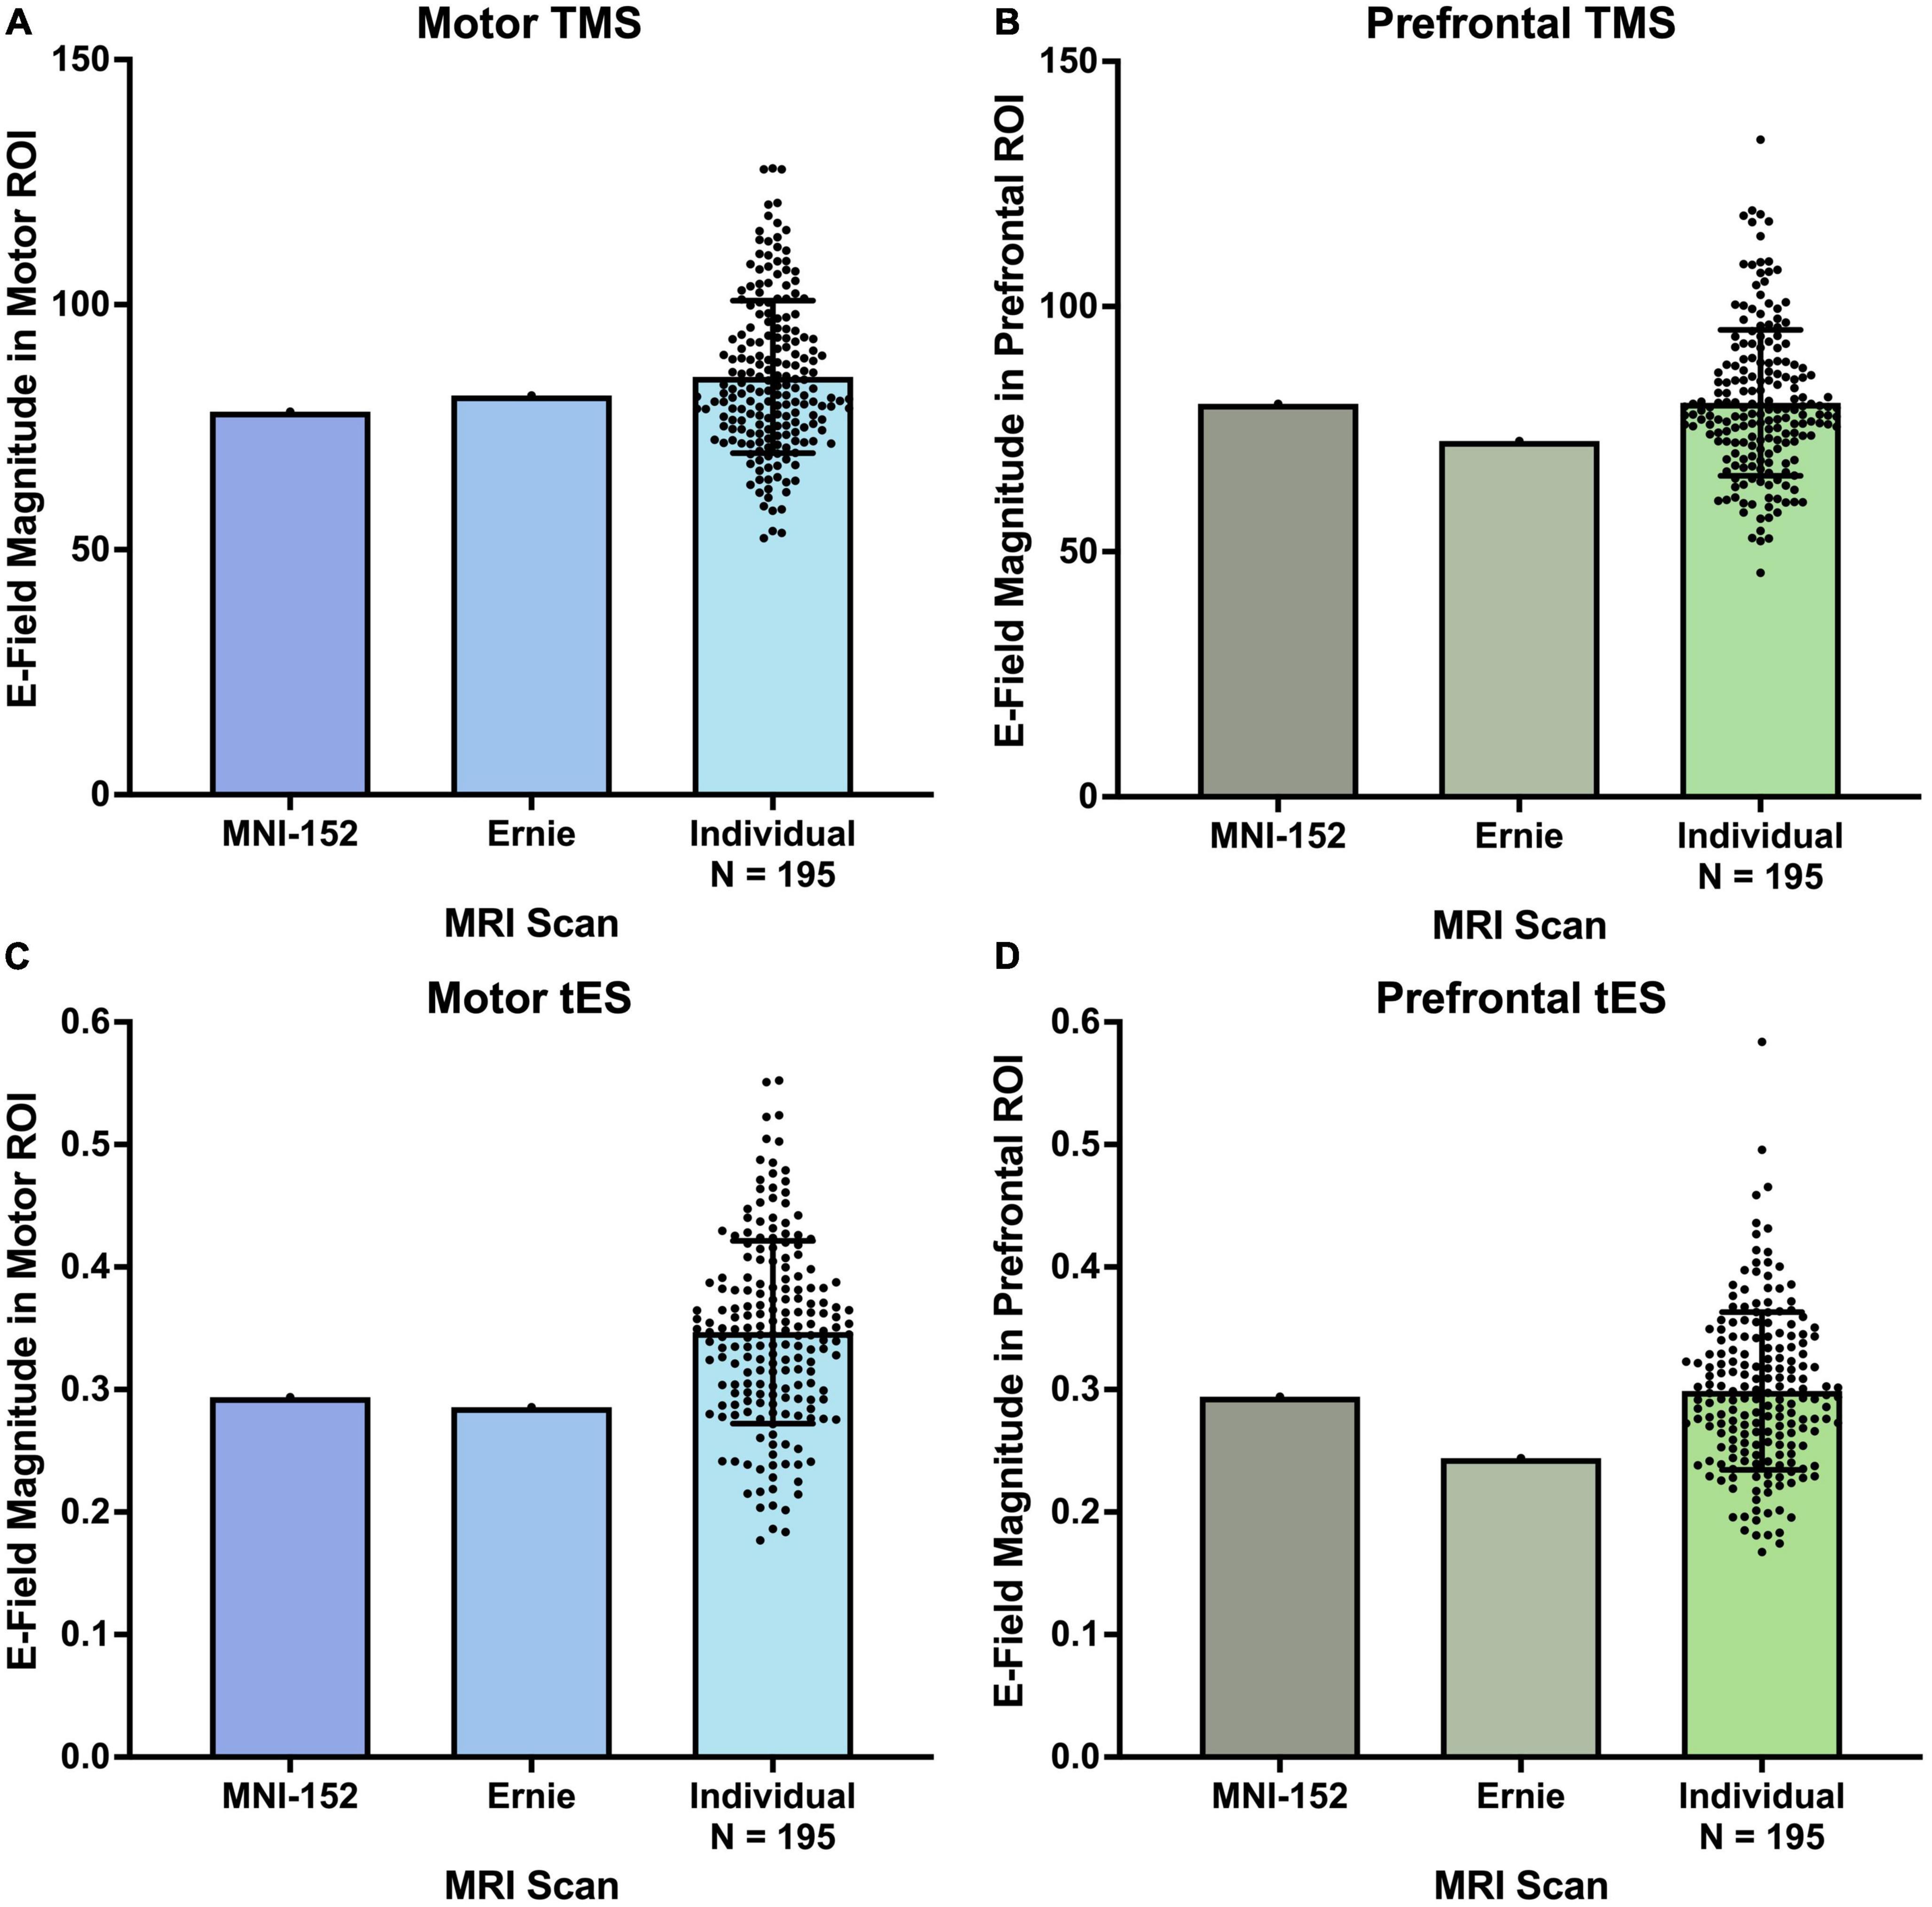
Figure 3. E-field magnitudes produced from the MNI-152, Ernie, and N = 195 individual head models. There were no significant differences between the E-field magnitudes produced at motor and prefrontal ROIs between the MNI-152, Ernie, and N = 195 individual models, suggesting that template brains can reliably approximate the E-fields produced on a group level. Error bars denote ± standard deviation.
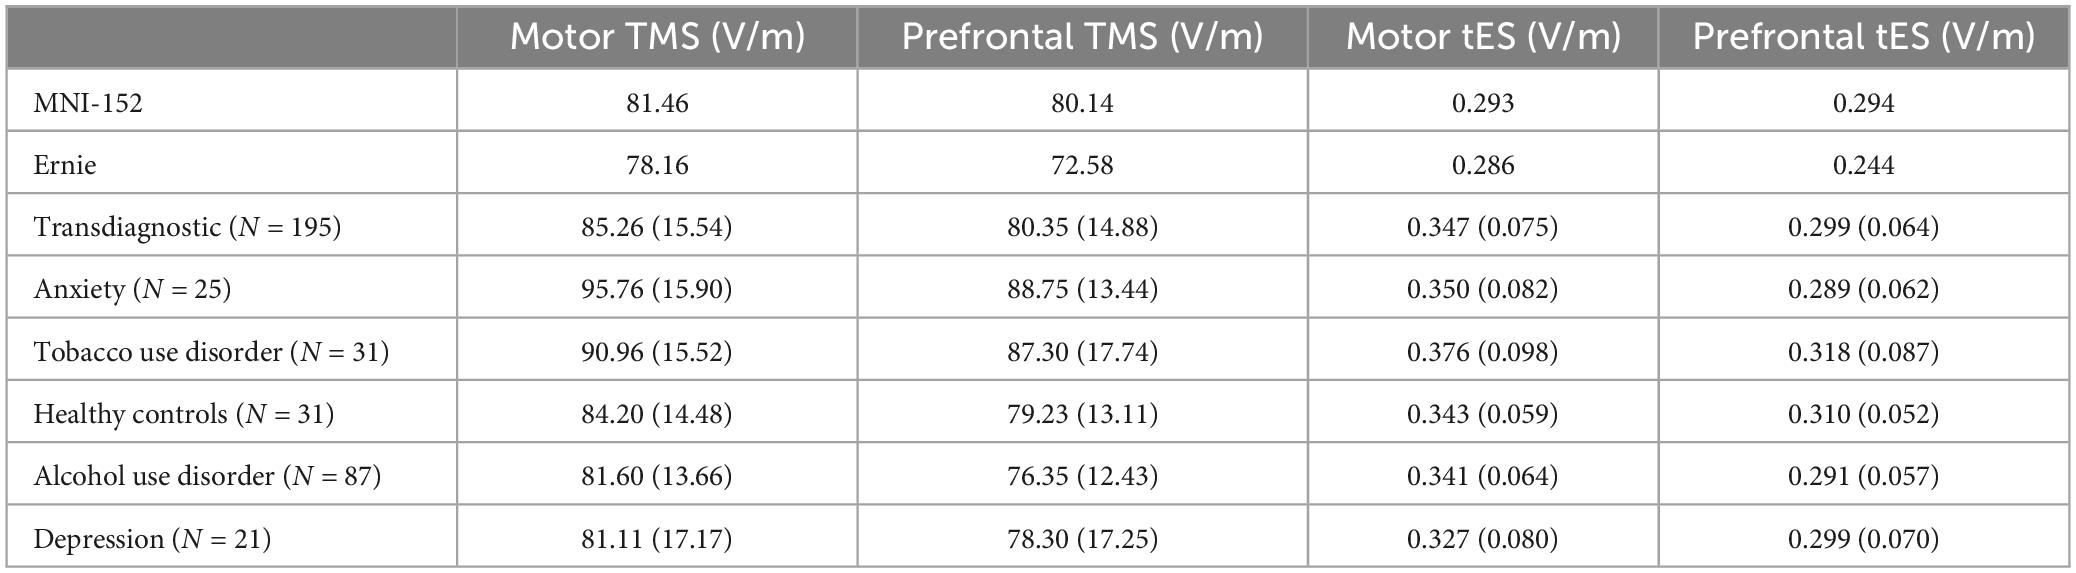
Table 1. Electric field means and standard deviations (in parentheses) of MNI-152, Ernie, transdiagnostic, and individual diagnostic populations.
We additionally measured the differences in TMS-induced E-fields by diagnosis, finding that there were significant effects of diagnosis on E-field magnitude in both motor [F(4, 190) = 6.09, p < 0.001, ηp2 = 0.114] and prefrontal TMS [F(4, 190) = 5.96, p < 0.001, ηp2 = 0.111]. See Table 1 for detailed E-field magnitudes reported by diagnosis. For motor TMS, post hoc Tukey-corrected analyses revealed significant differences between generalized anxiety (95.8 ± 15.9 V/m) compared to healthy controls (84.2 ± 14.5 V/m), alcohol use disorder (81.6 ± 13.7 V/m), and depression (81.1 ± 17.2 V/m). We found additional differences between the motor E-field magnitudes produced in tobacco use disorder (91.0 ± 15.5 V/m) and alcohol use disorder. For prefrontal TMS, participants with generalized anxiety (88.8 ± 13.4 V/m) and tobacco use disorder (87.3 ± 17.7 V/m) had significantly higher E-fields than those with alcohol use disorder (76.3 ± 12.4 V/m).
Regarding the effects of sex on TMS-induced E-fields, we found no significant differences between E-field magnitudes for men, women, the MNI-152, or Ernie brains. For motor TMS models, women (87.7 ± 15.5 V/m), men (83.2 ± 15.4 V/m), the MNI-152 template (78.2 V/m), and Ernie (81.5 V/m) did not significantly differ in E-field magnitude, F(3, 193) = 0.89, p = 0.45, ηp2 = 0.014, F(3, 193) = 1.42, p = 0.24, ηp2 = 0.022. Similarly, for prefrontal TMS models did not significantly differ between populations of women (82.1 ± 14.8 V/m), men (78.8 ± 14.8 V/m), the MNI-152 template (80.1 V/m), and Ernie (72.6 V/m), F(3, 193) = 0.89, p = 0.45, ηp2 = 0.014.
Likewise, both the motor and prefrontal tES E-fields were similar between the N = 195 individual scans, the MNI-152 template, and Ernie brains (Figures 3C, D). Motor tES E-fields did not significantly differ between the individual brains (0.35 ± 0.075 V/m), MNI-152 template (0.29 V/m), and Ernie brain (0.29 V/m), F(2, 194) = 0.58, p = 0.56, ηp2 = 0.006 (Figure 3C). Furthermore, prefrontal tES E-fields did not significantly vary between individual brains (0.30 ± 0.06 V/m), the MNI-152 template (0.29 V/m), and Ernie brain (0.24 V/m), F(2, 194) = 0.36, p = 0.70, ηp2 = 0.004 (Figure 3D).
In contrast to the TMS-induced E-fields, tES E-fields did not differ by diagnosis for both motor [F(4, 190) = 1.76, p = 0.14, ηp2 = 0.036] and prefrontal tES [F(4, 190) = 1.42, p = 0.23, ηp2 = 0.029]. See Table 1 for specific E-field magnitudes by diagnosis.
With regards to the effects of sex on tES-induced E-fields, we found no significant differences between E-field magnitudes for men, women, the MNI-152, or Ernie brains. For motor tES, there were no significant differences between women (0.36 ± 0.082 V/m), men (0.33 ± 0.066 V/m), the MNI-152 template (0.29 V/m), and Ernie brains (0.29 V/m), F(3, 193) = 2.52, p = 0.06, ηp2 = 0.038. Likewise, for prefrontal tES, there were no significant differences between women (0.30 ± 0.069 V/m), men (0.30 ± 0.061 V/m), MNI-152 template (0.29 V/m), and Ernie brains (0.24 V/m), F(3, 193) = 0.42, p = 0.74, ηp2 = 0.006.
Using four permutation analyses, we determined the minimum number of participants and E-field models needed to produce stable group-level E-field values in this heterogenous N = 195 group (Figure 4). For motor TMS, the stable E-field value was achieved at N = 48 participants compared to N = 52 for prefrontal TMS (Figures 4A, B). Regarding motor tES, N = 42 participants were needed to achieve stability, versus N = 51 for prefrontal tES (Figures 4C, D).
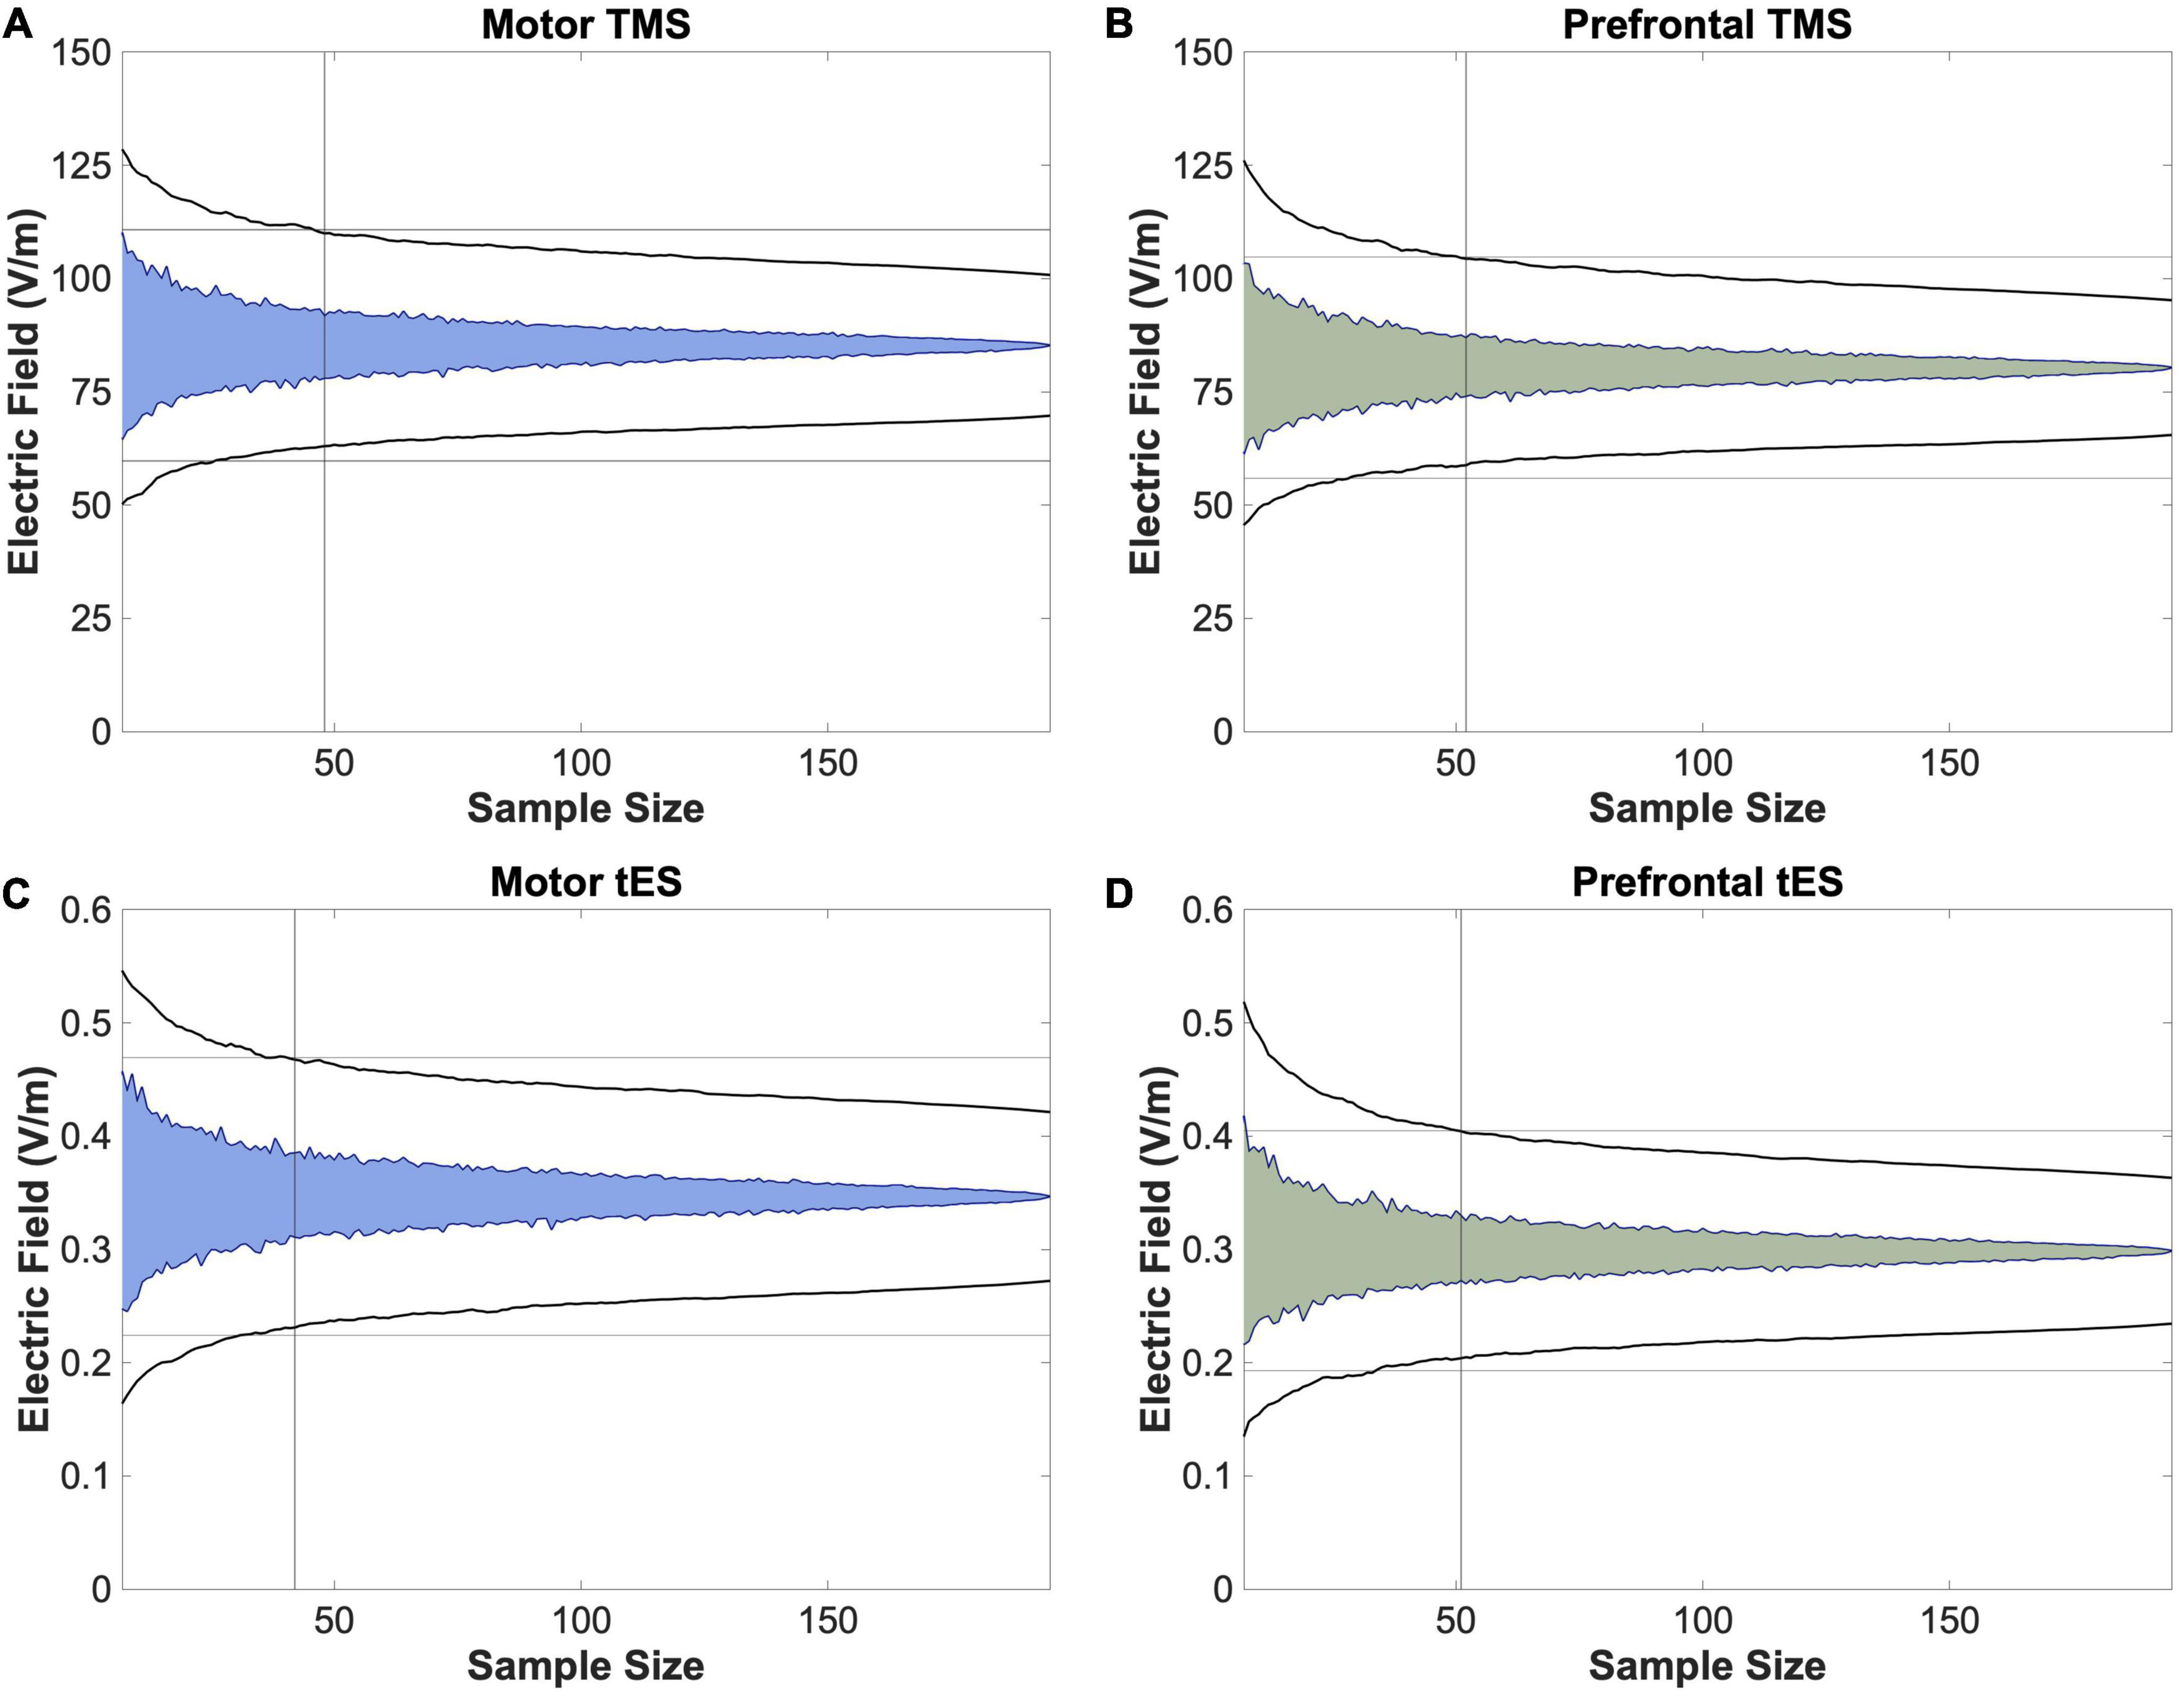
Figure 4. Permutation analyses to determine stable sample sizes in N = 195 participants. To further analyze whether utilizing a template scan is an appropriate method of approximating group-level E-field magnitudes of different stimulation paradigms, we performed bootstrapping analyses to determine the stable sample size at which the E-fields produced remained within the 95% confidence interval, as denoted with a vertical line. We found that this number ranged from 42 (motor tES) to 52 (prefrontal TMS). As 52 participants is lower than the 152 scans included in the MNI-152 template, these data suggest that utilizing template scans may be a method of estimating stable group-level E-field magnitudes.
In this study, we assessed the utility of calculating TMS and tES E-field models in the template MNI-152 scan and Ernie brain compared to N = 195 participants with 5 diagnoses (i.e., healthy controls, alcohol use disorder, tobacco use disorder, generalized anxiety, and depression). We simulated four common non-invasive brain stimulation protocols (i.e., motor and prefrontal TMS and tES) per participant for 788 total E-field models. We found that there were no significant group-level differences of the E-field magnitudes induced from motor and prefrontal TMS and tES from individual scans vs. MNI-152 and Ernie brains. For TMS, the MNI-152 template produced 8.3 and 0.3% lower E-fields for the motor and prefrontal cortices, respectively, while the Ernie brain had 4.5 and 9.7% lower E-fields than the group average motor and prefrontal E-fields from the N = 195 participants (Figure 3 and Table 1). There were more pronounced, albeit still non-significant differences for tES, with the MNI-152 template producing 16.3 and 1.6% lower E-fields and the Ernie brain having 17.7 and 18.4% lower E-fields in the motor and prefrontal cortices, respectively, than the N = 195 individual models. Thus, while there were no significant overall E-field magnitude differences, it appears that the MNI-152 and Ernie brains are most accurate at estimating the group-level regions and neural circuits simulated by TMS, compared to tES. In conjunction with prior reports (Minjoli et al., 2017; Tzirini et al., 2022), MNI-152 and Ernie brains may be most accurate at estimating TMS-induced E-fields due to TMS being less affected by individual tissue composition due to the electromagnetic stimulation approach compared to the direct electrical stimulation method utilized in tES, which is more heavily governed by the underlying tissue composition.
It is also important to consider the effects of diagnosis on E-field magnitude. Here, we reported that TMS-induced E-fields differ as a product of diagnosis, such that individuals with generalized anxiety and tobacco use disorder had significantly higher motor and prefrontal E-fields than those with alcohol use disorder. In addition, individuals with generalized anxiety had significantly higher motor E-fields than healthy controls and people with depression. Interestingly, these nuanced relationships between E-field magnitude and diagnosis only existed for TMS and not tES, as all tES-induced E-fields did not differ by diagnosis (Table 1). This may be in part due to uniform tES applying the same stimulation intensity of 2 mA across models whereas our TMS models used the experimentally-determined dI/dt values based on individual motor thresholds determined for each person. Since a uniform stimulation intensity was applied across each person, fixed dose 2 mA tES may have reduced the amount of variation between individuals that individualized motor threshold values provide. These data point at the utility of personalized dosing for tES as certain diagnoses likely require a higher individualized dosage for appropriate target engagement of cortical targets and neural circuits. Moreover, since we found no group-level differences combining across diagnoses between N = 195 TMS and tES E-fields and template MNI-152 and Ernie brains, this relationship may change depending on the different diagnoses considered. Therefore, future research should consider further investigating the appropriateness of using template MNI-152 and Ernie brains to estimate group-level E-fields in different populations. Likely, these TMS-induced E-field data indicate differing neurophysiology and the up- or down-regulation of neural circuits across diagnostic populations. In comparison, similar tES-induced E-fields across diagnoses might indicate that the scalp-to-cortex distance and tissue compositions may be relatively similar across populations, as reflected by the similar tES-induced E-field magnitude values. Future research could further elucidate the modality-specific findings and interactions with diagnoses that we reported here.
In a second series of analyses, we used a permutation approach to compute the point of stability at which the group average E-field value did not increase in variance with additional E-field models (i.e., the point of stability). The point of stability differed slightly by stimulation modality and location, with a range of 42 to 52. Notably, the point of stability across stimulation modalities was always well short of the 152 scans included in the MNI-152 brain, further validating the composite brain as having a high enough number of scans that the interindividual variation is likely appropriately represented. Taken together, these data validate the strategy of using a template MNI-152 brain scan to approximate group-level E-field results as it takes many scans into consideration that average across neuroanatomical idiosyncrasies.
There are numerous implications of this research and how template MRI scans could be utilized to estimate how much stimulation reaches the cortex. First, while the utility of using template brains for E-field modeling is question-dependent, it appears that template brains can reliably estimate group-level effects, even in a clinically heterogenous group. We report that the group-level E-field values from individual MRI scans do not significantly differ from the E-field values produced from MNI-152 and Ernie brains, validating the use of template scans to estimate group-level E-field values. Using template scans for E-field modeling could have multiple uses. For instance, using template scans for E-field modeling could inform the effects of more sophisticated and optimized electrode positioning, sizes, and inter-electrode distances such as through high definition tES (HD-tES) or anterior posterior pad surround tES (APPS-tES), as has been done in prior publications (Datta et al., 2009; Deng et al., 2013; Saturnino et al., 2015; Laakso et al., 2016; Caulfield and George, 2022). As many tES studies do not acquire MRI scans, particularly with the increasing use of at-home tES (André et al., 2016; Riggs et al., 2018; Pilloni et al., 2022), using a template MRI scan to plan more optimized tES electrode positioning and intensity for a specific goal may help to ensure that a therapeutic cortical intensity is induced at the right target on the group level.
It is also interesting to compare our findings to prior efforts looking at datasets of 60 or more individual E-field models such as the study by Laakso et al. (2016). Similar to our results, these researchers reported more variable frontal tES-induced E-fields than motor E-fields, substantiating our finding that prefrontal tES-induced E-fields required a greater number of participants to obtain a point of stability (Figure 4). This is notable as Laakso et al. (2016) included 64 healthy younger adults whereas we collapsed across 5 transdiagnostic groups, suggesting that our results might hold true in individual populations. It is also important to note other potential differences between our study and the one by Laakso et al. (2016), including different E-field measures (ROI magnitude vs. whole brain normal component). Further research with larger sample sizes per diagnostic condition is needed.
Furthermore, tES has widespread clinical potential but there have been mixed results to date, possibly in part to different amounts of stimulation reaching the cortex with uniform 2 mA dosing. Personalized E-field dosing is an approach that could standardize the stimulation intensity at the cortical target based on varying the dose at the scalp (Caulfield et al., 2020). While personalized E-field dosing is not possible using a template scan, our hope is that we have validated the approach of modeling on the MNI-152 or Ernie brains to provide reliable general estimations for how much stimulation is reaching the cortex in an average person. In turn, the information obtained from quantifying how much stimulation is reaching the cortex on average will surely benefit the ongoing search for the optimal E-field magnitude to maximize non-invasive brain stimulation effects within specific clinical populations and settings (Wischnewski et al., 2021; Alekseichuk et al., 2022; Caulfield et al., 2022b).
Moreover, it is now a common practice to include E-field models in brain stimulation publications and grant applications to substantiate experimental choices of where to position the TMS coil or tES electrodes and which stimulation intensity to choose. As such, including E-field models are informative and allow peers to assess whether an appropriate amount of stimulation reaches the cortex and adequately stimulates the neural circuit of interest. In lieu of having already acquired MRI scans, many researchers perform these E-field models on the MNI-152 template brain (Konakanchi et al., 2020; Cobb et al., 2021), or on the Ernie brain (Kalloch et al., 2020; Gomez et al., 2021) included in the SimNIBS software package. Our study validates the strategy of performing E-field modeling on these MNI-152 and Ernie head models as they can reliably approximate group-level E-field effects of how much and where in different brain regions and neural circuits the stimulation reaches the cortex. Furthermore, it was previously unclear whether the use of the MNI-152 template brain, comprised of healthy adults, would adequately estimate the stimulation intensity in clinical populations. While our scope was limited to diagnoses of mental health and healthy participants, our finding that the group-level E-fields induced from motor and prefrontal tES and TMS did not differ from the template brain suggests that template brain models produce roughly the same E-field magnitudes transdiagnostically. This work should be further evaluated in other diagnoses as particular populations (e.g., stroke) could have greater E-field differences compared to template scan E-fields, especially based on lesion location (Minjoli et al., 2017; Mantell et al., 2021).
While the specific research question dictates the most suitable E-field modeling approach, these data suggest an upper sample size limit of what researchers might consider for future group-level E-field modeling studies. Since it is relatively simple to scale up the number of models and participants in modeling approaches, some researchers have included hundreds of participants with the goal of obtaining stable E-field values that were not significantly impacted by outliers (e.g., Caulfield and George, 2022). Our bootstrapping data suggest that for research questions about the group-level effects of E-field modeling, there is no additional increase in the variation of modeling results above 52 individuals for any stimulation modality. Thus, if the experimenter includes more participants with the objective of reducing the variation of group-level E-field estimates, there are diminishing returns above the point of stability. However, it is important to note that prior findings suggesting that the point of stability is higher than N = 52 were likely biased by larger sample sizes (Van Hoornweder et al., 2022a), as is the case in any permutation approach. Future research might also consider performing permutation analyses that separate participants by diagnosis to investigate whether there are differences in the point of stability by condition.
Finally, while we primarily considered how E-field modeling in a template brain might be able to inform group-level analyses, it is important to substantiate how an individually selected E-field value would compare to the MNI template brain estimate (see Figure 2 for minimum, median, and maximum E-fields in the N = 195 sample compared to the MNI-152 template and Ernie brain). We reported the following averages and ranges of E-field magnitudes produced from TMS and tES: motor TMS: 85.3 ± 15.5 V/m; prefrontal TMS: 80.3 ± 14.9 V/m; motor tES: 0.35 ± 0.07 V/m; prefrontal tES: 0.30 ± 15.5 V/m. While examining individual E-fields in retrospective or prospective study designs necessitates having individual MRI scans, considering these averages ± 2 SD provides a 95% confidence interval for E-field magnitudes in these TMS and tES protocols. Using these ranges, there were between 7 and 10 individuals falling outside of 2 SD in each stimulation protocol. That the MNI-152 template and Ernie head models produced similar E-field values as the group average values suggests that they are suitable proxy head models for estimating group-average E-fields and that most people (i.e., approximately 95% of people) do not significantly differ on an individual-by-individual basis from the E-fields produced in the MNI-152 brain.
Briefly, it is important to consider the limitations of this study. We used the MNI-152 brain as a commonly utilized template, but there may be closer matching composite MRI scans depending on the population of interest. For instance, if a researcher wanted to investigate the group-level E-fields in an aging population could consider using more specific age-matched (Fillmore et al., 2015) or diagnosis-matched (Dadar et al., 2022) templates for potentially more accurate simulations. While we used bilateral electrode placements (i.e., C3-C4 and F3-F4) instead of other common electrode placements (e.g., C3-SO and F3-SO), prior large-scale findings have shown that there are no significant differences in E-field magnitudes between C3-C4 and C3-SO (Caulfield and George, 2022). This prior results leads us to believe that the MNI template and Ernie scan would be similarly suitable to accurately estimate E-field magnitudes at other similar electrode placements. In addition, we only utilized a T1w MRI scan for E-field modeling in our naturalistic sample, based on the MRI scans acquired across the parent studies. However, prior reports have described how the inclusion of both T1w and T2w MRI scans improves segmentation accuracy at the skull-CSF border (Nielsen et al., 2018; Van Hoornweder et al., 2022b) and how this can affect E-field modeling values in a regionally-specific fashion (Van Hoornweder et al., 2022). Furthermore, we chose a spherical ROI as our outcome measure, but this may not have encapsulated the peak E-fields induced from tES. Prior results have reported that the maximal E-field is not always located underneath the center of tES electrodes (Caulfield and George, 2022) in the conventional bilateral electrode placement. Forthcoming research has also highlighted the importance of considering the focality of stimulation and recommended reporting both ROI and percentile-based outcome measures (Van Hoornweder et al., 2023), which we did not do here. Thus, extending these data to report percentile-based E-fields could more broadly inform future studies and grant applications utilizing the template scan approach. With larger sample sizes, future analyses could extend the point of stability analyses to specific diagnoses (e.g., healthy controls or participants with anxiety). This method could help to inform the needed number of participants to achieve stable E-field values in these diagnoses as opposed to the transdiagnostic approach that we took here. Finally, we focused on superficial brain targets in this study due to these regions being the primary targets in TMS and tES. In addition, it is more difficult to standardize the tissue compositions between participants at deeper targets due to varying levels of gray vs. white matter. Future research could consider examining deeper targets in more depth, but this was beyond the scope of the current study.
Utilizing the MNI-152 template scan and Ernie brain produce similar group-level estimations of TMS and tES-induced E-field magnitudes over the motor and prefrontal cortices. Using the MNI-152 brain to approximate group-level E-field effects can provide valuable insight into the amount of stimulation reaching different cortical regions and neural circuits in lieu of individual MRI scans. While preliminary, TMS-induced E-field magnitudes, but not tES-induced E-field magnitudes differed in some diagnoses, including higher motor and prefrontal E-fields in participants with generalized anxiety than alcohol use disorder, healthy controls, and those with depression. Further research is needed to further elucidate the relationships between different diagnoses and E-fields, and whether these impact response to TMS and tES treatments.
The datasets presented in this article are not readily available because these data are part of ongoing studies but will be made available upon reasonable request. Requests to access the datasets should be directed to KC, Y2F1bGZpZWxAbXVzYy5lZHU=.
The studies involving humans were approved by Medical University of South Carolina IRB. The studies were conducted in accordance with the local legislation and institutional requirements. The participants provided their written informed consent to participate in this study.
All authors significantly contributed to the study conceptualization, data analysis, figures creation, writing the original document, editing the document prior to submission, and approved the submitted version.
This work was supported by an NINDS F31 grant (NIH F31NS126019) to KC, a Research Foundation Flanders grant (G1129923N) to SV, the COBRE for Stroke Recovery (NIH P20GM109040; LM) National Center of Neuromodulation for Rehabilitation (NC NM4R; NIH P2CHD086844; LM), a VA Small Projects in Rehabilitation Research (SPiRE) Pilot grant (LM), and the National Alliance for Research on Schizophrenia and Depression (NARSAD; LM).
The authors declare that the research was conducted in the absence of any commercial or financial relationships that could be construed as a potential conflict of interest.
All claims expressed in this article are solely those of the authors and do not necessarily represent those of their affiliated organizations, or those of the publisher, the editors and the reviewers. Any product that may be evaluated in this article, or claim that may be made by its manufacturer, is not guaranteed or endorsed by the publisher.
Alekseichuk, I., Wischnewski, M., and Opitz, A. (2022). A minimum effective dose for (transcranial) alternating current stimulation. Brain Stimul. 15, 1221–1222.
André, S., Heinrich, S., Kayser, F., Menzler, K., Kesselring, J., Khader, P. H., et al. (2016). At-home tDCS of the left dorsolateral prefrontal cortex improves visual short-term memory in mild vascular dementia. J. Neurol. Sci. 369, 185–190.
Barker, A. T., Jalinous, R., and Freeston, I. L. (1985). Non-invasive magnetic stimulation of human motor cortex. Lancet 325, 1106–1107.
Batsikadze, G., Moliadze, V., Paulus, W., Kuo, M. F., and Nitsche, M. (2013). Partially non-linear stimulation intensity-dependent effects of direct current stimulation on motor cortex excitability in humans. J. Physiol. 591, 1987–2000.
Beam, W., Borckardt, J. J., Reeves, S. T., and George, M. S. (2009). An efficient and accurate new method for locating the F3 position for prefrontal TMS applications. Brain Stimul. 2, 50–54. doi: 10.1016/j.brs.2008.09.006
Brunoni, A. R., and Vanderhasselt, M. A. (2014). Working memory improvement with non-invasive brain stimulation of the dorsolateral prefrontal cortex: A systematic review and meta-analysis. Brain Cogn. 86, 1–9.
Brunoni, A. R., Moffa, A. H., Sampaio-Junior, B., Borrione, L., Moreno, M. L., Fernandes, R. A., et al. (2017). Trial of electrical direct-current therapy versus escitalopram for depression. N. Engl. J. Med. 376, 2523–2533.
Carmi, L., Tendler, A., Bystritsky, A., Hollander, E., Blumberger, D. M., Daskalakis, J., et al. (2019). Efficacy and safety of deep transcranial magnetic stimulation for obsessive-compulsive disorder: A prospective multicenter randomized double-blind placebo-controlled trial. Am. J. Psychiatry 176, 931–938.
Carpenter, L. L., Janicak, P. G., Aaronson, S. T., Boyadjis, T., Brock, D. G., Cook, I. A., et al. (2012). Transcranial magnetic stimulation (TMS) for major depression: A multisite, naturalistic, observational study of acute treatment outcomes in clinical practice. Depress Anxiety. 29, 587–596.
Carpenter, L., Aaronson, S., Hutton, T. M., Mina, M., Pages, K., Verdoliva, S., et al. (2021). Comparison of clinical outcomes with two Transcranial Magnetic Stimulation treatment protocols for major depressive disorder. Brain Stimul. 14, 173–180.
Caulfield, K. A., and George, M. S. (2022). Optimized APPS-tDCS electrode position, size, and distance doubles the on-target stimulation magnitude in 3000 electric field models. Sci. Rep. 12:20116. doi: 10.1038/s41598-022-24618-3
Caulfield, K. A., Badran, B. W., DeVries, W. H., Summers, P. M., Kofmehl, E., Li, X., et al. (2020). Transcranial electrical stimulation motor threshold can estimate individualized tDCS dosage from reverse-calculation electric-field modeling. Brain Stimul. 13, 961–969. doi: 10.1016/j.brs.2020.04.007
Caulfield, K. A., Fleischmann, H. H., Cox, C. E., Wolf, J. P., George, M. S., and McTeague, L. M. (2022a). Neuronavigation maximizes accuracy and precision in TMS positioning: Evidence from 11,230 distance, angle, and electric field modeling measurements. Brain Stimul. 15, 1192–1205. doi: 10.1016/j.brs.2022.08.013
Caulfield, K. A., Indahlastari, A., Nissim, N. R., Lopez, J. W., Fleischmann, H. H., Woods, A. J., et al. (2022b). Electric field strength from prefrontal transcranial direct current stimulation determines degree of working memory response: A potential application of reverse-calculation modeling? Neuromodulation 25, 578–587. doi: 10.1111/ner.13342
Caulfield, K. A., Li, X., and George, M. S. (2021). Four electric field modeling methods of dosing prefrontal Transcranial Magnetic Stimulation (TMS): Introducing APEX MT dosimetry. Brain Stimul. 14, 1032–1034. doi: 10.1016/j.brs.2021.06.012
Chervyakov, A. V., Chernyavsky, A. Y., Sinitsyn, D. O., and Piradov, M. A. (2015). Possible mechanisms underlying the therapeutic effects of transcranial magnetic stimulation. Front. Hum. Neurosci. 9:303. doi: 10.3389/fnhum.2015.00303
Cobb, A. R., O’Connor, P., Zaizar, E., Caulfield, K., Gonzalez-Lima, F., and Telch, M. J. (2021). tDCS-Augmented in vivo exposure therapy for specific fears: A randomized clinical trial. J. Anxiety Disord. 78:102344. doi: 10.1016/j.janxdis.2020.102344
Dadar, M., Camicioli, R., and Duchesne, S. (2022). Multi sequence average templates for aging and neurodegenerative disease populations. Sci. Data 9:238. doi: 10.1038/s41597-022-01341-2
Dannhauer, M., Huang, Z., Beynel, L., Wood, E., Bukhari-Parlakturk, N., and Peterchev, A. V. (2022). TAP: Targeting and analysis pipeline for optimization and verification of coil placement in transcranial magnetic stimulation. J. Neural Eng. 19, 026050. doi: 10.1088/1741-2552/ac63a4
Datta, A., Bansal, V., Diaz, J., Patel, J., Reato, D., and Bikson, M. (2009). Gyri-precise head model of transcranial direct current stimulation: Improved spatial focality using a ring electrode versus conventional rectangular pad. Brain Stim. 2, 201–207.e1. doi: 10.1016/j.brs.2009.03.005
Dayan, E., Censor, N., Buch, E. R., Sandrini, M., and Cohen, L. G. (2013). Noninvasive brain stimulation: From physiology to network dynamics and back. Nat. Neurosci. 16, 838–844.
Deng, Z.-D., Lisanby, S. H., and Peterchev, A. V. (2013). Controlling stimulation strength and focality in electroconvulsive therapy via current amplitude and electrode size and spacing: Comparison with magnetic seizure therapy. J. ECT 29:325. doi: 10.1097/YCT.10.1097/YCT.0b013e3182a4b4a7
Deng, Z.-D., Robins, P. L., Dannhauer, M., Haugen, L. M., Port, J. D., and Croarkin, P. E. (2023). Comparison of coil placement approaches targeting dorsolateral prefrontal cortex in depressed adolescents receiving repetitive transcranial magnetic stimulation: An electric field modeling study. medRxiv [Preprint]. doi: 10.1101/2023.02.06.23285526
Fillmore, P. T., Phillips-Meek, M. C., and Richards, J. E. (2015). Age-specific MRI brain and head templates for healthy adults from 20 through 89 years of age. Front. Aging Neurosci. 7:44. doi: 10.3389/fnagi.2015.00044
Fonov, V., Evans, A. C., Botteron, K., Almli, C. R., McKinstry, R. C., and Collins, D. L. (2011). Unbiased average age-appropriate atlases for pediatric studies. Neuroimage 54, 313–327. doi: 10.1016/j.neuroimage.2010.07.033
George, M. S., Lisanby, S. H., Avery, D., McDonald, W. M., Durkalski, V., Pavlicova, M., et al. (2010). Daily left prefrontal transcranial magnetic stimulation therapy for major depressive disorder: A sham-controlled randomized trial. Arch. Gen. Psychiatry 67, 507–516.
Gomez, L. J., Dannhauer, M., and Peterchev, A. V. (2021). Fast computational optimization of TMS coil placement for individualized electric field targeting. Neuroimage 228:117696. doi: 10.1016/j.neuroimage.2020.117696
Grover, S., Wen, W., Viswanathan, V., Gill, C. T., and Reinhart, R. M. G. (2022). Long-lasting, dissociable improvements in working memory and long-term memory in older adults with repetitive neuromodulation. Nat. Neurosci. 25, 1237–1246. doi: 10.1038/s41593-022-01132-3
Hobot, J., Klincewicz, M., Sandberg, K., and Wierzchoń, M. (2021). Causal inferences in repetitive transcranial magnetic stimulation research: Challenges and perspectives. Front. Hum. Neurosci. 14:586448. doi: 10.3389/fnhum.2020.586448
Horvath, J. C., Forte, J. D., and Carter, O. (2015). Evidence that transcranial direct current stimulation (tDCS) generates little-to-no reliable neurophysiologic effect beyond MEP amplitude modulation in healthy human subjects: A systematic review. Neuropsychologia 66, 213–236.
Huang, Y., Liu, A. A., Lafon, B., Friedman, D., Dayan, M., Wang, X., et al. (2017). Measurements and models of electric fields in the in vivo human brain during transcranial electric stimulation. eLife 6:e18834.
Jurcak, V., Tsuzuki, D., and Dan, I. (2007). 10/20, 10/10, and 10/5 systems revisited: Their validity as relative head-surface-based positioning systems. Neuroimage 34, 1600–1611. doi: 10.1016/j.neuroimage.2006.09.024
Kalloch, B., Bazin, P.-L., Villringer, A., Sehm, B., and Hlawitschka, M. (2020). A flexible workflow for simulating transcranial electric stimulation in healthy and lesioned brains. PLoS One 15:e0228119. doi: 10.1371/journal.pone.0228119
Konakanchi, D., de Jongh Curry, A. L., Waters, R. S., and Narayana, S. (2020). Focality of the induced E-field is a contributing factor in the choice of TMS parameters: Evidence from a 3D computational model of the human brain. Brain Sci. 10:1010. doi: 10.3390/brainsci10121010
Kozel, F., Nahas, Z., DeBrux, C., Molloy, M., Lorberbaum, J., Bohning, D., et al. (2000). How the distance from coil to cortex relates to age, motor threshold and possibly the antidepressant response to repetitive transcranial magnetic stimulation. J. Neuropsychiatry Clin. Neurosci. 12, 376–384. doi: 10.1176/jnp.12.3.376
Kronberg, G., Bridi, M., Abel, T., Bikson, M., and Parra, L. C. (2017). Direct current stimulation modulates LTP and LTD: Activity dependence and dendritic effects. Brain Stimul. 10, 51–58. doi: 10.1016/j.brs.2016.10.001
Laakso, I., Tanaka, S., Mikkonen, M., Koyama, S., Sadato, N., and Hirata, A. (2016). Electric fields of motor and frontal tDCS in a standard brain space: A computer simulation study. Neuroimage 137, 140–151. doi: 10.1016/j.neuroimage.2016.05.032
Loo, C. K., Husain, M. M., McDonald, W. M., Aaronson, S., O’Reardon, J. P., Alonzo, A., et al. (2018). International randomized-controlled trial of transcranial direct current stimulation in depression. Brain Stimul. 11, 125–133.
Mantell, K. E., Sutter, E. N., Shirinpour, S., Nemanich, S. T., Lench, D. H., Gillick, B. T., et al. (2021). Evaluating transcranial magnetic stimulation (TMS) induced electric fields in pediatric stroke. Neuroimage Clin. 29:102563. doi: 10.1016/j.nicl.2021.102563
Minjoli, S., Saturnino, G. B., Blicher, J. U., Stagg, C. J., Siebner, H. R., Antunes, A., et al. (2017). The impact of large structural brain changes in chronic stroke patients on the electric field caused by transcranial brain stimulation. Neuroimage Clin. 15, 106–117. doi: 10.1016/j.nicl.2017.04.014
Moliadze, V., Atalay, D., Antal, A., and Paulus, W. (2012). Close to threshold transcranial electrical stimulation preferentially activates inhibitory networks before switching to excitation with higher intensities. Brain Stim. 5, 505–511. doi: 10.1016/j.brs.2011.11.004
Nahas, Z., Li, X., Kozel, F. A., Mirzki, D., Memon, M., Miller, K., et al. (2004). Safety and benefits of distance-adjusted prefrontal transcranial magnetic stimulation in depressed patients 55-75 years of age: A pilot study. Depress Anxiety. 19, 249–256. doi: 10.1002/da.20015
Nielsen, J. D., Madsen, K. H., Puonti, O., Siebner, H. R., Bauer, C., Madsen, C. G., et al. (2018). Automatic skull segmentation from MR images for realistic volume conductor models of the head: Assessment of the state-of-the-art. Neuroimage 174, 587–598. doi: 10.1016/j.neuroimage.2018.03.001
Nitsche, M. A., and Paulus, W. (2000). Excitability changes induced in the human motor cortex by weak transcranial direct current stimulation. J. Physiol. 527, 633–639.
O’Reardon, J. P., Solvason, H. B., Janicak, P. G., Sampson, S., Isenberg, K. E., Nahas, Z., et al. (2007). Efficacy and safety of transcranial magnetic stimulation in the acute treatment of major depression: A multisite randomized controlled trial. Biol. Psychiatry 62, 1208–1216.
Okamoto, M., and Dan, I. (2005). Automated cortical projection of head-surface locations for transcranial functional brain mapping. Neuroimage 26, 18–28. doi: 10.1016/j.neuroimage.2005.01.018
Okamoto, M., Dan, H., Sakamoto, K., Takeo, K., Shimizu, K., Kohno, S., et al. (2004). Three-dimensional probabilistic anatomical cranio-cerebral correlation via the international 10–20 system oriented for transcranial functional brain mapping. Neuroimage 21, 99–111. doi: 10.1016/j.neuroimage.2003.08.026
Opitz, A., Paulus, W., Will, S., Antunes, A., and Thielscher, A. (2015). Determinants of the electric field during transcranial direct current stimulation. Neuroimage 109, 140–150.
Papazova, I., Strube, W., Becker, B., Henning, B., Schwippel, T., Fallgatter, A. J., et al. (2018). Improving working memory in schizophrenia: Effects of 1mA and 2mA transcranial direct current stimulation to the left DLPFC. Schizophrenia Res. 202, 203–209. doi: 10.1016/j.schres.2018.06.032
Pilloni, G., Vogel-Eyny, A., Lustberg, M., Best, P., Malik, M., Walton-Masters, L., et al. (2022). Tolerability and feasibility of at-home remotely supervised transcranial direct current stimulation (RS-tDCS): Single-center evidence from 6,779 sessions. Brain Stim. 15, 707–716. doi: 10.1016/j.brs.2022.04.014
Puonti, O., Van Leemput, K., Saturnino, G. B., Siebner, H. R., Madsen, K. H., and Thielscher, A. (2020). Accurate and robust whole-head segmentation from magnetic resonance images for individualized head modeling. Neuroimage 219:117044.
Riggs, A., Patel, V., Paneri, B., Portenoy, R. K., Bikson, M., and Knotkova, H. (2018). At-home Transcranial Direct Current Stimulation (tDCS) With telehealth support for symptom control in chronically-Ill patients with multiple symptoms. Front. Behav. Neurosci. 12:93. doi: 10.3389/fnbeh.2018.00093
Sack, A. T. (2006). Transcranial magnetic stimulation, causal structure–function mapping and networks of functional relevance. Curr. Opin. Neurobiol. 16, 593–599. doi: 10.1016/j.conb.2006.06.016
Saturnino, G. B., Antunes, A., and Thielscher, A. (2015). On the importance of electrode parameters for shaping electric field patterns generated by tDCS. Neuroimage 120, 25–35. doi: 10.1016/j.neuroimage.2015.06.067
Saturnino, G. B., Madsen, K. H., and Thielscher, A. (2021). Optimizing the electric field strength in multiple targets for multichannel transcranial electric stimulation. J. Neural Eng. 18:014001. doi: 10.1088/1741-2552/abca15
Saturnino, G. B., Puonti, O., Nielsen, J. D., Antonenko, D., Madsen, K. H., and Thielscher, A. (2019). “SimNIBS 2.1: A comprehensive pipeline for individualized electric field modelling for transcranial brain stimulation,” in Brain and hum bod model 2018, eds S. Makarov, M. Horner, and G. Noetscher (Cham: Springer), 3–25. doi: 10.1007/978-3-030-21293-3_1
Suen, P. J. C., Doll, S., Batistuzzo, M. C., Busatto, G., Razza, L. B., Padberg, F., et al. (2020). Association between tDCS computational modeling and clinical outcomes in depression: Data from the ELECT-TDCS trial. Eur. Arch. Psychiatry Clin. Neurosci. 271, 101–110. doi: 10.1007/s00406-020-01127-w
Turi, Z., Normann, C., Domschke, K., and Vlachos, A. (2021). Transcranial magnetic stimulation in psychiatry: Is there a need for electric field standardization? Front. Hum. Neurosci. 15:639640. doi: 10.3389/fnhum.2021.639640
Tzirini, M., Chatzikyriakou, E., Kouskouras, K., Foroglou, N., Samaras, T., and Kimiskidis, V. K. (2022). Electric Field distribution induced by TMS: Differences due to anatomical variation. Appl. Sci. 12:4509.
Van Hoornweder, S., Caulfield, K. A., Nitsche, M., Thielscher, A., and L J Meesen, R. (2022a). Addressing transcranial electrical stimulation variability through prospective individualized dosing of electric field strength in 300 participants across two samples: The 2-SPED approach. J. Neural Eng. 19:056045. doi: 10.1088/1741-2552/ac9a78
Van Hoornweder, S., Meesen, R. L. J., and Caulfield, K. A. (2022). Accurate tissue segmentation from including both T1-weighted and T2-weighted MRI scans significantly affect electric field simulations of prefrontal but not motor TMS. Brain Stim. 15, 942–945. doi: 10.1016/j.brs.2022.06.008
Van Hoornweder, S., Meesen, R., and Caulfield, K. A. (2022b). On the importance of using both T1-weighted and T2-weighted structural magnetic resonance imaging scans to model electric fields induced by non-invasive brain stimulation in SimNIBS. Brain Stimul. 15, 641–644. doi: 10.1016/j.brs.2022.04.010
Van Hoornweder, S., Nuyts, M., Frieske, J., Verstraelen, S., Meesen, R. L. J., and Caulfield, K. A. (2023). A systematic review and large-scale tES and TMS electric field modeling study reveals how outcome measure selection alters results in a person- and montage-specific manner. bioRxiv [Preprint]. doi: 10.1101/2023.02.22.529540
Wagner, T. A., Zahn, M., Grodzinsky, A. J., and Pascual-Leone, A. (2004). Three-dimensional head model simulation of transcranial magnetic stimulation. IEEE Trans. Biomed. Eng. 51, 1586–1598.
Westwood, S. J., and Romani, C. (2018). Null effects on working memory and verbal fluency tasks when applying anodal tDCS to the inferior frontal gyrus of healthy participants. Front. Neurosci. 12:166. doi: 10.3389/fnins.2018.00166
Wischnewski, M., Mantell, K. E., and Opitz, A. (2021). Identifying regions in prefrontal cortex related to working memory improvement: A novel meta-analytic method using electric field modeling. Neurosci. Biobehav. Rev. 130, 147–161. doi: 10.1016/j.neubiorev.2021.08.017
Zangen, A., Moshe, H., Martinez, D., Barnea-Ygael, N., Vapnik, T., Bystritsky, A., et al. (2021). Repetitive transcranial magnetic stimulation for smoking cessation: A pivotal multicenter double-blind randomized controlled trial. World Psychiatry 20, 397–404. doi: 10.1002/wps.20905
Zhang, B. B. B., Stöhrmann, P., Godbersen, G. M., Unterholzner, J., Kasper, S., Kranz, G. S., et al. (2022). Normal component of TMS-induced electric field is correlated with depressive symptom relief in treatment-resistant depression. Brain Stim. 15, 1318–1320. doi: 10.1016/j.brs.2022.09.006
Keywords: TMS, tES, tDCS, non-invasive brain stimulation, electric field (E-field) modeling, finite element method (FEM), MNI-152, template MRI scan
Citation: Cho JY, Van Hoornweder S, Sege CT, Antonucci MU, McTeague LM and Caulfield KA (2023) Template MRI scans reliably approximate individual and group-level tES and TMS electric fields induced in motor and prefrontal circuits. Front. Neural Circuits 17:1214959. doi: 10.3389/fncir.2023.1214959
Received: 30 April 2023; Accepted: 09 August 2023;
Published: 06 September 2023.
Edited by:
Rachel M. Sherrard, Sorbonne-Université, FranceReviewed by:
Jennifer Rodger, University of Western Australia, AustraliaCopyright © 2023 Cho, Van Hoornweder, Sege, Antonucci, McTeague and Caulfield. This is an open-access article distributed under the terms of the Creative Commons Attribution License (CC BY). The use, distribution or reproduction in other forums is permitted, provided the original author(s) and the copyright owner(s) are credited and that the original publication in this journal is cited, in accordance with accepted academic practice. No use, distribution or reproduction is permitted which does not comply with these terms.
*Correspondence: Kevin A. Caulfield, Y2F1bGZpZWxAbXVzYy5lZHU=
Disclaimer: All claims expressed in this article are solely those of the authors and do not necessarily represent those of their affiliated organizations, or those of the publisher, the editors and the reviewers. Any product that may be evaluated in this article or claim that may be made by its manufacturer is not guaranteed or endorsed by the publisher.
Research integrity at Frontiers
Learn more about the work of our research integrity team to safeguard the quality of each article we publish.