 Andrew Jo
 Jian Xu
 Sercan Deniz
 Suraj Cherian
 Steven H. DeVries
 Yongling Zhu
94% of researchers rate our articles as excellent or good
Learn more about the work of our research integrity team to safeguard the quality of each article we publish.
Find out more
ORIGINAL RESEARCH article
Front. Neural Circuits , 22 August 2018
Volume 12 - 2018 | https://doi.org/10.3389/fncir.2018.00066
The mammalian retina harbors over 100 different cell types. To understand how retinal circuits work, it is essential to systematically access each type. A widely used approach for achieving targeted transgene expression exploits promoter-driven Cre lines. However, Cre expression in a given transgenic line in the retina and elsewhere in the brain is rarely confined to a single cell type, contributing ambiguity to the interpretation of results from broadly applied manipulations. To obtain unambiguous information about retinal processing, it is desirable to have strategies for further restricting transgene expression to a few or even to a single cell type. We employed an intersectional strategy based on a Cre/Flp double recombinase system to target amacrine and ganglion cell types in the inner retina. We analyzed expression patterns in seven Flp drivers and then created combinational mouse lines by selective cross breeding with Cre drivers. Breeding with Flp drivers can routinely remove labeling from more than 90% of the cells in Cre drivers, leading to only a handful cell types, typically 2–3, remaining in the intersection. Cre/Flp combinatorial mouse lines enabled us to identify and anatomically characterize retinal cell types with greater ease and demonstrated the feasibility of intersectional strategies in retinal research. In addition to the retina, we examined Flp expression in the lateral geniculate nucleus and superior colliculus. Our results establish a foundation for future application of intersectional strategies in the retina and retino-recipient regions.
The retina is an experimentally tractable preparation for understanding how nervous systems abstract complex information from the environment, including information about object motion, orientation, and permanence under different light conditions (Wassle, 2004; Masland, 2012; Demb and Singer, 2015). Retinal neurons comprise three major classes: the primary sensory cells which include rods and cones; interneurons which include horizontal, bipolar and amacrine cells (ACs); and, the output neurons, retinal ganglion cells (RGCs), that project to retino-recipient areas in the brain.
A diversity of cell types in the retina provides the infrastructure necessary for visual signal processing. There are at least 40 types of RGCs, 50 types of ACs, 14 types of bipolar cells, 2 types of horizontal cells, and 3 types of glial cells (Masland, 2012; Demb and Singer, 2015). Each of the RGC types is tuned to respond best to different and sometimes complex features in a visual scene (Masland, 2012; Sanes and Masland, 2015; Baden et al., 2016). The unique response properties of each RGC type originates from the interplay between excitation and inhibition centered around the RGC dendrites. An RGC type receives excitatory inputs from a subset of the cone bipolar cell types and inhibitory inputs from a subset of AC types (Masland, 2012; Demb and Singer, 2015). Due to the large number of cell types involved and their extensive process ramifications in the innerplexiform layer (IPL), a connectivity diagram containing both functional and anatomical information for the bipolar and AC circuits that feed into each ganglion cell type is unresolved.
Physiological, molecular, and genetic approaches have been used to gain access to specific amacrine and ganglion cell types in order to systematically study their organization and function. One of the most prominent approaches involves the use of genetically modified mouse lines that heritably express transgenes such as GFP or Cre under gene specific promoters (Haverkamp et al., 2009; Siegert et al., 2009; Ivanova et al., 2010). Recently, we analyzed more than 20 Cre drivers that allowed us to distinguish and access more than half of the cell types in the retina (Zhu et al., 2014). While “one-component” transgenic lines (Allen and Luo, 2015) have greatly facilitated the study of retinal function, a persistent problem is that nearly every Cre driver or GFP line targets multiple cell types (Zhu et al., 2014; Martersteck et al., 2017). This multiplicity makes functional studies more difficult by degrading the specificity of broadly applied optogenetic and chemogenetic manipulations. There is a pressing need to further restrict retinal transgene expression to a few or even one neuron type in order to obtain unambiguous information about processing.
We employed an intersectional strategy in which transgene expression is defined by the combination of two recombinases each driven by a distinct gene promoter (Dymecki et al., 2010; Madisen et al., 2015; He et al., 2016). To date, the most commonly used intersectional combination is the Cre and Flp dual-recombinase system that simultaneously uses both Cre/loxP and Flp/FRT combination to remove a STOP cassette or to reverse a double-floxed inverse open reading frame (DIO/FLEX) (Atasoy et al., 2008; Sohal et al., 2009). Either editing event can lead to the activation of a reporter/effector solely in cells expressing both Cre and Flp recombinases (Figure 1A). A prerequisite for the efficient application of an intersectional strategy is to identify the candidate Cre and Flp drivers for crossing. The preferred pair of Cre and Flp drivers should be controlled by different promoters that have overlapping expression patterns in the cells of interest. To facilitate this approach, we have characterized the retinal expression patterns in available Cre and Flp drivers. Based on the individual expression patterns, we crossed lines to produce restricted intersectional expression (Figure 1B). A rational extension of this approach can make use of retinal transcriptomic information to design additional Cre and Flp drivers.
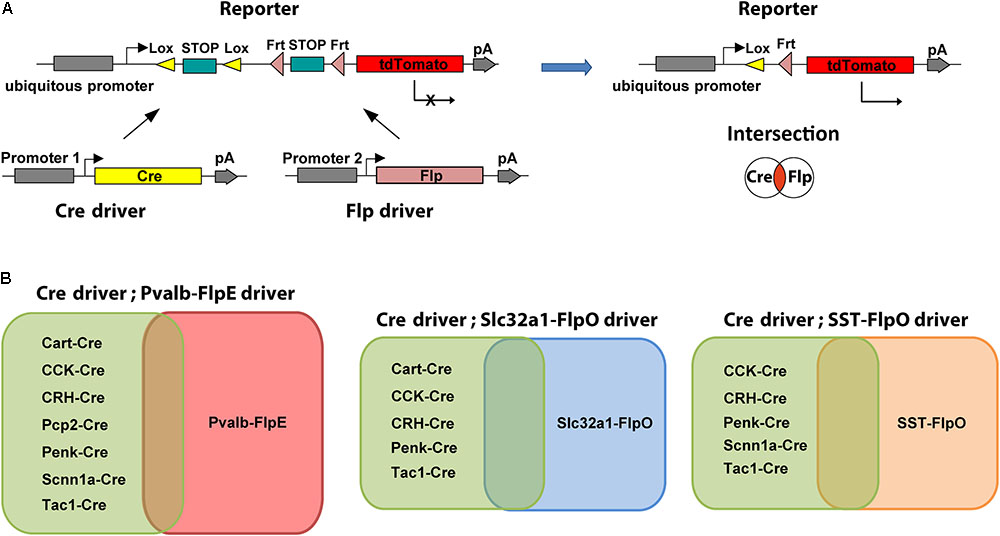
FIGURE 1. Intersectional strategy with Cre/Flp dual recombinase. (A) Schematic diagram of the intersectional strategy with Cre/Flp dual recombinase. The Cre driver line uses gene specific promoter 1, the Flp driver line uses gene specific promoter 2, and the double reporter uses a ubiquitous promoter (left). Expression of tdTomato in the reporter line (Ai65) is prevented by lox- and frt-flanked STOP cassettes. Following removal of both STOP cassettes, tdTomato is expressed in the cells that are in the overlap or “intersection” of the two populations of neurons targeted by either the Cre driver or the Flp driver (right). (B) Intersectional strategies provide flexibility for targeting specific cell types. Each Flp line can be crossed with many Cre lines to create multiple intersections.
The intersectional approach has been recently used in the nervous system to anatomically map and functionally study genetically-defined subpopulations of neurons (Madisen et al., 2015; He et al., 2016), but its effectiveness in retina has not been demonstrated. Here, we screened and analyzed seven new Flp drivers for expression patterns in the retina, lateral geniculate nucleus (LGN), and superior colliculus (SC). We then created and characterized multiple combinational mouse lines by selective cross breeding of Flp and Cre drivers. Our results demonstrate that an intersectional recombination-based system is a powerful tool for increasing the specificity of cell-type targeting in the retina.
All the Flp drivers, Cre drivers and reporters were obtained directly from Jackson Laboratory or individual investigators (Table 1). Adult mice (5–6 weeks old) of either sex were used for experiments. All animal procedures were performed in accordance with the Guide for the Care and Use of Laboratory Animals as adopted and promulgated by the US National Institutes of Health. All procedures for testing and handling were approved by the Institutional Animal Care and Use Committee of Northwestern University. Cre expression in the CAGGCreER/Pvalb-FlpE and UBC-CreER2/Sst-FlpO mice relied on “leakiness” without tamoxifen induction. To enhance Cre expression in the UBC-CreER2/Vip-FlpO mice, single injection of tamoxifen (20 μg, Sigma) was applied intraperitoneally, and retinas were collected after 2–3 days.
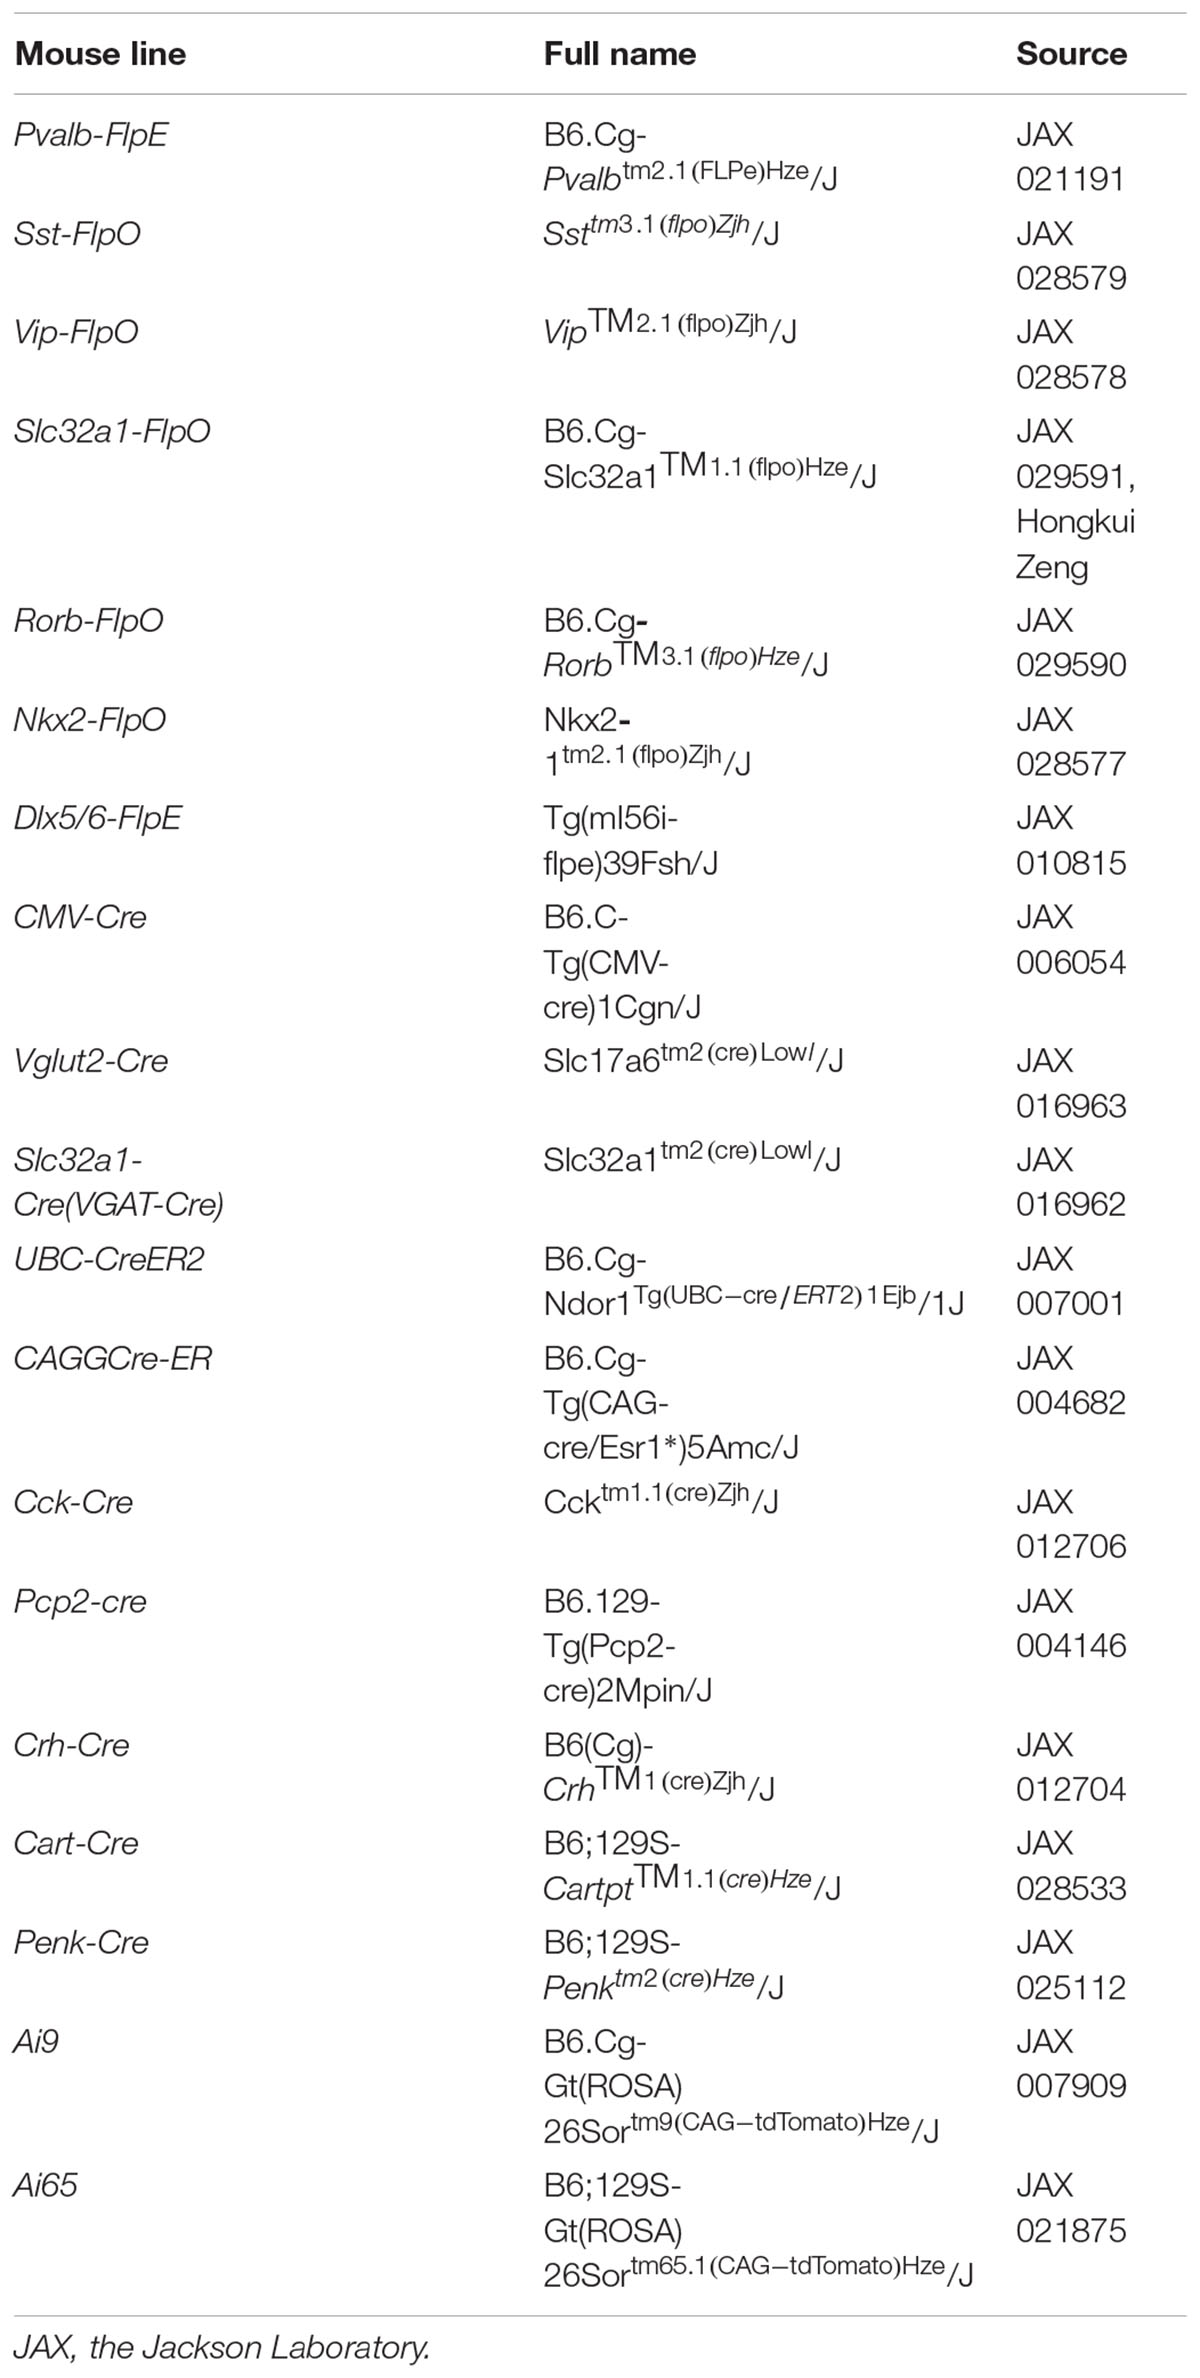
TABLE 1. Mouse lines used in this study.
For immunohistochemistry in the retina, mice were euthanized, and eyes were fixed with 4% paraformaldehyde for 1h and then retinas were dissected. Retinas were washed with a modified phosphate buffer (PB) containing 0.5% Triton X-100 and 0.1% NaN3, pH 7.4, and then blocked for 2 days in modified PB containing 3% donkey serum. After that, retinas were incubated with primary antibody for 5 days and secondary antibody for 2 days at 4°C.
To label retinorecipient regions, 2 μl of cholera toxin B conjugated to Alexa Fluor 488 (CTb-488: 1% in saline; Thermo Fisher Scientific) was injected into each eye. After 24 h, the animal was perfused transcardially with 4% paraformaldehyde, and the brain was removed for post-fixed for 3–5 d at 4°C. After washing with phosphate buffered saline, the brains were sectioned at 80 μm in a cryostat. Immunohistochemistry proceeded as for the retina, except that incubation times with primary and secondary antibody were reduced to 2 and 1 day respectively.
The primary antibodies used were as follows: rabbit anti-RFP (1:1000, Rockland 600-401-379), chicken anti-RFP Biotin conjugated (1:200, Rockland 600-906-379), guinea pig anti-RBPMS (1:500, PhosphoSolutions 1832-RBPMS), mouse anti-AP2 (3 μg/ml, DSHB 3B5), goat anti-Osteopontin (1:500, R&D 441-OP-050), rabbit anti-CART (1:1000, Phoenix pharmaceuticals H-003-62), goat anti-FOXP2 (1:500, Abcam ab1307), rabbit anti-melanopsin (1:1000, Advanced Targeting Systems AB N38), goat anti-choline acetyltransferase (1:500, Millipore AB144P), rabbit anti-GABA (1:2000, Sigma-Aldrich A2052), goat anti- GLYT1 (1:25, Santa Cruz Biotechnology sc-16703), rabbit anti-VIP (1:1000, ImmunoStar 20077), rat anti-SST (1:10, Millipore MAB354). Secondary antibodies were conjugated to Alexa Fluor 488 (Invitrogen), Cy3 (Jackson ImmunoResearch), or Cy5 (Jackson ImmunoResearch). All secondary antibodies were used at a dilution of 1:200.
Images were captured with a Zeiss LSM-510 Meta confocal microscope and processed with LSM Image software, Image J and Photoshop. Flat-mount images of retinas were acquired with either a Plan-Neofluar 25x/0.8 Imm Corr objective or a Plan-Apochromat, 63×/1.4 oil objective. Z-stack images of tdTomato-labeled cells and ChAT antibody-labeled ChAT bands were obtained with a Plan-Apochromat, 63×/1.4 oil objective at 0.25 μm intervals. Brain sections were imaged with a Plan-Neofluar 10x/0.3 air objective, with enlarged views imaged with a Plan-Neofluar 25x/0.8 Imm Corr objective.
To measure the size of the dendritic field, a convex polygon was drawn connecting the outermost tips of the dendrites, and the area within this contour was measured. The diameter of the dendritic field was calculated from the measured area by assuming the dendritic field is circular. Soma diameter was calculated in the same way. To measure the level of stratification of ACs and RGCs, a rectangle representing the region of interest (∼200 μm × 70 μm) was placed near the center of a dendritic field. The image data within the ROI at each level of the z-stack was projected onto the x-axis. The stratification levels were determined from the upper and lower boundaries of tdTomato-labeled arbors relative to the choline acetyltransferase (ChAT)-positive bands (60 and 27% of the IPL) in XZ plane. For wide-field ACs, the same procedure was repeated on the middle and distal parts of the dendritic field or “axon-like” arbors to verify the consistency of stratification in different parts of the cell. Data are presented as mean ± SD.
While Cre drivers have been screened for their expression patterns in the retina (Ivanova et al., 2010; Lu et al., 2013; Zhu et al., 2014; Martersteck et al., 2017), no Flp drivers have been screened. We recently acquired seven Flp drivers: Pvalb-FlpE, Slc32a1-FlpO, Sst-FlpO, Vip-FlpO, Nkx2-FlpO, Dlx5/6-FlpE and Rorb-FlpO. Our goals in this study were three-fold: first, to characterize the amacrine and RGC expression patterns in these Flp drivers; second, to validate intersectional strategies in the retina; and third, to establish Cre/Flp combination lines that achieve increased specificity for subsequent anatomical and functional studies.
Our screening proceeded in three steps. The first step was to obtain the expression patterns of FLP in the retina, achieved by crossing Flp drivers with a Cre/Flp double-dependent Ai65 reporter and a ubiquitous Cre driver (CMV-Cre). In the second step, FLP expression in RGCs or ACs was separated based on the differential presence/absence of characteristic vesicular neurotransmitter transporters. Specifically, we took advantage of the fact that glutamate transporter 2 (VGLUT2) is expressed in RGCs but not in ACs (Johnson et al., 2003; Land et al., 2004), whereas the vesicular inhibitory amino acid transporter (VIAAT) is expressed in ACs but not RGCs. Thereby, we isolated RGCs and ACs by crossing the Flp drivers with a Vglut2-Cre and Slc32a1-Cre drivers respectively. Finally, in the third step, single cell morphologies were analyzed in the RGC group and the AC group, and the cell types were assigned based on published work. If the labeling was too dense to resolve single cell structure, we further crossed Flp drivers with ubiquitous inducible Cre drivers such as UBC-CreERT2 and CAGGCre-ER, and achieved sparse labeling by adjusting the dose of tamoxifen.
The results from seven Flp drivers are summarized in Figure 2. Among the seven Flp drivers, the Pvalb-FlpE drove FLPe expression mainly in the GCL, with only a few cells in the INL (Figure 2Ai). These FLPe-expressing cells were exclusively RGCs, as confirmed by RBPMS immunoreactivity, a marker for RGCs (Rodriguez et al., 2014) (Figure 2Aii). The Sst-FlpO driver targeted both RGCs and ACs (Figure 2Bi). In the GCL, there were both RGCs, confirmed with the RBPMS antibody (Figure 2Bii, Top) and GABAergic ACs confirmed with AP2 (Activating protein 2) and GABA antibodies (Figures 2Biii,iv, top). AP2 is a family of transcription factors that have been shown to play essential roles in development (Hilger-Eversheim et al., 2000; Eckert et al., 2005). In both mammalian and avian retinas, AP2 is exclusively expressed in postmitotic ACs, but not in other cell types (Bisgrove and Godbout, 1999; Bassett et al., 2007). SST+ cells in the INL belonged to GABAergic ACs based on AP2 and GABA staining (Figures 2Biii,iv, bottom). Since, both RGCs and ACs were targeted in the Sst-FlpO driver, it a good preparation in which to test for the feasibility of RGCs/ACs segregation using the Vglut2-Cre or the Slc32a1-Cre in intersection (described later). The Vip-FlpO driver exclusively targeted ACs (Figure 2C). Consistent with the expression pattern of a Vip-Cre line (Zhu et al., 2014), the majority of the targeted cells in the Vip-FlpO driver were located in the INL (Figure 2Ci, bottom). These cells were positive for both AP2 and GABA labeling (Figures 2Cii,iii), indicating that they were all GABAergic ACs. The Slc32a1-FlpO drove FLPo expression in almost all ACs, hence labeling density was high and widespread (Figure 2Di). Slc32a+ cells included both the GABAergic and non-GABAergic cells (Figure 2Dii). The non-GABAergic cells were glycinergic ACs positively stained with a GLYT1 antibody (Figure 2Diii). Nkx2-FlpO and the Dlx5/6-FlpE had very low expression in retinal cells (Figures 2E,F). Finally, Rorb-FlpO consistently targeted many types of bipolar cells, ACs, and RGCs, but expression levels were strongest in Müller cells (Figure 2G). Based on these results, the Nkx2-FlpO, Dlx5/6-FlpE and Rorb-FlpO drivers were excluded from further analysis.
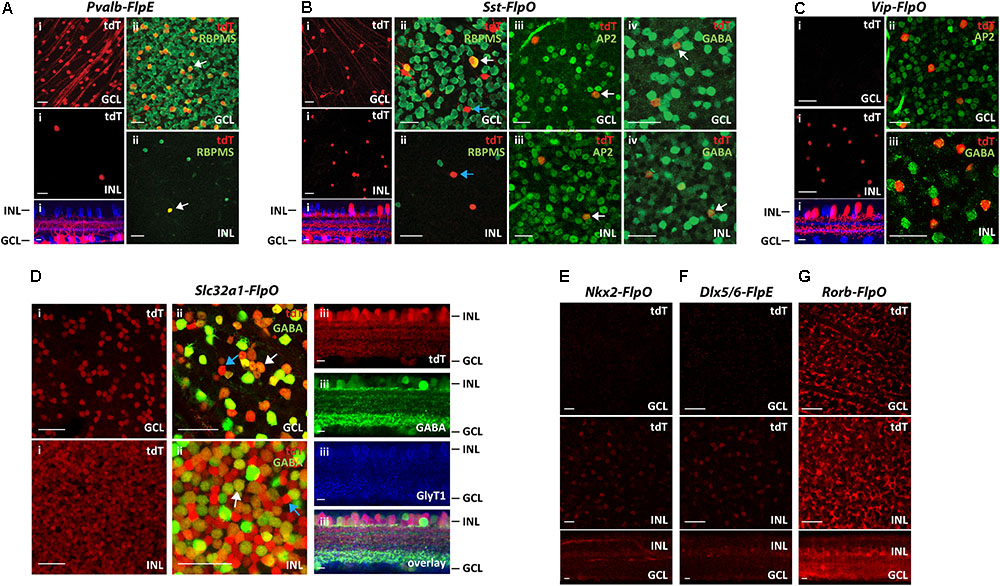
FIGURE 2. Distribution of FLP-expressing cells in 7 Flp drivers. Each Flp driver was crossed with CMV-Cre and Ai65 mice. (A) Pvalb-FlpE driver. (i) FLPe expressing cells labeled with tdTomato (tdT, red) were observed in the GCL (top) with only a few cells in the INL (middle). Bottom: side view with ChAT (blue). (ii) Staining for the RGC marker RBPMS (green) confirmed that all of the tdTomato-labeled cells (tdT, red) in the GCL and the INL were RGCs. White arrows point to example cells that express RBPMS. (B) Sst-FlpO driver. (i) tdTomato-labeled cells were distributed in both the GCL (top) and the INL (middle). Bottom: side view with ChAT (blue).(ii) RBPMS staining (green). SST+ RGCs were found in the GCL, but not in the INL. White arrow indicates a RBPMS+ cell (RGC), blue arrow indicates a RBPMS- cell (presumably an amacrine cell). (iii) An amacrine cell marker, AP-2 (green) overlaps with SST+ amacrine cells in both the GCL and the INL. White arrows indicate example cells that express AP2. (iv) GABA staining (green). White arrows indicate example cells expressing GABA. SST+ amacrine cells in both GCL and INL were GABAergic. (C) Vip-FlpO driver. (i) A majority of the targeted cells (red) in the Vip-FlpO driver were located in the INL (middle). Bottom: side view with ChAT (blue). These presumptive GABAergic amacrine cells were positive for both AP2 (ii) and GABA staining (iii). (D) Slc32a1-FlpO driver. (i) Labeling density was high in both the GCL and INL. (ii) Double labeling for tdTomato (red) and GABA (green). In the GCL, ∼80% of cells were GABAergic, whereas in the INL, ∼50% of tdT cells were GABAergic. Examples of GABAergic and non-GABAergic cells (presumably glycinergic amacrine cells) are indicated by white and blue arrows, respectively.(iii) Vertical sections showed that tdTomato-labeled cells were either GABAergic (green, GABA staining) or glycinergic (blue, GlyT1 staining). (E,F) Nkx2-FlpO driver(E) and Dlx5/6-FlpE driver (F) showed very little labeling in both the GCL and the INL. (G) Rorb-FlpO driver showed broad labeling in the GCL and INL, with the strongest labeling in Müller cells. Scale bar, 40 μm for flat-mount view, 10 μm for side view.
To provide a benchmark for judging the efficacy of the intersectional approach, we next characterized the cell types labeled in the parent Flp driver lines (Table 2) with a focus on Pvalb-FlpE, Sst-FlpO, and Vip-FlpO.
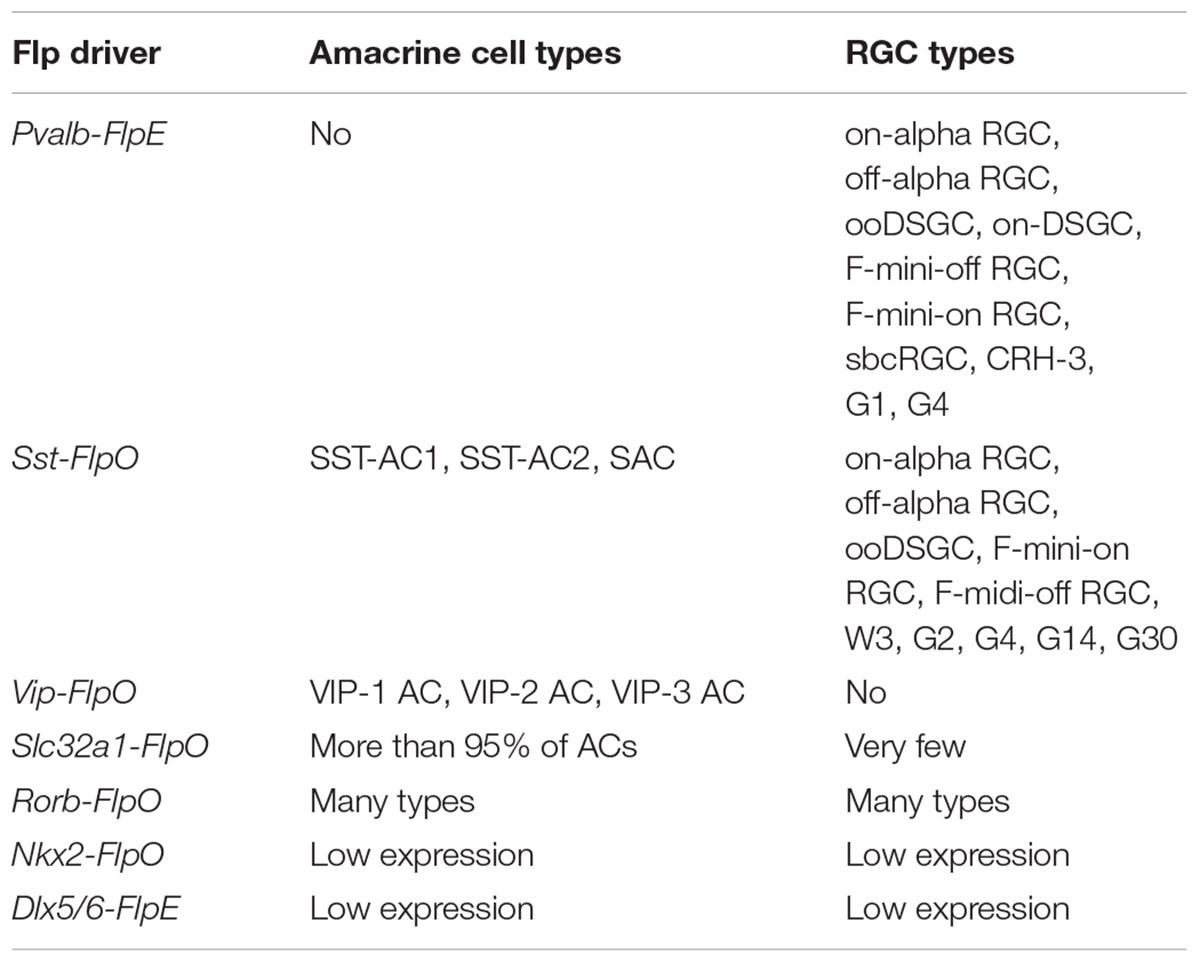
TABLE 2. Summary of AC and RGC types in Flp drivers.
The most efficient way to survey cell types is to use type-specific molecular markers. We labeled PVALB+ RGCs with molecular markers for the following RGCs (Rousso et al., 2016): Osteopontin for alpha RGCs, CART for ooDSGCs (on-off DSGCs), FOXP2 for F-RGCs, and melanopsin for ipRGCs (Figure 3A). Forty-five percent of PVALB+ RGCs were alpha RGCs, 16% were ooDSGCs, 13% were F-RGCs, and none were melanopsin positive ipRGCs (Figure 3B). About 26% of PVALB+ RGCs were not labeled by any of the four antibodies. In order to define the subtypes of the unlabeled cells, we applied established cell morphological criteria. We crossed the Pvalb-FlpE driver with a CAGGCre-ER driver and Ai65 reporter line. The CAGGCre-ER driver has a small amount of “leaky” Cre expression in the absence of tamoxifen, which allowed us to visualize individual cells for single-cell reconstruction. In addition to alpha RGCs, ooDSGCs, F-RGCs (Figures 3Ci–v), the analysis of single cell morphologies revealed that Pvalb-FlpE targeted at least 5 more RGC types that resemble on-DSGCs, sbcRGCs, CRH-3 RGCs (Zhu et al., 2014), G1 RGCs and G4 RGCs (Baden et al., 2016). Examples of single cell morphologies representing each RGC type are shown in Figures 3Cvi–x. It has been reported that the Pvalb-Cre driver shows differential labeling across the retina (Baden et al., 2016). In this study, the cells were analyzed across the entire retina instead of any preferred locations.
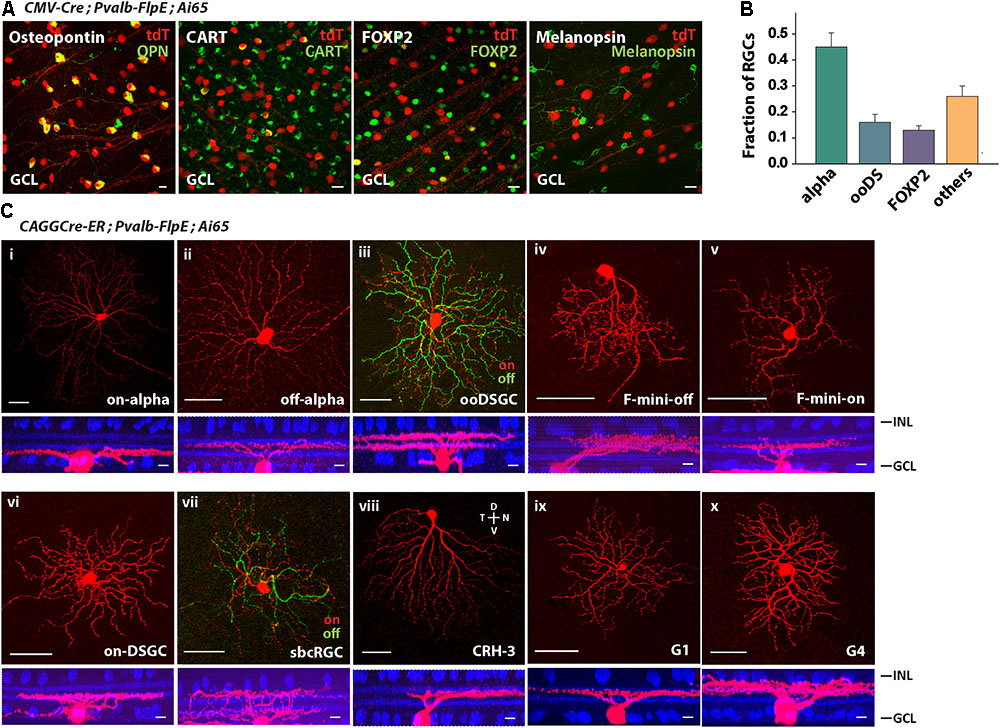
FIGURE 3. The Pvalb-FlpE driver targeted multiple RGC types. (A) The Pvalb-FlpE driver was crossed with CMV-Cre and Ai65 mice. Immunostainings were performed by using antibody markers for 4 different RGC types: Osteopontin for alpha RGCs, CART for ooDSGCs, FOXP2 for F-RGCs, and melanopsin for ipRGCs. Scale bar, 20 μm. (B) Proportions of RGC types targeted in the Pvalb-FlpE driver. n = 6 retinas from 6 animals (6 litters). (C) RGC types extracted from CAGGCre-ER;Pvalb-FlpE;Ai65 retinas without tamoxifen administration. Flat-mount view (top) and side view (bottom) with ChAT (blue) labeling. Scale bar: 50 μm for the flat-mount view, 10 μm for the side view.
Since the Sst-FlpO driver expressed transgenes in both RGCs and ACs (Figure 2B), we tested whether we could separate RGCs from ACs by crossing Sst-FlpO mice with Vglut2-Cre and Slc32a-Cre mice, respectively. As predicted, all the AC labeling was removed and only RGCs remained labeled in the Vglut2-Cre/Sst-FlpO cross (Figure 4Ai). The labeled RGCs were spaced far apart, enabling us to perform single-cell reconstruction. In the Slc32a-Cre/Sst-FlpO cross, only ACs remained labeled, including cells in both INL and GCL (Figure 4Aii). AC labeling was dense and required further segregation.
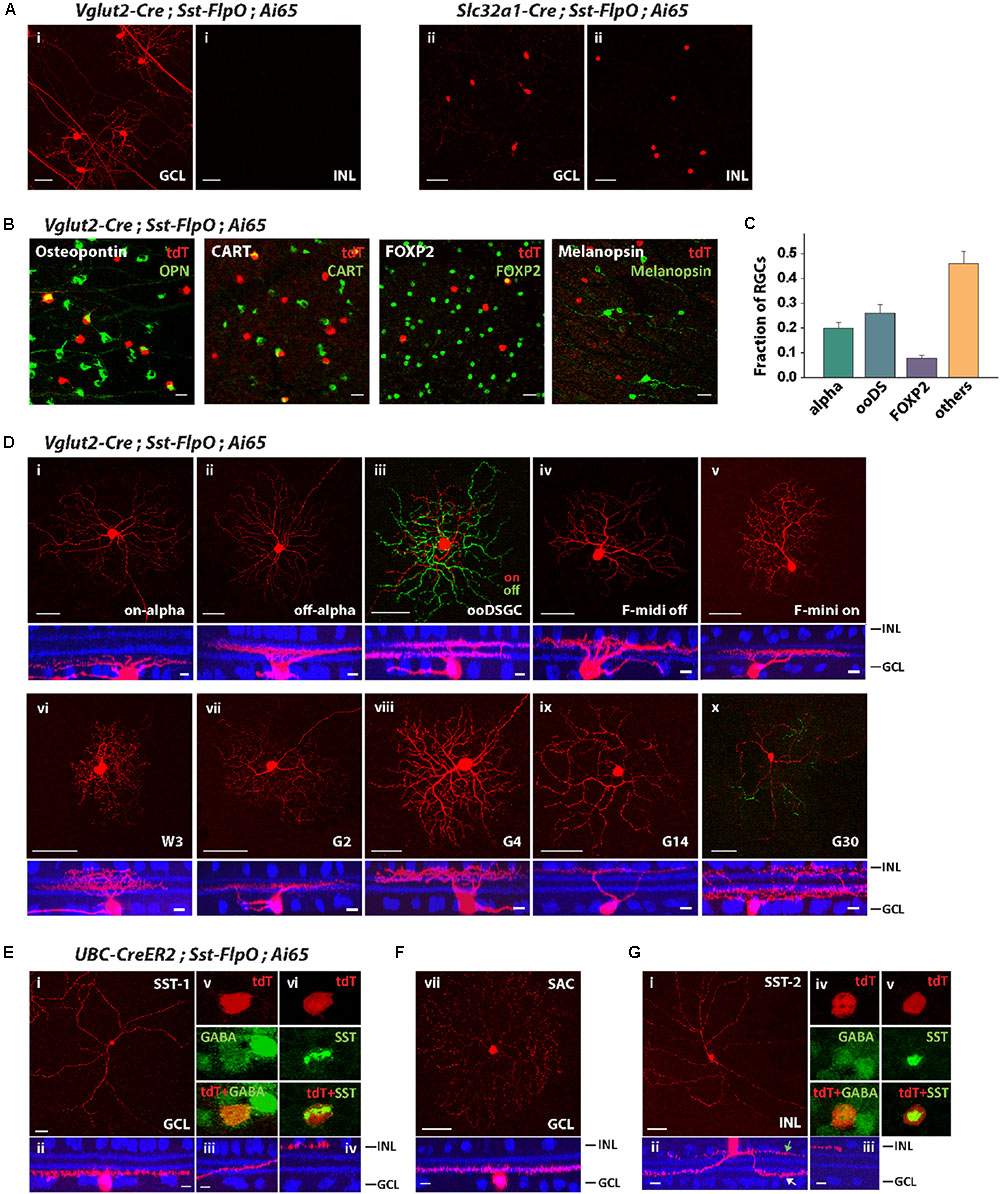
FIGURE 4. The Sst-FlpO driver targeted both RGCs and ACs. (A) (i) To identify targeted RGCs, the Sst-FlpO driver was crossed with Vglut2-Cre and Ai65 reporter mice. (ii) To identify targeted amacrine cells, the Sst-FlpO driver was crossed with Slc32a1-Cre and Ai65 mice. Scale bar, 50μm. (B) Staining for RGC markers (green). RGC constituents were probed with antibodies against Osteopontin, CART, FOXP2 and melanopsin in the Vglut2-Cre;Sst-FlpO;Ai65 retinas. Scale bar, 20 μm. (C) Proportions of RGC types targeted in the Sst-FlpO driver. n = 7 retinas from 7 animals (6 litters). (D) Individual RGC types extracted from the Vglut2-Cre;Sst-FlpO;Ai65 retinas. Flat-mount views (top) and side views (bottom) with ChAT (blue). Scale bar: 50 μm for the flat-mount view, 10 μm for the side view. (E–G) Amacrine cell types extracted from the UBC-CreER2;Sst-FlpO;Ai65 retinas, without tamoxifen administration. (E) Representative images of an SST-1 AC. (i) Flat-mount view of the soma and surrounding processes. (ii) Side view of the soma and surrounding “dendrite-like” and “axon-like” processes. (iii) Axon-like processes traveled across the IPL and ended at the INL border (iv). An SST-1 AC was co-labeled with antibodies against GABA (v) and SST (vi). (F) A starburst amacrine cell (SAC) in the GCL. Flat-mount view (top) and side view (bottom) with ChAT (blue). (G) SST-2 AC. Flat-mount view of the soma and surrounding processes. (ii) Side view of the soma and surrounding dendrite-like (white arrow) and axon-like processes (green arrow). (iii) Axon-like process end at the INL border. An SST-2 AC was co-labeled with antibodies against GABA (iv) and SST (v). Scale bar for (E–G): 50 μm for the flat-mount view, 10 μm for the side view.
To characterize the distribution of RGC types in the Vglut2-Cre/Sst-FlpO retina, we first labeled SST+ RGCs with antibodies against Osteopontin, CART, FOXP2 and melanopsin (Figure 4B). Unlike in the Pvalb-FlpE driver, alpha RGCs only accounted for 20% of SST+ RGCs, ooDSGCs accounted for 26%, and F-RGCs accounted for 8% of SST+ RGCs (Figure 4C). No SST+ RGCs was labeled by the antibody to melanopsin. Forty-six percent of SST+ RGCs were unidentified by the antibodies. Single-cell reconstruction revealed that, in addition to alpha RGCs, ooDSGCs, and F-RGCs (Figures 4Di–v), the Sst-FlpO driver targeted at least 5 more RGC types. Their morphologies strongly resembled those of W3, G2, G4, G14, and G30 (Baden et al., 2016) (Figures 4Dvi–x). Although alpha RGCs were the dominant RGC in the Pvalb-FlpE driver, RGCs in the Sst-FlpO driver were more evenly distributed among at least 10 RGC types.
Since AC labeling was still quite dense in the Slc32a-Cre/Sst-FlpO line, we identified ACs in the Sst-FlpO driver by crossing it with an inducible Cre driver, UBC-CreERT2, which facilitated sparse labeling. We ignored labeled RCGs in the UBC-CreERT2/Sst-FlpO retina and instead identified three types of ACs, two in the GCL and one in the INL. The first AC type in the GCL was similar to the SST-1 AC identified in the Sst-Cre driver (Zhu et al., 2014). It had a soma ∼13 μm (12.8 ± 1.3 μm) in diameter and gave rise to thick “dendrite-like” processes and a long, fine axon-like process (Figure 4Ei). The dendrite-like arbors ramified at the GCL border (Figure 4Eii), while the axon-like arbor started off near the GCL border and then traversed the width of the IPL and ended in a ramification at the INL border (Figures 4Eii–iv). SST-1 ACs were GABAergic (Figure 4Ev) and labeled with an antibody to SST (Figure 4Evi). The second AC type in the GCL was a displaced starburst AC (Figure 4F), which was also observed in the Sst-Cre driver (Zhu et al., 2014). The AC type in the INL (named SST-2 AC) had a soma around 11 μm (10.9 ± 1.2 μm) in diameter, and gave rise to 2–3 dendrite-like processes (Figure 4Gi) that branched and ramified at the GCL border (Figure 4Gii), and 1-2 axon-like processes that remained at the INL border (Figure 4Giii). SST-2 ACs were GABAergic (Figure 4Giv) and positive for SST antibody labeling (Figure 4Gv).
To segregate cell types in the Vip-FlpO driver, we crossed it with the UBS-CreERT2 driver and achieved sparse labeling with a low dose of tamoxifen. The Vip-FlpO driver targeted FLPo expression in three AC types, consistent with the Cre expression pattern described in the Vip-Cre driver (Akrouh and Kerschensteiner, 2015; Park et al., 2015; Perez de Sevilla Muller et al., 2017). The first type was a wide-field bistratified AC previously named VIP-1 (Zhu et al., 2014; Akrouh and Kerschensteiner, 2015). VIP-1 ACs have somata (11.2 ± 1.1 μm in diameter) located in the INL with dendrites that ramified in two layers (Figure 5Ai): the ON dendrites ramified between the ON ChAT band and the GCL (75.8% ± 3.5% of the IPL) and the OFF dendrites ramified between the OFF ChAT band and the INL (12.9% ± 1.6% of the IPL). Many of the cells had a long process or “tails” that extended at least 200 μm from the soma (Figure 5Ai). The ON and OFF dendritic fields (excluding the “tails”) were 201 ± 27 μm and 178 ± 36 μm in diameter, respectively. The second type was a monostratified AC named VIP-2 in previous studies (Akrouh and Kerschensteiner, 2015; Perez de Sevilla Muller et al., 2017). The cell soma was located in the INL and its dendrites ramified in a thick band between 41.8 ± 3.5% and 65.8% ± 0.2% in the IPL covering the ON ChAT band (Figure 5Bi). The dendritic field of the VIP-2 AC was 100 ± 21 μm in diameter. Unlike VIP-1 and VIP-2 ACs, the third AC type (named VIP-3 (Akrouh and Kerschensteiner, 2015; Perez de Sevilla Muller et al., 2017)) was a displaced AC with its soma located in the GCL. Its dendrites ramified near the GCL (Figure 5Ci). The dendritic field of the VIP-3 AC was 221 ± 43 μm in diameter. All three types of VIP ACs were GABAergic (Figures 5Aii,Bii,Cii) and labeled with an antibody to VIP (Figures 5Aiii,Biii,Ciii). Table 2 summaries the AC and RGC types in Flp drivers.
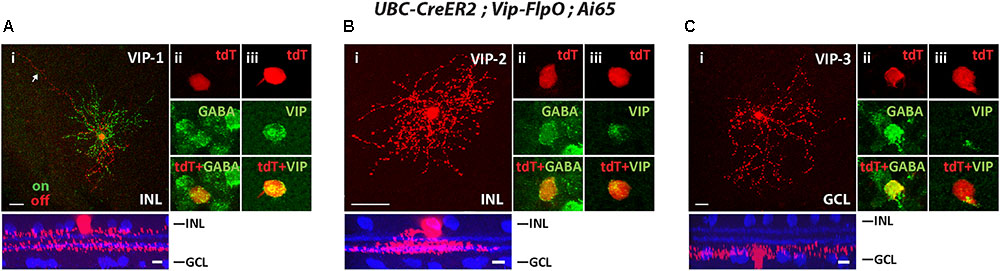
FIGURE 5. The Vip-FlpO driver targeted 3 types of ACs. The Vip-FlpO driver was crossed with UBC-CreER2 and Ai65, 20 μg tamoxifen was administered to achieve sparse labeling of ACs. Representative images for VIP-1 AC (A), VIP-2 AC (B), and VIP-3 AC (C) are shown in flat-mount view (top) and side view (bottom) with ChAT (blue) in (i). Arrow in (Ai) shows the “tail” of the VIP-1 AC. Sections were co-labeled with antibodies against GABA (green) (ii) and VIP (green) (iii). Scale bar: 25 μm for flat-mount view, 10 μm for side view.
To validate the feasibility of using Cre/Flp intersections to limit expression to a small subset or even one neuronal type in the retina, we selectively crossed pairs of Cre and Flp drivers showing overlap in expression patterns of RGCs or ACs (Figure 6 and Table 3).
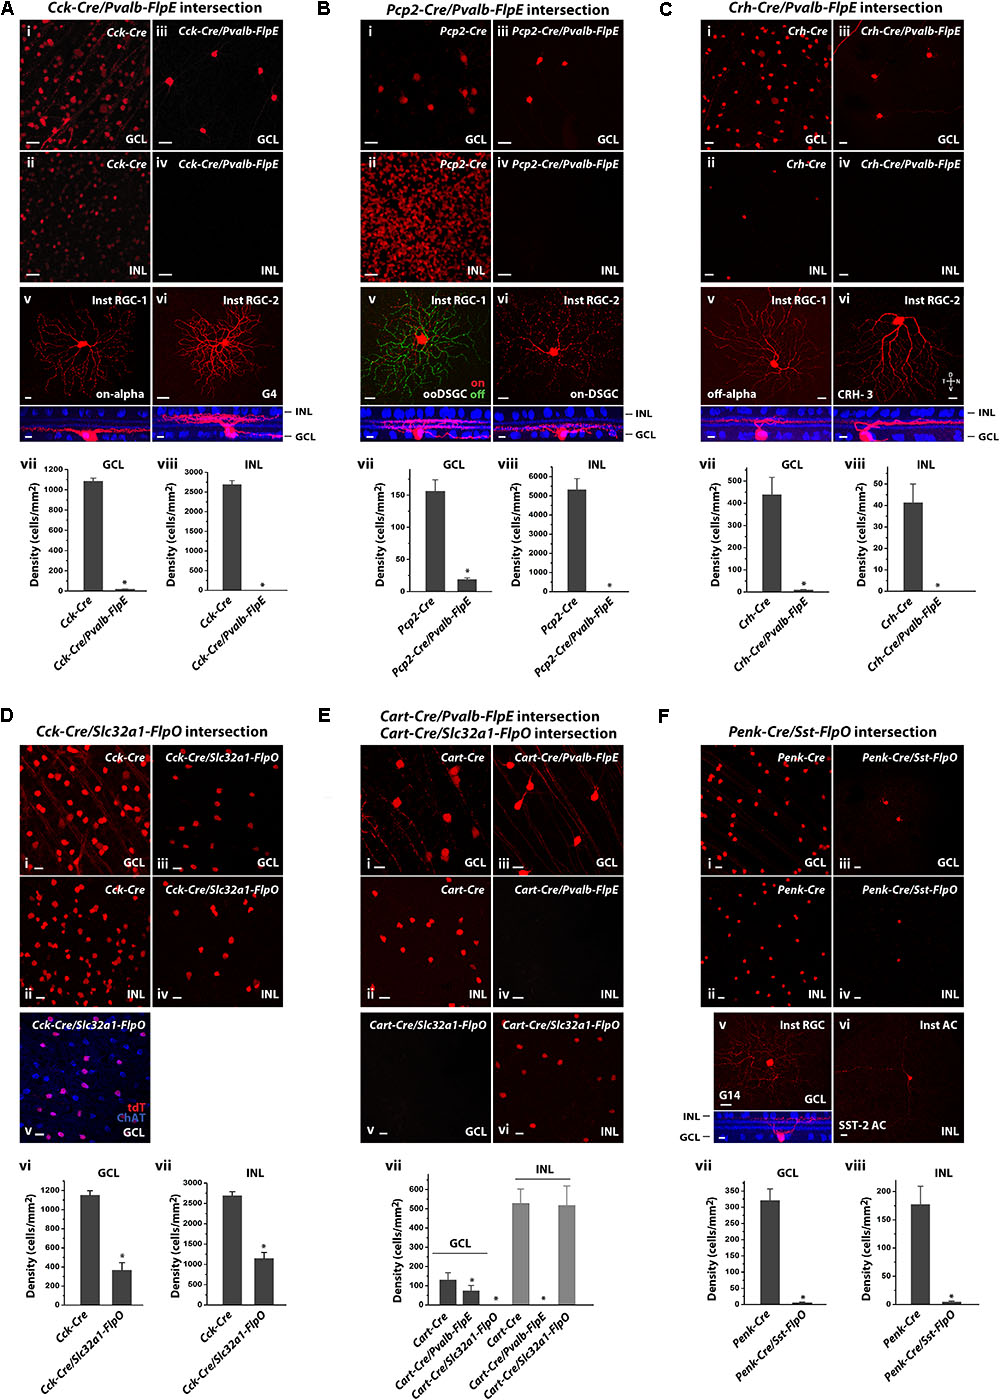
FIGURE 6. Intersectional strategies to restrict labeling of retinal cell subpopulations. (A) Cck-Cre driver alone and in intersection with the Pvalb-FlpE driver. (i,ii) Distribution of tdTomato-labeled cells in the GCL (i) and the INL (ii) in the Cck-Cre driver crossed with the Ai9 reporter line. (iii,iv) Distribution of tdTomato-labeled cells from the Cck-Cre;Pvalb-FlpE;Ai65 intersection. (v,vi) Examples of individual cell types within the Cck/Pvalb intersection. Flat-mount view (top) and side view (bottom) with ChAT (blue). (vii,viii) Cell labeling density in the Cck-Cre and the Cck-Cre/Pvalb-FlpE intersection for the GCL (vii) or the INL (viii). n = 6 retinas from 6 animals (4 litters) for the Cck-Cre;Ai9. n = 6 retinas from 6 animals (5 litters) for the Cck-Cre;Pvalb-FlpE;Ai65. ∗p < 0.05, two-tailed t-test. (B) Pcp2-Cre driver alone and in intersection with the Pvalb-FlpE driver. (i,ii) labeling of Pcp2-Cre mice by crossing with the Ai9 reporter. (iii,iv) Intersection of Pcp2-Cre and Pvalb-FlpE in the Ai65 reporter. (v,vi) Flat mount views (top) and side views (bottom) of the cell types within the Pcp2/Pvalb intersection. (vii,viii) Cell labeling density in the Pcp2-Cre and the Pcp2-Cre/Pvalb-FlpE intersection for the GCL (vii) or the INL (viii). n = 6 retinas from 6 animals (4 litters) for the Pcp2-Cre;Ai9. n = 6 retinas from 6 animals (6 litters) for the Pcp2-Cre;Pvalb-FlpE;Ai65. ∗p < 0.05, two-tailed t-test. (C) Crh-Cre driver alone and in intersection with the Pvalb-FlpE driver. (i,ii) Crh-Cre driver expression as reported by Ai9 mice. (iii,iv) Intersection of Crh-Cre and Pvalb-FlpE in the Ai65 reporter. (v,vi) Example images of flat mount views (top) and side views (bottom) of the cells within the Crh/Pvalb intersection. (vii,viii) Comparing cell labeling density in the Crh-Cre and the Crh-Cre/Pvalb-FlpE intersection for the GCL (vii) or the INL (viii). n = 7 retinas from 7 animals (5 litters) for the Crh-Cre;Ai9. n = 7 retinas from 7 animals (5 litters) for the Crh-Cre;Pvalb-FlpE;Ai65. ∗p < 0.05, two-tailed t-test. (D) Cck-Cre driver alone and Cck-Cre/Slc32a1-FlpO intersection. (i,ii) Cck-Cre driver crossed with the Ai9 reporter. (iii,iv) Intersection of Cck-Cre and Slc32a1-FlpO reported in Ai65 mice. (v) Cck-Cre/Slc32a1-FlpO intersection (red) in the GCL counter-stained with an antibody against ChAT (blue). (vi,vii) Cell labeling density in the Cck-Cre and the Cck-Cre/Slc32a1-FlpO intersection for the GCL (vi) or the INL (vii). n = 6 retinas from 6 animals (5 litters) for the Cck-Cre;Ai9. n = 6 retinas from 6 animals (5 litters) for the Cck-Cre;Slc32a1-FlpO;Ai65. ∗p < 0.05, two-tailed t-test. (E) Cart-Cre driver alone and in intersection with Pvalb-FlpE or Slc32a1-FlpO. (i,ii) Cart-Cre driver with Ai9 reporter. (iii,iv) Cart-Cre/Pvalb-FlpE intersection removed labeling from amacrine cells. (v,vi) Cart-Cre/Slc32a1-FlpO intersection removed labeling from RGCs. (vii) Cell labeling density in Cart-Cre alone, Cart-Cre/Pvalb-FlpE intersection, and Cart-Cre/Slc32a1-FlpO intersection for the GCL (dark gray) or the INL (gray). n = 8 retinas from 8 animals (5 litters) for the Cart-Cre;Ai9. n = 8 retinas from 8 animals (6 litters) for the Cart-Cre;Pvalb-FlpE;Ai65. n = 8 retinas from 8 animals (6 litters) for the Cart-Cre;Slc32a1-FlpO;Ai65. ∗p < 0.05, two-tailed t-test. (F) Penk-Cre driver alone and Penk-Cre /Sst-FlpO intersection. (i,ii) Penk-Cre driver with Ai9 reporter. (iii,iv) Intersection of Penk-Cre and Sst-FlpO in the Ai65 reporter. (v,vi) Example images of individual cell types within the Penk/Sst intersection. Flat-mount view (top) and side view (bottom) with ChAT (blue). (vii,viii) Cell labeling density in the Penk-Cre and the Penk/Sst intersection for the GCL (vii) or the INL (viii). n = 7 retinas from 7 animals (5 litters) for the Penk-Cre;Ai9. n = 7 retinas from 7 animals (5 litters) for the Penk-Cre;Sst-FlpO;Ai65.∗p < 0.05, two-tailed t-test. Scale bar, 20 μm for flat-mount view, 10 μm for side view.
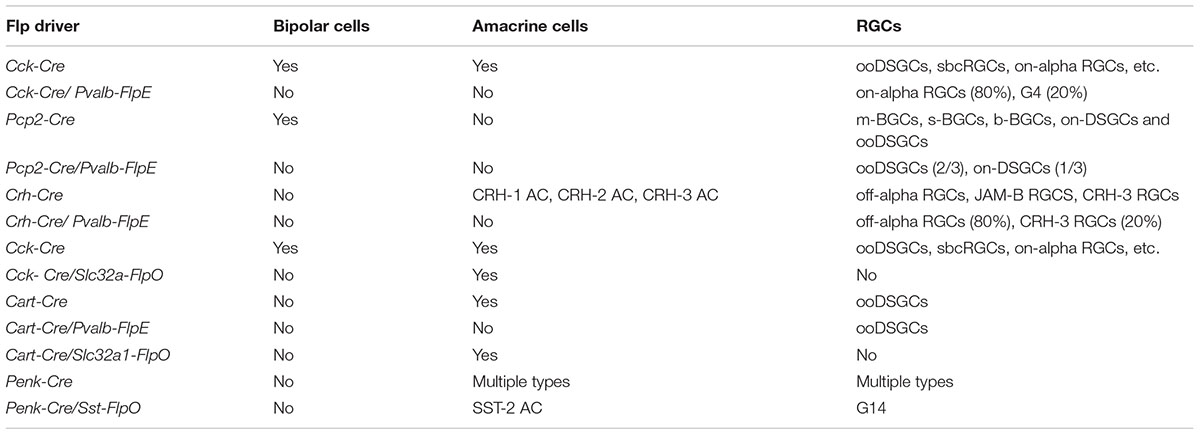
TABLE 3. Intersectional strategies to restrict retinal cell subpopulations.
Since the Pvalb-FlpE driver exclusively targeted RGC types, we reasoned that this line could provide a useful filter to remove non-RGC types in the Cre/Flp intersection. This idea was demonstrated in several examples. The first example was a Cck-Cre/Pvalb-FlpE intersection. In the Cck-Cre line, Cre expression was observed in bipolar, amacrine, ganglion, and Müller cells (Zhu et al., 2014). Bipolar cells made up more than half of the labeled cells in the INL, with the rest being ACs and a small number of Müller cells (Figure 6Aii). The GCL contained both labeled ACs and RCGs (Figure 6Ai) including the following types: starburst ACs, ooDSGCs, sbcRGCs, on-alpha RGCs (Zhu et al., 2014), and other RGC types. Thus, combining the Cck-Cre and Pvalb-FlpE drivers should allow us to isolate the CCK/PVALB-double positive RGCs. Indeed, the Cck-Cre/Pvalb-FlpE combination effectively removed all the labeling from the INL (Figures 6Aiv,viii), as well as 98% of the labeling in the GCL (Figures 6Aiii,vii). Only two types of RGCs remained labeled: one type (80% of the sample) resembled on-alpha RGCs (Figure 6Av) and the other type (20% of the sample) resembled G4 (Baden et al., 2016) (Figure 6Avi).
In a second example, we created a Pcp2-Cre/Pvalb-FlpE intersection. The Pcp2-Cre driver predominantly targets bipolar cells (Lu et al., 2013) along with five types of RGCs: m-BGCs, s-BGCs, b-BGCs, on-DSGCs and ooDSGCs (Ivanova et al., 2013). Our analysis of Pcp2-Cre expression (Figures 6Bi,ii) is in agreement with previous reports. As expected, bipolar cell labeling was absent in the Pcp2-Cre/Pvalb-FlpE cross (Figures 6Biv,viii). Additionally, this combination also removed labeling from three out of five RGC types (m-BGCs, s-BGCs, b-BGCs) leaving only two types labeled: on-DSGCs and ooDSGC (Figures 6Biii,vii): two-thirds were on-off DSGCs (Figure 6Bv) versus one-third on-DSGCs (Figure 6Bvi).
In a third example, we crossed the Pvalb-FlpE and Crh-Cre drivers to isolate a population of CRH/PVALB-double positive RGCs. As demonstrated in previous studies, the Crh-Cre driver targeted at least three types of ACs (Park et al., 2018) and three types of RGCs in the GCL (off-alpha RGCs, JAM-B RGCS and CRH-3 RGCs) (Zhu et al., 2014), as well as a small number of ACs in the INL (Figures 6Ci,ii). The Crh-Cre/Pvalb-FlpE intersection removed labeling from the ACs in the GCL (Figures 6Ciii,vii) and the INL (Figures 6Civ,viii). Eventually, only two types of RGCs remained: more than 80% of the labeled cells belonged to off-alpha RGCs (CRH-1 RGCs, Figure 6Cv) while the rest were CRH-3 RGCs (Figure 6Cvi) (Zhu et al., 2014).
In contrast to the Pvalb-FlpE driver, the Slc32a1-FlpO driver only targeted ACs thus it could be used to remove labeling from both bipolar cells and RGCs. To test the effectiveness of the Slc32a1-FlpO driver in this application, we paired it with the Cck-Cre driver which broadly targets bipolar cells, ACs, Müller cells and RGCs (Figures 6Di,ii). As predicted, crossing Slc32a1-FlpO with Cck-Cre effectively removed labeling from bipolar and Müller cells in the INL, and only AC labeling remained (Figures 6Div,vii). In the GCL, all the RGC labeling was removed (Figures 6Diii,vi) and the remaining labeled ACs were all starburst as confirmed with ChAT antibody staining (Figure 6Dv), consistent with previous results (Zhu et al., 2014).
The foregoing experiments demonstrated intersectional applications of two Flp drivers: Pvalb-FlpE and Slc32a1-FlpO with each crossed with different Cre drivers. Next, we reasoned that, if we applied Pvalb-FlpE intersection and Slc32a1-FlpO intersection in parallel, we could separately target ACs and RGCs in a same Cre driver for functional study. Here we chose the Cart-Cre driver. CART (Cocaine and amphetamine-regulated transcript) expresses in 15% of all RGCs as well as in a small group of ACs in the inner nuclear layer. It has been demonstrated that all CART-expressing RGCs are ooDSGCs (Kay et al., 2011; Park et al., 2014). In the Cart-Cre driver, all the Cre-positive cells in the GCL were ooDSGCs, while the cells in the INL belonged to two types of ACs (Figures 6Ei,ii).
Crossing the Cart-Cre with the Pvalb-FlpE eliminated all the AC labeling (Figures 6Eiv,vii), leaving only ooDSGCs labeling in the GCL (Figure 6Eiii). On the other hand, crossing the Cart-Cre with the Slc32a-FlpO removed all the labeling from ooDSGCs (Figures 6Ev,vii), leaving only AC labeling in the INL (Figure 6Evi). This result demonstrates that intersectional strategies with the Pvalb-FlpE and Slc32a1-FlpO drivers can effectively lead to highly selective cell type-specific targeting in Cre lines driving expression in both ACs and RGCs.
The Sst-FlpO driver targeted only three types of ACs. We reasoned if we could find a suitable Cre driver to pair with the Sst-FlpO driver, we could potentially reduce the number of targeted AC types. We selected the Penk-Cre driver which targeted Cre expression to multiple types of ACs in the INL (Figure 6Fii) and multiple types of ACs and RGCs in the GCL (Figure 6Fi). Interestingly, we found that when the Penk-Cre driver was crossed with SST-FlpO driver, highly specific targeting was achieved as the Penk-Cre/Sst-FlpO intersection mostly captured one type of ACs in the INL (Figures 6Fiv,viii) that appeared to be the SST-2 AC (Figure 6Fvi) and one type of RGCs in the GCL (Figures 6Fiii,vii) that resembled G14 RGC (Figure 6Fv) (Baden et al., 2016), although the labeling was rather sparse. Table 3 summarizes the AC and RGC types obtained from the intersectional strategies.
Finally, we examined FLP expression in the seven drivers in two major retino-recipient regions in the brain: the lateral geniculate nucleus (LGN) and the superior colliculus (SC) (Figure 7 and Table 4). FLP-expressing cells were labeled with tdTomato in CMV-Cre/Flp/Ai65 mice. To mark retino-recipient zones, we performed intraocular injection of cholera toxin B conjugated to Alexa Fluor 488 (CTb-488), which fills RGC terminals via anterograde transport.
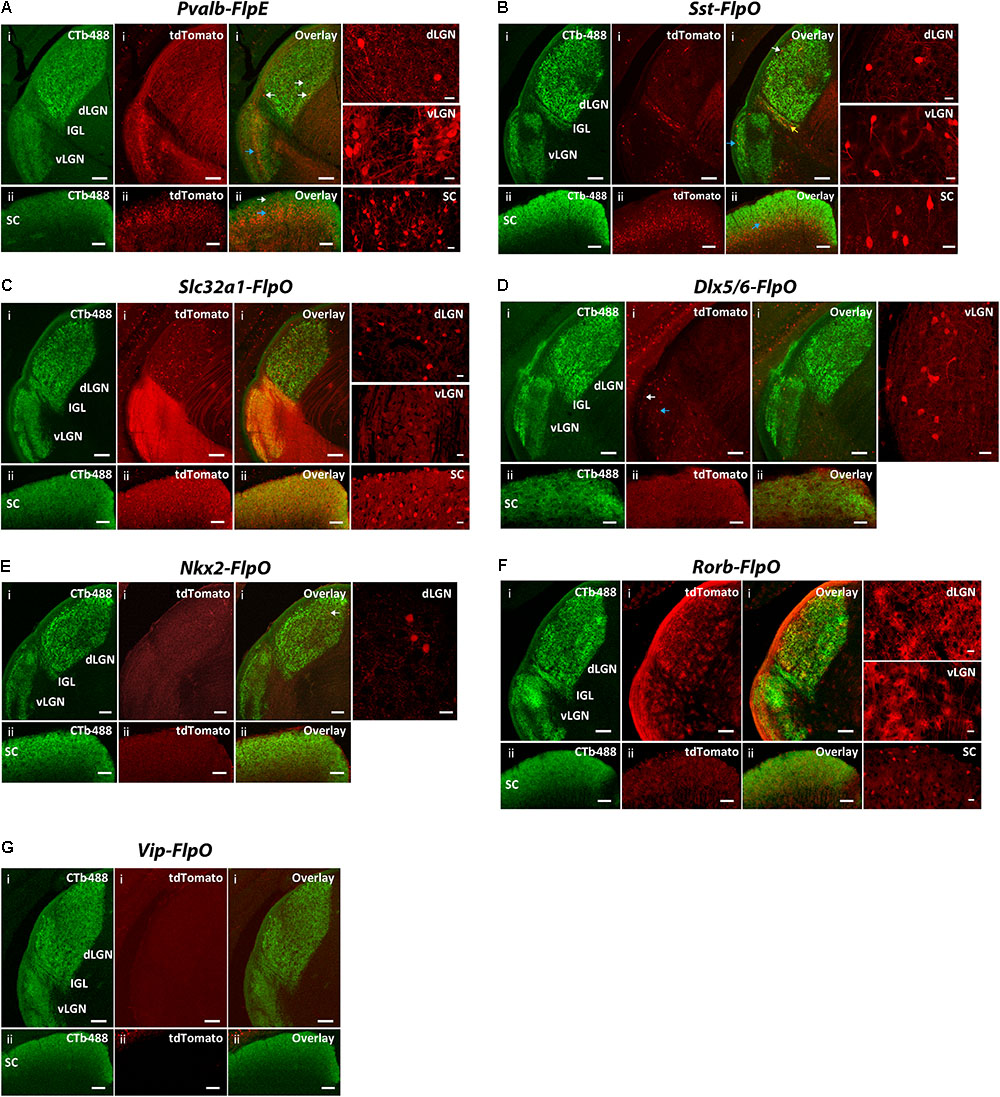
FIGURE 7. Expression patterns of Flp drivers in the SC and the LGN. FLP-expressing cells were labeled with tdTomato (red) in CMV-Cre;Flp;Ai65 mice. Retino-recipient zones were labeled with cholera toxin B conjugated to Alexa Fluor 488 (CTb-488) (green) injected to the eyes. (A) Pvalb-FlpE driver. In the SC, FLPe strongly expressed in the deep layer (ii, blue arrow) but sparsely expressed in the superficial layer (ii, white arrow). The middle layer of vLGN also strongly expressed FLPe (i, blue arrow). The dLGN showed very sparse labeling (i, white arrows). Intense tdTomato background comes from axons of FLPe+ RGCs. (B) Sst-FlpO driver. Strong FLPo expression was found in the deep layer of the SC (ii, blue arrow). Only sparse labeling was found in the vLGN and dLGN, while most of the labeled cells were in the superficial layer (i, white arrow for dLGN, blue arrow for vLGN). There was also moderate labeling in IGL (yellow arrow). (C) Slc32a1-FlpO targeted FLPo expression broadly to all the layers in the LGN and SC. (D) Dlx5/6-FlpO driver. FLPo expression was sparse and restricted primarily to the superficial (i, white arrow) and middle layer of the vLGN (i, blue arrow). No FLPo labeling was found in SC and dLGN. (E) Nkx2-FlpO driver. In the dLGN, sparely labeled cells were found in the core region (i, arrow). There was no labeling in other areas. (F) Rorb-FlpO driver. FLPo expression was observed in neurons in all layers in the SC (ii), as well as glial cells in the entire LGN including both the dLGN and the vLGN (i). (G) Vip-FlpO driver did not express in either the LGN or the SC. For each driver, examples of enlarged labeling area are shown on the right. Scale bar: 100 μm for the LGN, 50 μm for the SC, 20 μm for the enlarged regions.
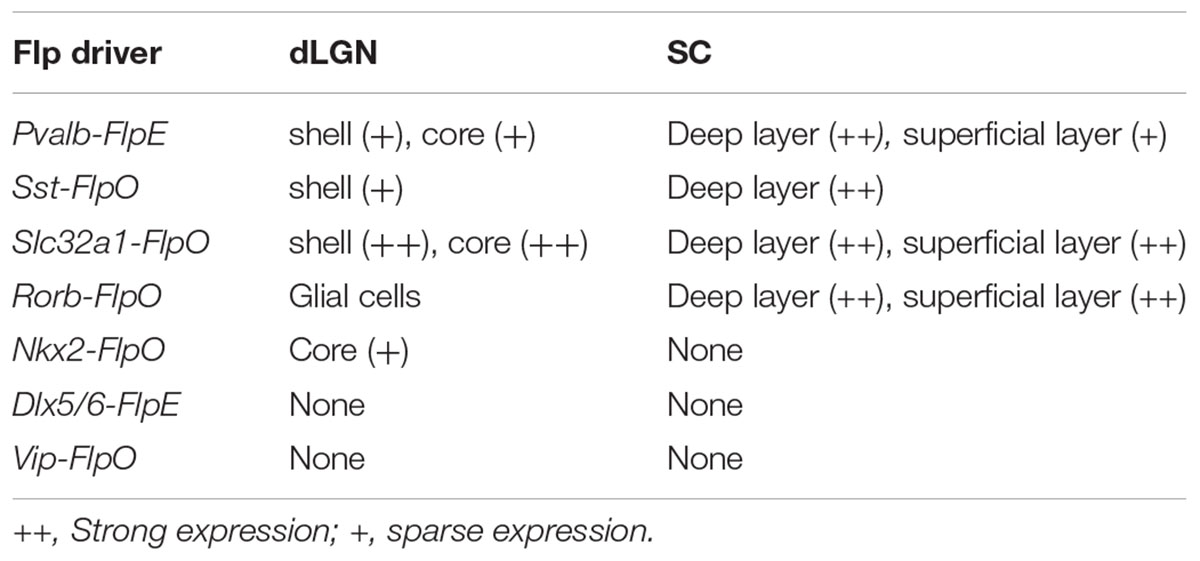
TABLE 4. FLP expression in the dLGN and the SC in Flp drivers.
In the Pvalb-FlpE driver, we observed prominent FLP expression in the deep layer of the SC but sparse expression in the superficial layer of the SC (Figure 7Aii). The middle layer of the vLGN also showed strong labeling (Figure 7Ai). However, only very sparse labeling was detected in both the shell and the core of the dLGN (Figure 7Ai). Note that Pvalb-FlpE targeted many RGCs whose axonal processes contributed to the strong tdTomato background in the image shown. In the Sst-FlpO driver, strong FLPo expression was found in the deep layer of the SC (Figure 7Bii). Sparse labeling was found in the vLGN and dLGN, with most of the labeled cells located in the superficial layer (Figure 7Bi). Interestingly, there was moderate labeling in the IGL in the Sst-Flp driver (Figure 7Bi). In the Slc32a1-FlpO driver, strong FLPo expression was observed in all layers in the dLGN, vLGN, and SC (Figures 7Ci,ii). In the Dlx5/6-FlpE driver, FLPe expression was restricted to the superficial and middle layers of the vLGN (Figure 7Di). No FLPo labeling was found in the SC and the dLGN (Figures 7Di,ii). In the NKx2-FlpO driver, neurons expressing the tdTomato reporter were only detected in the dLGN where they were sparely distributed within the core region (Figure 7Ei), no FLPo expression was detected in the SC (Figure 7Eii). In the Rorb-FlpO driver, FLPo expression targeted neurons in the SC (Figure 7Fii) and glial cells in the entire LGN including both the dLGN and the vLGN (Figure 7Fi). In the Vip-FlpO driver, no FLPo expression was observed in either the LGN or the SC (Figure 7G).
In summary, the SC labeling was observed from four lines: Pvalb-FlpO (all layers), Sst-FlpO (deep layer), Slc32a1-FlpO (all layers) and Rorb-FlpO (all layers). Meanwhile, dLGN labeling was observed in four lines: Pvalb-FlpE (shell and core), Sst-FlpO (shell), Slc32a1-FlpO (shell and core) and NKx2-FlpO (core). Finally, vLGN labeling was observed in four lines: Pvalb-FlpE (middle layer), Sst-FlpO (superficial layer) Slc32a1-FlpO (all layers) and Dlx5/6-FlpE (superficial layer and middle layer).
As in many other brain circuits, there are two major challenges for dissecting retinal circuits: (Demb and Singer, 2015) to increase the specificity of cell-type targeting and (Masland, 2012) to discover new cell types involved in the circuits. Here we used an intersectional strategy, specifically the combination of Cre/LoxP and Flp/FRT systems, to increase the specificity for targeting amacrine and ganglion cell types in the mouse retina. The Flp-FRT system carries out site-specific recombination similar to the Cre-loxP system, however the efficiency of recombination mediated by the wild type Flp recombinase is lower than that of Cre. Consequently Cre/loxP was initially chosen as the main genetic site-specific recombination system, leading to the development of hundreds of Cre driver lines over the past two decades (Gong et al., 2007). To improve the Flp-FRT system, a thermostable derivative of wild type Flp, FlpE (enhanced Flp), was developed and was further codon-optimized (named FlpO) (Bertolotto et al., 2016; Euler and Baden, 2016). These improvements made the Flp/FRT and Cre/loxP systems equally efficient for mouse genetic manipulations. Consequently, the last several years have seen the creation of increasing numbers of Flp lines, a trend that is expected to continue. Thus, we expect that strategies that we have tested here will have even greater applicability in the future.
Two parallel approaches could be used to facilitate the identification of suitable pairs of Cre and Flp drivers for intersection. First, information from transcriptome studies and protein expression profiling studies can be used to identify gene specific markers for retinal cell types/subtypes. In recent years, RNA sequencing (RNA-Seq)-based transcriptome analysis has begun to transform the study of the gene expression in the retina field (Siegert et al., 2012; Macosko et al., 2015; Shekhar et al., 2016; Rheaume et al., 2018). In silico data mining will allow us to select candidate genes whose promoters can be used to construct appropriate Cre lines and Flp lines. However, these mice are likely not available yet. In addition, due to the complex nature of gene expression, it is often unsurprising that transgene expression in a given transgenic mouse line or knock-in mouse line differ from endogenous gene expression. An alternative approach is to screen the available Cre and Flp drivers, and then select the appropriate pair with overlapped cell types. Given the limited information about the genetic profiling of many retinal cells and the limited number of available Flp drivers, we think the most straightforward approach at this stage is to screen the available Flp drivers so as to provide a base for future intersectional crossing with the appropriate Cre lines.
Since an intersectional approach is relatively new in retinal research, it is important to validate the feasibility of this strategy for targeting subpopulations of retinal cell types. Our experiments demonstrated two major advances for targeting retinal cells. First, intersections can be used to eliminate (or select for) whole classes of cells (i.e., ACs or RCGs). For example, the Pvalb-FlpE driver exclusively targets RGC types, thus it can be used to remove labeling from non-RGC types in the Cre/Flp intersection. In this study, we crossed Pvalb-FlpE lines with Cck-Cre, Pcp2-Cre, Crh-Cre and Cart-Cre drivers. In all cases, we found that only RGCs were selectively labeled while non-RGC labeling was removed. Conversely, we selected a Slc32a1-FlpO driver to eliminate non-AC labeling as the Slc32a1-FlpO driver only targeted ACs. Indeed when the Slc32a1-FlpO driver was paired with a Cck-Cre driver or a Cart-Cre driver, all non-AC labeling was effectively removed. Thus we have demonstrated that an intersectional strategy works to eliminate labeling from whole classes of cells. It is important to note that while Pvalb-FlpE only targets certain RCG types, it does not cover all of the RGCs. Therefore crossing Cre drivers with Pvalb-FlpE will filter out not only the non-RGC cells but also many RGCs not covered by Pvalb-FlpE. The Slc32a1-FlpO driver, on the other hand, targets more than 95% of ACs. Thus, a vast majority of the ACs targeted in Cre drivers will remain when crossed with the Slc32a1-FlpO driver.
The second advance of the intersectional strategy is the high selectivity that can be achieved. Our intersectional breedings have routinely removed more than 90% of the cells in Cre drivers, and lead to handful cell types remaining in the intersection. When crossing Pvalb-FlpE with Cck-Cre, Pcp2-Cre, Crh-Cre or Cart-Cre, we were able to isolate only one to three types of RGCs, which represents a big improvement compared with most existing Cre lines (Zhu et al., 2014; Martersteck et al., 2017). A more striking example came from the Penk-Cre/Sst-FlpO intersection which removed most cell types in the Penk-Cre driver and narrowed cell types down to mainly just one type of AC in the INL and one type of RGC in the GCL. By selecting appropriate pairs of Cre and Flp drivers for crossing, an intersectional strategy holds out the possibility of labeling, or introducing opto- and chemo-genetic manipulations into only a single type.
A present-day weakness of our approach is that Flp drivers for targeting more specific cell types, in particular, the AC types, are still lacking, except for Vip-FlpO and Sst-FlpO. Future development of Flp drivers to target more specific ACs will greatly benefit the functional characterization of AC types, the least well characterized cell class in the retina. The prevalence of mouse lines that report the presence of two recombinases is also an issue. Several reporter mouse lines for delivering fluorescent markers and genetic tools are available, including Ai65 for tdTomato and Ai80 for calcium translocating channelrhodopsin (CatCh, JAX025109). Further development of reporter lines for other genetically encoded sensors and effectors, such as GCaMP, iGluSnFr and DREADDs, will greatly facilitate various ways of observing and manipulating functions of cell types in the Cre/Flp intersection.
Beyond enhancing the specificity for cell type targeting, intersectional strategies also provide a powerful platform for discovering new cell types. Identifying AC types and completing the anatomical catalog for this major class of retinal interneuron has been a long-term challenge. Judiciously chosen intersections restrict the number of targeted cell types and can greatly reduce the density of cell labeling. This reduction allows us to tease apart the intermingled neuron networks in the IPL making it easier to anatomically identify new cell types. By introducing reporter mouse lines (Madisen et al., 2015) and viral vectors (Fenno et al., 2014; Madisen et al., 2015; He et al., 2016), genetically encoded calcium indicators and optogenetic effectors can be delivered to these new cells for systematic functional analysis.
YZ, JX, and SHD designed the experiments. AJ, JX, SD, SC, and YZ performed the experiments and collected the data. YZ and SHD analyzed the data and interpreted the results. YZ, JX, and SHD wrote the manuscript draft. All the authors reviewed and approved the manuscript.
This work was supported by the Whitehall Foundation (YZ, 2017-05-20), NIH grant R01EY018204 (SHD), and Research to Prevent Blindness.
The authors declare that the research was conducted in the absence of any commercial or financial relationships that could be construed as a potential conflict of interest.
We are grateful to Dr. Hongkui Zeng at the Allen Institute for Brain Science for providing the Slc32a1-FlpO driver line.
Akrouh, A., and Kerschensteiner, D. (2015). Morphology and function of three VIP-expressing amacrine cell types in the mouse retina. J. Neurophysiol. 114, 2431–2438. doi: 10.1152/jn.00526.2015
Allen, W. E., and Luo, L. (2015). Intersectional illumination of neural circuit function. Neuron 85, 889–892. doi: 10.1016/j.neuron.2015.02.032
Atasoy, D., Aponte, Y., Su, H. H., and Sternson, S. M. (2008). A FLEX switch targets Channelrhodopsin-2 to multiple cell types for imaging and long-range circuit mapping. J. Neurosci. 28, 7025–7030. doi: 10.1523/JNEUROSCI.1954-08.2008
Baden, T., Berens, P., Franke, K., Roman Roson, M., Bethge, M., and Euler, T. (2016). The functional diversity of retinal ganglion cells in the mouse. Nature 529, 345–350. doi: 10.1038/nature16468
Bassett, E. A., Pontoriero, G. F., Feng, W., Marquardt, T., Fini, M. E., Williams, T., et al. (2007). Conditional deletion of activating protein 2alpha (AP-2alpha) in the developing retina demonstrates non-cell-autonomous roles for AP-2alpha in optic cup development. Mol. Cell. Biol. 27, 7497–7510. doi: 10.1128/MCB.00687-07
Bertolotto, C., Lesueur, F., Giuliano, S., Strub, T., de Lichy, M., Bille, K., et al. (2016). Corrigendum: a SUMOylation-defective MITF germline mutation predisposes to melanoma and renal carcinoma. Nature 531:126. doi: 10.1038/nature16158
Bisgrove, D. A., and Godbout, R. (1999). Differential expression of AP-2alpha and AP-2beta in the developing chick retina: repression of R-FABP promoter activity by AP-2. Dev. Dyn. 214, 195–206. doi: 10.1002/(SICI)1097-0177(199903)214:3<195::AID-AJA3>3.0.CO;2-8
Demb, J. B., and Singer, J. H. (2015). Functional circuitry of the retina. Annu. Rev. Vis. Sci. 1, 263–289. doi: 10.1146/annurev-vision-082114-035334
Dymecki, S. M., Ray, R. S., and Kim, J. C. (2010). Mapping cell fate and function using recombinase-based intersectional strategies. Methods Enzymol. 477, 183–213. doi: 10.1016/S0076-6879(10)77011-7
Eckert, D., Buhl, S., Weber, S., Jager, R., and Schorle, H. (2005). The AP-2 family of transcription factors. Genome Biol. 6:246. doi: 10.1186/gb-2005-6-13-246
Euler, T., and Baden, T. (2016). Computational neuroscience: species-specific motion detectors. Nature 535, 45–46. doi: 10.1038/nature18454
Fenno, L. E., Mattis, J., Ramakrishnan, C., Hyun, M., Lee, S. Y., He, M., et al. (2014). Targeting cells with single vectors using multiple-feature Boolean logic. Nat. Methods 11, 763–772. doi: 10.1038/nmeth.2996
Gong, S., Doughty, M., Harbaugh, C. R., Cummins, A., Hatten, M. E., Heintz, N., et al. (2007). Targeting Cre recombinase to specific neuron populations with bacterial artificial chromosome constructs. J. Neurosci. 27, 9817–9823. doi: 10.1523/JNEUROSCI.2707-07.2007
Haverkamp, S., Inta, D., Monyer, H., and Wassle, H. (2009). Expression analysis of green fluorescent protein in retinal neurons of four transgenic mouse lines. Neuroscience 160, 126–139. doi: 10.1016/j.neuroscience.2009.01.081
He, M., Tucciarone, J., Lee, S., Nigro, M. J., Kim, Y., Levine, J. M., et al. (2016). Strategies and tools for combinatorial targeting of GABAergic neurons in mouse cerebral cortex. Neuron 92:555. doi: 10.1016/j.neuron.2016.10.009
Hilger-Eversheim, K., Moser, M., Schorle, H., and Buettner, R. (2000). Regulatory roles of AP-2 transcription factors in vertebrate development, apoptosis and cell-cycle control. Gene 260, 1–12. doi: 10.1016/S0378-1119(00)00454-6
Ivanova, E., Hwang, G. S., and Pan, Z. H. (2010). Characterization of transgenic mouse lines expressing Cre recombinase in the retina. Neuroscience 165, 233–243. doi: 10.1016/j.neuroscience.2009.10.021
Ivanova, E., Lee, P., and Pan, Z. H. (2013). Characterization of multiple bistratified retinal ganglion cells in a purkinje cell protein 2-Cre transgenic mouse line. J. Comp. Neurol. 521, 2165–2180. doi: 10.1002/cne.23279
Johnson, J., Tian, N., Caywood, M. S., Reimer, R. J., Edwards, R. H., and Copenhagen, D. R. (2003). Vesicular neurotransmitter transporter expression in developing postnatal rodent retina: GABA and glycine precede glutamate. J. Neurosci. 23, 518–529. doi: 10.1523/JNEUROSCI.23-02-00518.2003
Kay, J. N., De la Huerta, I., Kim, I. J., Zhang, Y., Yamagata, M., Chu, M. W., et al. (2011). Retinal ganglion cells with distinct directional preferences differ in molecular identity, structure, and central projections. J. Neurosci. 31, 7753–7762. doi: 10.1523/JNEUROSCI.0907-11.2011
Kim, I. J., Zhang, Y., Meister, M., and Sanes, J. R. (2010). Laminar restriction of retinal ganglion cell dendrites and axons: subtype-specific developmental patterns revealed with transgenic markers. J. Neurosci. 30, 1452–1462. doi: 10.1523/JNEUROSCI.4779-09.2010
Land, P. W., Kyonka, E., and Shamalla-Hannah, L. (2004). Vesicular glutamate transporters in the lateral geniculate nucleus: expression of VGLUT2 by retinal terminals. Brain Res. 996, 251–254. doi: 10.1016/j.brainres.2003.10.032
Lu, Q., Ivanova, E., Ganjawala, T. H., and Pan, Z. H. (2013). Cre-mediated recombination efficiency and transgene expression patterns of three retinal bipolar cell-expressing Cre transgenic mouse lines. Mol. Vis. 19, 1310–1320.
Macosko, E. Z., Basu, A., Satija, R., Nemesh, J., Shekhar, K., Goldman, M., et al. (2015). Highly parallel genome-wide expression profiling of individual cells using nanoliter droplets. Cell 161, 1202–1214. doi: 10.1016/j.cell.2015.05.002
Madisen, L., Garner, A. R., Shimaoka, D., Chuong, A. S., Klapoetke, N. C., Li, L., et al. (2015). Transgenic mice for intersectional targeting of neural sensors and effectors with high specificity and performance. Neuron 85, 942–958. doi: 10.1016/j.neuron.2015.02.022
Martersteck, E. M., Hirokawa, K. E., Evarts, M., Bernard, A., Duan, X., Li, Y., et al. (2017). Diverse central projection patterns of retinal ganglion cells. Cell Rep. 18, 2058–2072. doi: 10.1016/j.celrep.2017.01.075
Masland, R. H. (2012). The neuronal organization of the retina. Neuron 76, 266–280. doi: 10.1016/j.neuron.2012.10.002
Park, S. J., Borghuis, B. G., Rahmani, P., Zeng, Q., Kim, I. J., and Demb, J. B. (2015). Function and circuitry of VIP+ interneurons in the mouse retina. J. Neurosci. 35, 10685–10700. doi: 10.1523/JNEUROSCI.0222-15.2015
Park, S. J., Kim, I. J., Looger, L. L., Demb, J. B., and Borghuis, B. G. (2014). Excitatory synaptic inputs to mouse on-off direction-selective retinal ganglion cells lack direction tuning. J. Neurosci. 34, 3976–3981. doi: 10.1523/JNEUROSCI.5017-13.2014
Park, S. J. H., Pottackal, J., Ke, J. B., Jun, N. Y., Rahmani, P., Kim, I. J., et al. (2018). Convergence and divergence of CRH amacrine cells in mouse retinal circuitry. J. Neurosci. 38, 3753–3766. doi: 10.1523/JNEUROSCI.2518-17.2018
Perez de Sevilla Muller, L., Solomon, A., Sheets, K., Hapukino, H., Rodriguez, A. R., and Brecha, N. C. (2017). Multiple cell types form the VIP amacrine cell population. J. Comp. Neurol. doi: 10.1002/cne.24234 [Epub ahead of print].
Rheaume, B. A., Jereen, A., Bolisetty, M., Sajid, M. S., Yang, Y., Renna, K., et al. (2018). Single cell transcriptome profiling of retinal ganglion cells identifies cellular subtypes. Nat. Commun. 9:2759. doi: 10.1038/s41467-018-05134-3
Rodriguez, A. R., de Sevilla Muller, L. P., and Brecha, N. C. (2014). The RNA binding protein RBPMS is a selective marker of ganglion cells in the mammalian retina. J. Comp. Neurol. 522, 1411–1443. doi: 10.1002/cne.23521
Rousso, D. L., Qiao, M., Kagan, R. D., Yamagata, M., Palmiter, R. D., and Sanes, J. R. (2016). Two pairs of ON and OFF retinal ganglion cells are defined by intersectional patterns of transcription factor expression. Cell Rep. 15, 1930–1944. doi: 10.1016/j.celrep.2016.04.069
Sanes, J. R., and Masland, R. H. (2015). The types of retinal ganglion cells: current status and implications for neuronal classification. Annu. Rev. Neurosci. 38, 221–246. doi: 10.1146/annurev-neuro-071714-034120
Shekhar, K., Lapan, S. W., Whitney, I. E., Tran, N. M., Macosko, E. Z., Kowalczyk, M., et al. (2016). Comprehensive classification of retinal bipolar neurons by single-cell transcriptomics. Cell 166, 1308–1323.e30. doi: 10.1016/j.cell.2016.07.054
Siegert, S., Cabuy, E., Scherf, B. G., Kohler, H., Panda, S., Le, Y. Z., et al. (2012). Transcriptional code and disease map for adult retinal cell types. Nat. Neurosci. 15, 487–495. doi: 10.1038/nn.3032
Siegert, S., Scherf, B. G., Del Punta, K., Didkovsky, N., Heintz, N., and Roska, B. (2009). Genetic address book for retinal cell types. Nat. Neurosci. 12, 1197–1204. doi: 10.1038/nn.2370
Sohal, V. S., Zhang, F., Yizhar, O., and Deisseroth, K. (2009). Parvalbumin neurons and gamma rhythms enhance cortical circuit performance. Nature 459, 698–702. doi: 10.1038/nature07991
Wassle, H. (2004). Parallel processing in the mammalian retina. Nat. Rev. Neurosci. 5, 747–757. doi: 10.1038/nrn1497
Keywords: retina, Cre, Flp, intersection, amacrine cell, ganglion cell
Citation: Jo A, Xu J, Deniz S, Cherian S, DeVries SH and Zhu Y (2018) Intersectional Strategies for Targeting Amacrine and Ganglion Cell Types in the Mouse Retina. Front. Neural Circuits 12:66. doi: 10.3389/fncir.2018.00066
Received: 10 May 2018; Accepted: 02 August 2018;
Published: 22 August 2018.
Edited by:
David J. Margolis, Rutgers University, The State University of New Jersey, United StatesReviewed by:
Florentina Soto, Washington University in St. Louis, United StatesCopyright © 2018 Jo, Xu, Deniz, Cherian, DeVries and Zhu. This is an open-access article distributed under the terms of the Creative Commons Attribution License (CC BY). The use, distribution or reproduction in other forums is permitted, provided the original author(s) and the copyright owner(s) are credited and that the original publication in this journal is cited, in accordance with accepted academic practice. No use, distribution or reproduction is permitted which does not comply with these terms.
*Correspondence: Yongling Zhu, eW9uZ2xpbmctemh1QG5vcnRod2VzdGVybi5lZHU=
†These authors have contributed equally to this work
Disclaimer: All claims expressed in this article are solely those of the authors and do not necessarily represent those of their affiliated organizations, or those of the publisher, the editors and the reviewers. Any product that may be evaluated in this article or claim that may be made by its manufacturer is not guaranteed or endorsed by the publisher.
Research integrity at Frontiers
Learn more about the work of our research integrity team to safeguard the quality of each article we publish.