- 1Faculty of Computer Science and Biomedical Engineering, Institute of Neural Engineering, Graz University of Technology, Graz, Austria
- 2Biosciences Unit, Faculty of Medicine and Health Technology, Tampere University, Tampere, Finland
- 3Laboratory of Inbal Goshen, Hebrew University of Jerusalem, Edmond and Lily Safra Center (ELSC), Jerusalem, Israel
- 4BioTechMed, Graz, Austria
Recent studies indicate that astrocytes show heterogeneity in morphology and physiological function. They integrate synaptic signals and release calcium in reaction to active neurons. These calcium signals are not yet fully understood as they are highly dependent on the cell's morphology, which can vary across and within brain regions. We found structural heterogeneity among mouse hippocampal CA1 astrocytes based on geometric features, clustering 741 cells into six classes. Of those, we selected 84 cells and reconstructed their morphology based on confocal microscope images and converted them into multi-compartment models with a high detailedness. We applied a computational biophysical model simulating the intracellular ion and IP3 signaling and diffusion in those 3D cell geometries. The cells were stimulated with three different glutamate stimuli. Calcium mainly oscillated in the stimulated and the neighboring compartment but not in the soma. Significant differences were found in the peak width, mean prominence, and mean peak amplitude of the calcium signal when comparing the signals in the stimulated and neighboring compartments. Overall, this study highlights the influence of the complex morphology of astrocytes on intracellular ionic signaling.
1 Introduction
Over time, the conventional view that astrocytes primarily fulfill structural, metabolic, and regulatory roles has been challenged. Recent research spanning the past three decades has unveiled a more active role for astrocytes, indicating their involvement in modulating synaptic transmission and brain metabolism (Araque et al., 1999; Haydon and Carmignoto, 2006; Nedergaard and Verkhratsky, 2012). Each astrocyte consists of a soma with multiple outgoing branches that further divide into smaller branchlets, ultimately leading to the perisynaptic astrocyte processes (PAPs). Notably, the abundance and morphology of astrocytes exhibit significant variability across species, brain regions, and cortical layers (Zhou et al., 2019; Khakh and Deneen, 2019; Verkhratsky and Nedergaard, 2018; Holt, 2023; Baldwin et al., 2023). Comparative studies have revealed striking differences, such as human neocortical astrocytes being 2.6 times larger in diameter and possessing up to 10 times more primary branches than their rodent counterparts (Oberheim et al., 2009). Moreover, investigations by Lanjakornsiripan et al. (2018) have delineated distinct variations in cell orientation, territorial volume, and arborization among different layers within the somatosensory cortex of mice. Heterogeneity in astrocytes may also have an impact on brain functions and diseases. Grolla et al. (2013) suggested that calcium (Ca2+), an important cellular messenger, responses to Amyloid-β differ in primary cultured mouse astrocytes of the entorhinal cortex and the hippocampus. Exposure to Amyloid-β increased expression of the metabotropic glutamate receptor type 5 (mGluR5) and increased Ca2+ concentration in the hippocampus but not the entorhinal cortex. It may be the case that the lack of astrogliosis in the entorhinal cortex is a contributing factor to the higher vulnerability of this region to Alzheimer's disease.
Various studies have been conducted to classify astrocytes. Viana et al. (2023) statistically analyzed astrocytes from the mouse hippocampus, a region critical for learning and memory, and found structural heterogeneity in their morphology across hippocampal domains. They identified three types of astrocytes in the Cornu Ammonis area 1 (CA1) and two in the dentate gyrus. Lanjakornsiripan et al. (2018) performed hierarchical clustering on non-pial neocortical astrocytes based on morphological features and found four distinct classes. Batiuk et al. (2020) found five different astrocyte subtypes according to gene expression in the mouse cortex and hippocampus. Karpf et al. (2022) classified layer-specific astrocyte subtypes in the mouse dentate gyrus based on density measured with GFAP and SOX2 markers.
Astrocytes primarily communicate through Ca2+ transients, which can evolve as global events spanning over the entire astrocytic cell or localized responses within specific branches (Di Castro et al., 2011; Srinivasan et al., 2015; Semyanov et al., 2020). The mechanisms underlying intracellular Ca2+ dynamics can be categorized into at least two distinct pathways. The first pathway involves the binding of glutamate to metabotropic glutamate receptors (mGluRs) on the astrocytic plasma membrane, triggering the production of inositol 1,4,5-trisphosphate (IP3). Elevated IP3 levels increase the probability of opening the IP3 receptor (IP3R) channels at the endoplasmic reticulum (ER) membrane, leading to an influx of Ca2+ from the ER into the cytosol. This Ca2+ release can initiate a Ca2+-induced Ca2+ release (CICR) mechanism, further amplifying the cytosolic Ca2+ signal (Sharma and Vijayaraghavan, 2001). The SERCA (sarcoplasmic/endoplasmic reticulum Ca2+-ATPase) pump transports Ca2+ back from the cytosol to the ER. The second pathway involves the activation of glutamate transporters (EAAT1 and EAAT2 in the human brain and GLAST and GLT-1 as the rodent analogs) (Murphy-Royal et al., 2017; Mahmoud et al., 2019). The resulting changes in intracellular sodium (Na+) and potassium (K+) levels influence the activity of the Na+-Ca2+ exchanger (NCX) and the Na+-K+ ATPase (NKA). NCX can either export or import Ca2+, depending on the Na+ gradient, while NKA regulates the Na+ and K+ gradients across the plasma membrane (Kirischuk et al., 1997; Verkhratsky and Nedergaard, 2018). These described mechanisms highlight the complex interplay between glutamate signaling, ion homeostasis, and Ca2+ dynamics in astrocytes, underscoring their pivotal role in modulating neuronal activity and synaptic transmission (Araque et al., 2014).
However, heterogeneity in morphology may imply heterogeneity in function (Augusto-Oliveira et al., 2020), such as varying Ca2+ dynamics (Oberheim et al., 2012; Tsunematsu et al., 2021). In turn, Kruyer (2022) claims that heterogeneous Ca2+ dynamics influence morphological plasticity.
Computational models can aid in identifying the most relevant experiments to characterize and predict the function of a biological system (Lenk et al., 2024). Several papers include the morphology of astrocytes in their computational studies at various spatial scales. Verisokin et al. (2021) proposed an astrocyte network model with realistic, data-driven 2D cell morphologies. The model includes IP3-mediated Ca2+ signaling at the soma and branches as well as intra- and intercellular diffusion of IP3 and Ca2+. Although the model uses 2D cell templates, it can reproduce characteristic patterns of Ca2+ signaling to represent a single-plane imaging regime. Gordleeva et al. (2019) investigate with their neuron-astrocyte network model how Ca2+ dynamics in astrocytes can synchronize and coordinate neuronal network signaling. The model contains a neuron-astrocyte network of 100 synaptically-coupled neurons and two gap-junction-connected astrocytes. Each astrocyte consists of 53 compartments that are unit-length cylinders with a radius that reduces further away from the soma. The Ca2+ signaling is composed by IP3-mediated Ca2+ signaling and intracellular IP3 and Ca2+ diffusion. This model demonstrates that astrocytes serve as spatial and temporal integrators, responding to varying levels of neuronal activity with distinct Ca2+ dynamics that influence synaptic transmissions and facilitate spatial synchronization.
On the cellular level, a detailed multi-compartment astrocyte model has been introduced as ASTRO by Savtchenko et al. (2018). The astrocyte morphologies were reconstructed from two-photon excitation and correlational 3D electron microscopy images. The modeled dynamics included K+ fluxes, IP3 action and Ca2+ diffusion and buffering. On the subcellular level, a particle-based model of a PAP compartment was implemented by Denizot et al. (2019). Using their model, the authors were able to recreate stochastic Ca2+ signals and showed that their occurrence is heavily dependent on the spatial positioning of IP3R channels.
However, no computational study is currently used to systematically investigate the relationship between astrocyte morphology and function. Our research question, therefore, is whether differences in the morphology influence ion dynamics in astrocytes. To answer the question, we will use an extended version of the Oschmann et al. (2017) model, including morphology and diffusion. Overall, astrocyte heterogeneity in both form and function has important implications for our understanding of brain function and diseases. By elucidating the specific roles of different astrocyte subtypes, we can gain insights into the complex networks that underlie brain function and identify potential targets for therapeutic intervention in neurological disorders.
2 Methods
2.1 Preprocessing of the astrocyte reconstructions
The experimental data by Refaeli et al. (2021) was used to reconstruct the astrocyte morphologies (example of a reconstructed astrocyte in Figure 1A). As described in the paper, hippocampal CA1 tissue of male mice was made transparent by CLARITY, and astrocytes were labeled with GFAP::tdTomato and imaged with a laser scanning confocal microscope. Images of cubes with a size of 520 × 370 × 520 μm to 635 × 635 × 1, 500 μm were used to reconstruct single astrocytic domains with the filament tracer tool of the software IMARIS (Bitplane, UK) as described in Refaeli et al. (2021). We used six data sets from six different male mice for our analysis. The samples contained 1,765 astrocytes in total. The smallest recorded diameter of the branches was 0.75 μm. All the work described in the following has been done with Python and MATLAB (see Supplementary Section 1.1 for details).
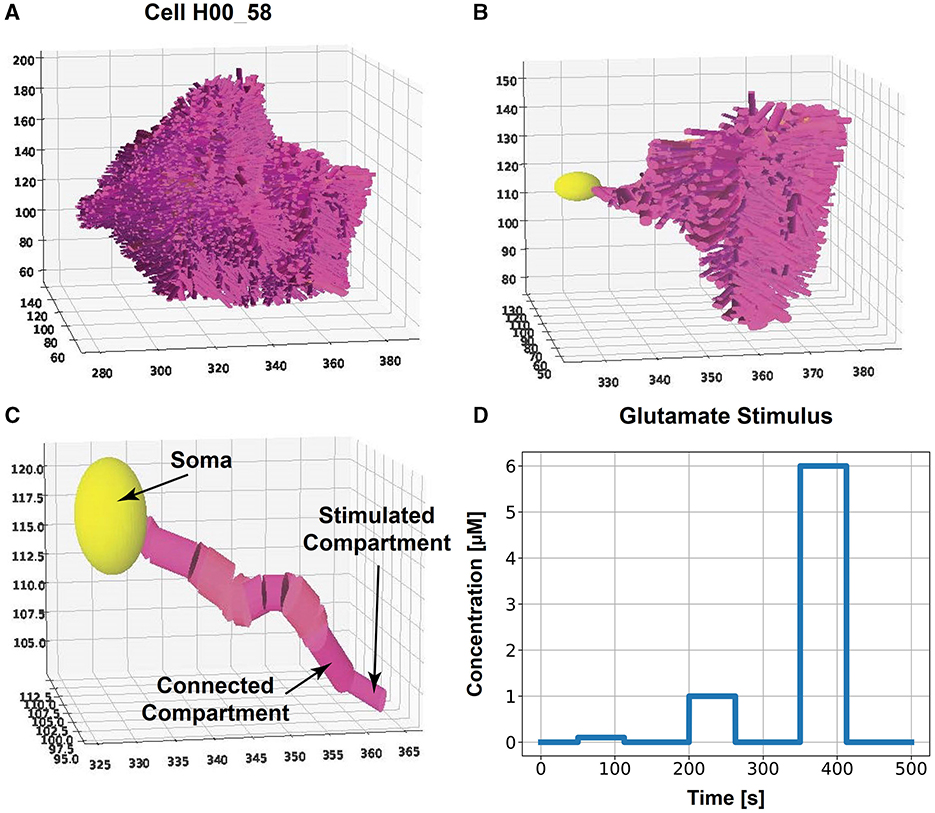
Figure 1. Compartmentalized astrocyte morphology model. The cell morphology, captured by a microscope image, is reconstructed by cylindrical consecutive compartments and a sphere for the soma. We stimulate the outermost compartment of a primary branch with glutamate and investigate the Ca2+ dynamics in one cell branch (primary branch with all subbranches) for all classes. (A) Example of a complete reconstructed astrocyte from class #3 and (B) the selected primary branch with side branches. (C) Selected primary branch [same as in (B)] with an indication of the stimulated compartment, connected compartment, and soma. The spatial scales in (A–C) is μm. (D) Glutamate stimulus with concentrations of 0.1, 1, and 6 μM for 62.5 s each over a total simulation time of 500 s.
Naturally, the sample cubes include cropped astrocytes at the cube border region. We removed those cut cells with a threshold region of 2 μm from the cube boundaries. Every cell with more than 20 branching points inside the region was rejected.
Then, 21 features, described in detail below and in Supplementary Section 1.2, were calculated from the remaining 866 cells. The features can be divided into four types: (1) being directly collected from the data, (2) from the minimum volume encapsulating ellipsoid (MVEE) calculation, (3) from the Sholl-like analysis, and (4) from the primary branches of the cell.
First, the number of branching points (when a branch divides into subbranches) and the number of terminal points of cell branches were directly taken from the datasets as features. Also, the cell radius was calculated using an iterative fitting algorithm based on the terminal points of the branches and a percentile threshold of 70%.
Second, for the calculation of the MVEE, the algorithm by Bowman and Heath (2023) was used, and the following eight features were derived: Volume of the ellipsoid that approximates the actual volume the astrocyte covers. Roundness and sphericity are measures for the cell morphology (Matías and Vallespí, 2014). Aspect ratio is the ratio between the largest and smallest ellipsoid axis comparable to the aspect ratio described by Baldwin et al. (2023) but considers a third dimension. The angles between the main axis are turned into features, denoted as alpha, beta, and gamma. Lastly, the feature called main axis is the length of the main axis of the ellipsoid.
Third, in the Sholl-like analysis (Sholl, 1953), we segmented the 3D cell area into shells with a distance of five μm between each shell. Then, we calculated the number of branching points as a function of the radial distance from the soma center. The resulting curves are highly comparable to the original Sholl analysis (Sholl, 1953; Baldwin et al., 2023). From the Sholl-like analysis, we obtained the following four features (Baldwin et al., 2023): the process maximum denotes the maximum number of branching points in a shell; the critical value is the distance between the soma and the shell with the process maximum; the primary branches feature is the number of branches that start from the soma and, therefore, have a depth of one in the IMARIS dataset; the maximum radius is the maximum width of the shells to cover all terminal points of a cell.
Fourth, another important morphological feature is the characterization of the primary branches of a cell stemming directly from the soma. We calculated the mean, maximum, and standard deviation of the diameter of the primary branches at the branching point. The primary angles are the average of angles between the different primary branches. The mean, standard deviation, and maximum of the branch length are calculated using the branching points of each branch as start and endpoints. The maximum and mean number of branching points from the primary branches are calculated for each cell. The vector of 21 features is normalized using the MinMaxScaler function (from Python's scikit-learn).
2.2 Classification of the astrocyte morphologies
All cells with at least 100 branching points were selected for classification, reducing the dataset from 866 to 741. Two approaches for outlier detection are applied: Extreme Gradient Boosting (XGBoost) and anomaly detection with an Auto-Encoder (AE). Only features directly derived from the dataset without further calculation, i.e., branching points, terminal endpoints, maximum and mean diameter, were used.
XGBoost is an algorithm that combines the output of different outlier detection methods (Zhao and Hryniewicki, 2019). The framework performs different outlier detection methods, undergoes a selection step to choose the useful ones, and finally stacks the labels together and trains the classifier. We tried various available methods and selected Isolation Forest, Local Outlier Factor, and Elliptic Envelope. The implementation was done with functions provided by Python's scikit-learn bibliography.
The Auto-Encoder (AE) is a neural network with a bottleneck that forces compressed information (Chen et al., 2018; Hinton and Salakhutdinov, 2006) and is trained to reconstruct the input. Due to the bottleneck, only the prominent features are learned, and the network is expected to perform badly in reconstructing outliers, data points that deviate greatly from the majority. After the network finishes training, it is used to predict the training data again, which means inputting it and expecting it as the output. Loss was calculated to evaluate the performance of the network on each data point. Data points with a high loss were labeled as anomalies. The threshold of labeling a data point as an anomaly is set to the mean plus the standard deviation of the total loss. Outliers detected by both methods were removed, and 710 samples remained for further classification.
Two mathematical methods were used to find the optimal number of classes. The knee locator describes the maximum curvature of the explained variance as a function of the number of classes and is implemented in Python's kneed module. The dendrogram shows the Euclidian distance between joined clusters. The obtained number of classes from those two mathematical methods was used to classify with the following clustering algorithms implemented in Python's sklearn: k-means, Gaussian Mixture, and Agglomerative Clustering. Their classification results were compared with confusion matrices, showing how many different data points were put in the same class by those methods. We used three different methods to demonstrate the independence from the classification method. For the simulations, we used the class labels derived from k-means. K-means seemed to have the best overlap with the other two methods and was used for labeling the cells.
2.3 Statistical analysis of the morphological features
To investigate whether there are significant differences in the individual features between classes, we applied the non-parametric Kruskal-Wallis test for statistical differences in the medians between classes (in Python's sciPy package). For the post-hoc tests to determine which classes differ, we used Dunn's test from the scikit-posthocs library, applying the Dunn—Šidák correction for p-value adjustment.
2.4 Cell selection for simulations
For the simulations of Ca2+ dynamics in astrocytes (see next section), cell morphologies from each class and dataset were selected. For the cell morphology, we created a compartmentalized model made out of cylinders. Therefore, the x, y, and z coordinates of two consecutive points in one branch of the IMARIS dataset with their corresponding mean diameter were used to construct a cylinder. A sphere with the same diameter as the branch with the largest diameter was used to approximate the cell's soma. Due to the high computational cost, we selected not the whole astrocyte but a primary branch with 15 and 25 compartments to make the simulation results comparable between cells (Figures 1B, C). A primary branch is defined as consecutive compartments starting from the soma. At branching points, the primary branch continued along the branch with the largest diameter. We included all subbranches of that chosen primary branch (Figure 1C). The outermost compartment was stimulated (see next section).
2.5 Simulations of the astrocytic calcium dynamics
For simulating the intra- and extracellular ion and messenger signals, we used the computational model introduced by Oschmann et al. (2017), which includes two pathways for intracellular Ca2+ signals in astrocytes: (1) the Ca2+ release from the internal Ca2+ stores in the ER and (2) Ca2+ entering through the plasma membrane. An extracellular glutamate stimulus activates both pathways. The activity of these two pathways is highly dependent on the distance from the soma, as the surface-to-volume ratio increases as the branches become thinner, which occurs with higher distance. Thus, the volume ratio of internal Ca2+ stores to the intracellular space decreases. Ca2+ buffering is lumped together with the intracellular Ca2+ concentration (Oschmann et al., 2017; De Pittà et al., 2009).
We applied the following two modifications to the model. Firstly, the current fluxes between cytosol and ER were removed, and we only consider charge fluxes between intra- and extracellular space when computing membrane voltage V over time (Farr and David, 2011; Witthoft and Em Karniadakis, 2012):
The membrane capacitance is denoted as Cm and the currents of the NCX, EAAT1/2, and NKA as INCX, IGluT, and INKA, respectively. The leak currents of Na+ and K+ are defined as INaleak IKleak, respectively. Secondly, the valence of Ca2+, which is two, was taken into account for calculating the intracellular Ca2+ concentration, (Luo and Rudy, 1994):
The area of the outer cell membrane is denoted by A, the Faraday constant by F, the volume by Vol, and the area of the internal Ca2+ store by . The currents of the IP3R, SERCA pump and Ca2+ leak from the ER are defined as IIP3R, ISerca, and ICERleak, respectively.
The model by Oschmann et al. (2017) was designed as a single-compartment model without diffusion along the branch. We used the multi-compartment approach suggested by Gordleeva et al. (2019). The connections between compartments can be set with a connection matrix with values of either 0 for no connection or 1 for a set connection. The diffusion of the ions and IP3 between compartments in the three areas ER, cytosol, and extracellular space was integrated based on Kang and Othmer (2009) (see Table 1 for the diffusion coefficients).

Table 1. Diffusion coefficients for cytosol, endoplasmic reticulum (ER), and extracellular space (ECS) used in the multi-compartment model.
A neuronal glutamate stimulus with concentrations of 0.1, 1, and 6 μM (as described in De Pittà et al., 2009 and Oschmann et al., 2017) was applied to the tip of the selected primary branch (Figures 1C, D). The stimulus was applied for 62.5 s, respectively, and the total simulation time was 500 s. We used the same rectangular stimulus described in De Pittà et al. (2009) to allow comparability. We used an implicit Runge-Kutta method (Hairer and Wanner, 1996) as a numerical integration method for the non-linear differential equations with a time step dt = 1ms.
2.6 Ion dynamic analysis
To evaluate the physiological function, we extracted features measuring the Ca2+ signal transmission from the stimulated compartment to the connected compartment and to the soma, respectively. We did this for each of the six classes and the three stimulation intensities (0.1, 1, and 6 μM glutamate) separately. Firstly, we calculated the changes in the peak width when the Ca2+ signal diffused from the stimulated compartment to the connected compartment using the findpeak function in MATLAB. Also, the change of peak prominence, also obtained by the findpeak function, was evaluated. Furthermore, we investigated the change in mean peak amplitude between the three selected compartments. Secondly, we calculated the differences between the maximum signal amplitude between the three compartments. We applied again the non-parametric Kruskal-Wallis with the Dunn-Šidák correction to test for statistical differences.
Additionally, we analyzed the influence of the morphology categorized into the six different classes using a three-way ANOVA (analysis of variance) with the three factors – stimulus intensity, class, and compartment. Therefore, we calculated the number of peaks using the findpeak function with the constrain of a minimum peak prominence of 30% of the maximum Ca2+ concentration in the respective compartment and a maximum peak width of 15 s. For the simulated intracellular Na+ concentrations, we calculated the maxima for each stimulus intensity, class, and compartment. For the intracellular K+ concentrations, we calculated the respective minima.
3 Results
3.1 Feature extraction and classification reveals differences in CA1 astrocyte morphology
We calculated 21 features to describe the morphology of the 866 cells. Their histograms are displayed in Supplementary Figure S2, of which six are selected for (Figure 2A). Most cells have high counts for small volume, number of terminal points, number of branching points, and process maximum. Thus, we applied the outlier detection (see Section 2.2) before the classification. Besides that, most of the cells had a volume around 0.4 μm3, around 3,400 terminal points, around 250 branching points, and a process maximum around 80. The critical value had the highest count of cells at 36 μm and the maximum radius at 64 μm. The Sholl-like analysis provided a mean process maximum of 500, a mean number of primary branches of 5 μm, a mean critical value of 30 μm, and a mean maximum radius of around 70 μm (Figure 2B).
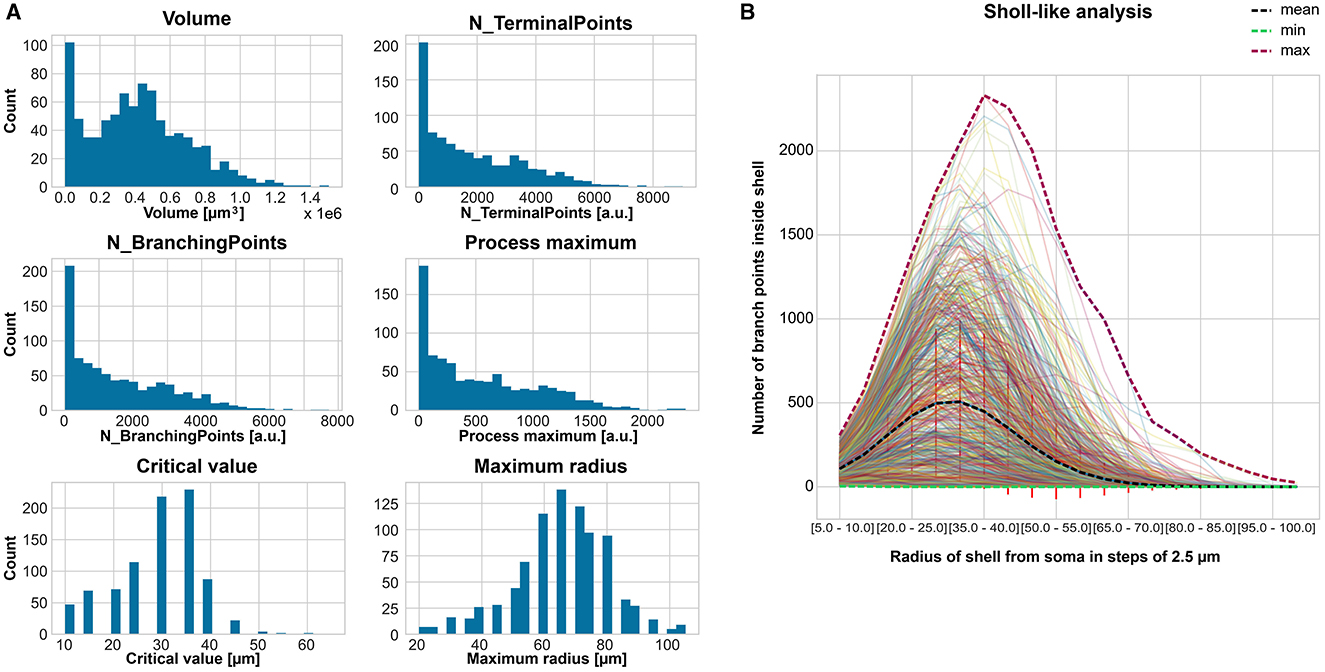
Figure 2. Feature extraction to describe the astrocyte morphology for the classification. (A) Count histogram of six representative out of 21 features for all 866 cells. (B) Sholl-like analysis of all cells indicating the minimum, mean, and maximum of the number of branch points per shell.
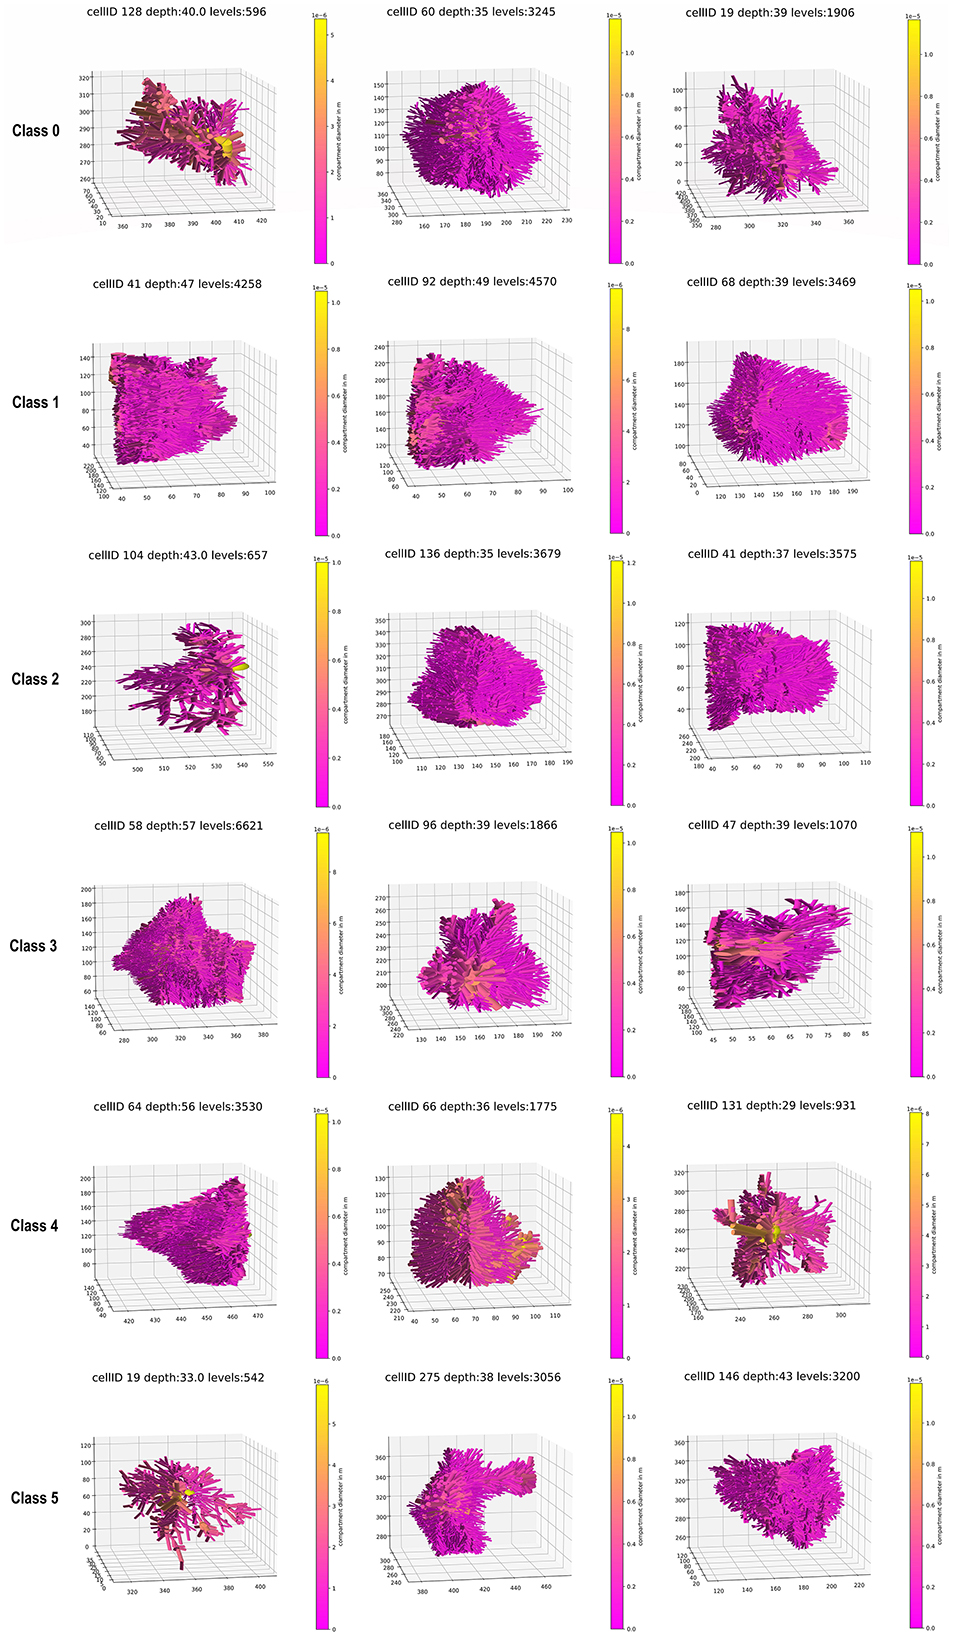
To define the number of classes for the classification, the knee locator divided the dataset into six different classes (Figure 3A). This was coherent with the dendrogram, which showed a clear increase of the Euclidian distance between joined clusters when going from 6 to 5 classes (Figure 3B). The high numbers on the diagonals of the confusion matrices when comparing the classification results by k-means, Gaussian Mixture model, and Agglomerative Clustering indicated that the majority of the cells were classified with the same label (Figure 4A). The labels derived from k-means were used for the final classification. Figure 4B displays the labeled data points by k-means plotted as t-distributed Stochastic Neighbor Embedding (t-SNE). Figure 5 shows three example cells from each of the six classes. We confirm that the obtained classes do not cluster according to the initial datasets (Table 2).
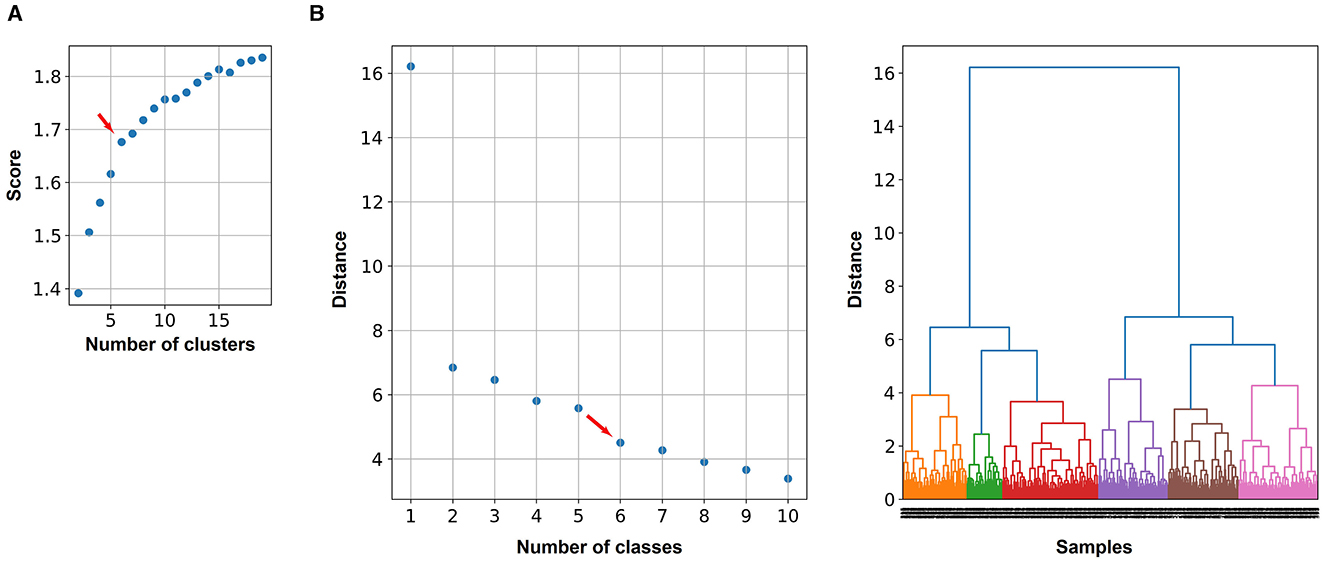
Figure 3. Two methods were used to determine the optimal number of classes to distinguish astrocyte morphologies: the knee locator and the Euclidean distance between joined clusters. (A) Explained variance that is used to find the knee (maximum curvature) indicated by the red arrow. The knee locator is based on k-means clustering, whereby for each number of classes, the score (explained variance) is calculated. (B) The dendrogram shows how much the Euclidian distance (on the y-axis) increases by joining two classes. This is based on the hierarchical clustering. The red arrow indicates a clear decline in the distance between classes 5 and 6.
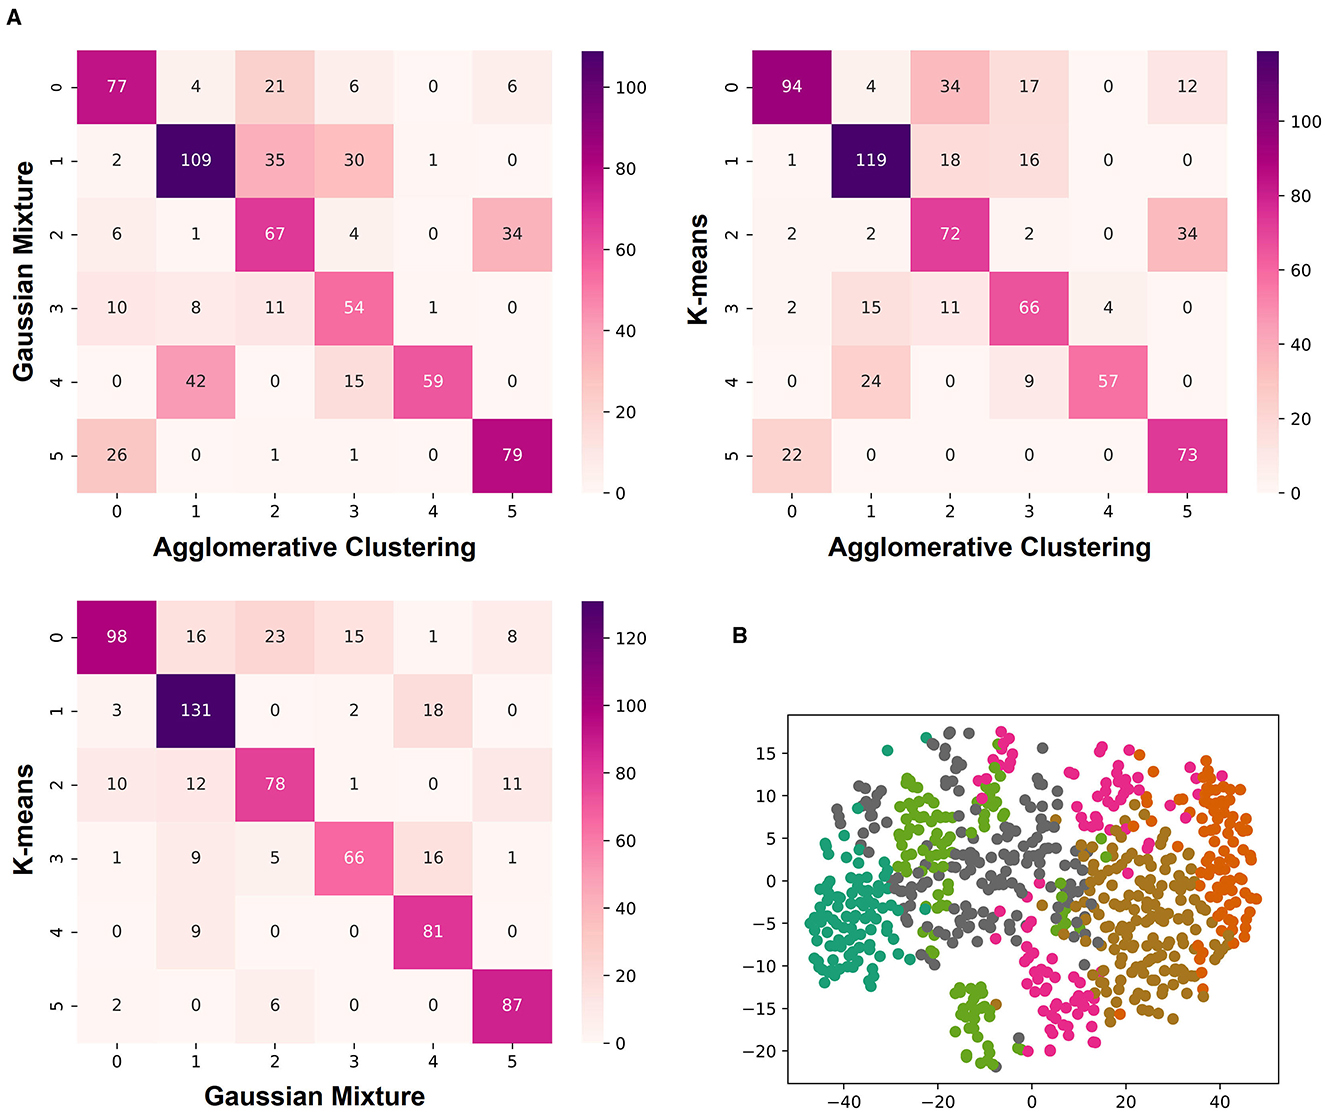
Figure 4. Three different algorithms clustered the morphological features of mouse CA1 astrocytes into six classes. (A) Confusion matrices comparing the labeled classes of the Gaussian Mixture model, k-means, and Agglomerative Clustering. There is a row x and a column y for each label. The number in the matrix gives the number of labels identified as class x by algorithm A as class y by algorithm B, with x,y = 0, 1, 2, 3, 4, 5. (B) Labeled data points by k-means as a t-SNE plot.
We tested all features for differences between classes using the Kruskal-Wallis test with a p-value < 0.05 (Figure 6); the exact p-values are stated in Supplementary Table S3. The violin plots indicate that all features besides feature Primary Angles have significant differences between most of the classes.
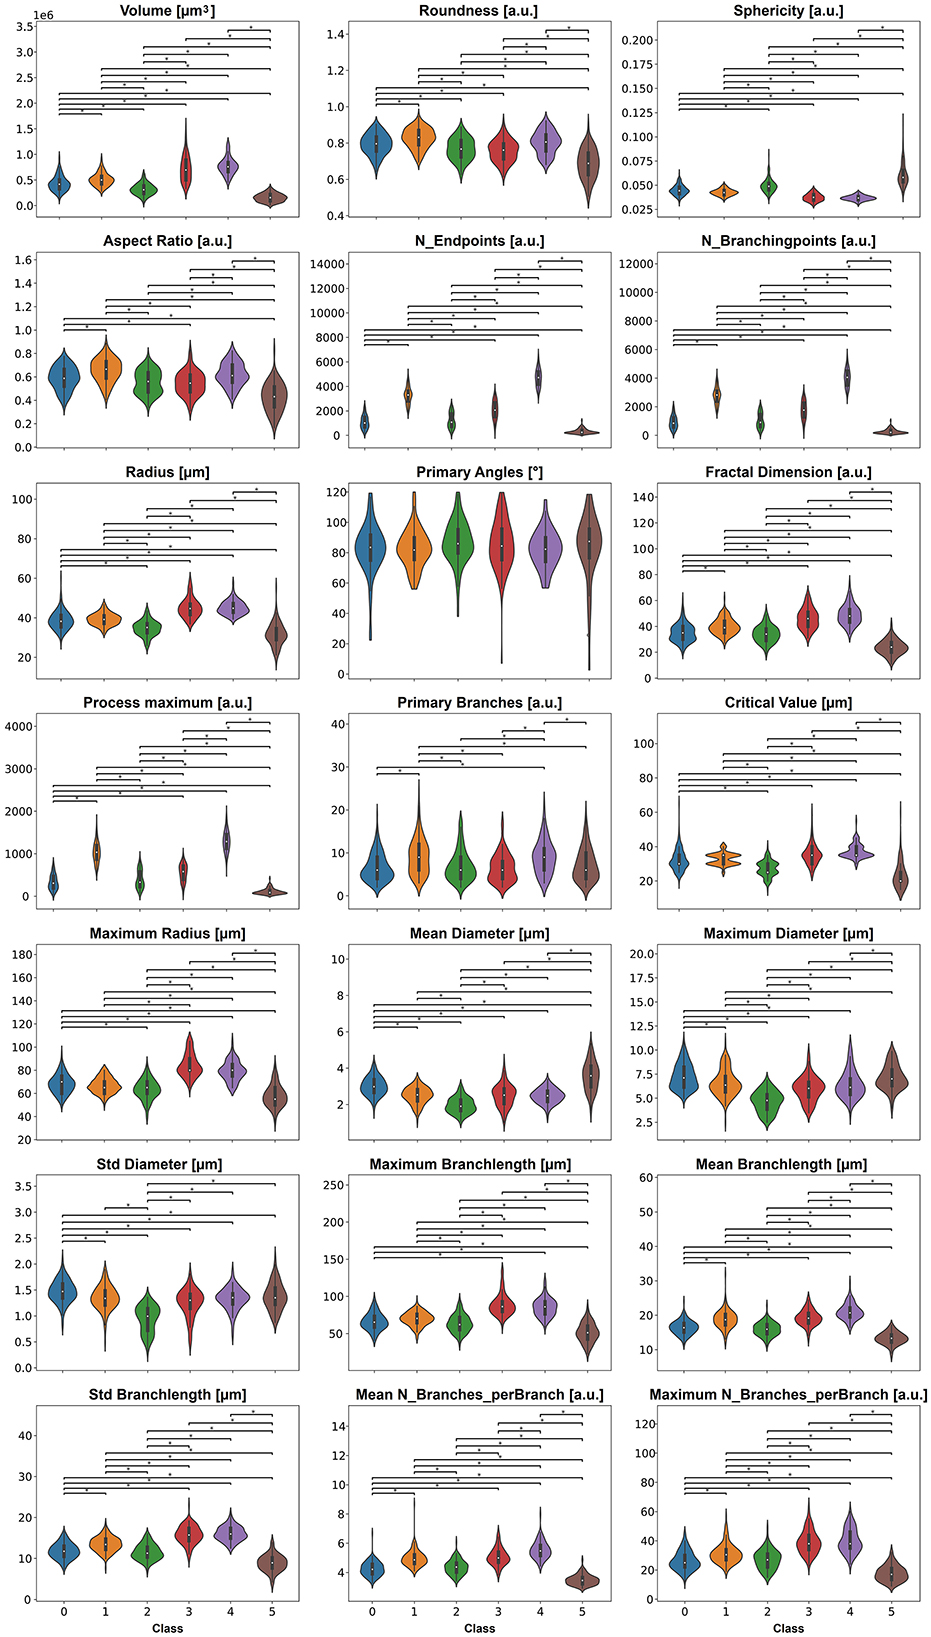
Figure 6. The 21 features, except primary angles, display significant differences between the six classes. P-values smaller than 0.05 are indicated with a star.
3.2 Calcium signal partially depends on morphology
Figure 7A displays the intracellular Ca2+ concentration over time for the six classes and the three different compartments. As expected, we observed an increase of the Ca2+ concentration with stimulus intensity and a decrease from the stimulated compartment toward the some. Oscillations occurred mainly in the stimulated and the connected compartment. As for most cells, there is no proper oscillation visible in the soma, we compared the change in peak width over groups only from the stimulated compartment to the connected compartment (Figure 7B). A significant difference was found between classes 0 and 2. The comparison of the change in mean peak prominence from the stimulated compartment to the connected compartment indicated significant results for classes 0 and 1 (Figure 7B). Significant differences between classes 0 and 1 were also detected for the change of the mean peak amplitude from the stimulated compartment and the connected compartment (Figure 7B). The three-way ANOVA with the three factors—stimulus intensity, class, and compartment—revealed pairwise differences between classes 0 and 1, 0 and 2, 0 and 4, 0 and 5, and 1 and 3 (p < 0.05) for the connected compartment and stimulus intensity of 0.1 μM.
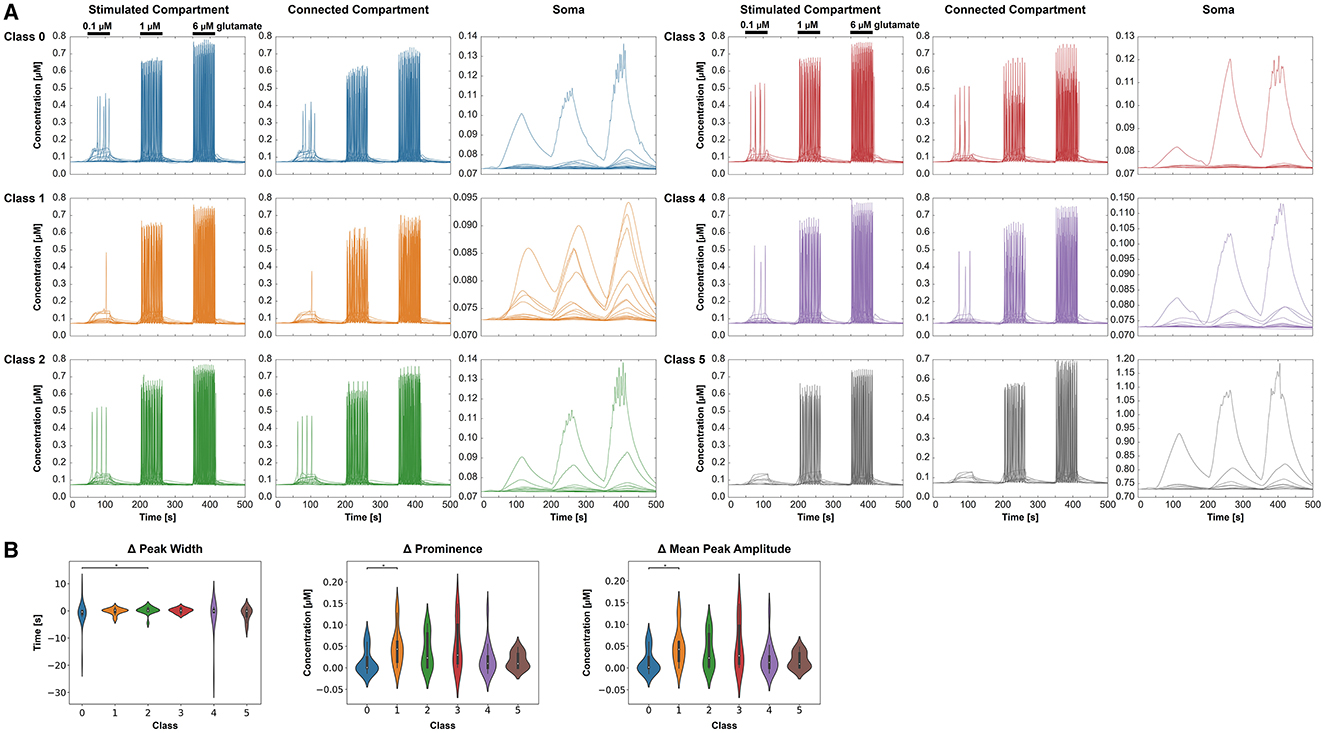
Figure 7. Intracellular Ca2+ behavior in the three selected compartments for each class (0–5), respectively. (A) Ca2+ concentrations over time for the different classes and compartments. For clear visibility of the Ca2+ signals, the y-axis may change for each condition. The stimulation periods have been indicated above the signals in the stimulated compartment. (B) Comparing the extracted features—change in the mean peak width, change in the peak prominence, and change in mean peak amplitude—from the Ca2+ dynamics for the six classes. All three features are based on a signal change from the stimulated to the connected compartment.
3.3 Potassium and sodium dynamics showed no differences between classes
With increasing glutamate stimulus, the intracellular K+ concentration was reduced (Figure 8A). The lowest concentrations were measured in the stimulated compartment. The Na+ concentration decreased in the soma with increasing stimulus, whereas it increased in the other two compartments (Figure 9A). The Kruskal-Wallis test showed no significant differences between the classes (Figures 8B, 9B).
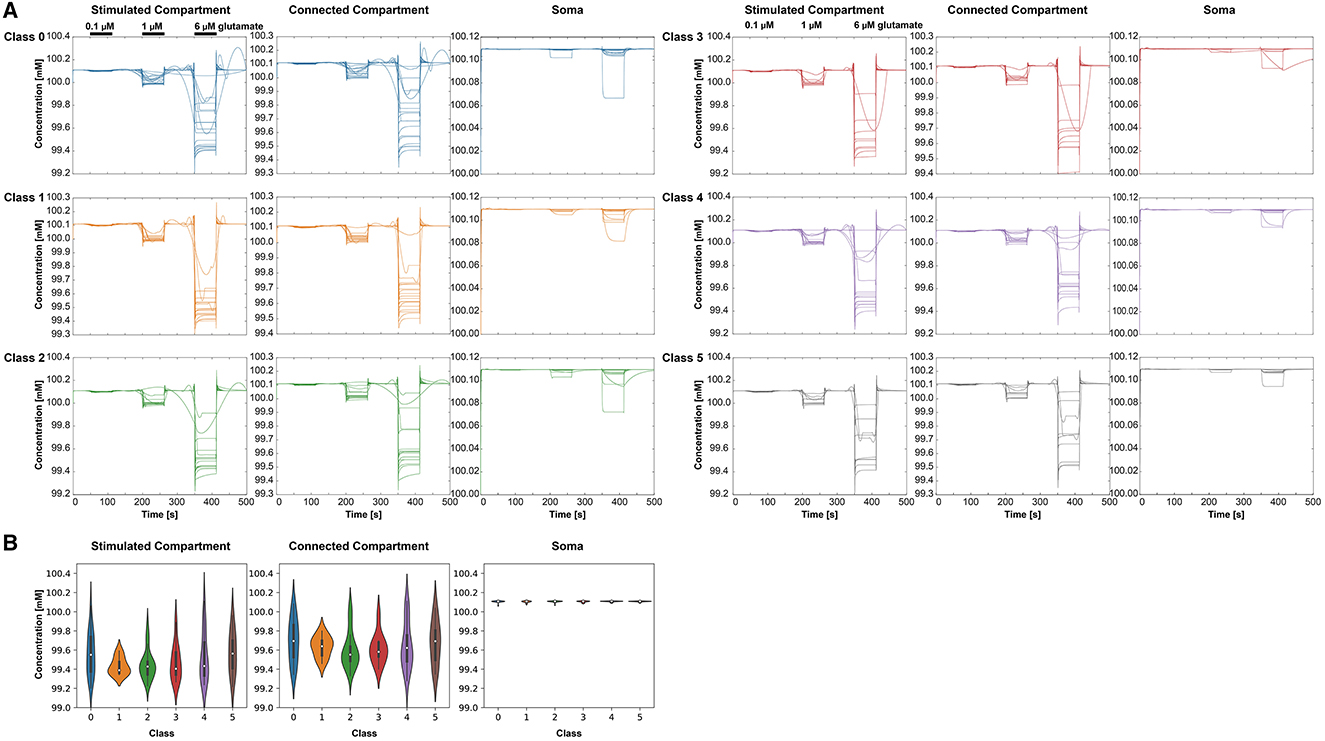
Figure 8. Intracellular K+ behavior in the three selected compartments for each class (0–5), respectively. (A) K+ concentrations over time for the different classes and compartments. For clear visibility of the K+ signals, the y-axis may change for each condition. The stimulation periods have been indicated above the signals in the stimulated compartment. (B) Violin plots showing the minima of the K+ amplitudes at 6 μM stimulus for the different classes and the three compartments—stimulated compartment, connected compartment, and soma.
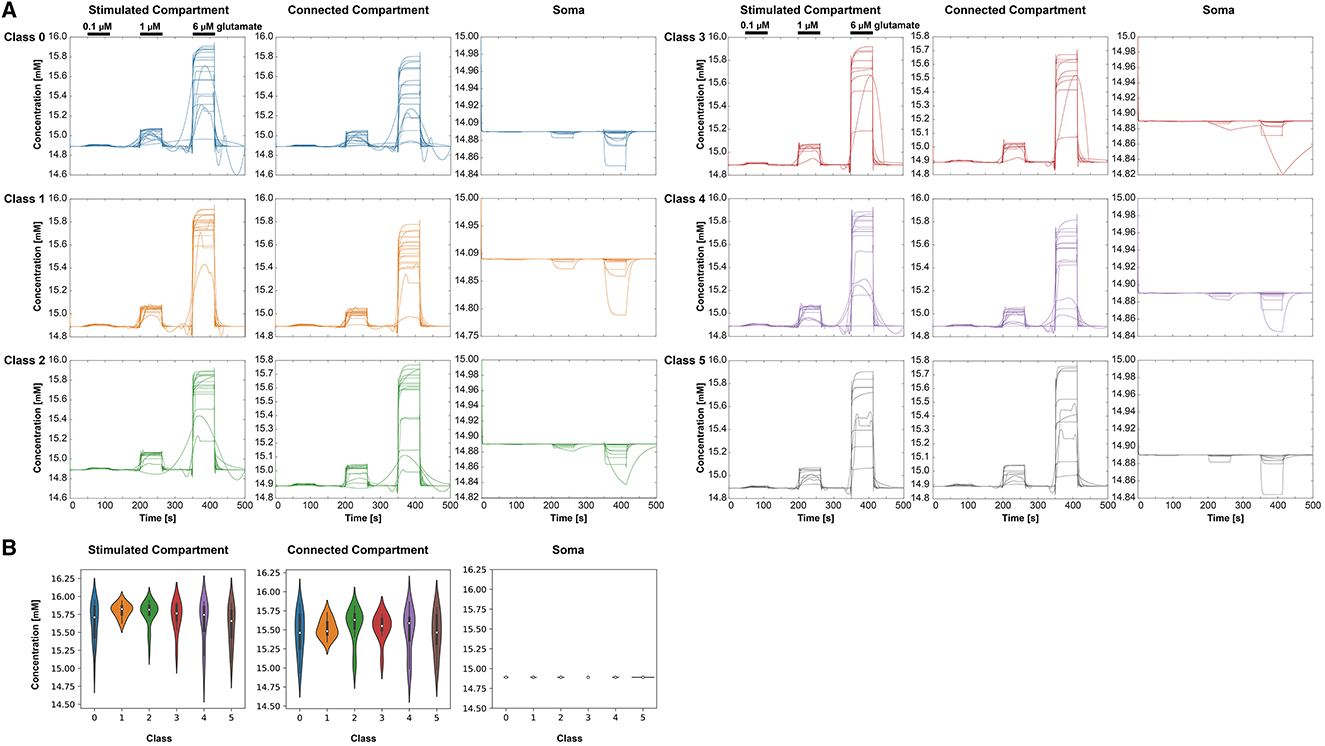
Figure 9. Intracellular Na+ behavior in the three selected compartments for each class (0–5), respectively. (A) Na+ concentrations over time for the different classes and compartments. For clear visibility of the Na+ signals, the y-axis may change for each condition. The stimulation periods have been indicated above the signals in the stimulated compartment. (B) Violin plots showing the minima of the Na+ amplitudes at 6 μM stimulus for the different classes and the three compartments—stimulated compartment, connected compartment, and soma.
4 Discussion
Our research explores the relationship between astrocyte morphology and function, specifically focusing on how structural differences influence ion dynamics. Astrocytes exhibit significant morphological heterogeneity across species and brain regions (Zhou et al., 2019; Baldwin et al., 2023; Torres-Ceja and Olsen, 2022).
GFAP is expressed in astrocytes, and antibodies against GFAP are a standard marker for immunolabeling the astrocyte's intermediate filament. In Refaeli et al. (2021), all astrocytes were tagged and marked using the GFAP promoter through viral infection. Consequently, it is likely that these astrocytes were in a certain state of activation due to both GFAP gene expression and the viral injection into the brain. However, this cannot be proven, as in the hippocampus (unlike the cortex), most astrocytes express GFAP even without being activated (Chai et al., 2017).
Cells can be categorized based on molecular (Karpf et al., 2022) and morphological characteristics (Lanjakornsiripan et al., 2018; Viana et al., 2023). For example, Viana et al. (2023) found structural heterogeneity in the hippocampus subregions CA1 and dentate gyrus by testing for statistical differences in morphological features like total process length, number of processes, Sholl analysis, and last intersection radius. Most of the calculated geometrical features that we used for the classification have been used in other studies as well (Baldwin et al., 2023; Herde et al., 2020; Savtchenko et al., 2018; Viana et al., 2023). Our classification revealed six classes of astrocytes within the CA1 region. Determining the number of classes is quite challenging since there is no ground truth. Thus, to provide a solid ground, we trained three different clustering algorithms, aiming to obtain similar classification results. K-means, Gaussian mixture model, and Hierarchical clustering yielded an overall coherent classification.
The cylindrical compartments, reconstructed from the microscope images, allow the use of their surface and volume data for the differential equations of our model. So far, only the ASTRO model by Savtchenko et al. (2018) comes with such a high detailedness of the 3D geometry as we have it in our computational model.
Fine astrocytic processes are responsible for the majority of astrocytic Ca2+ signals (Bindocci et al., 2017). Morphological variations may have functional implications (Molotkov et al., 2013; Grolla et al., 2013). Astrocytic Ca2+ signaling, a primary mode of communication, involves complex mechanisms, including glutamate-triggered intracellular Ca2+ (Semyanov et al., 2020). While computational models have been developed to study astrocyte function at various scales (Lenk et al., 2024; Manninen et al., 2018), a systematic investigation of the relationship between morphology and ion dynamics is lacking. We created a computational model, based on the work of Oschmann et al. (2017) and Gordleeva et al. (2019), including 3D morphology and intra- and extracellular diffusion. Our multi-compartment model is derived from confocal microscope images of the CA1 region (Refaeli et al., 2021). This model enables analyzing mechanisms of Ca2+ release from the internal Ca2+ stores in the ER and Ca2+ entering through the plasma membrane, both depending directly or indirectly on extracellular glutamate released by neurons.
The simulated Ca2+ dynamics (Figure 7) vary across the three conditions: the class based on morphological features, stimulus intensity, and compartment type. While stimulated and connected compartments indicate similar signals, the respective signals in the soma do not display clear oscillations for most cells. The glutamate stimulus of 1 and 6 μM leads to oscillatory behavior as also demonstrated by De Pittà et al. (2009), while the 0.1 μM glutamate stimulus only induces in some classes a few Ca2+ peaks. Astrocytes in class 5 exhibit, for example, a smaller volume and fractal dimension, resulting in a lack of Ca2+ peaks with a low glutamate stimulus. However, astrocytes in class 1 with a high roundness value, high process maximum, and a high mean number of branches can exhibit a small number of Ca2+ peaks with a low glutamate stimulus.
Zur Nieden and Deitmer (2006) studied Ca2+ dynamics in hippocampal rat astrocytes and obtained similar results with a 10 μM glutamate stimulus as we did when stimulating our model with 6 μM glutamate. They report that the stimulus only elicited oscillations in 63% of the astrocytes, which might be an indication of heterogeneity. Similar to our simulations, Nett et al. (2002) measured the Ca2+ oscillations and their diffusion across four primary processes of a mouse hippocampal astrocyte.
The results for Na+ are comparable with Rose and Karus (2013). The authors obtained comparable Na+ concentrations of around 13 and 18 mM when stimulating with 1 and 10 μM glutamate, respectively. We observed no significant differences in K+ and Na+ ion dynamics between the six classes, unlike with Ca2+. This may result from the fact that the Ca2+ dynamics in the model are partly dependent on the intracellular stores in the ER and the IP3R channels, whose role in the dynamics is highly dependent on the local branch morphology. K+ and Na+ dynamics, on the other hand, only depend on the current through the plasma membrane. As for the diffusion, it is modeled similarly between the ion species and, therefore, does not lead to differences between their dynamics.
Using the cell information such as position and shape can be used in the future to reconstruct and simulate a whole cube with connected astrocytes (Refaeli et al., 2021; Ma et al., 2016). As a starting point, the work by Verisokin et al. (2021) could be used in which the authors constructed a 2D spatial astrocyte network to model Ca2+ signals in a multicellular construction. Furthermore, studying the influence of ion dynamics on the astrocyte morphology (Denizot et al., 2019), which we did not consider here, is an interesting aspect for future work. Overall, astrocytes are glial cells that play an important role in brain activity. Combining imaging and computational modeling techniques can help obtain more information on astrocyte morphological and functional complexity.
Data availability statement
The datasets presented in this study can be found in online repositories. The names of the repository/repositories and accession number(s) can be found below: https://github.com/kerstinlenk/AstrocyteHeterogeneity.
Author contributions
AF: Data curation, Formal analysis, Investigation, Methodology, Software, Validation, Visualization, Writing – original draft, Writing – review & editing. AM: Formal analysis, Investigation, Methodology, Software, Validation, Writing – original draft, Writing – review & editing. PW: Methodology, Software, Writing – review & editing. RW: Methodology, Software, Writing – review & editing. AT: Methodology, Software, Writing – review & editing. RR: Writing – review & editing. KL: Conceptualization, Data curation, Formal analysis, Investigation, Methodology, Resources, Software, Supervision, Validation, Visualization, Writing – original draft, Writing – review & editing.
Funding
The author(s) declare financial support was received for the research, authorship, and/or publication of this article. This work was supported by TU Graz Open Access Publishing Fund.
Acknowledgments
We kindly thank Andreea Ioana Sburlea and Matias Valdenegro Toro at the University of Groningen and Barbara Priwitzer at Reutlingen University for the insightful discussions on the classifications. Furthermore, the authors would like to thank Lea Fritchi for providing support and ideas for the whole manuscript.
Conflict of interest
The authors declare that the research was conducted in the absence of any commercial or financial relationships that could be construed as a potential conflict of interest.
The author(s) declared that they were an editorial board member of Frontiers, at the time of submission. This had no impact on the peer review process and the final decision.
Publisher's note
All claims expressed in this article are solely those of the authors and do not necessarily represent those of their affiliated organizations, or those of the publisher, the editors and the reviewers. Any product that may be evaluated in this article, or claim that may be made by its manufacturer, is not guaranteed or endorsed by the publisher.
Supplementary material
The Supplementary Material for this article can be found online at: https://www.frontiersin.org/articles/10.3389/fncel.2024.1474948/full#supplementary-material
References
Araque, A., Carmignoto, G., Haydon, P., Oliet, S., Robitaille, R., and Volterra, A. (2014). Gliotransmitters travel in time and space. Neuron 81, 728–739. doi: 10.1016/j.neuron.2014.02.007
Araque, A., Parpura, V., Sanzgiri, R. P., and Haydon, P. G. (1999). Tripartite synapses: glia, the unacknowledged partner. Trends Neurosci. 22, 208–215. doi: 10.1016/S0166-2236(98)01349-6
Augusto-Oliveira, M., Arrifano, G. P., Takeda, P. Y., Lopes-Araujo, A., Santos-Sacramento, L., Anthony, D. C., et al. (2020). Astroglia-specific contributions to the regulation of synapses, cognition and behaviour. Neurosci. Biobehav. Rev. 118, 331–357. doi: 10.1016/j.neubiorev.2020.07.039
Baldwin, K. T., Murai, K. K., and Khakh, B. S. (2023). Astrocyte morphology. Trends Cell Biol. 34, 547–565. doi: 10.1016/j.tcb.2023.09.006
Batiuk, M. Y., Martirosyan, A., Wahis, J., de Vin, F., Marneffe, C., Kusserow, C., et al. (2020). Identification of region-specific astrocyte subtypes at single cell resolution. Nat. Commun. 11:1220. doi: 10.1038/s41467-019-14198-8
Bindocci, E., Savtchouk, I., Liaudet, N., Becker, D., Carriero, G., and Volterra, A. (2017). Three-dimensional Ca 2+ imaging advances understanding of astrocyte biology. Science 356:eaai8185. doi: 10.1126/science.aai8185
Bowman, N., and Heath, M. T. (2023). Computing minimum-volume enclosing ellipsoids. Math. Programm. Comp. 15, 621–650. doi: 10.1007/s12532-023-00242-8
Chai, H., Diaz-Castro, B., Shigetomi, E., Monte, E., Octeau, J. C., Yu, X., et al. (2017). Neural circuit-specialized astrocytes: transcriptomic, proteomic, morphological, and functional evidence. Neuron 95, 531–549.e9. doi: 10.1016/j.neuron.2017.06.029
Chen, Z., Yeo, C. K., Lee, B. S., and Lau, C. T. (2018). “Autoencoder-based network anomaly detection,” in 2018 Wireless Telecommunications Symposium (WTS) (IEEE), 1–5. doi: 10.1109/WTS201842513.2018
De Pittà, M., Goldberg, M., Volman, V., Berry, H., and Ben-Jacob, E. (2009). Glutamate regulation of calcium and IP3 oscillating and pulsating dynamics in astrocytes. J. Biol. Phys. 35, 383–411. doi: 10.1007/s10867-009-9155-y
Denizot, A., Arizono, M., Nägerl, U. V., Soula, H., and Berry, H. (2019). Simulation of calcium signaling in fine astrocytic processes: effect of spatial properties on spontaneous activity. PLoS Comput. Biol. 15, 1–33. doi: 10.1371/journal.pcbi.1006795
Di Castro, M. A., Chuquet, J., Liaudet, N., Bhaukaurally, K., Santello, M., Bouvier, D., et al. (2011). Local ca2+ detection and modulation of synaptic release by astrocytes. Nat. Neurosci. 14, 1276–1284. doi: 10.1038/nn.2929
Farr, H., and David, T. (2011). Models of neurovascular coupling via potassium and eet signalling. J. Theor. Biol. 286, 13–23. doi: 10.1016/j.jtbi.2011.07.006
Gordleeva, S. Y., Ermolaeva, A. V., Kastalskiy, I. A., and Kazantsev, V. B. (2019). Astrocyte as spatiotemporal integrating detector of neuronal activity. Front. Physiol. 10:294. doi: 10.3389/fphys.2019.00294
Grolla, A., Sim, J., Lim, D., Rodriguez, J., Genazzani, A., and Verkhratsky, A. (2013). Amyloid-β and Alzheimer's disease type pathology differentially affects the calcium signalling toolkit in astrocytes from different brain regions. Cell Death Dis. 4, e623–e623. doi: 10.1038/cddis.2013.145
Hairer, E., and Wanner, G. (1996). Solving Ordinary Differential Equations II. Stiff and Differential-Algebraic Problems. Berlin; New York: Springer-Verlag, 14.
Haydon, P. G., and Carmignoto, G. (2006). Astrocyte control of synaptic transmission and neurovascular coupling. Physiol. Rev. 86, 1009–1031. doi: 10.1152/physrev.00049.2005
Herde, M. K., Bohmbach, K., Domingos, C., Vana, N., Komorowska-Müller, J. A., Passlick, S., et al. (2020). Local efficacy of glutamate uptake decreases with synapse size. Cell Rep. 32:108182. doi: 10.1016/j.celrep.2020.108182
Hinton, G. E., and Salakhutdinov, R. R. (2006). Reducing the dimensionality of data with neural networks. Science 313, 504–507. doi: 10.1126/science.1127647
Holt, M. G. (2023). Astrocyte heterogeneity and interactions with local neural circuits. Essays Biochem. 67, 93–106. doi: 10.1042/EBC20220136
Kang, M., and Othmer, H. G. (2009). Spatiotemporal characteristics of calcium dynamics in astrocytes. Chaos 19:037116. doi: 10.1063/1.3206698
Karpf, J., Unichenko, P., Chalmers, N., Beyer, F., Wittmann, M.-T., Schneider, J., et al. (2022). Dentate gyrus astrocytes exhibit layer-specific molecular, morphological and physiological features. Nat. Neurosci. 25, 1626–1638. doi: 10.1038/s41593-022-01192-5
Khakh, B. S., and Deneen, B. (2019). The emerging nature of astrocyte diversity. Annu. Rev. Neurosci. 42, 187–207. doi: 10.1146/annurev-neuro-070918-050443
Kirischuk, S., Kettenmann, H., and Verkhratsky, A. (1997). Na+/ca2+ exchanger modulates kainate-triggered ca2+ signaling in bergmann glial cells in situ. FASEB J. 11, 566–572. doi: 10.1096/fasebj.11.7.9212080
Kruyer, A. (2022). Astrocyte heterogeneity in regulation of synaptic activity. Cells 11:3135. doi: 10.3390/cells11193135
Lanjakornsiripan, D., Pior, B. J., Kawaguchi, D., Furutachi, S., Tahara, T., Katsuyama, Y., et al. (2018). Layer-specific morphological and molecular differences in neocortical astrocytes and their dependence on neuronal layers. Nat. Commun. 9:1623. doi: 10.1038/s41467-018-03940-3
Lenk, K., Denizot, A., Genocchi, B., Seppälä, I., Taheri, M., and Nadkarni, S. (2024). Computational models of astrocyte function at glutamatergic synapses. In: New Technologies for Glutamate Interaction, Neuromethods, ed. M. Kukley (New York, NY: Humana), 229–263.
Luo, C. H., and Rudy, Y. (1994). A dynamic model of the cardiac ventricular action potential. I. Simulations of ionic currents and concentration changes. Circ. Res. 74, 1071–1096. doi: 10.1161/01.RES.74.6.1071
Ma, B., Buckalew, R., Du, Y., Kiyoshi, C. M., Alford, C. C., Wang, W., et al. (2016). Gap junction coupling confers isopotentiality on astrocyte syncytium. Glia 64, 214–226. doi: 10.1002/glia.22924
Mahmoud, S., Gharagozloo, M., Simard, C., and Gris, D. (2019). Astrocytes maintain glutamate homeostasis in the cns by controlling the balance between glutamate uptake and release. Cells 8:184. doi: 10.3390/cells8020184
Manninen, T., Havela, R., and Linne, M.-L. (2018). Computational models for calcium-mediated astrocyte functions. Front. Comput. Neurosci. 12:14. doi: 10.3389/fncom.2018.00014
Matías, I. A. C., and Vallespí, M. D. A. (2014). Orientation, Sphericity and Roundness Evaluation of Particles Using Alternative 3d Representations. Available at: https://upcommons.upc.edu/bitstream/handle/2117/99446/R14-1.pdf
Molotkov, D., Zobova, S., Arcas, J. M., and Khiroug, L. (2013). Calcium-induced outgrowth of astrocytic peripheral processes requires actin binding by Profilin-1. Cell Calc. 53, 338–348. doi: 10.1016/j.ceca.2013.03.001
Murphy-Royal, C., Dupuis, J., Groc, L., and Oliet, S. H. (2017). Astroglial glutamate transporters in the brain: regulating neurotransmitter homeostasis and synaptic transmission. J. Neurosci. Res. 95, 2140–2151. doi: 10.1002/jnr.24029
Nedergaard, M., and Verkhratsky, A. (2012). Artifact versus reality—how astrocytes contribute to synaptic events. Glia 60, 1013–1023. doi: 10.1002/glia.22288
Nett, W. J., Oloff, S. H., and McCarthy, K. D. (2002). Hippocampal astrocytes in situ exhibit calcium oscillations that occur independent of neuronal activity. J. Neurophysiol. 87, 528–537. doi: 10.1152/jn.00268.2001
Oberheim, N. A., Goldman, S. A., and Nedergaard, M. (2012). Heterogeneity of astrocytic form and function. Methods Mol Biol. 814, 23–45. doi: 10.1007/978-1-61779-452-0_3
Oberheim, N. A., Takano, T., Han, X., He, W., Lin, J. H. C., Wang, F., et al. (2009). Uniquely hominid features of adult human astrocytes. J. Neurosci. 29, 3276–3287. doi: 10.1523/JNEUROSCI.4707-08.2009
Oschmann, F., Mergenthaler, K., Jungnickel, E., and Obermayer, K. (2017). Spatial separation of two different pathways accounting for the generation of calcium signals in astrocytes. PLoS Comput. Biol. 13, 1–25. doi: 10.1371/journal.pcbi.1005377
Qian, N., and Sejnowski, T. J. (1989). An electro-diffusion model for computing membrane potentials and ionic concentrations in branching dendrites, spines and axons. Biol. Cybern. 62, 1–15. doi: 10.1007/BF00217656
Refaeli, R., Doron, A., Benmelech-Chovav, A., Groysman, M., Kreisel, T., Loewenstein, Y., et al. (2021). Features of hippocampal astrocytic domains and their spatial relation to excitatory and inhibitory neurons. Glia 69, 2378–2390. doi: 10.1002/glia.24044
Rose, C. R., and Karus, C. (2013). Two sides of the same coin: sodium homeostasis and signaling in astrocytes under physiological and pathophysiological conditions. Glia 61, 1191–1205. doi: 10.1002/glia.22492
Savtchenko, L. P., Bard, L., Jensen, T. P., Reynolds, J. P., Kraev, I., Medvedev, N., et al. (2018). Disentangling astroglial physiology with a realistic cell model in silico. Nat. Commun. 9, 1–15. doi: 10.1038/s41467-018-05896-w
Semyanov, A., Henneberger, C., and Agarwal, A. (2020). Making sense of astrocytic calcium signals—from acquisition to interpretation. Nat. Rev. Neurosci. 21, 551–564. doi: 10.1038/s41583-020-0361-8
Sharma, G., and Vijayaraghavan, S. (2001). Nicotinic cholinergic signaling in hippocampal astrocytes involves calcium-induced calcium release from intracellular stores. Proc. Natl. Acad. Sci. 98, 4148–4153. doi: 10.1073/pnas.071540198
Sholl, D. (1953). Dendritic organization in the neurons of the visual and motor cortices of the cat. J. Anat. 87, 387–406.
Srinivasan, R., Huang, B. S., Venugopal, S., Johnston, A. D., Chai, H., Zeng, H., et al. (2015). Ca(2+) signaling in astrocytes from Ip3r2(-/-) mice in brain slices and during startle responses in vivo. Nat. Neurosci. 18, 708–717. doi: 10.1038/nn.4001
Torres-Ceja, B., and Olsen, M. L. (2022). A closer look at astrocyte morphology: development, heterogeneity, and plasticity at astrocyte leaflets. Curr. Opin. Neurobiol. 74:102550. doi: 10.1016/j.conb.2022.102550
Tsunematsu, T., Sakata, S., Sanagi, T., Tanaka, K. F., and Matsui, K. (2021). Region-specific and state-dependent astrocyte ca2+ dynamics during the sleep-wake cycle in mice. J. Neurosci. 41, 5440–5452. doi: 10.1523/JNEUROSCI.2912-20.2021
Verisokin, A. Y., Verveyko, D. V., Postnov, D. E., and Brazhe, A. R. (2021). Modeling of astrocyte networks: toward realistic topology and dynamics. Front. Cell. Neurosci. 15:50. doi: 10.3389/fncel.2021.645068
Verkhratsky, A., and Nedergaard, M. (2018). Physiology of astroglia. Physiol. Rev. 98, 239–389. doi: 10.1152/physrev.00042.2016
Viana, J. F., Machado, J. L., Abreu, D. S., Veiga, A., Barsanti, S., Tavares, G., et al. (2023). Astrocyte structural heterogeneity in the mouse hippocampus. Glia 71, 1667–1682. doi: 10.1002/glia.24362
Witthoft, A., and Em Karniadakis, G. (2012). A bidirectional model for communication in the neurovascular unit. J. Theor. Biol. 311, 80–93. doi: 10.1016/j.jtbi.2012.07.014
Zhao, Y., and Hryniewicki, M. K. (2019). XGBOD: improving supervised outlier detection with unsupervised representation learning. arXiv [preprint]. doi: 10.1109/IJCNN.2018.8489605
Zhou, B., Zuo, Y.-X., and Jiang, R.-T. (2019). Astrocyte morphology: diversity, plasticity, and role in neurological diseases. CNS Neurosci. Ther. 25, 665–673. doi: 10.1111/cns.13123
Keywords: astrocyte, morphology, computational neuroscience, intracellular signaling, biophysical modeling, calcium dynamics
Citation: Freund A, Mayr A, Winkler P, Weber R, Tervonen A, Refaeli R and Lenk K (2024) Computational modeling of the relationship between morphological heterogeneity and functional responses in mouse hippocampal astrocytes. Front. Cell. Neurosci. 18:1474948. doi: 10.3389/fncel.2024.1474948
Received: 02 August 2024; Accepted: 23 September 2024;
Published: 17 October 2024.
Edited by:
Carmen Falcone, International School for Advanced Studies (SISSA), ItalyReviewed by:
Sonia Luz Albarracin, Pontifical Javeriana University, ColombiaAlexander A. Mongin, Albany Medical College, United States
Fabio Cavaliere, Achucarro Basque Center for Neuroscience, Spain
Copyright © 2024 Freund, Mayr, Winkler, Weber, Tervonen, Refaeli and Lenk. This is an open-access article distributed under the terms of the Creative Commons Attribution License (CC BY). The use, distribution or reproduction in other forums is permitted, provided the original author(s) and the copyright owner(s) are credited and that the original publication in this journal is cited, in accordance with accepted academic practice. No use, distribution or reproduction is permitted which does not comply with these terms.
*Correspondence: Kerstin Lenk, bGVuay5rZXJzdGluQGdtYWlsLmNvbQ==
 Anna Freund
 Alexander Mayr
 Peter Winkler1
 Aapo Tervonen
 Ron Refaeli
 Kerstin Lenk