 Kirill Zavalin
 Anjana Hassan1†
 Zain Khera
 Andre H. Lagrange
94% of researchers rate our articles as excellent or good
Learn more about the work of our research integrity team to safeguard the quality of each article we publish.
Find out more
ORIGINAL RESEARCH article
Front. Cell. Neurosci., 04 June 2024
Sec. Cellular Neurophysiology
Volume 18 - 2024 | https://doi.org/10.3389/fncel.2024.1390742
This article is part of the Research TopicCellular and Molecular Mechanisms that Govern Assembly, Plasticity, and Function of GABAergic Inhibitory Circuits in the Mammalian BrainView all 10 articles
Introduction: γ-Aminobutyric acid (GABA) type A receptors (GABAARs) are ligand-gated Cl-channels that mediate the bulk of inhibitory neurotransmission in the mature CNS and are targets of many drugs. During cortical development, GABAAR-mediated signals are significantly modulated by changing subunit composition and expression of Cl-transporters as part of developmental processes and early network activity. To date, this developmental evolution has remained understudied, particularly at the level of cortical layer-specific changes. In this study, we characterized the expression of nine major GABAAR subunits and K-Cl transporter 2 (KCC2) in mouse somatosensory cortex from embryonic development to postweaning maturity.
Methods: We evaluated expression of α1-5, β2-3, γ2, and δ GABAAR subunits using immunohistochemistry and Western blot techniques, and expression of KCC2 using immunohistochemistry in cortices from E13.5 to P25 mice.
Results: We found that embryonic cortex expresses mainly α3, α5, β3, and γ2, while expression of α1, α2, α4, β2, δ, and KCC2 begins at later points in development; however, many patterns of nuanced expression can be found in specific lamina, cortical regions, and cells and structures.
Discussion: While the general pattern of expression of each subunit and KCC2 is similar to previous studies, we found a number of unique temporal, regional, and laminar patterns that were previously unknown. These findings provide much needed knowledge of the intricate developmental evolution in GABAAR composition and KCC2 expression to accommodate developmental signals that transition to mature neurotransmission.
GABA-A receptors (GABAARs) are Cl−-conducting ion channels activated by γ-Aminobutyric acid (GABA) that convey the majority of inhibitory neurotransmission in the adult brain. GABAAR activity appears early in cortical development, preceding the emergence of glutamatergic activity in some brain regions (Wang and Kriegstein, 2008; Chancey et al., 2013; Warm et al., 2022). This early GABAergic signaling regulates many aspects of brain development, including migration of GABAergic interneuron progenitors (Cuzon et al., 2006; Bortone and Polleux, 2009; Cuzon Carlson and Yeh, 2011; Inada et al., 2011; Inamura et al., 2012), formation of synapses (Wang and Kriegstein, 2008, 2011; Oh et al., 2016), neurite extension (Ge et al., 2006; Cancedda et al., 2007; Bouzigues et al., 2010), and circuit integration of immature neurons through concerted high-amplitude early network oscillations termed “giant depolarizing potentials” (Ben-Ari et al., 2007; Allene et al., 2008); reviewed by Kilb (2021) and Peerboom and Wierenga (2021).
GABAARs are pentameric ligand-gated ion channels, commonly comprised of a combination of α, β, and either γ or δ subunits that determine receptor properties and localization. There are multiple isoforms for these subunits, with α1-5, β1-3, γ2, and δ being the most prevalent in mammalian forebrain. Of the most common subunit combinations, ɑ1β2/3γ2, ɑ2β2/3γ2, and ɑ3β2/3γ2 localize to synapses and mediate phasic responses to GABA, while ɑ4βδ and ɑ5βγ2 are typically found in the extrasynaptic space and primarily mediate tonic currents (Chuang and Reddy, 2018; Engin et al., 2018). The ɑ1β2/3γ2 combination is the predominant subunit combination found in mature synapses and the target of many of our most useful drugs used in babies and adults, including anti-seizure medicine and anxiolytics (Möhler, 2006; Engin et al., 2018). In contrast, α4β2δ and α5β3γ2 GABAARs that mediate tonic inhibition are sensitive to lower and [GABA] and have slower activation and deactivation kinetics (Lagrange et al., 2018). These receptors are targeted by several general anesthetics and alcohol. Many subunit isoforms have regionally specific distributions (Pirker et al., 2000; Hortnagl et al., 2013).
GABAAR-mediated responses undergo a significant transformation over the course of development that reflects synaptic maturation, but also transient developmental adaptations. Most notably, GABAAR activation during early development can be excitatory, which triggers Ca2+ transients that promote cytoskeletal remodeling and synaptic plasticity and appears to be essential for many developmental processes driven by GABA (Kilb, 2021; Peerboom and Wierenga, 2021). On a similar timeline, early GABAergic responses display slow and tonic kinetics conducive to developmental processes (Owens et al., 1999; Daw et al., 2007; Sebe et al., 2010; Le Magueresse and Monyer, 2013; Warm et al., 2022), while fast GABAergic responses optimal for resolution of discrete synaptic events emerge with maturity (Bosman et al., 2002; Kobayashi et al., 2008; Brown et al., 2016; Kroon et al., 2019).
Developmental changes in expression of GABAAR subunits and K-Cl transporter 2 (KCC2) drive many of the changes to GABAergic responses during development. Cl− extrusion by KCC2 is the primary mechanism for maintaining low intracellular [Cl−] that drives inhibitory GABAergic responses. Both KCC2 expression and kinase-determined functional state are developmentally regulated to increase KCC2 activity with maturation of GABAergic neurotransmission, resulting in a relatively rapid shift from excitatory to inhibitory GABAergic responses in the second and third week of postnatal life (Fukuda, 2020). Meanwhile, a large body of work has demonstrated that developmental changes in subunit composition of GABAARs profoundly modify GABAergic signaling in context of specific developmental processes (Bosman et al., 2002; Serwanski et al., 2006; Giusi et al., 2009; Sebe et al., 2010; Cuzon Carlson and Yeh, 2011; Brady and Jacob, 2015; Hernandez et al., 2019; Lodge et al., 2021).
Given the importance of KCC2 and GABAAR composition during development, a detailed understanding of their developmental expression is of vital importance. Previously, several expression studies (Fritschy et al., 1994; Golshani et al., 1997; Paysan et al., 1997) characterized the general and regional course of GABAAR subunit expression in developing cortex, including an extensive characterization of mRNA expression of thirteen major GABAAR subunits from middle of embryonic development to adulthood in rat brains (Laurie et al., 1992). Unfortunately, these studies are limited by primarily looking only at mRNA expression and missing laminar details, and a need exists for a more comprehensive, detailed characterization of GABAAR subunit protein expression similar to adult expression studies (Pirker et al., 2000; Hortnagl et al., 2013). A lesser knowledge gap exists for developmental expression of KCC2, which has been investigated at the level of mRNA and protein in mouse and human tissue, including regional specificity in adult CNS (Markkanen et al., 2014) and developmental expression (Lu et al., 1999; Rivera et al., 1999; Stein et al., 2004; Uvarov et al., 2009; Murguia-Castillo et al., 2013), specifically including cortex (Dzhala et al., 2005; Vanhatalo et al., 2005; Takayama and Inoue, 2010; Kovács et al., 2014; Sedmak et al., 2016). These studies defined the general trend in KCC2 expression over the course of development, including some laminar and cell-type specificity, such as early interneuron-specific expression we recently reported (Zavalin et al., 2022). However, a more comprehensive study of KCC2 expression in developing cortical lamina is still needed. In this study, we address these knowledge gaps by a comprehensive and focused characterization of expression patterns of major GABAAR subunits and KCC2 from cortical plate formation (E13.5) to more mature brain (P26) in mouse cortex. We paid particular attention to lamina-specific expression within barrel cortex, which showed a rich level of complexity at these ages.
Mice were maintained in temperature-controlled housing areas, were adequately fed, hydrated, and kept under 12:12 h of alternating dark/light cycles. All animal handling and procedures were approved by Vanderbilt IACUC and VA ACORP committees. All experiments were performed using both female and male C57BL/6J congenic mice. Experiments requiring interneuron identification used Dlx5/6-Cre-IRES-EGFP mice (Jackson labs stock # 023724) that we had bred into the C57BL/6J congenic line for at least eleven generations. Gabra3 knockout mice, exhibiting complete loss of GABAAR α3, were generously donated by Uwe Rudolph, maintained by our lab, and used for validating the GABAAR α3 antibody from Alomone labs. For experiments requiring embryonic timepoints, timed pregnancies for dams were carried out by mating them with wild type males from 4 pm to 4 pm next day. The following day in which the vaginal mucous plug was seen was taken as E0.5.
Postnatal brain tissues for P1, P5, P12, and P25/26 timepoints were collected from either wildtype or Dlx5GFP+/WT mice to label MGE-derived interneurons by decapitation under isoflurane anesthesia, after which the brain and meninges were removed from the skull. Similarly, E13.5, E15.5, and E17.5 brain tissues were collected from embryos that were dissected from pregnant dams under anesthesia. After dissection, the embryos were quickly decapitated. For Western blot (WB) experiments, brains were dissected in PBS with tweezers under a dissection microscope to separate cortex from subcortical structures, and then processed as described below. For immunohistochemistry (IHC) experiments, embryonic heads and postnatal brain tissue were fixed with a brief immersion in 4% paraformaldehyde in PBS for 7 min. Similarly to previous reports (Schneider Gasser et al., 2006), we found that this light fixation protocol provided much greater detail for GABAAR studies than the relatively homogenous, non-punctate staining that we typically obtained from cardiac-perfused tissue. Following fixation, postnatal brains and embryonic heads were transferred to 30% sucrose for 24–48 h for cryoprotection, blocked by coronal cuts at the levels of prefrontal cortex and brain stem, and cryo-embedded in OCT compound. Twenty μm-thick sections were obtained for all ages under study using a Leica cryostat and stored in −80°C.
PCR analysis was performed on tail tissue harvested on E13.5, E15.5, E17.5, P1, P5, or on ear punches for P12 and P25 to determine genotypes. We used Sigma REDExtract-N-Amp tissue PCR kit Cat # XNAT-100RXN for extracting and amplifying the tissue DNA. For genotyping presence of Dlx5/6-Cre-IRES-EGFP in our mice, we used the following primers: Cre Forward 5′-GCA TTA CCG GTC GAT GCA ACG AGT GAT GAG-3′, Cre reverse: 5′-GAG TGA ACG AAC CTG GTC GAA ATC AGT GCG-3′ and the following thermal cycler protocol: 94°C for 3 min, (94°C for 30 seconds, 68°C for 30 seconds, 72°C for 1 min) × 30 cycles to amplify a cre product at 408 bp. For genotyping Gabra3 knockout mice, we used the following primers: Primer UR75: 5′-GAC AGA CAT GGC ATG ATG AAA GAC TGA AAT−3′, Primer UR106: 5′-ACA AAA TGT AAG AAC AAG AAC CAA GAA AAT-3′ and the following thermal cycler protocol: 96°C for 1 min, (96°C for 15 seconds, 50°C for 10 seconds, 70°C for 1 min) × 40 cycles, 68°C for 5 min and hold at 4°C to amplify a single band at 480 bp for wildtype and two bands at 480 and 520 bp for knockout. Product bands were distinguished by electrophoresis on a 2% agarose gel stained with SYBR Safe DNA gel stain (Invitrogen Cat# P/N S33102) and visualized using Biorad GelDoc EZ.
We chose target proteins and antibodies for this study based on several factors. Firstly, we reviewed known mRNA expression in embryonic/perinatal forebrain (Laurie et al., 1992). We then chose subunits contained in GABAAR combinations whose pharmacological and kinetic properties have been characterized to allow us to formulate subsequent hypotheses about the potential physiological significance of our results. Finally, we selected commercially available antibodies to improve the generalizable utility of this work for other investigators.
When validating our antibodies, we first screened for subunit specificity using recombinant receptors expressed in HEK 293T cells (Lagrange et al., 2007). Whole cell protein extracts (data not shown) and plated HEK cells (Supplementary Figure 1) were analyzed by immunoblot to find isoform-specific anti-GABAAR antibodies which detect the appropriately sized protein band for the target protein without cross-reactivity with off-target subunit isoforms. We then further confirmed antibody sensitivity and specificity of non-denatured proteins by immunostaining young adult mouse brain tissue, selecting antibodies that labeled regionally specific patterns of subunit-specific expression found in previously published reports (Pirker et al., 2000; Hortnagl et al., 2013) (Figure 1). The α4 immunostains were sometimes associated with a non-specific punctate signal that we could not entirely prevent, which presented as a patchy, inconsistent signal that was equally present in tissue known to lack expression of α4, such as postnatal white matter. While most antibodies have well-defined patterns of high/low expression, this is not true for the more ubiquitously expressed β3, γ2 subunits, so these antibodies were validated using embryonic brain slices from knockout mice that do not express those proteins, using tissue that was generously provided by Jing-Qiong Kang's lab. We also confirmed specificity of α3 and KCC2 expression using knockout mice. The resulting list of validated antibodies used in our study is presented in Supplementary Table 1.
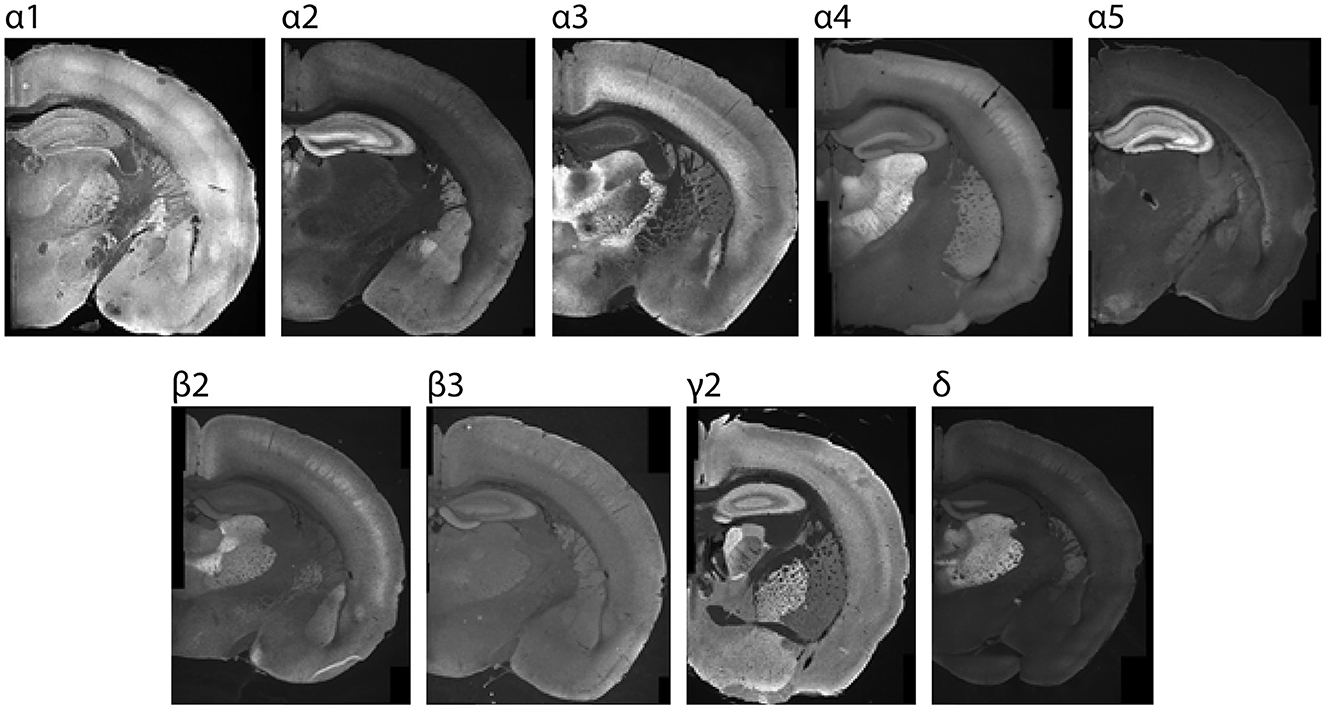
Figure 1. Sample P26 images showing region-specific immunolabeling patterns of GABAAR subunits in the CNS. Regions with the highest expression were used for setting acquisition settings and the maximum grading threshold for quantifying subunit expression within cortex.
Human embryonic kidney cells (HEK293T) were maintained in culture and transfected as previously described (Lo et al., 2014). Cells were transfected with a combination of cDNAs, each containing the sequence for one of the rat GABAAR mRNA. These were done using Fugene with equimolar amounts (1 μg) of each cDNA. For Western blot (WB), cells were then harvested, and protein extracted as described below. For immunocytochemistry, cells were harvested and then replaced at 10K cells per well in a 24-well plate. They were then cultured overnight and then processed for immunocytochemistry. We tested a number of fixation techniques, including methanol, 4% PFA × 5 min, and 4% PFA + 4% sucrose for 15 min. We also tested multiple blocking conditions, including milk, BSA, or donkey/horse serum, with or without Triton X-100. Based on these results, we chose 4% PFA × 5 min, blocked in 10% donkey serum + 0.3% Triton X-100, then overnight incubation with the primary antibody without Triton X-100 at 1:250 to 1:500. These were then stained with the appropriate secondary antibody, as described in the immunofluorescence section. Wells were then washed three times in PBS, followed by imaging at 10 × with an upright Zeiss microscope.
Tissue was homogenized with a sonicator (QSonica) in a modified RIPA buffer containing (50 mM Tris-HCl pH 7.4, 150 mM NaCl, 1% NP-40, 0.2% sodium deoxycholate, 1 mM EDTA) with 10 μL/mL protease and phosphatase inhibitors (Sigma). Protein concentration was determined with the Bradford assay (Bio-Rad), and samples were diluted to a final concentration of 1 to 3 μg/μL in Laemmli loading buffer (Biorad) containing β-mercaptoethanol. Heat denaturation was skipped due to the delicate nature of transmembrane proteins like GABAAR subunits. Samples and protein ladder (Cytiva RPN800E) were loaded onto a 10% SDS gel (Invitrogen) and run at 75–85 V for 2.5–3 h. Proteins were transferred in a Tris-glycine transfer buffer (19.2 mM Glycine, 7.5 mM Tris-base, 20% methanol) onto Immobilon-FL PVDF membranes (Millipore) by applying 100 V for 1.5 h. Membranes were then blocked in TBS with 0.1% Tween-20 (TBS-T) with 4% milk for 1 h at room temperature. Membranes were cut into portions containing E6AP (top) and actin/GABAAR protein (bottom) and incubated with respective primary antibodies in 5% BSA in TBS-T overnight at 4°C. Primary antibodies were the same as those used for immunofluorescent staining of brain slices. Membranes were washed at least three times for 10 min in TBS-T and then incubated with fluorescent secondary antibodies in TBS-T for 2 h at room temperature or overnight at 4°C. Membranes were then washed three times for at least 10 min with TBS-T. Imaging was performed on a LI-COR Odyssey fluorescence scanner, protein expression was quantified with Odyssey imaging software, and further analyzed with MS Excel and GraphPad Prism. E6AP and actin were both evaluated as loading controls, after which E6AP was used to normalize all WB expression data for loading differences. The ratios of GABAAR/E6AP were averaged, and the mean ± SEM were plotted vs. age. Differences in antibody affinity preclude direct comparisons of protein amounts among different subunits. Therefore, the point of maximal expression for each subunit was used to normal WB data for plotting. Data are depicted as arbitrary units (a.u.) relative to the maximal data point.
To minimize experiment-to-experiment variability, several WBs containing a full range of ages were run, probed for a single GABAAR subunit, and analyzed simultaneously. Typically, at least three measurements from three different mouse samples per developmental timepoint per antibody were collected. On a few occasions, we ran additional gels without the complete range of ages. This was due to either needing additional ages to characterize periods of rapid change, or because there was a loading error with a particular protein sample. In these uncommon cases, we included at least 2 protein samples from previously run gels to confirm consistency in our results. The anti-γ2 antibody here recognized both the long and short splice variants of this protein, but their sizes were too similar to discriminate. Examples of GABAAR subunit and E6AP WB bands obtained from cortical samples are shown in Supplementary Figure 2. Due to low levels of α4 expression in cortex during development, P36 thalamic and cortical samples were run as controls.
To perform statistical analysis on WB data, expression data was binned into E13.5-P3, P5-P10, and P12-P26 bins to represent generalized developmental stages and avoid type II error from having too many groups. Significance was determined using a one-way ANOVA with Šídák's multiple comparisons test between each of the three bins.
The slides chosen for cortical staining included coronal sections containing somatosensory cortex. In postnatal tissue, this was further defined as coronal sections containing somatosensory and barrel cortex, and dorsal hippocampus. While not reported here, this plane of coronal sections also allowed us to visualize important germinal areas, such as pallial ventricular and subventricular zones (SVZ), median ganglionic eminence (MGE), intermediate zone (IZ), and postnatal hippocampus, thalamus, and basal ganglia. These postnatal areas were chosen based on strong subunit-specific expression for each. This allowed us to quality control for antibody specificity and qualitatively assess relative expression intensity from run to run. These results were used to conservatively optimize image acquisition parameters before imaging. For example, thalamic α3 expression is high in the reticular nucleus, but absent in ventrobasal thalamus. In contrast, α4 and δ expression are high in the ventrobasal thalamus, but not in the reticular nucleus. Specific cortical areas were identified using Prenatal Mouse Brain Atlas (Schambra and Schambra, 2008) and Chemoarchitectonic Atlas of the Developing Mouse Brain (Jacobowitz and Abbott, 1997) for E13.5 and E15.5 mice, Atlas of the Developing Mouse Brain at E17.5, P0, and P6 (Paxinos, 2007) for perinatal mice, and The Mouse Brain in Stereotaxic Coordinates (Paxinos and Franklin, 2004) for sections from mice P12 and older.
In order to minimize inter-run variability, immunolabeling was performed in batches that included multiple age groups: E13.5, E15.5, E17.5, P1, P5, P12, and/or P25/26. Immunolabeling was done between 4–10 times for each antibody, totaling tissue from 3–8 different mice for each age group. We also included a few slides with no primary antibody as control slides. Slides were labeled and circled around the tissue with the hydrophobic Pap Pen, dried at room temperature for 30 min, then washed (1 × PBS, 0.2% Triton X-100) for 5 min. Slides were then blocked in blocking buffer (1 × PBS, 0.2% Triton X-100, 10% donkey serum) for 1 h, then incubated with the appropriate primary antibody in blocking buffer at 4°C for two nights. Slides were washed 3 times for 5 min, then incubated with the appropriate secondary antibody in blocking buffer for 2 h at room temperature or overnight at 4°C. Sections were washed 3 times for 5 min, mounted and cover slipped with VectaShield HardSet Antifade Mounting Medium with DAPI (Vector Labs, Burlingame, CA), dried for 30 min at room temperature, and stored at 4°C. Images were acquired within 2 to 3 weeks of mounting.
Stained brain sections were imaged using a Leica DM 6000 epifluorescent microscope equipped with a DFC 365 FX digital camera (Leica, Buffalo Grove, IL). Images were acquired using 5 × and 10 × objectives. Acquisition settings for each antibody were determined using normative regions of interest (ROIs) from P26 brains (Figure 1), and the settings within each run were kept consistent for each subunit. Normative ROIs with maximal subunit expression include: α1: ventrobasal thalamus, α2: dentate gyrus molecular layer, α3: thalamic reticular nucleus, α4 and δ: dentate gyrus molecular layer, α5: CA3 of hippocampus, γ2: globus pallidus, β2: ventrobasal thalamus, and β3: dentate gyrus molecular layer. The grid images were stitched using Fiji Image J stitching plugin (Preibisch et al., 2009): stitching-grid/collection stitching, 30% overlap, maximum intensity fusion method with subpixel accuracy. The fused images were saved as 8-bit TIFF files. Post-stitching modifications included adjustments for contrast and were carried out for display purposes only using Image J. A subset of images was also acquired using higher magnification (20 × or 40 ×), as indicated in the text.
Brain regions were identified using dedicated atlases of embryonic, perinatal, and adult mouse brain (Jacobowitz and Abbott, 1997; Paxinos and Franklin, 2004; Paxinos, 2007; Schambra and Schambra, 2008). When needed, marginal zone (MZ) and subplate (SP) were further identified (Bayer and Altman, 1990). The most superficial layer of the cortical plate (CP) was defined as MZ before P1, and then as layer 1 postnatally. Cortical layers were defined using DAPI staining of our tissue. We then performed semi-quantitative grading of expression based on age and cortical layers by quantifying the mean intensity in at least three randomly selected regions for each region/layer/age. These numeric results for all ages and cortical layers within each run of IHC were collated to determine the distribution of our results. This information was then used to determine the percentile ranks of each data point and were the basis for initial grades (e.g., >90% percentile was considered a “+++”). Multiple investigators (AHL, AH, KZ, and ZK) then reviewed these grades and the original source images from multiple runs to form a consensus semi-quantitative grading. Each experimental run included E13.5 to P26 tissue, and the ROIs chosen as the normative reference areas of highest expression were assigned a value of 5, while postnatal white matter as 0. Images from at least three animals per timepoint were used in making these assessments. Some subunits had a pattern of expression that was stronger in either the upper or lower portion of a particular layer. This occurred most commonly with L5. In these situations, we report the upper portion as L5a, the lower portion as L5b. This distinction is based purely on the pattern of expression and may not exactly match sublayers reported in the literature that are based on other patterns of expression or physiology. Composite, multi-age figures were typically created from tissue run at the same time to more accurately convey expression-intensity differences over time.
In figures, divisions of adult and transient development-specific lamina were defined based on the DAPI signal and were then superimposed on greyscale IHC images. Grading tables used definitions of adult laminae and the transient subplate for ease of tracking laminar changes within a single row. At E13.5-P1, MZ corresponds to L1 in the grading table. CP corresponds to L2-L4 in the grading table for E15.5-P1. Expression for most subunits was ubiquitous in the CP, but when certain banding was observed at the bottom of the CP, this was distinguished as L4-specific signal at these early stages. For some images at E15.5 when no expression differences were seen between CP, L5, and L6, we did not distinguish these laminae and labeled them all as CP. For images at E13.5, CP corresponded to L2–L6 in the grading table.
We started our investigation by validating GABAAR subunit specificity for a panel of antibodies for α1-5, β2-3, δ, and γ2 in vitro in HEK cells expressing different GABAAR combinations (Supplementary Figure 1), and showing that regional IHC expression at P26 (Figure 1) matched previous reports (Hortnagl et al., 2013). Next, we used the validated antibodies to create a developmental profile of GABAAR subunit expression in cortex at different timepoints. Our approach included (1) a quantitative comparison of expression changes associated with each developmental stage by Western blot (WB) across a detailed timeline with statistical analysis performed between three generalized stages (E13.5-P3; P5-P10; P15-P25); and (2) a complimentary layer and region-specific analysis of expression by immunohistochemistry (IHC). Using IHC, we generated a large dataset of immunolabeled tissue, which we used for semi-quantitative grading of laminar expression differences as the development progresses. We designed our semi-quantitative approach (refer to Methods) based on seminal expression studies in our field (Pirker et al., 2000; Hortnagl et al., 2013; Stefanits et al., 2018), which is arguably the most objective approach to quantifying IHC expression while taking into account staining variability and other limitations of IHC. We found that each subunit showed distinct temporal and layer-specific patterns of expression, which are discussed below.
An overview of α1-5 subunit expression is shown in Figure 2. Cortical immunoreactivity of α1 on WB was generally low in embryonic and early postnatal period, but steadily rose to prominent and then high levels in the late postnatal period that showed a statistically significant difference from earlier expression (Figure 3, ****P < 0.0001 P15-P25 vs. earlier ages). Our IHC experiments corroborated this trend and revealed significant regional and lamina-specific differences (Figures 2, 3). At E13.5, α1 protein expression was essentially absent from the developing cortex and underlying regions, and only very low α1 levels were seen at E15.5. Somewhat higher expression in the cortex and subplate was evident at E17.5 and P1, primarily in marginal zone (MZ)/layer 1 (L1) and layer 4 (L4). At these ages, future somatosensory cortex could be distinguished from adjacent regions by elevated α1 expression in L4. While α1 was low in other layers at E17.5-P1, there were clear α1-positive putative dendrites in L2 that appeared to arise from L4 and end in dendritic tufts in L1 (Figure 2) in a fashion similar to previously reported (Paysan et al., 1997; Paysan and Fritschy, 1998).
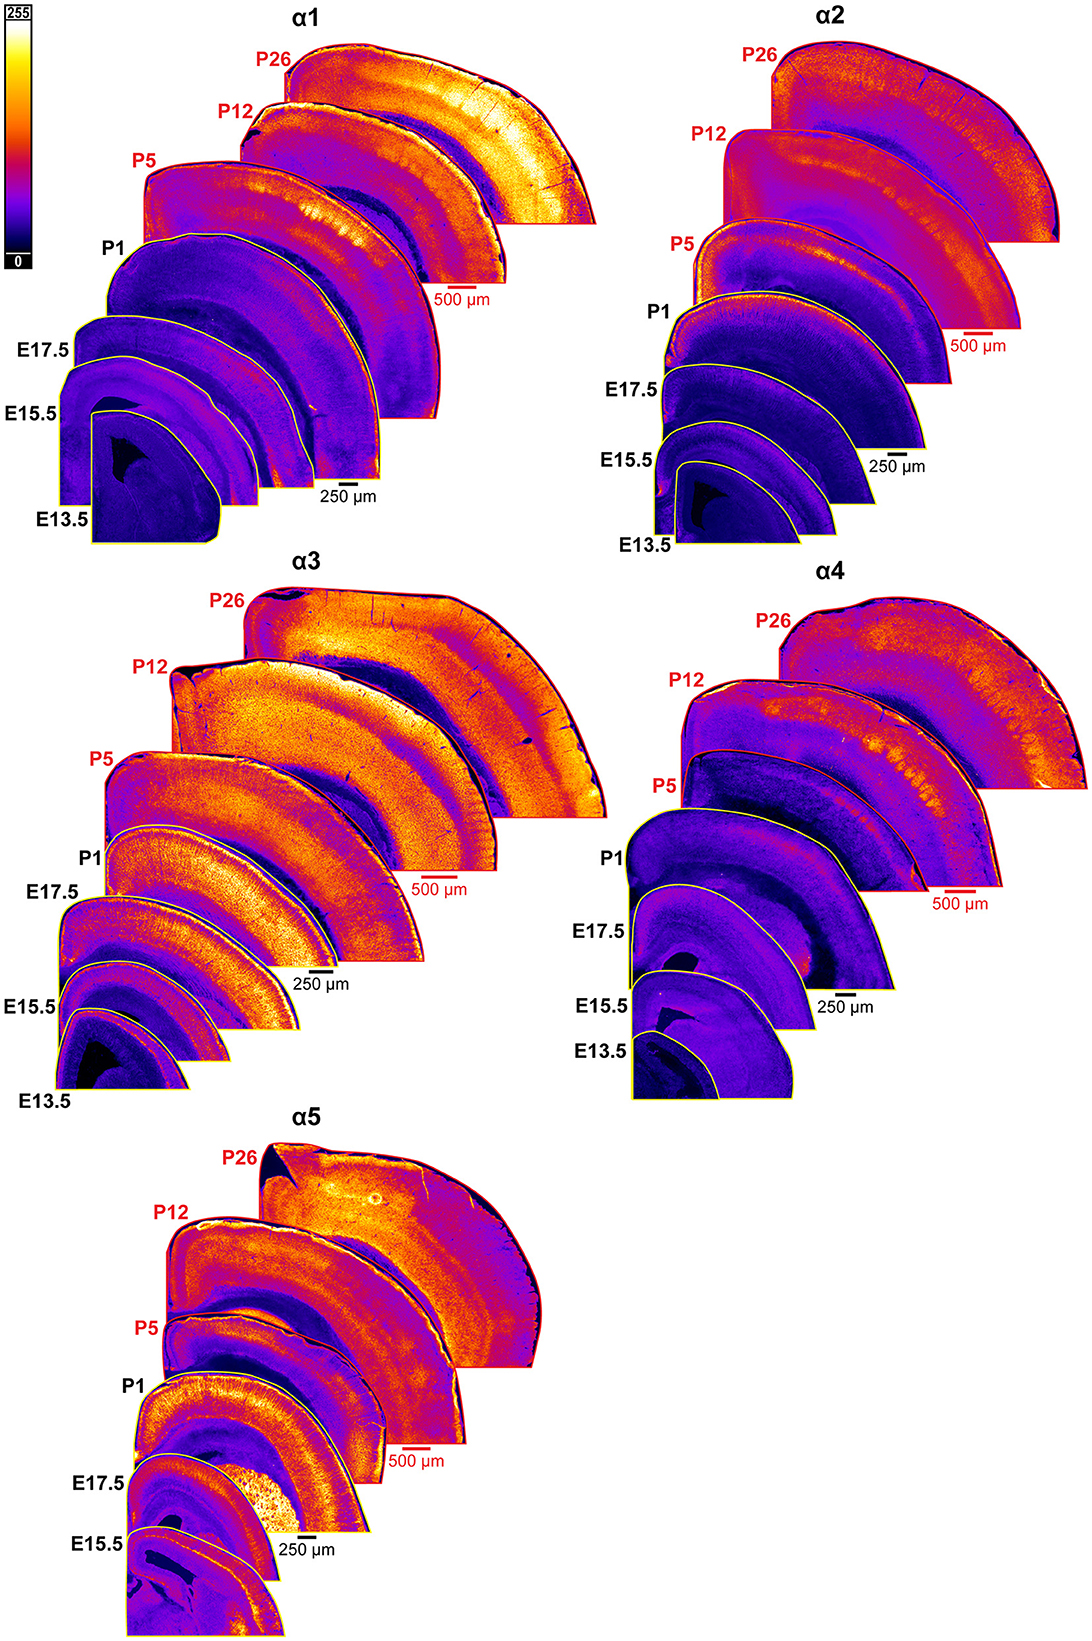
Figure 2. Expression of GABAAR α1-5 subunits in developing cortex. Coronal sections are overlaid from embryonic day E13.5/E15.5 on the bottom left to postnatal day 26 on the top right separately for each α subunit. All sections are oriented from ventral bottom to dorsal top, with lateral cortex on the right. Separate spatial scaling has been used for sections E13.5-P1 (black scale bar) and P5-P26 (red scale bar), separately for each subunit. Signal is represented using a subunit-specific heat map lookup table to highlight differences in regional expression. Heatmap intensity scaling is shown by the bar in top left.
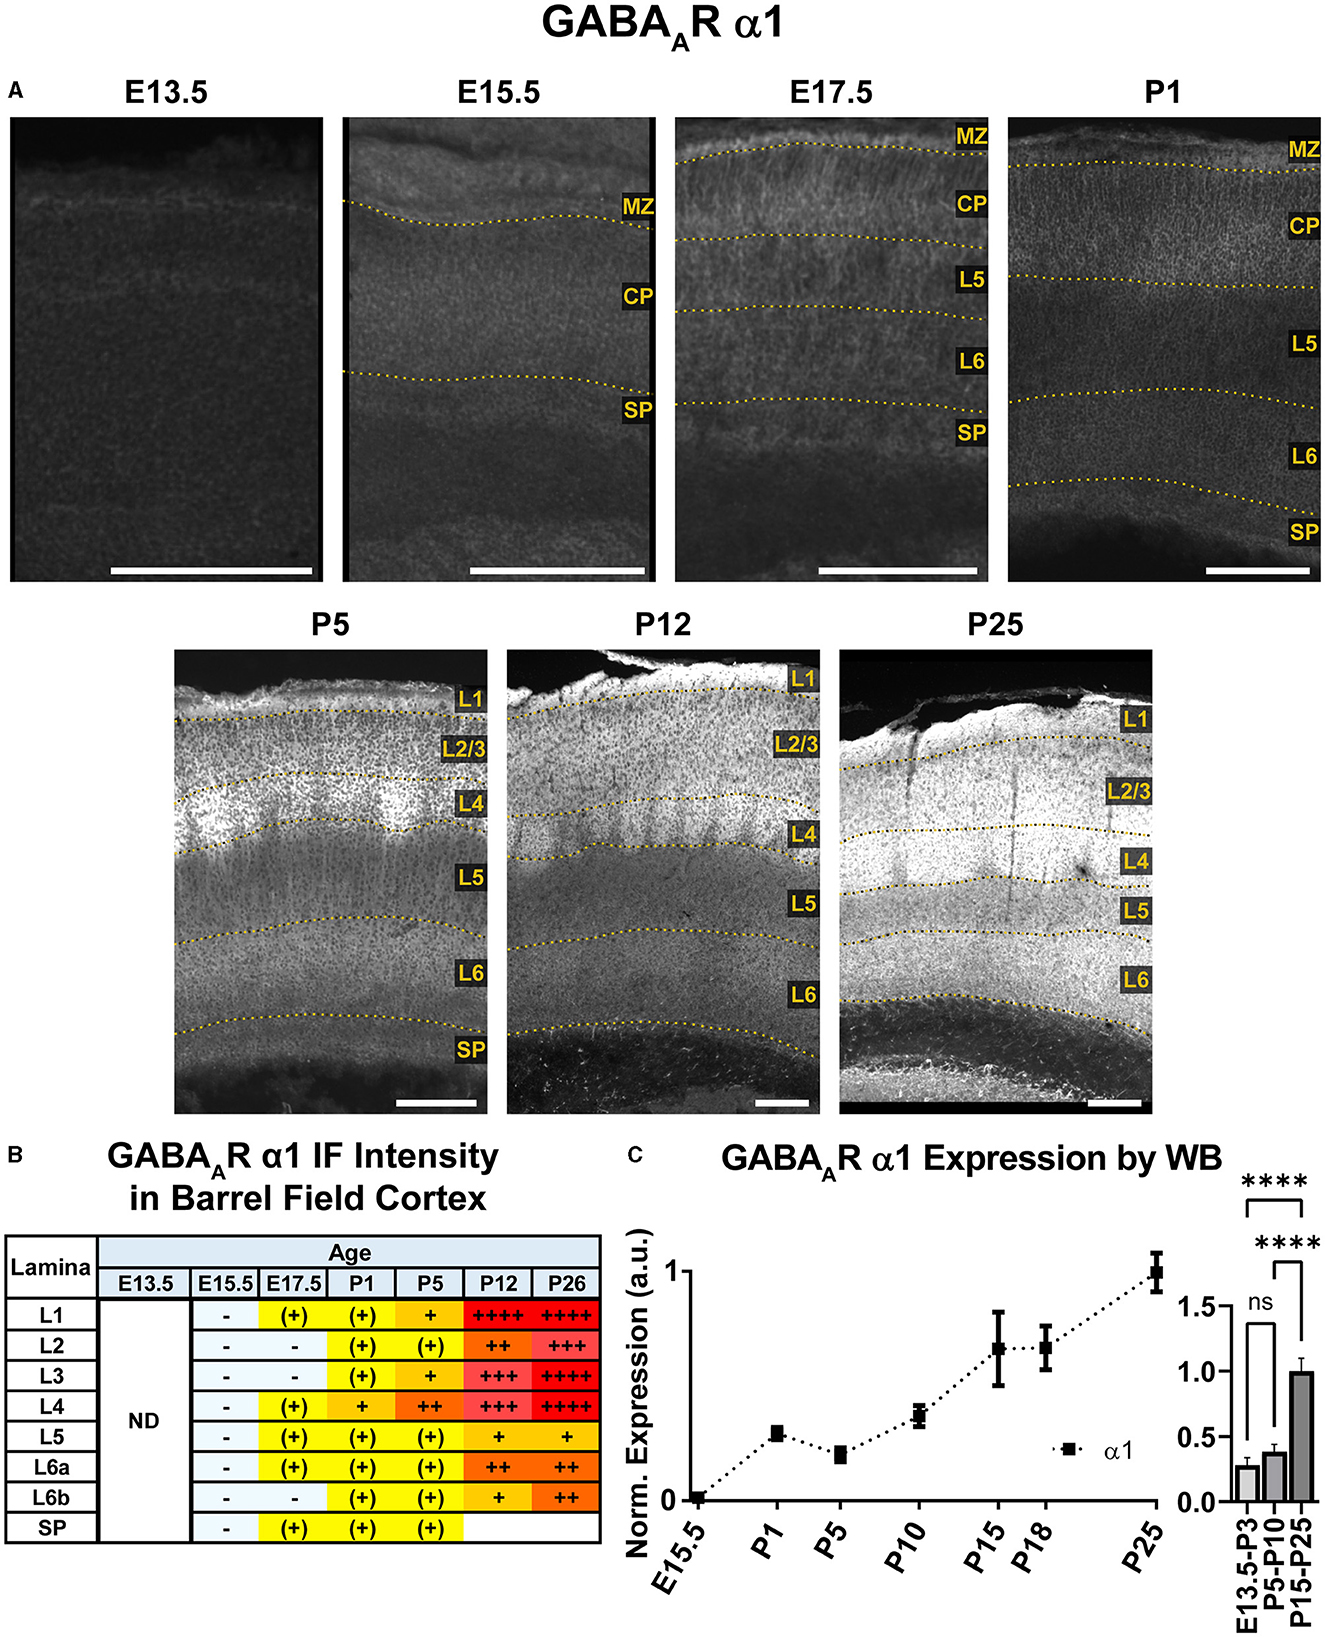
Figure 3. GABAAR α1 expression in barrel field cortex from embryonic age to maturity. (A) Exemplar images of α1 immunoreactivity in barrel field cortex across development. Scale bar = 250 μm. (B) Grading of immunofluorescence intensity across cortical lamina, where + + ++ is the maximal α1 signal that could be detected in brain at P26. (C) Quantification of GABAAR α1 protein in cortical samples by Western blot (WB), with a timeline of all points on the left and binned stages tested for significance on the right. ****P < 0.0001 by one-way ANOVA with Šídák's multiple comparisons; n in mice/age: 3/E15.5, 8/P1, 3/P5, 4/P10, 4/P15, 4/P18, and 4/P25. L1–L6, layer 1–layer 6; MZ, marginal zone; SP, subplate; CP, cortical plate; ND, not determined; also refer to “Lamina in Grading Table and Figures” section in Methods.
The overall α1 expression levels rose dramatically in most cortical areas at P5 but retained a layer-specific pattern. Increased α1 expression in L2/3 made it impossible to distinguish the aforementioned L2/3 dendrites by P5. However, the highest expression remained in L1 and L4, as well as somewhat increased expression at the boundary of L5b/L6a. This gave the appearance of alternating bands of high expression in L1, L4, and L5b/L6a boundary with lower expression in-between. Expression at P12 and P26 continued to rise throughout cortex, becoming most prominent in L1-4 and highest in L3/4 of barrel cortex. Expression within L5/6 was comparatively lower at these ages, but consistently higher in L6 than L5.
WB analysis showed low α2 expression during embryonic and perinatal periods that greatly increased and peaked at P10-P18, coming down to a moderate level of expression at P25 (Figure 4). Our statistical evaluation showed this as a significant steady increase across development (****P < 0.0001 E13.5-P3 vs. P5-P10, **P < 0.01 P5-P10 vs. P15-P25). Our IHC experiments reflected this general trend but detected multiple instances of localized expression throughout development. At E13.5, there was very faint α2 expression in the MZ and subcortical tissue, but not the somatosensory cortical plate (CP) itself. Expression of α2 within the CP began at E15.5, with diffuse α2 expression mostly in the upper layers of CP (L1-3). Interestingly, most of the α2 signal in the lower CP appeared to be a continuation of radial fibers originating in subcortical tissue. This was more prominent at E17.5, with α2-positive radial fibers arising from the intermediate zone, extending through the subplate and then outward toward the cortical surface. These processes are clearly visible in L5/6 but are lost in the generalized α2 expression in more superficial layers. The identity of these fibers is not entirely clear, but they overlap with projections of RC2-expressing radial glia (Figure 5). At P1, the subcortical α2 signal disappears, but these processes are still visible in L5/6 until P5. Within the superficial layers, expression of α2 increased at P1 along a lateral-to-medial gradient, with a narrow strip of expression primarily in L1 in the far lateral somatosensory cortex that widens to include L1-3 in more medial somatosensory cortex and L1-5 in motor cortex (Figure 2).
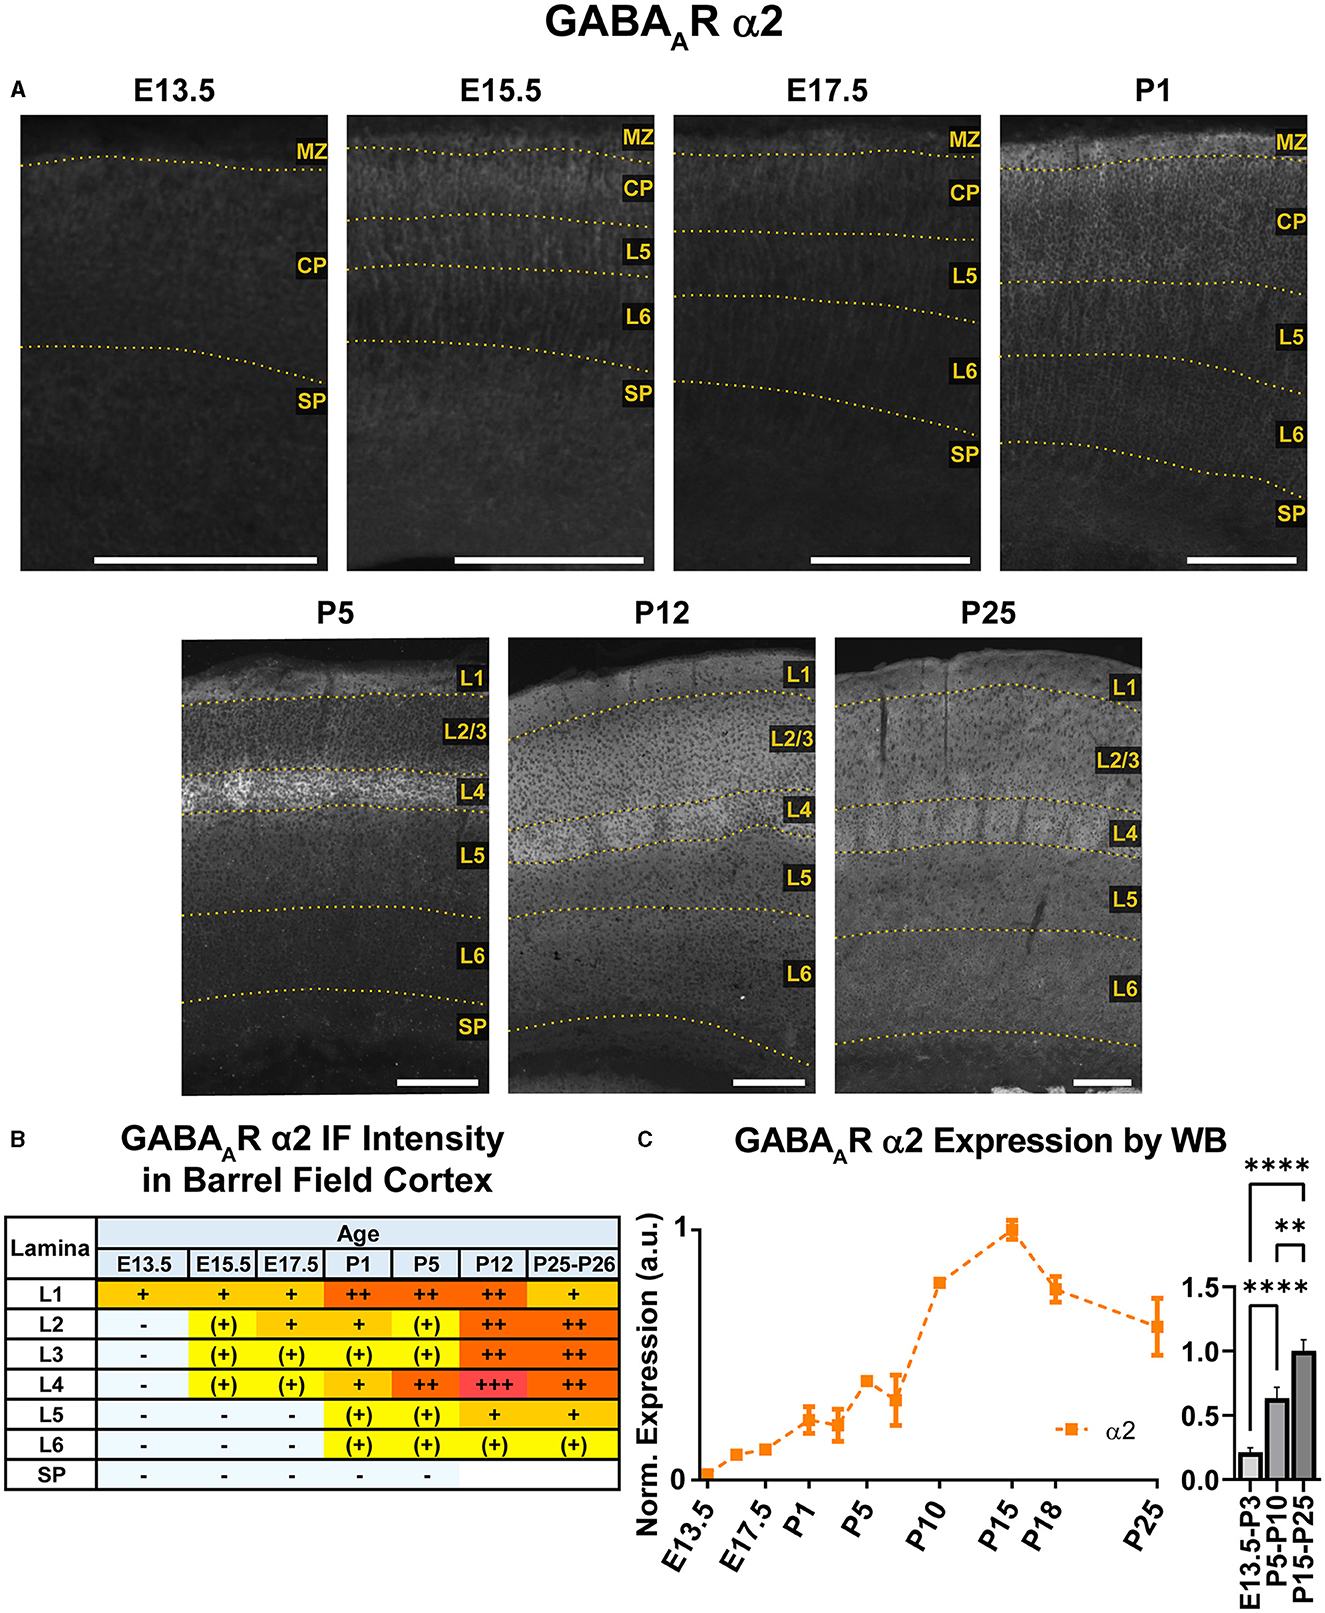
Figure 4. GABAAR α2 expression in barrel field cortex from embryonic age to maturity. (A) Exemplar images of α2 immunoreactivity in barrel field cortex across development. Scale bar = 250 μm. (B) Grading of immunofluorescence intensity across cortical lamina, where + + ++ is the maximal α2 signal that could be detected in brain at P26. (C) Quantification of GABAAR α2 protein in cortical samples by Western blot, with a timeline of all points on the left and binned stages tested for significance on the right. ****P < 0.0001, **P < 0.01 by one-way ANOVA with Šídák's multiple comparisons; n in mice/age: 3/E13.5; 3/E15.5, 3/E17.5, 6/P1, 4/P3, 5/P5, 5/P7, 4/P10, 3/P15, 4/P18, and 5/P25. L1–L6, layer 1–layer 6; MZ, marginal zone; SP, subplate; CP, cortical plate; also refer to “Lamina in Grading Table and Figures” section in Methods.
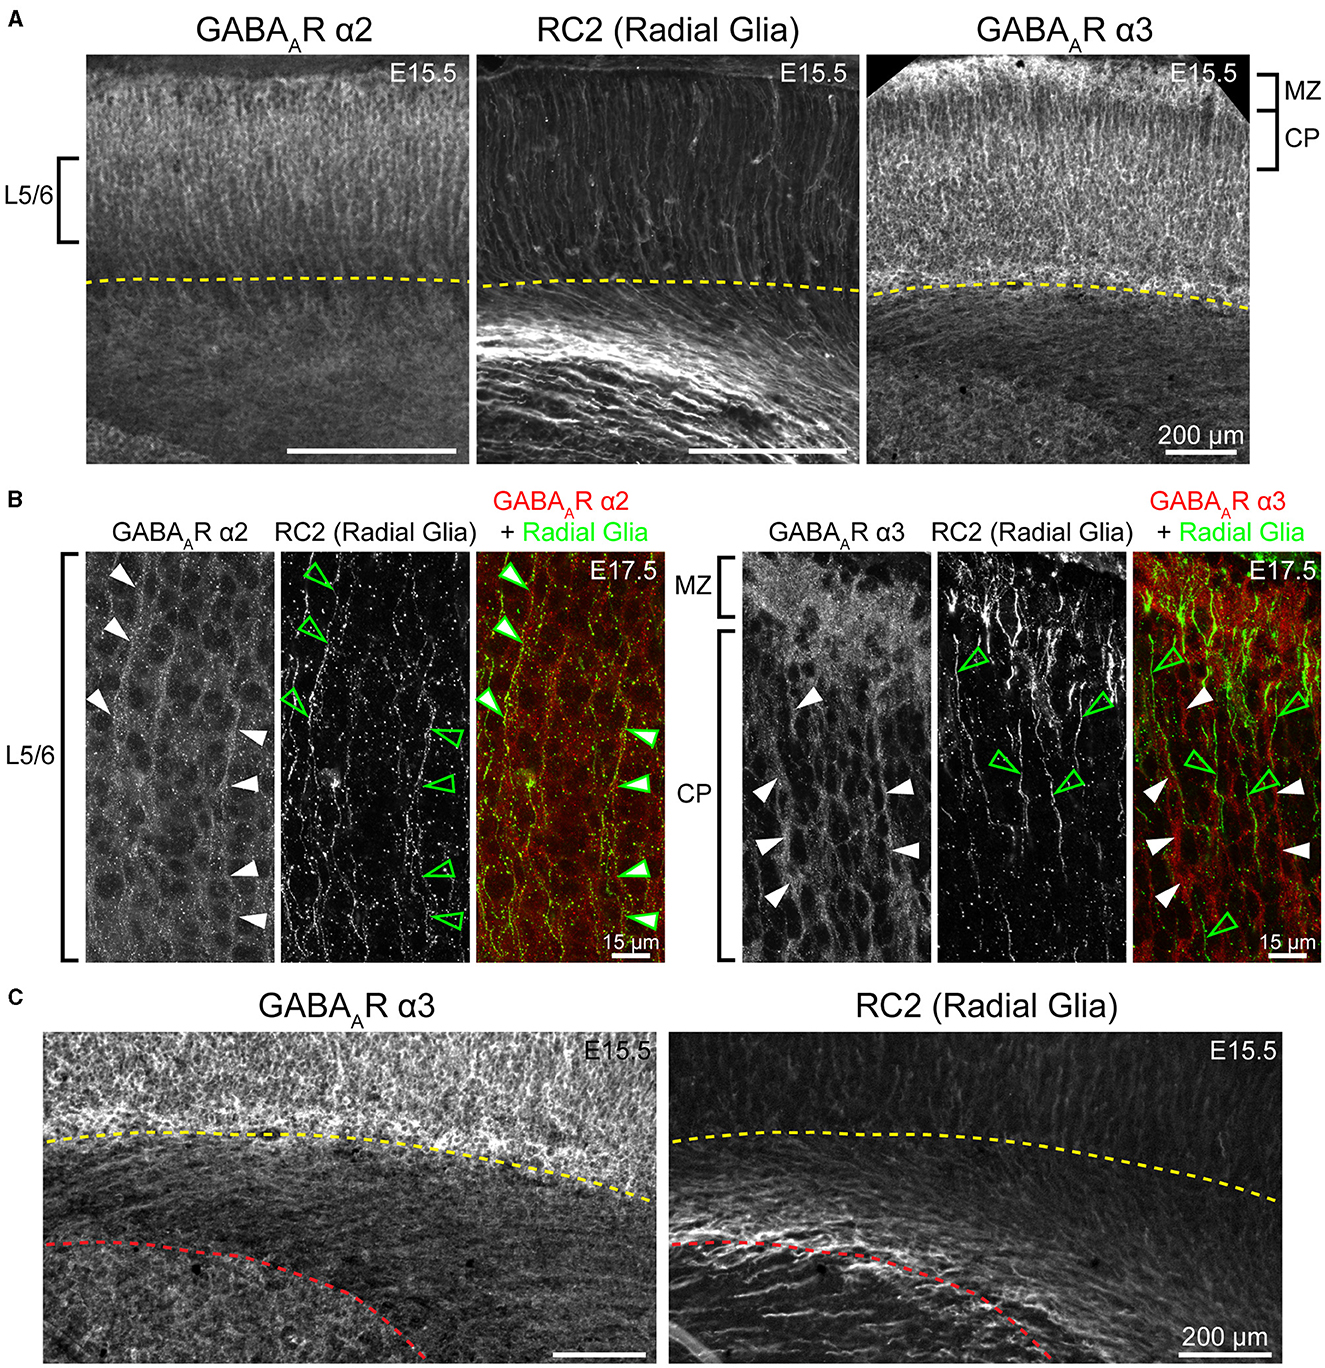
Figure 5. Fibers of radial glia co-localize with GABAAR α2, but not GABAAR α3. (A) Both GABAAR α2 and α3 immunolabeling showed a pattern of ascending cortical fibers, which are prominent in the CP/developing layers 2/3 for α3 (right) and are found throughout the cortical column for α2 (left) in embryonic and early postnatal period. These fibers resemble radial glia marked by RC2 (middle). (B) The radial glia marker RC2 co-localized with α2-immunopositive fibers (left, arrows), but not with α3-immunopositive fibers (right, arrows). Note that white arrows denote fibers immunopositive for α2 and α3, while green empty arrows indicate radial glia fibers. (C) Subcortical expression of α3-positive fibers has a different pattern than radial glia. The yellow dotted line in (A, C) indicates the basal margin of the subplate, while red dotted line in (C) indicates the margin between intermediate zone/white matter and the striatum. All images are oriented basal bottom to apical top.
By P5, there was an abrupt increase in α2 expression in L4, producing a transient pattern of highly restricted α2 expression to L1 and L4. While other GABAAR subunit proteins show a specific pattern in L4 somatosensory cortex at this age, the increased α2 expression is more widespread, involving L4 in most cortical areas, such as somatosensory, V1, parietal, auditory, and insular cortices (Figure 2). The one exception remains in adjacent motor cortex, where L4 is poorly distinguished from α2 expression in L2/3. By P12, the α2 expression becomes homogenous in L1-4, though it is still slightly higher in L4. Within L5/6, expression is overall lower, with a subtle band of elevated expression in L5b. This pattern persists at P26, albeit with modestly reduced overall expression. While our WB measurements and previous work (Fritschy et al., 1994) indicate a peak expression during the second or third postnatal week, we did not see a strong drop in tissue immunoreactivity within the somatosensory cortex at P26.
WB analysis showed high cortical levels of α3 during embryonic development, steadily increasing from E13.5 with a plateau between E17.5-P7, then decreasing to a lower plateau at P10 onwards that was significantly different from earlier postnatal expression (Figure 6; *P < 0.05 for P15-P25 vs. P5-P10). Our IHC analysis showed a highly lamina-specific pattern of α3 expression at all timepoints (Figures 2, 6). Expression of α3 first appeared in the MZ and subplate at E13.5 with lower levels throughout the CP. The subcortical band of α3 actually included the subplate and adjacent cell-poor zone below the CP, and this was present throughout the embryonic ages. Over development, this subplate-specific α3 expression merged with expression in L6 and became indistinguishable from L6 by P5. At E15.5, expression of α3 increased in lower portions of the CP (L5/6) with what appeared to be cytoplasmic expression of many cells superimposed on a more diffuse pattern (details best seen in Figure 5A). In contrast, there was little intrinsic α3 expression in the upper CP, although there were clear radial fibers extending from L5/6 that appeared to end in intensely stained dendritic tufts in L1 (Fritschy et al., 1998). This pattern of robust α3 in the lower CP with presumed dendrites in L2-4 persisted until P5. Compared to α2-positive fibers, these α3-stained fibers differed in a number of features. While α2-positive fibers were narrow and appeared primarily in deep cortical layers and the intermediate zone, the α3 fibers were found in superficial layers, were much thicker and numerous, and did not co-localize with RC2+ processes of radial glia (Figure 5). At P1 and P5, α3 expression levels continued to rise in cortical layers, making individual layers less distinct. Accordingly, the presumed dendrites were no longer visible in L2/3 after P5, although sparsely distributed α3+ fibers traversing across L4 can be seen as late at P26. Expression of α3 remained highest in the lower levels of cortex (L5/6) with a pattern of strong somatic expression in L5/6 that was superimposed on a lower diffuse level of α3 expression. By P12, this somatic pattern evolved to a more diffuse pattern.
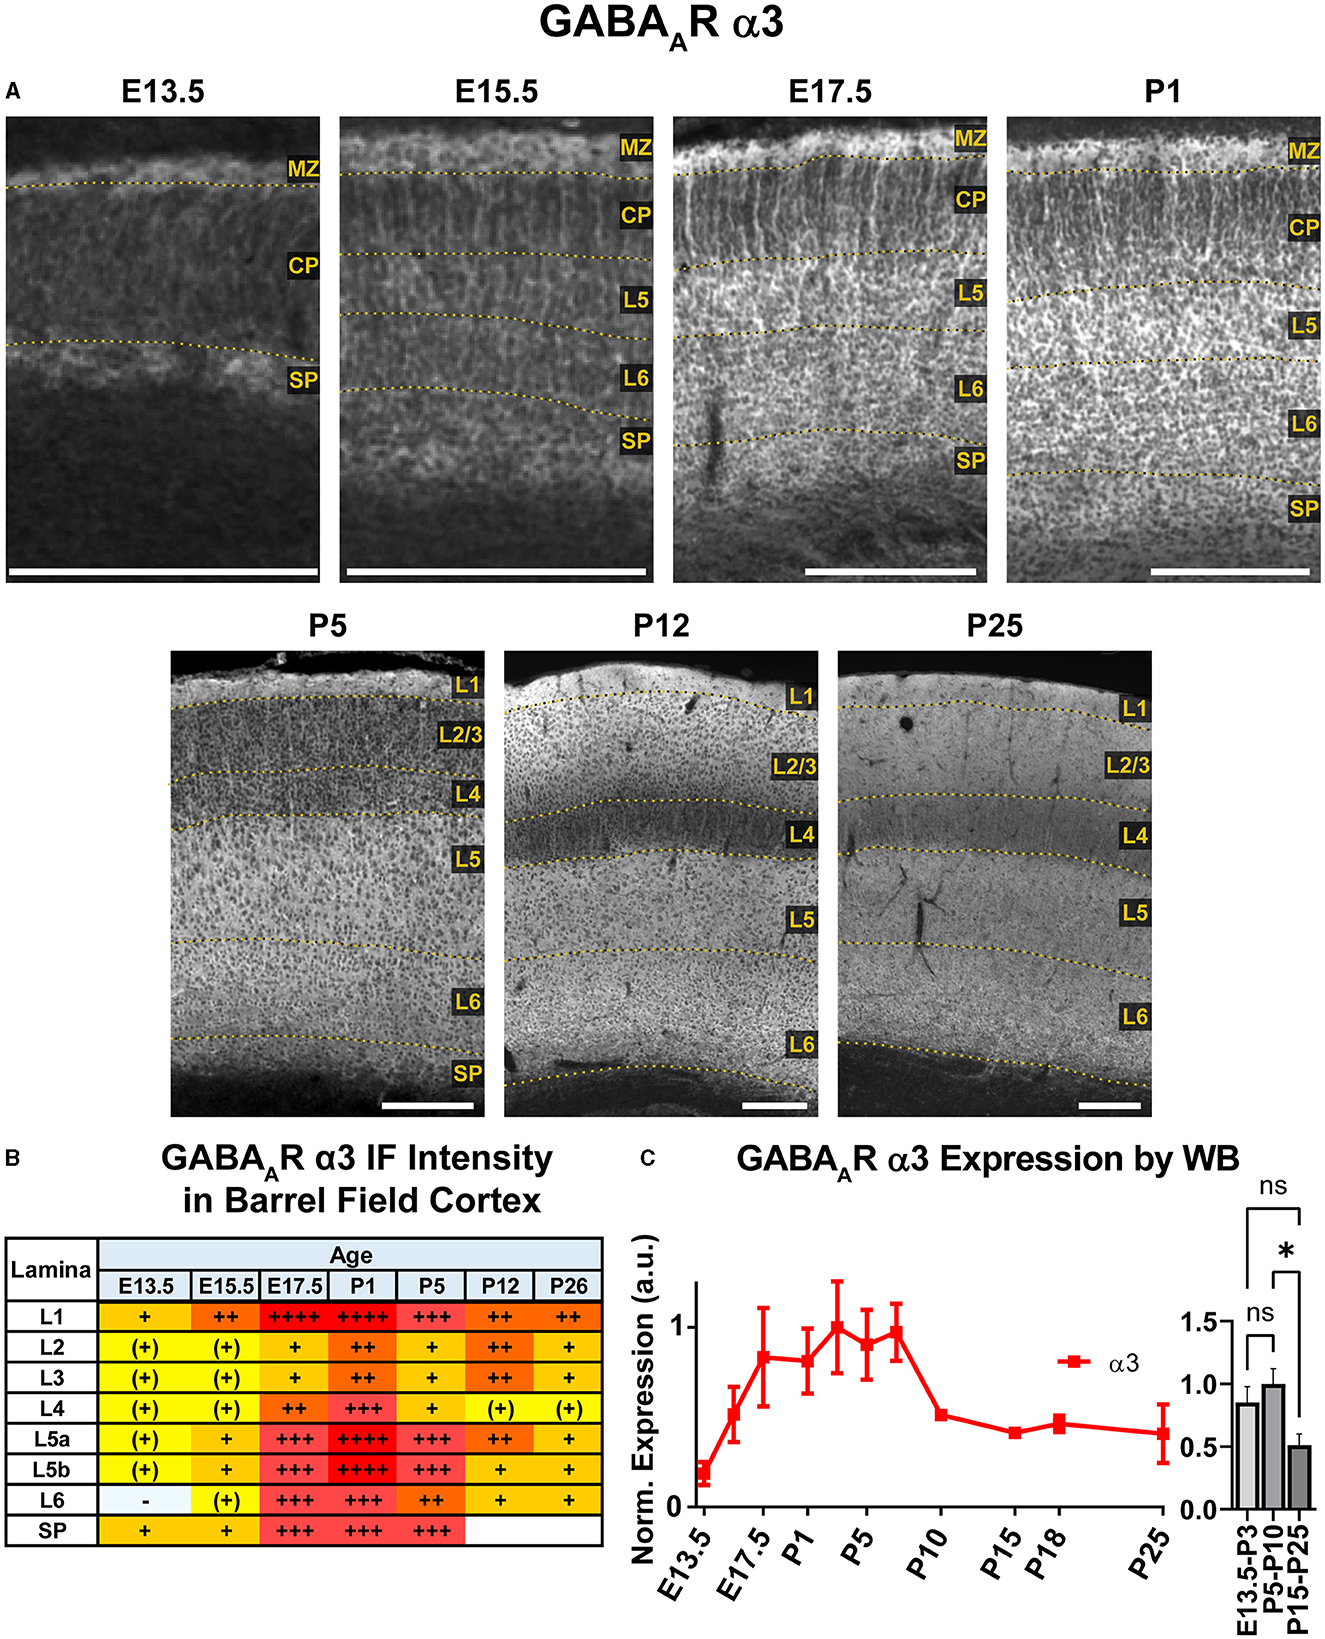
Figure 6. GABAAR α3 expression in barrel field cortex from embryonic age to maturity. (A) Exemplar images of α3 immunoreactivity in barrel field cortex across development. Scale bar = 250 μm. (B) Grading of immunofluorescence intensity across cortical lamina, where + + ++ is the maximal α3 signal that could be detected in brain at P26. (C) Quantification of GABAAR α3 protein in cortical samples by Western blot, with a timeline of all points on the left and binned stages tested for significance on the right. *P < 0.05 by one-way ANOVA with Šídák's multiple comparisons; n in mice/age: 3/E13.5; 3/E15.5, 3/E17.5, 6/P1, 4/P3, 6/P5, 6/P7, 4/P10, 3/P15, 4/P18, 6/P25. L1-L6, layer 1-layer 6; MZ, marginal zone; SP, subplate; CP, cortical plate; also refer to “Lamina in Grading Table and Figures” section in Methods.
In the mature brain, the subcortical white matter is generally devoid of any GABAAR subunit protein expression. However, between E15.5 and P1, we saw considerable subcortical α3 expression with apparent fiber tracks running parallel to lower margin of the CP. This pattern was most prominent at E17.5 and not seen in tissue from Gabra3 knockout mice (Figure 7). This was especially conspicuous in the internal capsule fibers seen running between the thalamus and basal ganglia, as well α3+ fascicles running through the caudate. The subcortical α3 signal was most prominent in the thalamocortical tracks passing through the basal ganglia and into the ventrolateral IZ. This signal was also seen in the external capsule, but not in other tracks like corpus callosum or the anterior commissure.
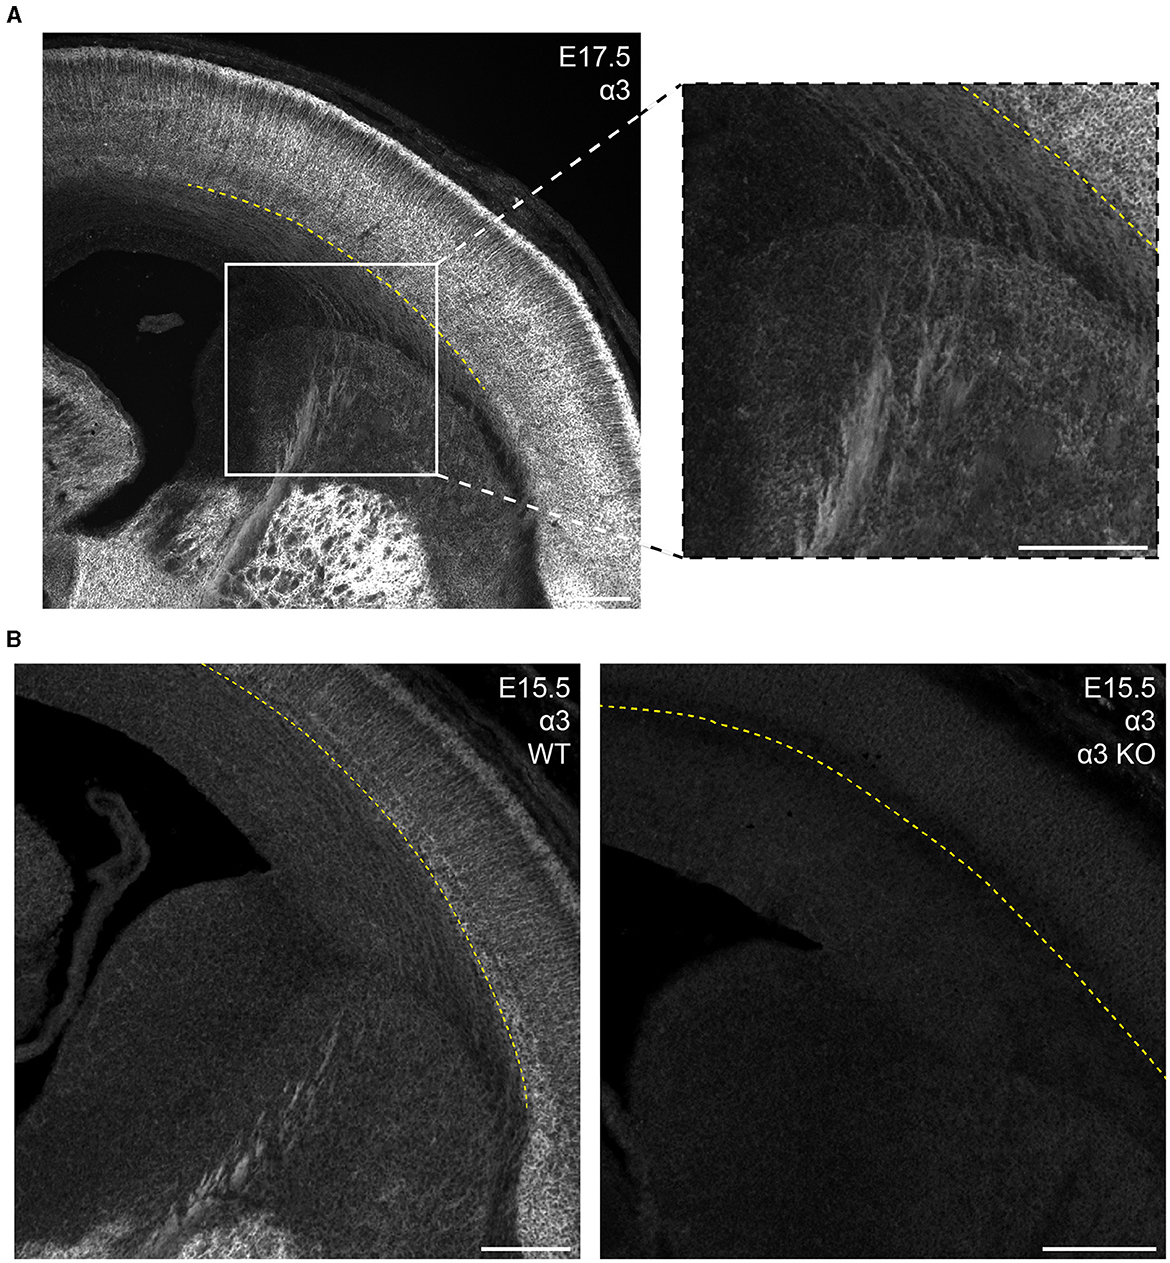
Figure 7. GABAAR α3 expression in fibers of the internal capsule during embryonic development. (A) E17.5 coronal section showing prominent α3 immunolabeling of internal capsule fibers in the white matter/intermediate zone located below the subplate and running medioventrally through the striatum. These regions of interest are enlarged in the inset. (B) α3-immunolabeled fibers are absent in the α3-knockout mouse (α3 KO, right), but consistently present in sections from wildtype mice (left). The yellow dotted line in (A, B) indicates the basal margin of the subplate. All images are oriented ventral bottom to dorsal top, with lateral cortex on the right.
Both WB and IHC data showed low cortical α4 expression in prenatal tissue that began to increase at P5, particularly in L1-4 by immunofluorescence (Figures 2, 8), though a significant difference by WB expression was only detected at P15-P25 compared to earlier ages (Figure 8, ****P < 0.0001). While α4 mRNA has been reported in embryonic ventricular and sub-ventricular zones (Laurie et al., 1992; Ma and Barker, 1995, 1998), we did not find significant/consistent expression of α4 protein in this area but cannot rule out expression below our level of detection. Similarly, there were very low or negligible α4 levels in the CP and subplate until after P1. By P5, there was distinct α4 expression in L4 of somatosensory cortex, which was slightly more intense in barrels. At P12 and P26, there was increasing α4 expression throughout L1-4 that remained most prominent in L4 of motor and somatosensory cortex. This was especially prominent in the barrels, where α4 expression peaked at P12 and was on par with P26 thalamus, our reference ROI for maximal α4 intensity signal (Figure 1). In L5/6, α4 expression increased slightly at P12 and P26, but remained at a generally low level.
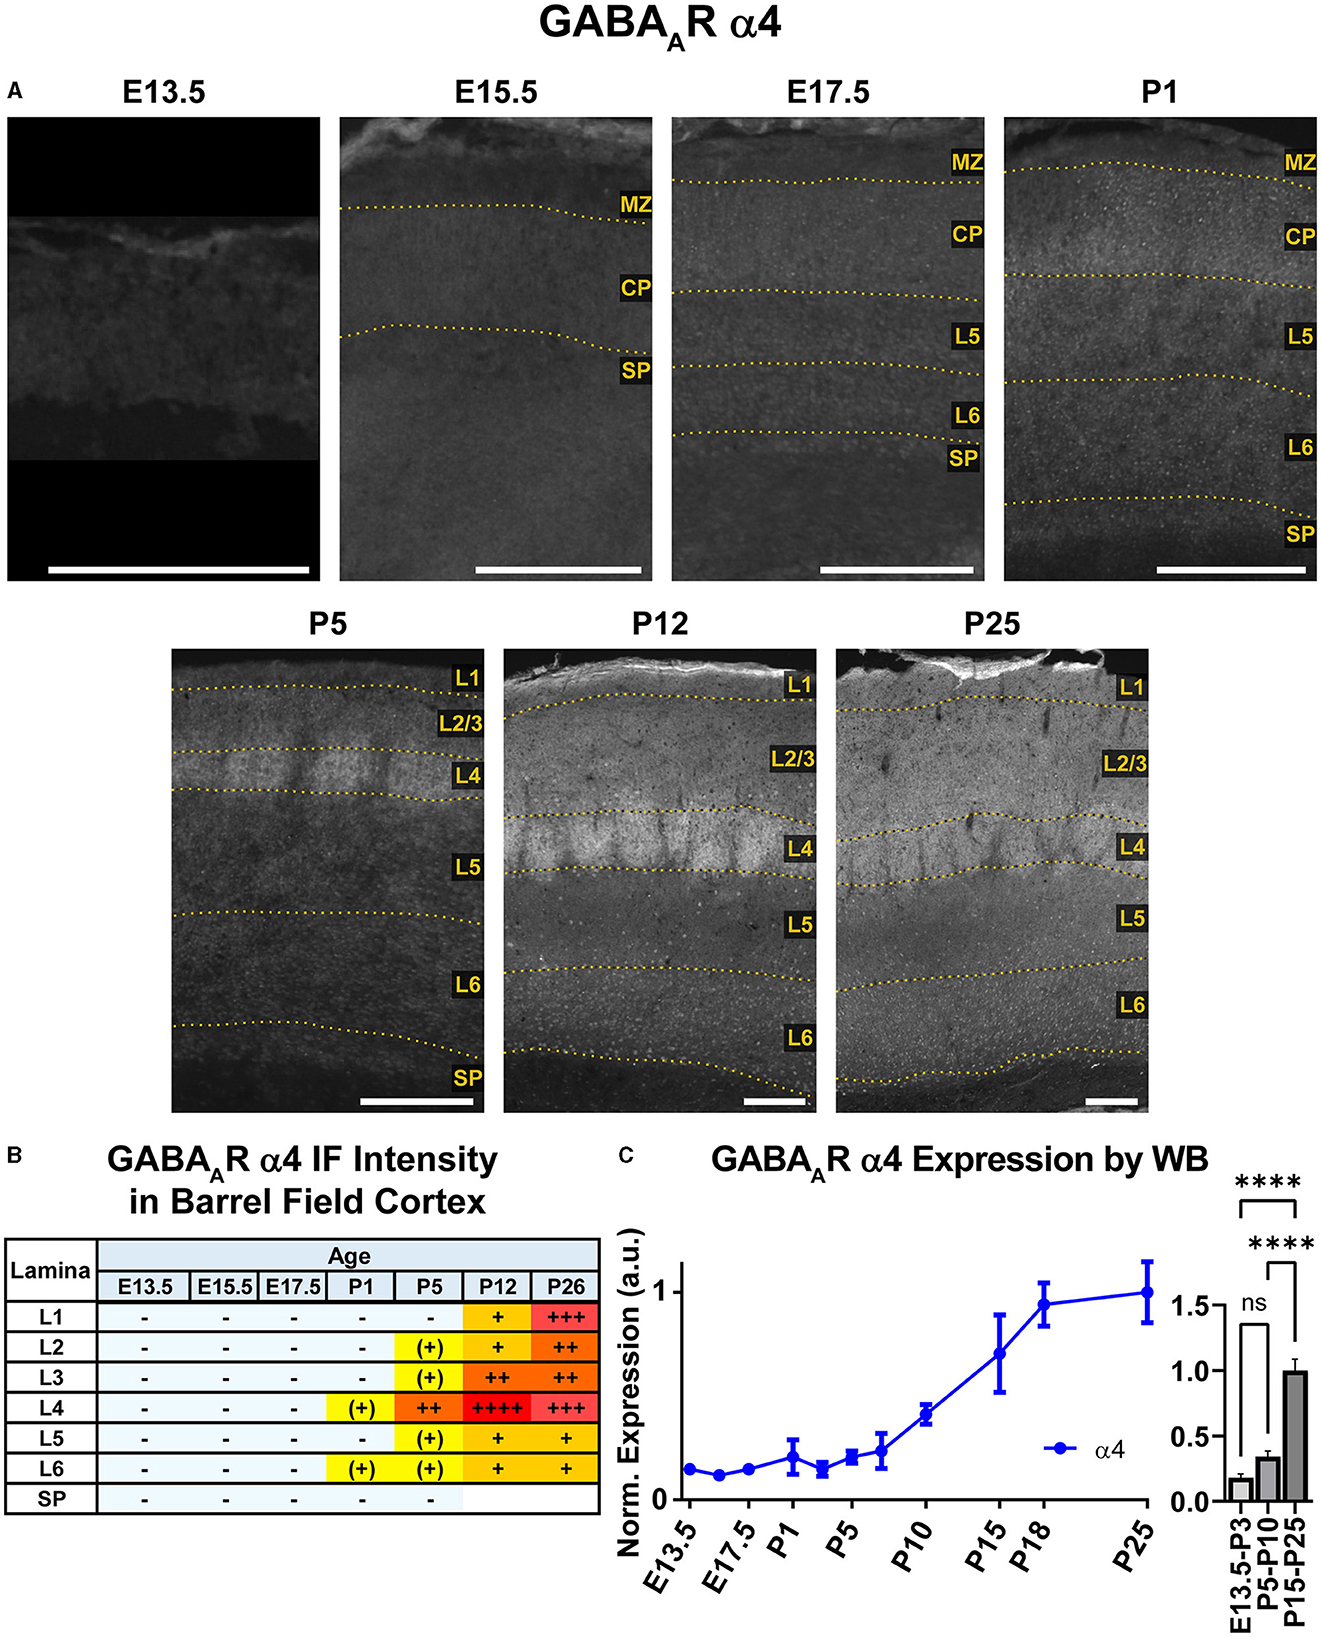
Figure 8. GABAAR α4 expression in barrel field cortex from embryonic age to maturity. (A) Exemplar images of α4 immunoreactivity in barrel field cortex across development. Scale bar = 250 μm. (B) Grading of immunofluorescence intensity across cortical lamina, where + + ++ is the maximal α4 signal that could be detected in brain at P26. (C) Quantification of GABAAR α4 protein in cortical samples by Western blot, with a timeline of all points on the left and binned stages tested for significance on the right. ****P < 0.0001 by one-way ANOVA with Šídák's multiple comparisons; n in mice/age: 3/E13.5; 3/E15.5, 3/E17.5, 6/P1, 3/P3, 4/P5, 3/P7, 6/P10, 3/P15, 5/P18, and 4/P25. L1–L6, layer 1–layer 6; MZ, marginal zone; SP, subplate; CP, cortical plate; also refer to “Lamina in Grading Table and Figures” section in Methods.
Our WB experiments showed low embryonic and perinatal expression of α5 that suddenly increased and peaked between P1-P10, then decreased to a moderate level from P15 onwards and showed a statistically significant difference between all three developmental stages (Figure 9; ****P < 0.0001 E13.5-P3 vs. P5-P10 and P15-P25, ****P < 0.0001 P5-P10 vs. P15-P25). In immunostained sections (Figures 2, 9), the first clear expression of α5 was seen at E13.5 in the subplate, but nowhere else. There was a clear lateral to medial gradient, with highest expression in the lateral subplate and claustrum (Figure 2). Prominent α5 in subplate was a persistent feature at all ages studied. There was even a band of higher α5 signal at the lower edge of L6 as late as P26, although we were unable to distinguish L6b vs. subplate after P5 (Viswanathan et al., 2016). At E15.5, α5 was expressed in the MZ, with lower levels in the mid-CP/L5, creating a trilaminar pattern of MZ/L5/subplate. There was relatively little α5 in other layers. At E17.5/P1, α5 expression increased, especially in the upper portions of L5 (L5a). The pattern of expression was mostly as a perisomatic rim around individual cells overlying a more diffuse pattern of α5 expression. There was relatively little α5 in L2-4, although α5+ dendrites from L5 could be seen traversing L2-4 until about P5.
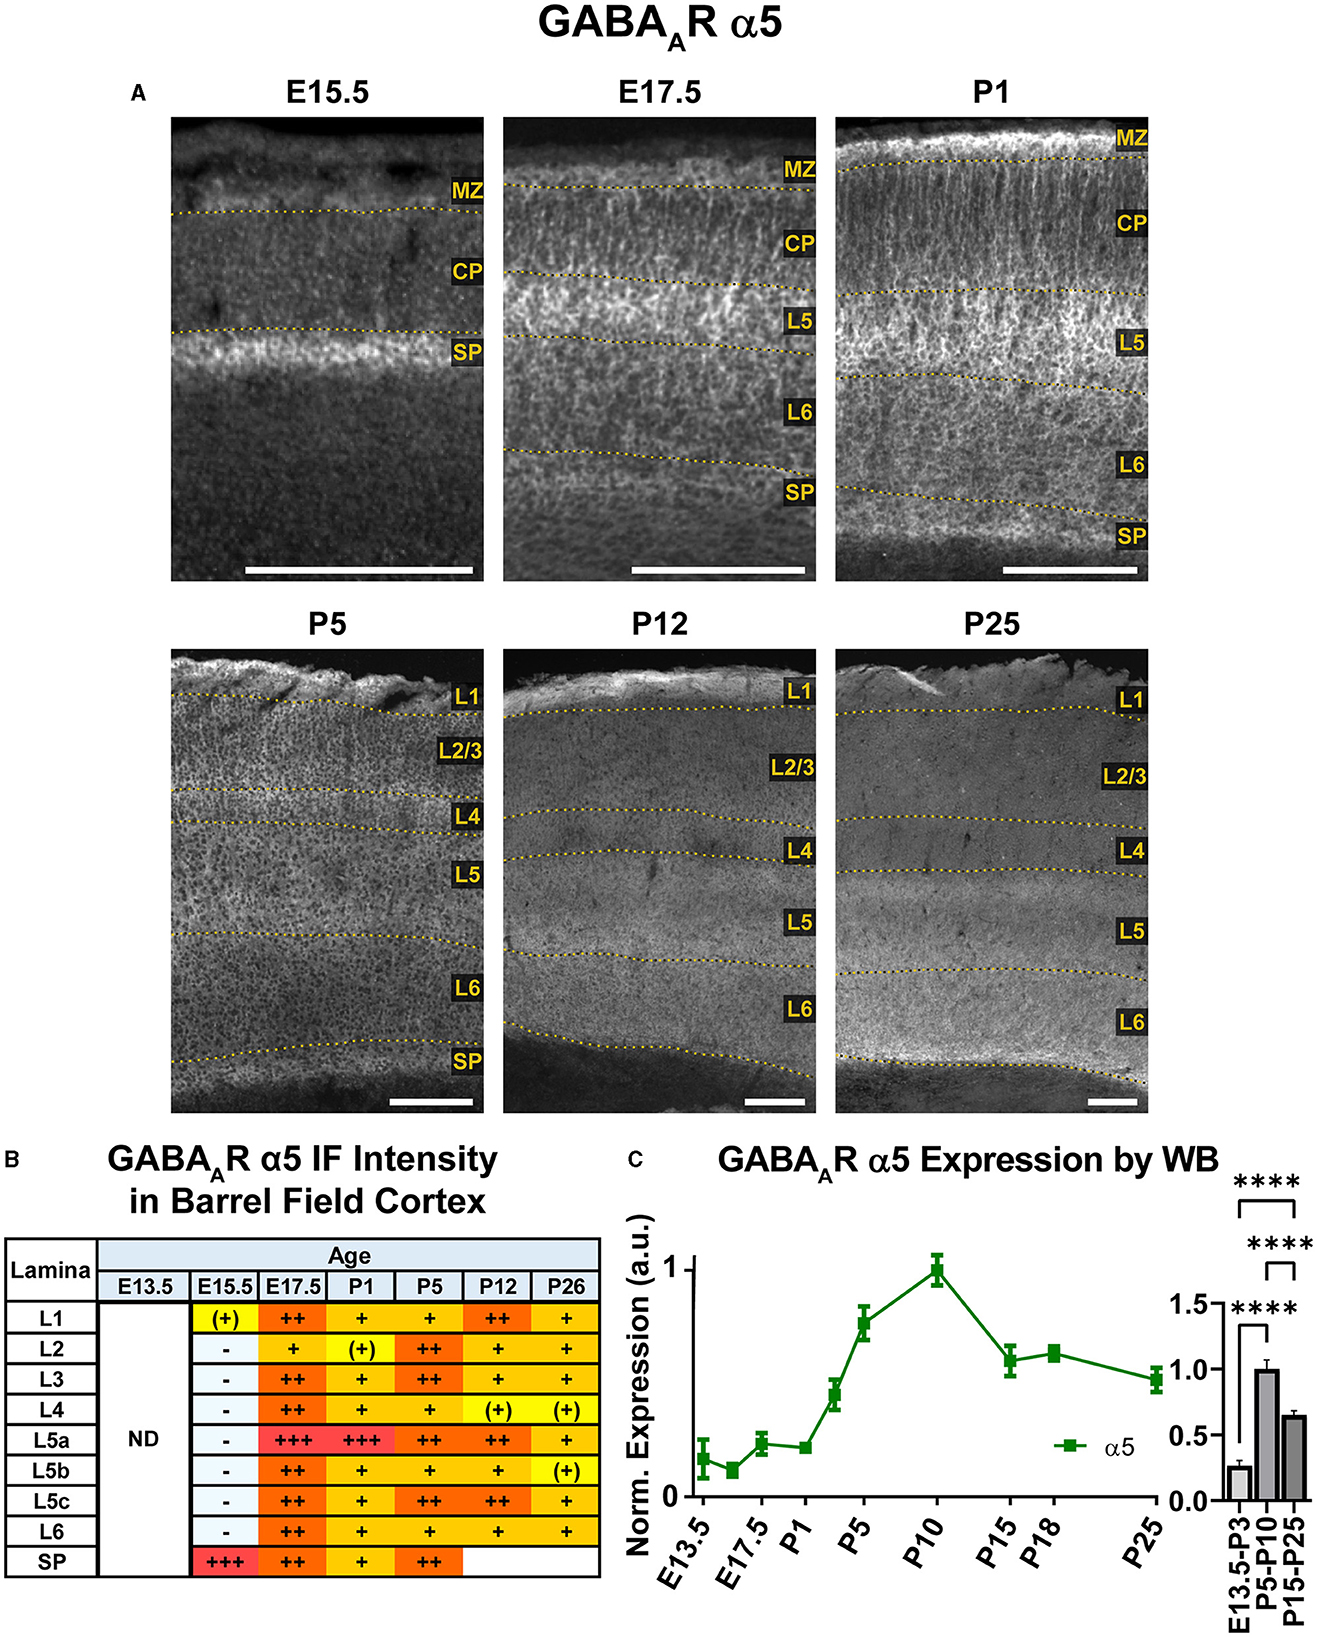
Figure 9. GABAAR α5 expression in barrel field cortex from embryonic age to maturity. (A) Exemplar images of α5 immunoreactivity in barrel field cortex across development. Scale bar = 250 μm. (B) Grading of immunofluorescence intensity across cortical lamina, where + + ++ is the maximal α5 signal that could be detected in brain at P26. (C) Quantification of GABAAR α5 protein in cortical samples by Western blot, with a timeline of all points on the left and binned stages tested for significance on the right. ****P < 0.0001 by one-way ANOVA with Šídák's multiple comparisons; n in mice/age: 3/E13.5; 3/E15.5, 3/E17.5, 3/P1, 3/P3, 4/P5, 3/P7, 5/P10, 3/P15, 7/P18, and 6/P25. L1–L6, layer 1–layer 6; MZ, marginal zone; SP, subplate; CP, cortical plate; ND, not determined; also refer to “Lamina in Grading Table and Figures” section in Methods.
There were significant changes in α5 expression around P5, with most cortical areas showing increased expression in the upper half of cortex, especially L4. However, a distinctly different pattern was seen in the barrel cortex, where α5 virtually disappeared from L2-4. This created an abrupt margin between barrel cortex and the adjacent somatosensory and motor cortices (Figure 2). A similar loss of α5 in L2-4 was seen in primary visual cortex (V1), but not in adjacent cortices (not shown). This pattern in primary sensory cortex and V1 was also reported by Paysan et al. (1997) at P7, who found it was dependent on early sensory input, and could be prevented by ablation of the ventrobasal or lateral geniculate nuclei of thalamus. At around P5, we could also begin to appreciate more complex sublamina in lower cortex, with moderate levels in L5a and L5c/L6a, but lower levels in L5b and L6. This distinct pattern was first seen at P5, but most clearly at P12. The previously noted pattern of somatic α5 superimposed on a diffuse background of α5 persisted in lower cortex until at least P12, with somewhat more numerous cell bodies in L5b and subplate. However, the distinction between somata and neuropil was never as clear as that seen at E17.5/P1. At P26, α5 expression became more diffuse, and individual dendrites and cell bodies became poorly distinguishable. Expression approached moderate levels in all cortical regions and layers, but previous patterns of α5 expression were still apparent; namely, barrel field cortex had lower expression than other cortical regions, deeper cortical layers showed a complex sublaminar expression pattern, and expression in L2/3 was lower than in other layers.
An overview of δ subunit expression is shown together with β2, β3, and γ2 in Figure 10. We detected essentially no embryonic or perinatal expression of the δ subunit in cortex by IHC or WB. By WB, we began to see low cortical expression of δ around P10 that quickly rose to a plateau level at P15-P25, showing a statistically significant difference from earlier ages (Figure 11; ****P < 0.0001 P15-P25 vs. earlier ages). However, δ IHC expression in sections (Figures 10, 11) first appeared at P5 as a diffuse signal in L4, most prominently in the barrel cortex, with lower levels in the rest of somatosensory cortex. By P12 and P26, this diffuse pattern of expression increased in all layers, but remained highest in L4 in barrels and relatively low in L5/6.
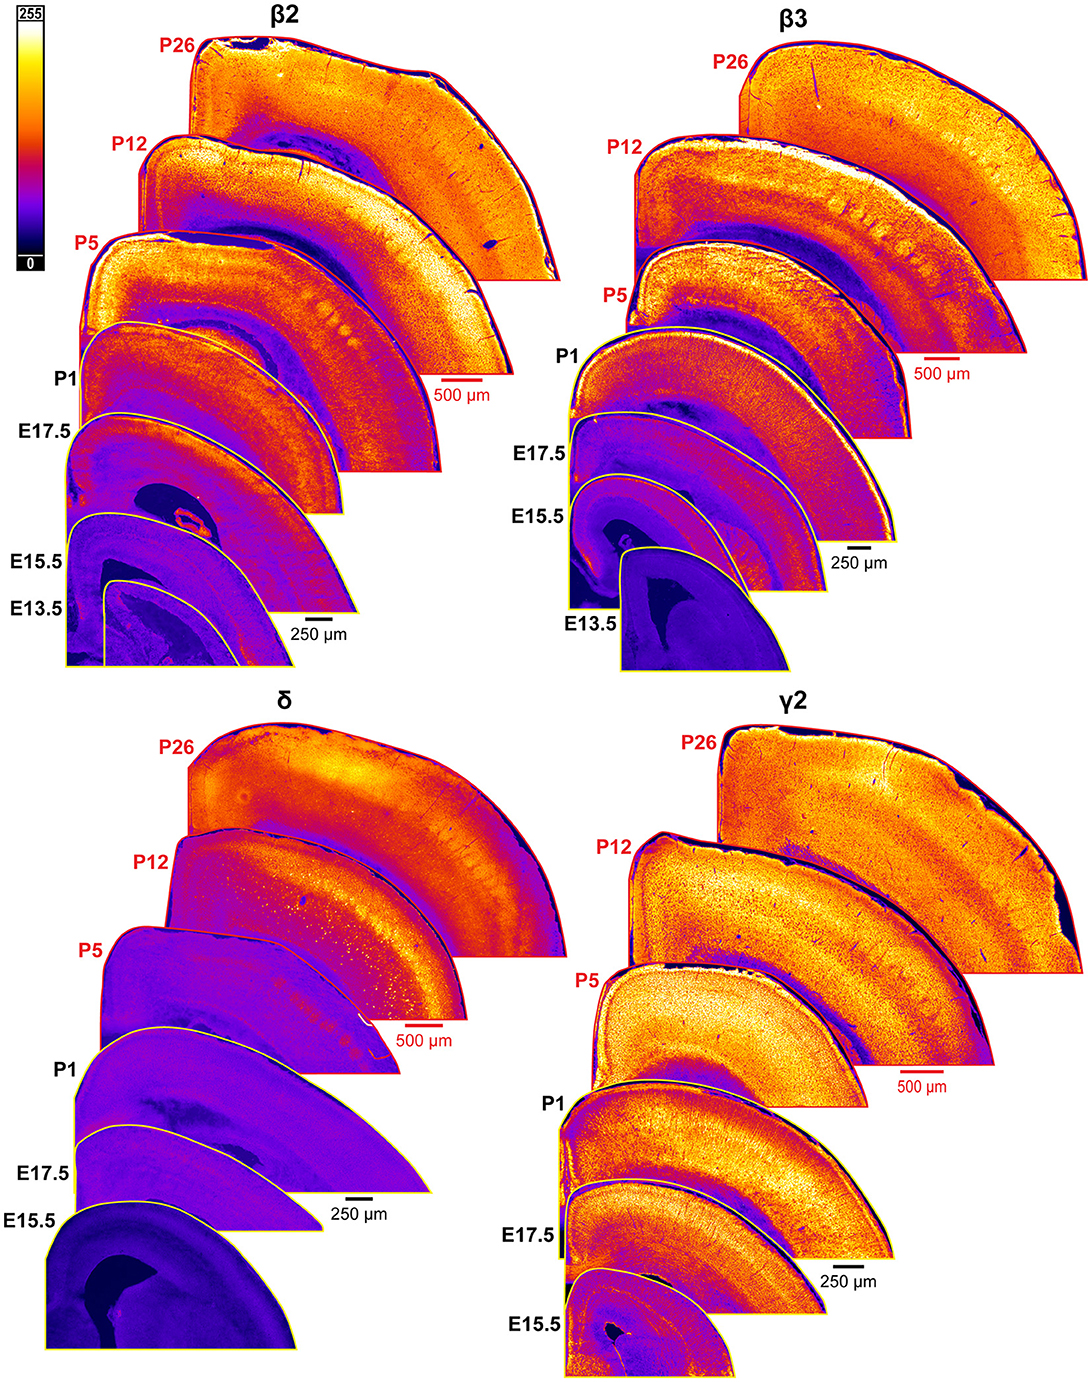
Figure 10. Expression of GABAAR β2, β3, δ, and γ2 subunits in developing cortex. Coronal sections are overlaid from embryonic day E13.5/E15.5 on the bottom left to postnatal day 26 on the top right separately for each subunit. All sections are oriented from ventral bottom to dorsal top, with lateral cortex on the right. Separate scaling has been used for sections E13.5-P1 (black scale bar) and P5-P26 (red scale bar), separately for each subunit. Signal is represented using a heat map lookup table to highlight differences in regional expression. Heatmap intensity scaling is shown by the bar in top left.
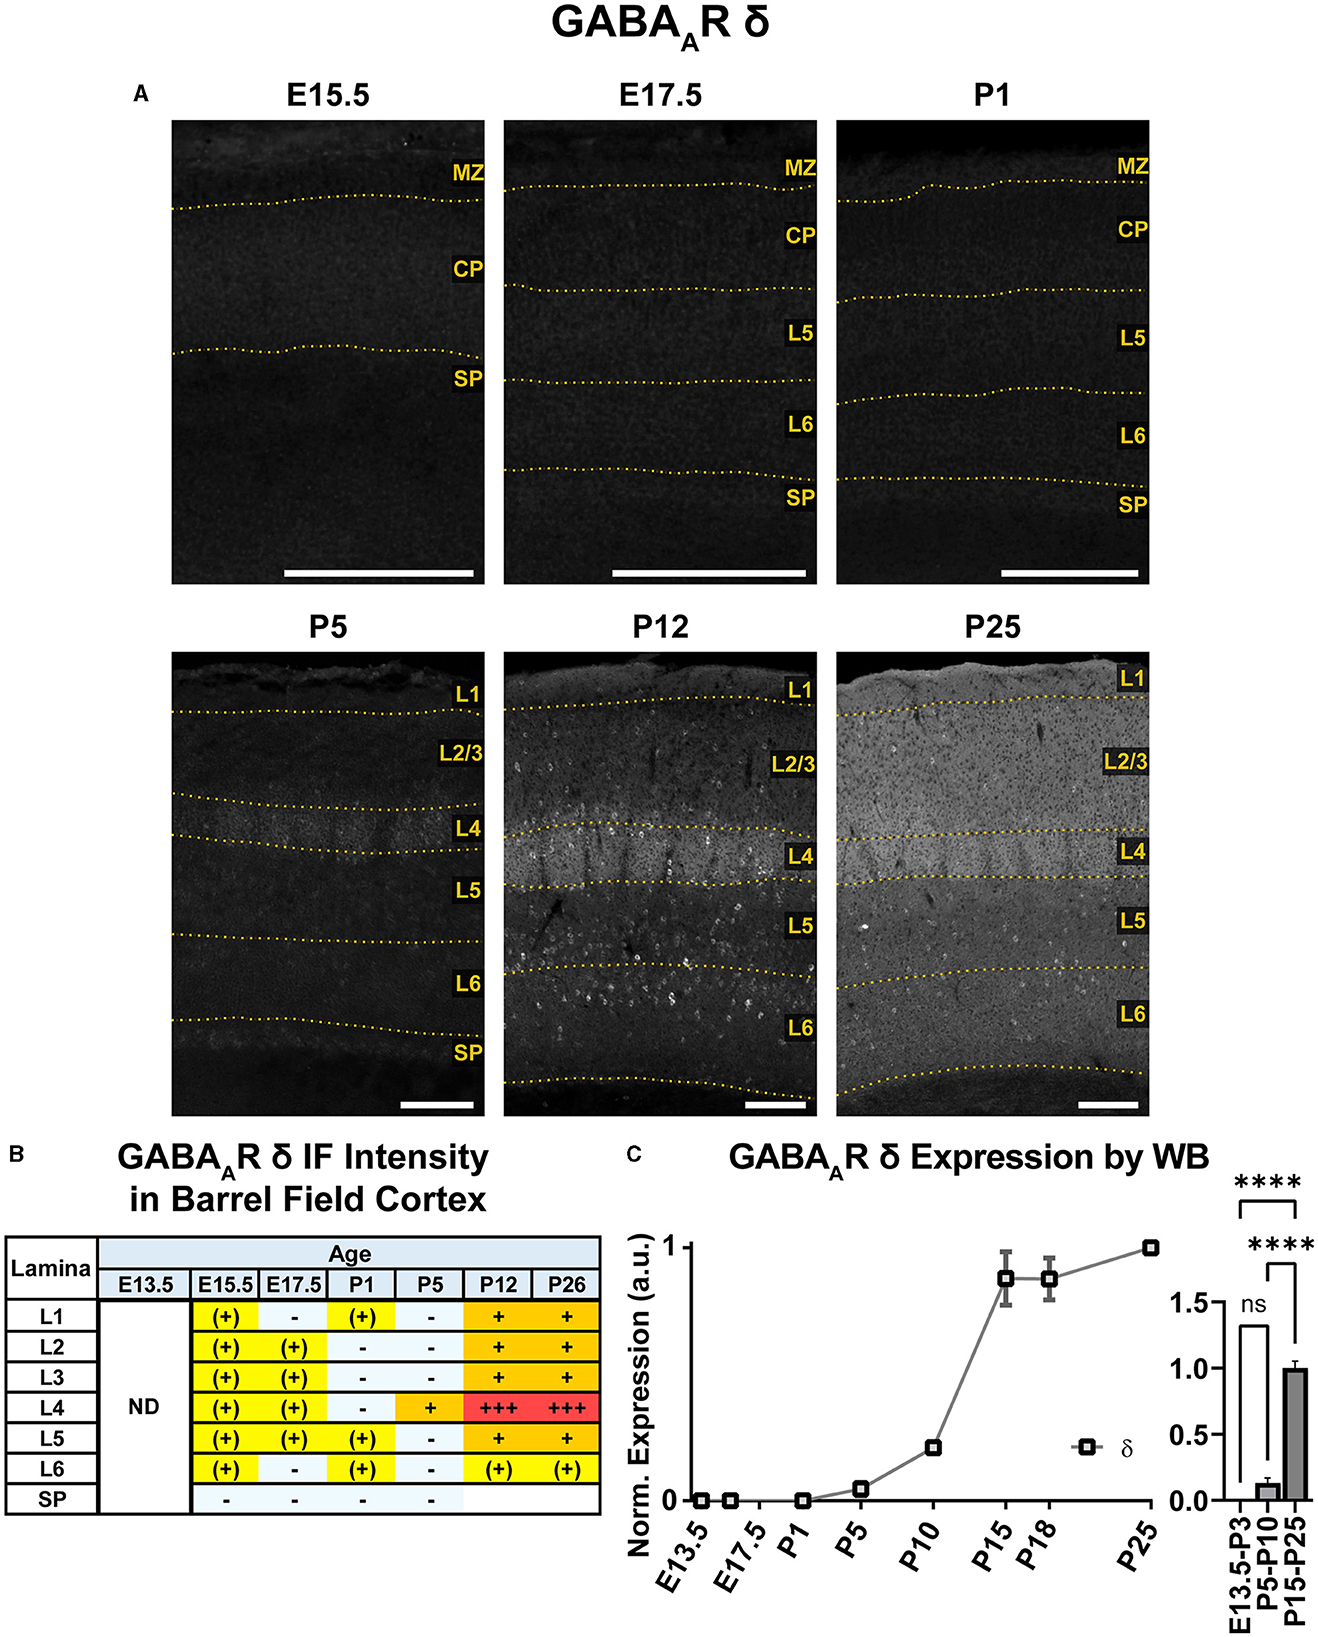
Figure 11. GABAAR δ expression in barrel field cortex from embryonic age to maturity. (A) Exemplar images of δ immunoreactivity in barrel field cortex across development. Scale bar = 250 μm. (B) Grading of immunofluorescence intensity across cortical lamina, where + + ++ is the maximal δ signal that could be detected in brain at P26. (C) Quantification of GABAAR δ protein in cortical samples by Western blot, with a timeline of all points on the left and binned stages tested for significance on the right. ****P < 0.0001 by one-way ANOVA with Šídák's multiple comparisons; n in mice/age: 4/E13.5; 3/E15.5, 4/P1, 4/P5, 3/P10, 4/P15, 5/P18, and 3/P25. L1–L6, layer 1–layer 6; MZ, marginal zone; SP, subplate; CP, cortical plate; ND, not determined; also refer to “Lamina in Grading Table and Figures” section in Methods.
Superimposed upon this diffuse layer-specific pattern of expression, there were scattered δ+ cell bodies in cortex and hippocampus as early as P5, which became much more evident at P12 and P26. However, these cells were somewhat less visually distinct at P26, likely due to increasing background δ subunit expression. Density of these cells was greatest in L4, L5, and subplate but and very sparse in L1 and lower portions of L6.
Our WB results showed that γ2 expression begins early in development and exhibits a steady increase from E13.5 to P26 that was statistically significant (Figure 12; **P < 0.01 E13.5-P3 vs. P5-P10, ***P < 0.0001 P15-P25 vs. P5-P10). Immunofluorescent stains showed a layer-specific pattern of γ2 expression (Figures 10, 12). As early as E15.5, we detected low levels of γ2 immunoreactivity in the MZ and subplate. At E17.5 and P1, γ2 was expressed throughout the CP, especially in L5. At P5, expression increased in all layers, but was highest in L4/L5 and was especially pronounced in the L4 barrels. At P12, γ2 expression was prominent in all layers, particularly high in L2-4 and L6. However, at the same time γ2 expression in L5 rose less significantly, so this layer was easily distinguishable from the higher expression in all other layers. Within L6, heightened expression was centered in L6a, but spread into L5c and top of L6b. These P12 patterns were preserved at P26.
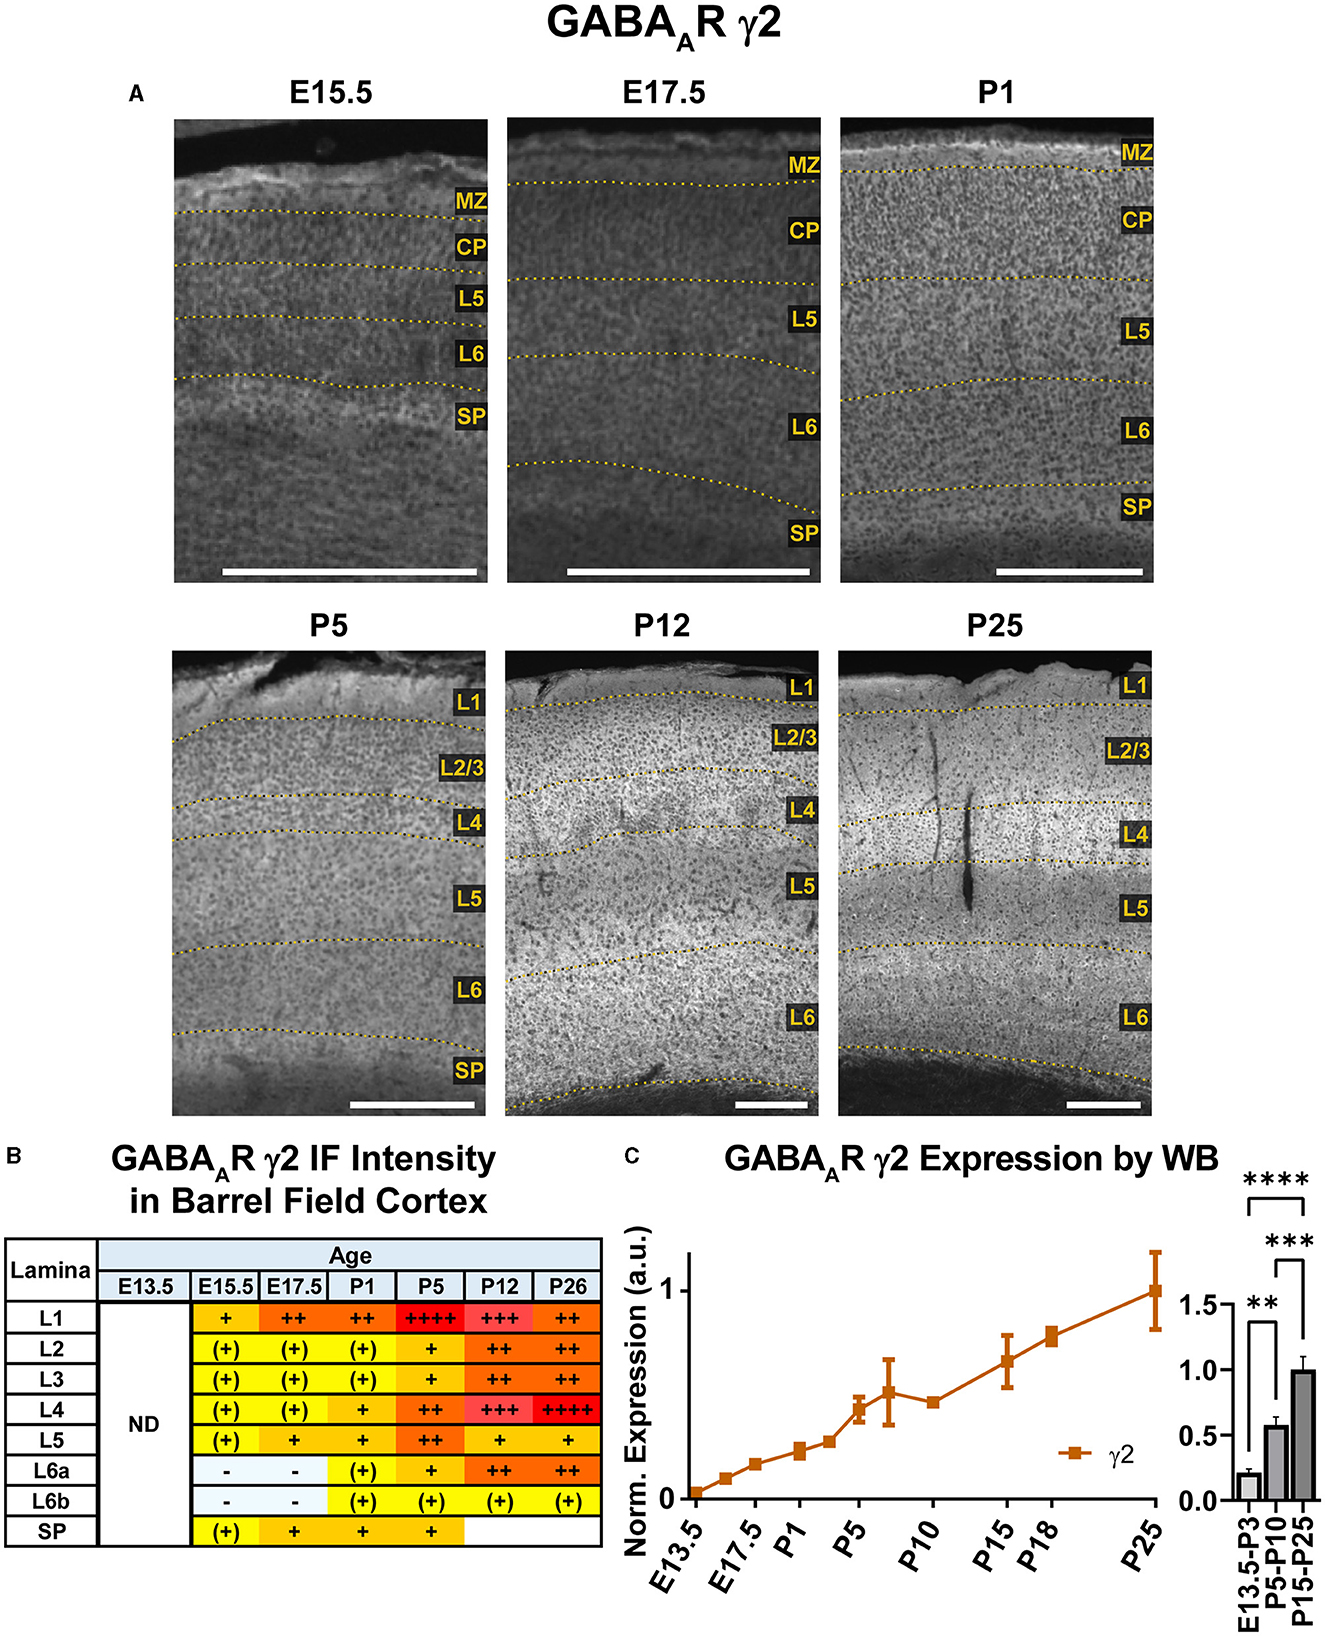
Figure 12. GABAAR γ2 expression in barrel field cortex from embryonic age to maturity. (A) Exemplar images of γ2 immunoreactivity in barrel field cortex across development. Of note, the sections shown here were stained at the same time, but L1 was damaged in the P12 sections. Scale bar = 250 μm. (B) Grading of immunofluorescence intensity across cortical lamina, where + + ++ is the maximal γ2 signal that could be detected in brain at P26. (C) Quantification of GABAAR γ2 protein in cortical samples by Western blot, with a timeline of all points on the left and binned stages tested for significance on the right. ****P < 0.0001, ***P < 0.001, **P < 0.01 by one-way ANOVA with Šídák's multiple comparisons; n in mice/age: 3/E13.5, 3/E15.5, 3/E17.5, 6/P1, 3/P3, 3/P5, 3/P7, 3/P10, 4/P15, 4/P18, and 4/P25. L1–L6, layer 1–layer 6; MZ, marginal zone; SP, subplate; CP, cortical plate; ND, not determined; also refer to “Lamina in Grading Table and Figures” section in Methods.
WB immunoreactivity showed moderate β2 expression throughout the embryonic period that exhibited a steady increase to high levels in the postnatal period that was statistically significant (Figure 13; ***P < 0.001 E13.5-P3 vs. P5-P10, ****P < 0.0001 P5-P10 vs. P15-P25). In immunostained brain sections (Figures 10, 13), expression of β2 was seen as early as E13.5 in the MZ and subplate, followed by low levels of β2 in CP by E15.5/E17.5. This cortical expression was relatively featureless from E15.5 to P1, but showed a steady, progressive increase that was not as readily apparent in the WB data. A distinct subplate could be seen from E13.5–E17.5 but blended into L6 at P1 and later ages. Prominent expression in MZ/L1 became clear at E17.5 and was present at all ages.
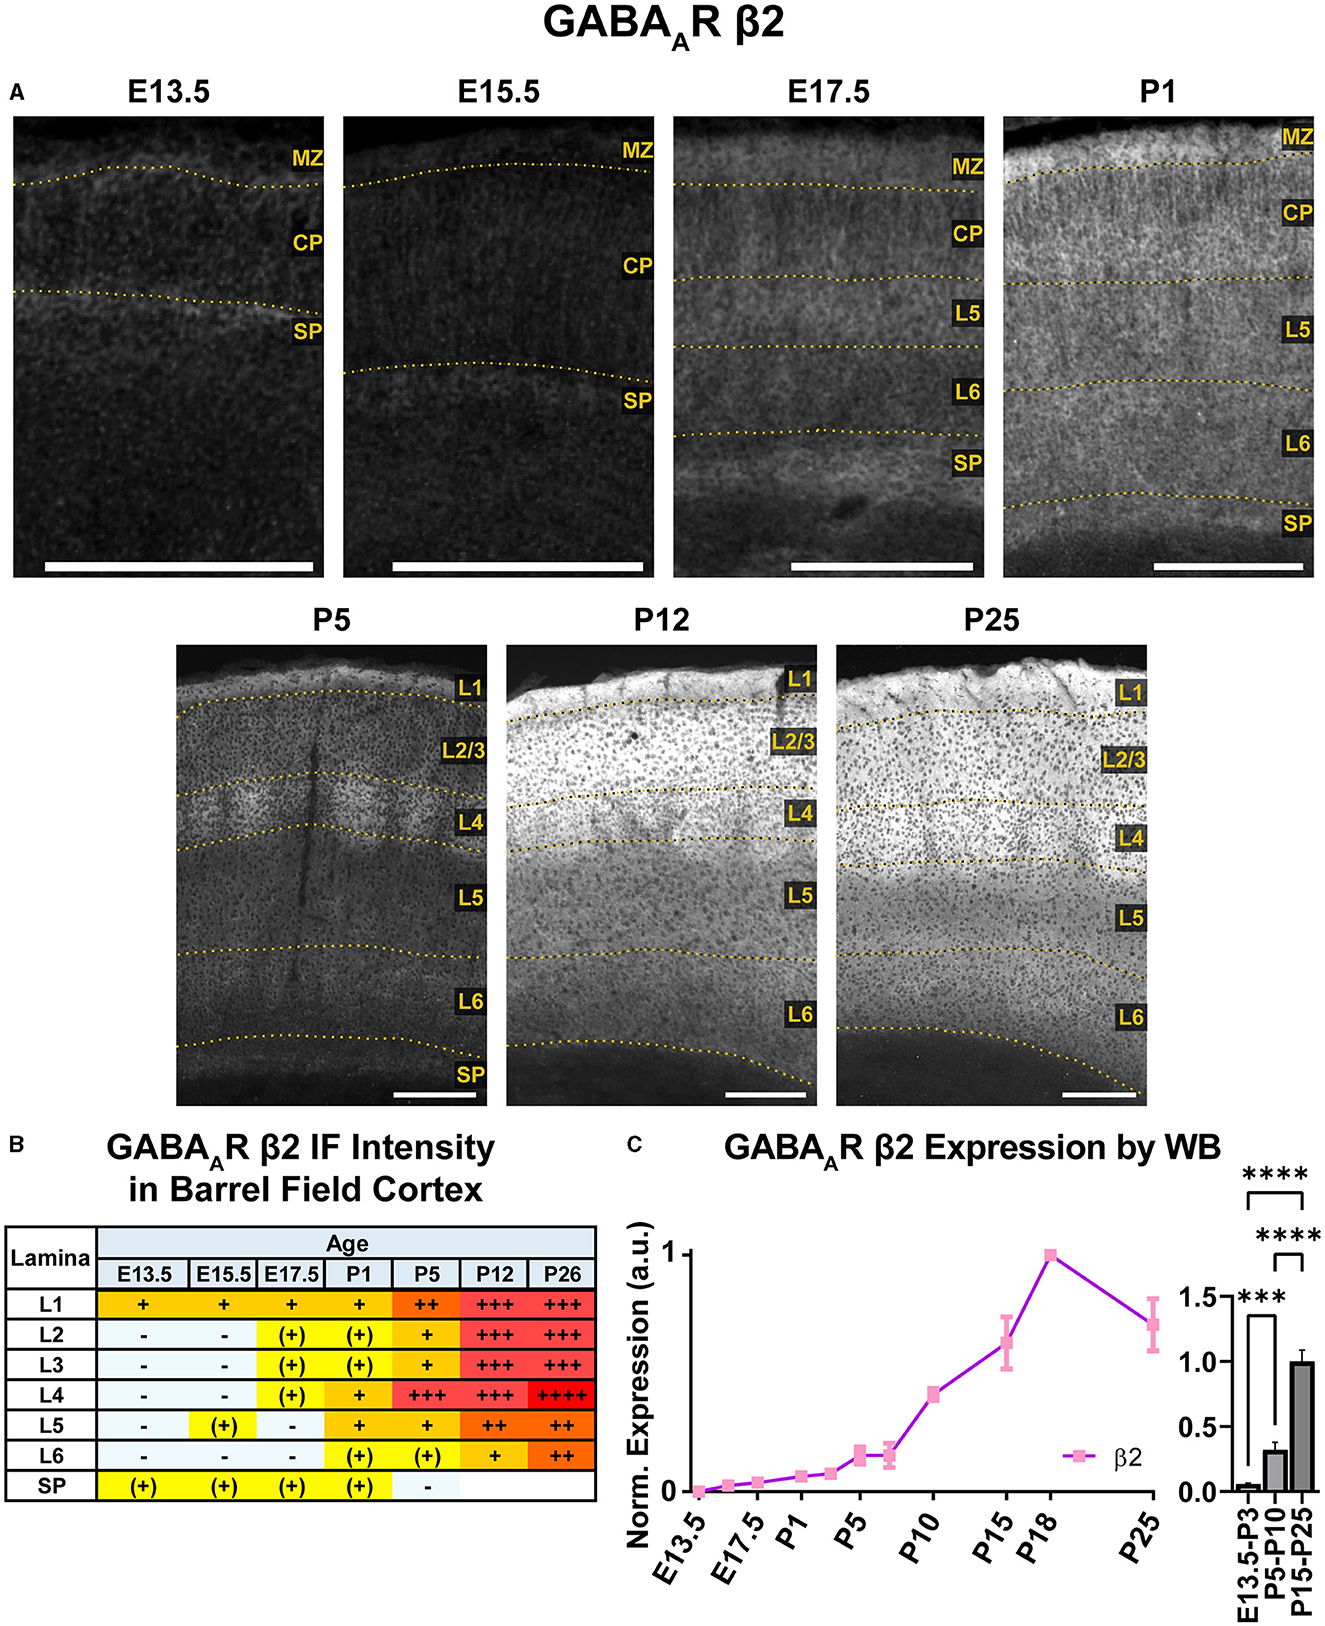
Figure 13. GABAAR β2 expression in barrel field cortex from embryonic age to maturity. (A) Exemplar images of β2 immunoreactivity in barrel field cortex across development. Scale bar = 250 μm. (B) Grading of immunofluorescence intensity across cortical lamina, where + + ++ is the maximal β2 signal that could be detected in brain at P26. (C) Quantification of GABAAR β2 protein in cortical samples by Western blot, with a timeline of all points on the left and binned stages tested for significance on the right. ****P < 0.0001, ***P < 0.001 by one-way ANOVA with Šídák's multiple comparisons; n in mice/age: 3/E13.5; 3/E15.5, 3/E17.5, 6/P1, 3/P3, 3/P5, 3/P7, 4/P10, 3/P15, 4/P18, and 3/P25. L1–L6, layer 1–layer 6; MZ, marginal zone; SP, subplate; CP, cortical plate; also refer to “Lamina in Grading Table and Figures” section in Methods.
Robust β2 expression appeared abruptly in L4 at P5, especially in barrel cortex. By P12, β2 expression expanded into L1–4, with lesser increases in L5/6. There was strong expression in L1–4 and somewhat lower levels in L5/6. By P26, L1–4 still had the highest expression, and weaker expression in L5.
A steady general increase in cortical expression of β3 was apparent on WB, starting in the embryonic period and continuing until P10, when it reached a stable plateau of high expression that showed a statistically significant difference from embryonic/perinatal timepoints, but not across the postnatal period (Figure 14; ****P < 0.0001 P15-P25 and P5-P10 vs. E13.5-P3). In brain sections (Figures 10, 14), expression of β3 was first detectable at E15.5 in the MZ and subplate. Low expression was also visible in L5/L6 with L5 being slightly higher. While β3 expression is lower in L2–4, there are dendrites extending from L5 through L2/3 and ending in L1. Expression intensity increased from E15.5-P1, but the laminar pattern remained the same. By P5, β3 expression increased in the upper cortex, resulting in a relatively undifferentiated laminar pattern from L2 to the subplate. The one exception is in the barrel cortex, where the L4 barrels had notably higher expression than other layers and adjacent cortices. By P12, a clear, laminar pattern was again re-established throughout somatosensory and motor cortex due to a relatively weak β3 expression in L5, while L1 and L4 barrels had the highest expression. At P26, this general pattern persists, but L1 and L6 decrease in intensity, giving a pattern of high expression in L1-3, higher expression in L4/barrels, and moderate expression in L5-L6.
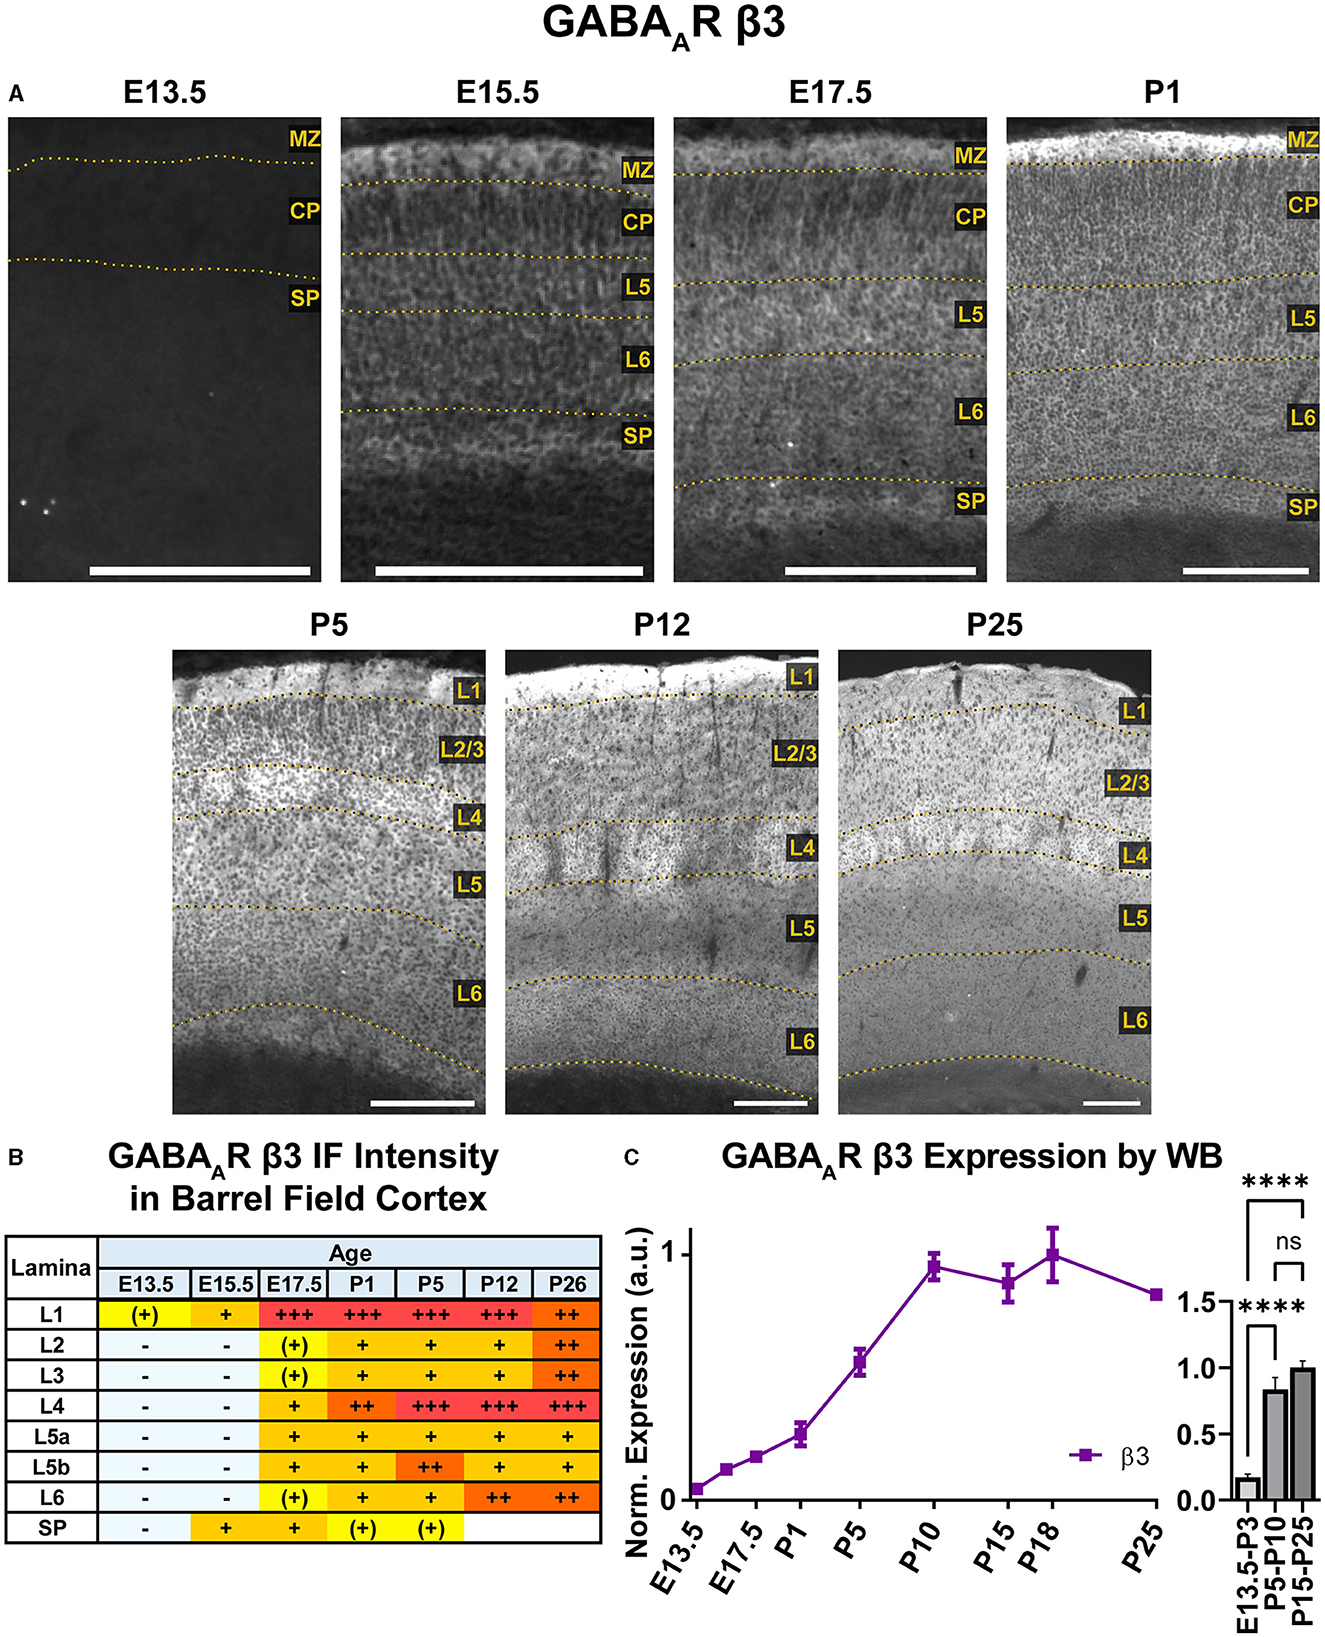
Figure 14. GABAAR β3 expression in barrel field cortex from embryonic age to maturity. (A) Exemplar images of β3 immunoreactivity in barrel field cortex across development. Scale bar = 250 μm. (B) Grading of immunofluorescence intensity across cortical lamina, where + + ++ is the maximal β3 signal that could be detected in brain at P26. (C) Quantification of GABAAR β3 protein in cortical samples by Western blot, with a timeline of all points on the left and binned stages tested for significance on the right. ****P < 0.0001 by one-way ANOVA with Šídák's multiple comparisons; n in mice/age: 4/E13.5, 4/E15.5, 4/E17.5, 4/P1, 4/P5, 4/P10, 4/P15, 4/P18, and 4/P25. L1–L6, layer 1–layer 6; MZ, marginal zone; SP, subplate; CP, cortical plate; also refer to “Lamina in Grading Table and Figures” section in Methods.
The general pattern of KCC2 expression during rodent cortical development has been previously thoroughly characterized by WB and other techniques, showing low immunoreactivity during embryonic and perinatal life, and then a dramatic increase in the second to fourth postnatal weeks (Rivera et al., 1999; Stein et al., 2004; Dzhala et al., 2005; Uvarov et al., 2009; Takayama and Inoue, 2010; Kovács et al., 2014). Due to these prior studies, we only focused on investigating laminar and regional differences in KCC2 expression by IHC (Figure 15). We detected the earliest cortical KCC2 expression at E15.5 as faint immunoreactivity in the subplate and MZ. At E17.5-P1, KCC2 was robustly expressed in MZ and subplate. Additionally, individual neurons within the CP, particularly within L5, exhibited significant plasmalemmal KCC2 immunoreactivity that corresponds to GABAergic neuron-specific expression we previously reported (Zavalin et al., 2022). Early KCC2 expression within MZ also appeared to be interneuron-specific, since MZ is densely packed with migrating interneurons and similarly lost KCC2 immunoreactivity in the interneuron-specific KCC2 knockout. On the other hand, interneurons did not contribute to KCC2 expression within the subplate, which retained KCC2 immunoreactivity in the knockout (Zavalin et al., 2022). Therefore, with the exception of subplate-specific expression, KCC2 appears to be expressed exclusively by a subset of interneurons until P4-P5, at which point, we saw a marked increase in KCC2 expression within L4 and particularly the barrels, and low emerging expression in L5. At this point, we could also see numerous immunopositive dendrites ascending through L2/3. By P13, KCC2 was diffusely expressed throughout the cortical lamina and had higher expression in L1-4 than L5/6. Higher expression following a similar pattern was present after P18 (Figure 15).
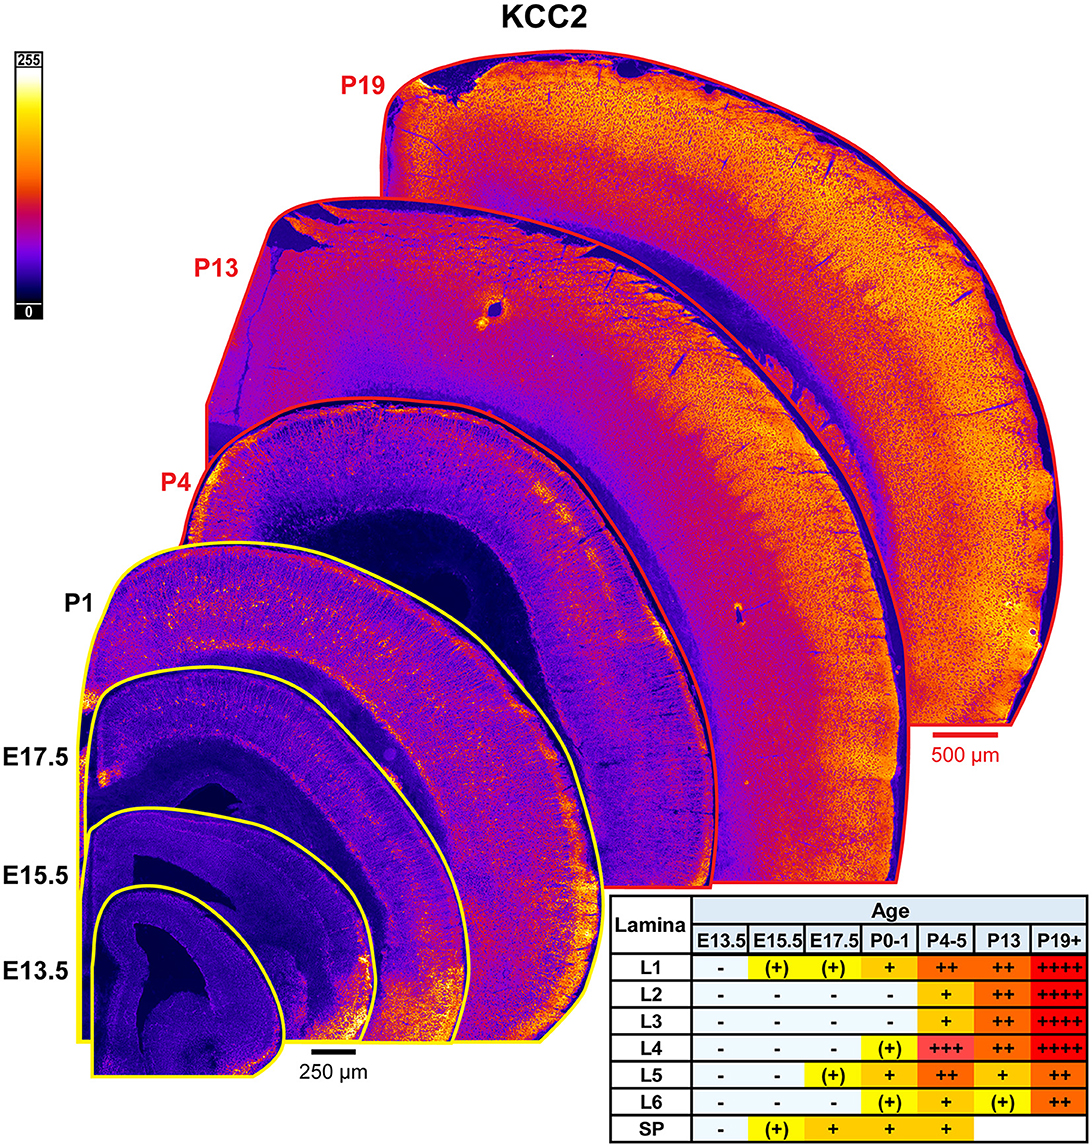
Figure 15. KCC2 expression in developing cortex. Coronal sections are overlaid from embryonic day E13.5 on the bottom left to postnatal day 19 on the top right, and concensus grading of immunofluorescence intensity is on bottom right. All sections are oriented from ventral bottom to dorsal top, with lateral cortex on the right. Separate scaling has been used for sections E13.5-P1 (black scale bar) and P4-P19 (red scale bar). Signal is represented using a heat map lookup table to highlight differences in regional expression. Heatmap intensity scaling is shown by the bar in top left. For grading of immunofluorescence intensity, + + ++ is the maximal KCC2 signal that could be detected in brain at P19+. L1–L6, layer 1–layer 6; SP, subplate; also refer to “Lamina in Grading Table and Figures” section in Methods.
In this study, we found unique spatial and temporal patterns of GABAAR subunits and KCC2 protein expression during cortical development. Generally, expression of α3 and α5 GABAAR subunits began very early, predominantly in L5/6 and subplate. On the other hand, α1, α2, α4, and δ, as well as KCC2, were primarily expressed at later developmental stages, most strongly in L4 and more superficial layers. In contrast, expression of β2, β3, and γ2 were spatially and temporally more ubiquitous than expression of α subunits but were similarly higher in certain laminae. β3 expression came online early and generally preceded expression of β2, although this difference was less distinct in the barrel field, per se.
While there have been a few studies reporting GABAAR subunit expression in perinatal cortex, they have been much more limited in scope than our work. For example, Fritschy et al. (1994) described α1 and α2 protein expression in somatosensory and visual cortex at P0, P4, and P20. In addition, Paysan et al. (1997) showed that α1, α2, α3, and α5 GABAAR expression at P7 in sensory cortex depended on perinatal thalamocortical input. More comprehensive evaluations of perinatal mRNA expression have been reported previously (Laurie et al., 1992), but lacked the layer-specific detail reported here. Other in situ hybridization studies have reported greater anatomic detail but did not include embryonic expression (Golshani et al., 1997; Fertuzinhos et al., 2014). More importantly, mRNA expression patterns may not match the subcellular distribution of functional GABAARs, such as mRNA expression in the somata but protein expression in the dendrites. Moreover, mRNA levels may not reflect quantitative differences in protein expression due to post-transcriptional and post-translational levels of control, such as mRNA editing, GABAAR internalization, and degradation. While our findings usually corroborate these previous publications on GABAAR expression (Laurie et al., 1992; Golshani et al., 1997; Hortnagl et al., 2013; Fertuzinhos et al., 2014) and KCC2 expression (Rivera et al., 1999; Stein et al., 2004; Dzhala et al., 2005; Uvarov et al., 2009; Takayama and Inoue, 2010; Markkanen et al., 2014; Zavalin et al., 2022), our work provides laminar resolution that was previously unknown.
A summary of expression trajectories of multiple GABAAR subunit proteins within a single lamina is provided in Supplementary Figure 3. However, it is important to realize that differences in antibody affinity preclude any direct comparison of absolute protein quantity among the various subunits.
MZ/L1 is the site of multiple important development processes, including tangential migration of interneuron progenitors (Li et al., 2008; Bortone and Polleux, 2009; Bartolini et al., 2013), which rely on GABAAR-mediated excitation for motility (Inada et al., 2011). MZ is also populated by a transient neuronal population of Cajal-Retzius neurons, which develop exceptionally early and exhibit strong GABAergic input in the early period, playing a vital role in cortical circuit formation and organization (Kilb and Frotscher, 2016; Molnár et al., 2020). In our experiments, we found clear α2, α3, α5, β3, and γ2 GABAAR subunit expression in this layer by E15.5 in a generally diffuse pattern. At the time of birth, α1, α4, and δ were essentially absent in L1, but all other GABAAR subunits and KCC2 were clearly expressed.
L2/3 are the latest-maturing laminae in the inside-out sequence of cortical development. While α1, α2, α4, δ, and KCC2 expression was strong at maturity, these subunits were generally first clearly visible in L4 around P5 and then subsequently in more superficial layers by P12. This is concordant with the emergence of synaptic activity L2/3 and a critical period of receptive fields in L2/3 of barrel cortex (Maravall et al., 2004; Kobayashi et al., 2008). Prior to P5; α2, β2, β3, and γ2 were the predominant subunits expressed in L2/3. Additionally, α3 and α5 expression appeared to lie along the ascending dendrites of L4-6 neurons passing through L2/3. This interpretation is supported by previous work showing that α3 and α5 mRNA expression before P6-12 is predominantly in the lower and middle cortical layers, respectively (Laurie et al., 1992). From P5 onwards, the pattern of α3 expression became more diffuse and somewhat weaker, while α5 expression in barrel cortex virtually disappeared by P12.
L4 is the primary input layer for thalamocortical input, and dramatic changes in expression of GABAAR subunits and KCC2 occurred around the time when thalamocortical afferent fibers reach L4 at P4 and form defined barrels during P4-P8 (Inan and Crair, 2007). Prior to P5, GABAAR subunit expression in L4 was typically similar to L2/3. β3 and γ2 were consistently expressed in this area at all peri- and postnatal ages. At P5, there was an abrupt onset of strong α1, α2, α4, β2, δ, and KCC2 expression, while α3 and α5 expression was lost, and this pattern was also most prominent in barrel cortex. Expression of ɑ(1,2)β(2,3)γ2 pentamers could allow temporally precise GABAergic signaling for accurate sensory processing during and after the critical period, while extrasynaptic ɑ4βδ receptors may help provide local area regulation of multiple neurons with tonic inhibition.
L5/L6 are the earliest-forming cortical layers, and the site of early GABAergic “giant depolarizing potentials” that assist with circuit formation in the first postnatal week (Allene et al., 2008). Prior to P5, GABAAR subunits α3 and α5 were prominently expressed in L5/6 along with β2, β3, and γ2. KCC2 expression was also seen in L5 as early as E17.5, but was restricted to interneurons in the perinatal period, as previously shown with tissue from interneuron-specific KCC2 knockout mice (Zavalin et al., 2022). After P5, expression of α3 and α5 remained robust, but gained a sublaminar pattern with slightly stronger expression in the superficial L5 (L5a), and the border between L5 and L6 (L5c/L6a). At P12 there were moderate levels of α1 and γ2 expression in L1-4 and L6, but not L5. Finally, while α2, α4, δ, and KCC2 expression began in L5/6 by P12, it remained relatively weak compared to more superficial layers.
Like the MZ, subplate hosts a population of transient, early-developing neurons that assist cortical formation by regulating processes like thalamocortical axon pathfinding and radial migration of neurons. Subplate neurons form a layer beneath the CP, with a distinct cell-sparse zone between L6 and the subplate from E15.5 until at least P2 (Torres-Reveron and Friedlander, 2007). Some of these subplate neurons are GABAergic, and prominent GABAergic currents can be evoked in subplate neurons (Unichenko et al., 2015; Ohtaka-Maruyama, 2020). Previous work has shown that after P2-4, a distinct layer of subplate neurons is lost, and these cells become intermixed with the lower portions of L6 (Kast and Levitt, 2019).
We found strong expression of GABAAR subunits α3, α5, and β2 that began as early as E13.5/E15.5; followed by β3, γ2, and KCC2 expression by E15.5/E17.5; and then low α1 expression by E17.5/P1. In addition, there was faint, primarily somatic δ expression in some subplate neurons as early as P1, as previously reported by Qu et al. (2016). This somatic pattern was most evident at P5 and persisted with fewer cells at P12 in the region where subplate was found earlier, and then was essentially gone by P26.
Previous work has shown Gabra5 mRNA in the perinatal subplate (Golshani et al., 1997), and we found a consistent band of α5 expression restricted to the subplate. In contrast to other subunits, this expression persisted even into adulthood as a distinct, thin band in the post-subplate region/L6b. In contrast, α3 and β3 had a broader band of expression that included both the subplate, as well as the cell-poor region between the subplate and CP (referred to as “L6b” by Catalano et al., 1991). Unlike Gabra5, Gabra3 mRNA is not known to be expressed in subplate at this age, and some α3 protein expression may be due to afferent/efferent fibers passing through this area, such as thalamocortical input and corticothalamic output. In particular, growing thalamocortical afferents that eventually project to L4 make contact with subplate neurons at E16-E19 (Catalano et al., 1991; Inan and Crair, 2007).
While GABAAR expression is not typically found in the subcortical white matter of a mature brain, we found expression of α3 in fibers of the intermediate zone and internal capsule in the embryonic brain between E15.5 to P1, which was most evident at E17.5. This expression was no longer present by P5 and was also not seen in tissue from E17.5 Gabra3-knockout mice. Embryonic thalamus expresses α3 (Laurie et al., 1992, also visible in Figure 7A), and α3 expression can be seen extending past the striatum and into the subcortical region with a pattern suggestive of thalamocortical fibers (Agmon et al., 1993; Bicknese et al., 1994; Abe et al., 2015). Conversely, L5/6 show robust α3 expression starting in the embryonic period, and the fibers may also mark corticothalamic tracks. Future work will need to be done to more specifically identify the source of this α3 expression and its developmental significance.
α2 GABAAR protein expression was found in the superficial subcortical tissue, with radially oriented projections extending through the overlying CP in the embryonic and perinatal periods. Our results show that this α2 GABAAR protein expression overlaps with a subset of RC2-labeled radial glia in dorsal cortex. Previous work has shown that both mature glia and their precursors express functional GABAARs (Wang et al., 2005; Muth-Kohne et al., 2010; Renzel et al., 2013). Bergmann glia specifically express Gabra2 mRNA (Riquelme et al., 2002), and possibly α1, β1, β3, and γ1 (Bovolin et al., 1992). Laurie et al. (1992) also reported mRNA expression of α2 in the lower intermediate zone by E17. Thus, it is possible that our results reflect presence of α2-containing GABAARs in the radial glia. However, radial glial processes in embryonic brain are much more widely distributed than the pattern of α2 expression reported here. There were RC2-positive fibers extending centrifugally from both pallial and subpallial ventricular zones, while α2+ fibers lacked this range and appeared to arise from the intermediate zone. Therefore, the identity of these fibers is not entirely clear. It is conceivable that these fibers represent radial processes of a subset of radial glia, but it is just as likely that they are expressed in some other closely associated processes instead. Additionally, it is unclear whether these are functional GABAAR pentamers, since we did not see this pattern with other GABAAR proteins.
Immunolabelling for the δ GABAAR subunit or KCC2 identified distinct somata in cortex. In the case of KCC2, we were able to corroborate that this represented early KCC2 expression in interneurons (Zavalin et al., 2022). The δ+ somata were most prominent at P12 and P26, but the identity of these cells is unclear. A similar pattern has been reported in hippocampus by other groups, which found discrete α1, β2, and δ co-expressing cell bodies that correspond with parvalbumin interneurons (Peng et al., 2004; Milenkovic et al., 2013). We also found intensely labeled α1+ and β2+ somata in hippocampus from P5-P26 (data not shown), but not in the cortex from the same sections. Therefore, cortical δ+ somata may likewise represent interneurons, but it is unclear which GABAAR subunits partner with δ in the cortex, although α4β2δ is the subunit combination most commonly found in brain.
The developmental significance of the expression patterns discussed here is unclear without knowing how those changes will affect GABAergic signaling. Fortunately, there is now a large body of work characterizing the pharmacodynamic properties and subcellular location of different GABAAR subunit-combination (Chuang and Reddy, 2018; Engin et al., 2018).
GABAARs containing the γ2 subunit are the primary mediators of synaptic responses, since they are often found within the synapse and tend to produce large, rapidly activating and deactivating currents. However, they require relatively high [GABA] (≈ 10–15 μM) for full activation and also desensitize rapidly. We found that ubiquitous γ2 expression begins early in development and ramps up to even higher levels as the brain matures, suggesting that γ2-containing GABAARs constitute a sizeable portion of cortical GABAARs at all ages. Moreover, some of the α subunits that typically combine with γ2, which include α1, α2, α3, and α5 in adult brain, are also present at early ages. However, expression of each of these α subunits significantly varies by developmental stage and lamina, imparting different properties to γ2-containing GABAARs in development and adulthood.
Among the α subunits, α3 and α5 are expressed particularly early in development in multiple cortical laminae, including the MZ, L5, and subplate. Unlike in adult brain, these subunits often had spatially and temporally overlapping patterns of expression in the developing cortex. GABAARs containing either of these subunits tend to have prolonged decay times and slow desensitization. Concordantly, GABAergic currents during embryonic and perinatal period generally have slow phasic or tonic kinetic properties (Le Magueresse and Monyer, 2013; Warm et al., 2022). However, α3- and α5-containing GABAARs have notably different sensitivities to GABA (Picton and Fisher, 2007; Rula et al., 2008; Lagrange et al., 2018). For example, α5β3γ2 GABAARs are sensitive to low [GABA] (< 5–10 μM) and often localize to the extrasynaptic space, allowing them to convey much of the tonic inhibition in some adult brain regions (Caraiscos et al., 2004; Lagrange et al., 2018). In contrast, α3-containing GABAARs require very high [GABA] (EC50 30–100 μM) and relatively prolonged or repetitive exposure to GABA for full activation (Rula et al., 2008). Thus, a mixed population of α3βγ2 and α5βγ2 GABAARs would provide a pool of highly sensitive α5-containing GABAARs to respond to low levels of GABA and another population of α3-containing GABAARs tuned to detect repetitive exposure to high [GABA]. The ability of α3-containing GABAARs to detect coincident stimulation may be particularly useful in a developmental context, where growth cone stabilization, synaptogenesis, and other developmental processes depend on repetitive GABAAR activation. Indeed, embryonic α3 expression is required for the formation of certain axo-axonic synapses in the retina (Sinha et al., 2021). Interestingly, α3 expression may provide an additional, temporally dependent regulation of GABAergic signaling. Gabra3 is subject to RNA editing during later stages of development (50% edited at P2-5, 90% edited at P7-9). This process converts an isoleucine to methionine in the third transmembrane domain, leading to reduced GABA potency, reduced surface expression, and faster decay (Rula et al., 2008; Daniel et al., 2011), which likely fine-tunes the ability to sum up repetitive stimuli.
On the other hand, α5-containing GABAARs may provide GABAergic depolarization when low [GABA] is present. Sebe et al. (2010) found significant α5-mediated tonic current in cortical L5 neurons uniquely at early postnatal timepoints, which excited a minority and inhibited the majority of neurons, but whether similar tonic currents occur in other areas remains to be determined. While α5-containing GABAARs tend to be extrasynaptic in adult brain, they have also been found at/near synapses in developing neurons and mediate signals that assist neuronal development (Serwanski et al., 2006; Brady and Jacob, 2015; Hernandez et al., 2019). Previous work has shown that α5-mediated currents promote dendrite and spine development in vitro (Giusi et al., 2009; Brady and Jacob, 2015), as well as migration and dendrite development of adult-born granule cells (Deprez et al., 2016; Lodge et al., 2021).
In contrast to α3 and α5, α1 and α2-containing GABAARs have kinetic properties that are tailored toward phasic signaling associated with mature synaptic signals. The robust upregulation of these two subunits is coincident with a period of maximal synaptic formation during the second and early third postnatal week in mice (Bosman et al., 2002; Kobayashi et al., 2008; Okaty et al., 2009; Lazarus and Huang, 2011; Le Magueresse and Monyer, 2013; Yang et al., 2014).
α1βγ2 is by far the most abundant GABAAR subunit combination found in adult brain and conveys the majority of synaptic inhibition. α1βγ2 GABAARs activate very quickly and have moderate rates of deactivation that allow them to convert sub-millisecond GABA transients into currents lasting tens of milliseconds or more. However, these GABAARs also desensitize quickly and extensively. Thus, synaptic activity conveyed by α1βγ2 GABAAR is able to respond to sparse synaptic activity with high temporal precision but is also relatively insensitive to high frequency input (Bianchi et al., 2007; Lagrange et al., 2018). Indeed, electrophysiological experiments in L2/3 show a developmental transition of GABAergic synaptic currents toward a fast activation/fast deactivation profile, which is coincident with a decrease of the α3-mediated component and increase in the α1-mediated component (Bosman et al., 2002; Kobayashi et al., 2008).
α2βγ2 have similar activation, deactivation, and desensitization to α1βγ2, but somewhat lower GABA potency and more rapid recovery during frequent stimulation (Picton and Fisher, 2007). While α1βγ2 GABAARs are prevalent at the majority of GABAergic synapses (Chuang and Reddy, 2018; Engin et al., 2018), α2βγ2 GABAARs appear to be the dominant combination at specific synapses, such as synapses made by parvalbumin+ chandelier interneurons on the axon initial segment and on somatic synapses made by non-parvalbumin basket interneurons, such as cholecystokinin+ interneurons (Nusser et al., 1996; Nyíri et al., 2001; Klausberger et al., 2002).
In contrast to synaptic γ2-containing GABAARs, α5βγ2 and δ-containing GABAARs are mediators of tonic GABAergic signaling, partly due to their preferential localization outside of the synapse. The δ subunit tends to partner with α4 in vivo to create α4βδ pentamers (Engin et al., 2018; Lagrange et al., 2018), and we found that α4 and δ followed a similar pattern of expression that was quite sparse until the second postnatal week. α4βδ GABAARs are the primary mediators of tonic inhibition in response to low levels of extrasynaptic [GABA] found in cortex, thalamus, and hippocampus (usually ≈ 1 μM or even less), activating slowly but maintaining a prolonged tonic current due to slow deactivation and low desensitization (Lagrange et al., 2018). Since α4βδ GABAARs are maximally activated at low [GABA], they can only discriminate a relatively narrow range of extrasynaptic [GABA] concentrations (≤ 1–5 μM). α5β3γ2 GABAARs are less sensitive to low [GABA], with EC50s between those of α4βδ and α1βγ2 GABAARs (Lagrange et al., 2018). While α4 and α5 subunits are often expressed in different brain regions, there are some areas of overlap (Hortnagl et al., 2013). In these cases, expression of both α4βδ and α5β3γ2 GABAARs imparts the ability to fine-tune network activity to a wider range of [GABA] (Scimemi et al., 2005).
However, α4 and α5 subunits often have non-overlapping patterns of expression. As mentioned previously, α5-containing GABAARs convey most of the tonic signaling in early life, since α4 and δ subunit expression only appears around P5. Even in the adult cortex, where both subunits are expressed, α5 is expressed highly in L5/6, α4 expression is higher in superficial layers. Neurons throughout the cortical column have been shown to exhibit tonic currents, but subunit composition of GABAARs mediating these currents differs by layer (Yamada et al., 2007; Jang et al., 2013). Therefore, while tonic currents in L5 have a prominent α5-mediated component (Yamada et al., 2007), our findings indicate that tonic currents in L4 and superficial layers may have stronger α4 and δ-mediated components.
A small percentage of the α1 subunit can also be found in α1βδ GABAARs, which are predominantly expressed on interneurons (Glykys et al., 2007) that could correspond with the immunolabeled somata we observed for both α1 and δ subunits. These pentamers have GABA potency that is similar to α5β3γ2, but also have very fast rates of activation and deactivation, as well as much less desensitization than any other GABAAR subunit combinations studied so far (Bianchi et al., 2002; Lagrange et al., 2018). Their extremely fast deactivation would make them poorly suited to respond to low frequency phasic stimulation. Their minimal desensitization is conducive to tonic inhibition, but kinetic properties make this subunit combination able to respond near-instantaneously to abrupt changes in extrasynaptic GABA. These properties are expected to produce extrasynaptic responses with extremely high temporal precision to presynaptic input, but little overall charge transfer during single events. α1βδ GABAARs are well-suited to respond to prolonged, repetitive synaptic input with high temporal fidelity.
KCC2 has a strong influence on development through its effect in transitioning GABAergic signaling to mediate inhibition during later stages of development. In agreement with this function, we saw late KCC2 expression in cortex with exception of interneurons, where KCC2 may play an important developmental role (Cuzon et al., 2006; Bortone and Polleux, 2009; Inada et al., 2011; Inamura et al., 2012; Zavalin et al., 2022). While KCC2 expression is a significant factor in heralding a transition to inhibitory GABAergic responses, extensive regulation by kinases further restricts KCC2 activity to late stages of development (Fukuda, 2020; Virtanen et al., 2020, 2021), and additional factors including extracellular matrix proteins influence the polarity of GABAergic responses (Delpire and Staley, 2014; Glykys et al., 2014; Rahmati et al., 2021). Additionally, KCC2 has transport-independent functions that affect dendritic spine formation, apoptosis, and other developmental processes (Llano et al., 2020).
We did not distinguish the two isoforms of KCC2, KCC2a, and KCC2b, which both act as transporters, but have structural differences and significantly vary in temporal and spatial expression (Uvarov et al., 2007, 2009; Markkanen et al., 2014, 2017).
Our data from P26 mice is generally quite consistent with the published literature. However, we cannot rule out the possibility that tissue from later ages might have revealed greater changes in expression intensity, such as a drop in α2 or α5 expression. We did not measure expression of β1, γ1, and γ3, as we were unable to find a suitably specific antibody for use in WB and IHC experiments.
Unlike other subunits, it is less clear how much β subunit composition affects GABAARs properties, and the significance of asynchronous β2 and β3 in cortical signaling is unclear. However, there are some subtle differences between β2 and β3 containing GABAARs, such as their sensitivity to some general anesthetics (Zeller et al., 2007), and α4β3δ are less sensitive to low GABA than α4β2δ GABAARs (Lagrange et al., 2018). In general, α5 tends to partner with β3 and γ2 in vivo, so early expression of β3 and γ2 may be conducive to forming α5β3γ2 GABAARs (Mckernan and Whiting, 1996).
The isoform specific GABAAR responses are only one factor mediating GABAergic signaling in the developing brain. The concentration and kinetics of GABA play an equally important role that may vary from very brief synaptic transients to longer bursts of synaptic input, slower transients of intermediate GABA concentrations, and even steady state levels of low GABA (Brickley and Mody, 2012).
This work evaluated the expression of individual GABAAR subunits, and thus is not entirely informative of subunit combinations that form functional GABAARs. Though certain frequently-occurring combinations can be predicted from our expression, we cannot address the effects of mixed GABAAR α subunit combinations that are expressed in vivo (Sun et al., 2023). For example, it is currently unknown whether α3/α5β3γ2 would have high sensitivity to GABA like α5β3γ2 GABAARs, or low like α3β3γ2 GABAARs. Furthermore, a number of endogenous GABAAR modulators, such as neurosteroids and endozepines, are also developmentally regulated and regulate GABAAR function (Brown et al., 2016; Tonon et al., 2020). Finally, GABAAR-mediated signals can differ not only by lamina and developmental stage, but by specific neuronal types, circuits, and synapses. Therefore, while our experiments delineate certain trends in cortical GABAAR composition during development, physiology studies that focus on certain neuronal types and synapses may find exceptions and specializations that do not follow these trends.
The datasets presented in this article are not readily available because imaging and expression data has not been systematically organized for shared use and will not be stored indefinitely. Requests to access the datasets should be directed to AL, YW5kcmUuaC5sYWdyYW5nZUB2dW1jLm9yZw==.
Ethical approval was not required for the studies on humans in accordance with the local legislation and institutional requirements because only commercially available established cell lines were used. The animal study was approved by the Vanderbilt University Institutional Animal Care and Use Committee. The study was conducted in accordance with the local legislation and institutional requirements.
KZ: Formal analysis, Investigation, Methodology, Visualization, Writing – original draft, Writing – review & editing. AH: Formal analysis, Investigation, Methodology, Visualization, Writing – review & editing. YZ: Investigation, Methodology, Writing – review & editing. ZK: Investigation, Writing – review & editing. AL: Conceptualization, Formal analysis, Funding acquisition, Investigation, Methodology, Project administration, Supervision, Visualization, Writing – review & editing.
The author(s) declare financial support was received for the research, authorship, and/or publication of this article. This work was supported by Veteran Affairs Merit grant I01 BX001189.
The authors declare that the research was conducted in the absence of any commercial or financial relationships that could be construed as a potential conflict of interest.
All claims expressed in this article are solely those of the authors and do not necessarily represent those of their affiliated organizations, or those of the publisher, the editors and the reviewers. Any product that may be evaluated in this article, or claim that may be made by its manufacturer, is not guaranteed or endorsed by the publisher.
The Supplementary Material for this article can be found online at: https://www.frontiersin.org/articles/10.3389/fncel.2024.1390742/full#supplementary-material
Abe, P., Molnar, Z., Tzeng, Y. S., Lai, D. M., Arnold, S. J., and Stumm, R. (2015). Intermediate progenitors facilitate intracortical progression of thalamocortical axons and interneurons through CXCL12 chemokine signaling. J. Neurosci. 35, 13053–13063. doi: 10.1523/JNEUROSCI.1488-15.2015
Agmon, A., Yang, L. T., O'dowd, D. K., and Jones, E. G. (1993). Organized growth of thalamocortical axons from the deep tier of terminations into layer IV of developing mouse barrel cortex. J. Neurosci. 13, 5365–5382. doi: 10.1523/JNEUROSCI.13-12-05365.1993
Allene, C., Cattani, A., Ackman, J. B., Bonifazi, P., Aniksztejn, L., Ben Ari, Y., et al. (2008). Sequential generation of two distinct synapse-driven network patterns in developing neocortex. J Neurosci. 28, 12851–12863. doi: 10.1523/JNEUROSCI.3733-08.2008
Bartolini, G., Ciceri, G., and Marín, O. (2013). Integration of GABAergic interneurons into cortical cell assemblies: lessons from embryos and adults. Neuron 79, 849–864. doi: 10.1016/j.neuron.2013.08.014
Bayer, S. A., and Altman, J. (1990). Development of layer I and the subplate in the rat neocortex. Exp. Neurol. 107, 48–62. doi: 10.1016/0014-4886(90)90062-W
Ben-Ari, Y., Gaiarsa, J. L., Tyzio, R., and Khazipov, R. (2007). GABA: a pioneer transmitter that excites immature neurons and generates primitive oscillations. Physiol. Rev. 87, 1215–1284. doi: 10.1152/physrev.00017.2006
Bianchi, M. T., Botzolakis, E. J., Haas, K. F., Fisher, J. L., and Macdonald, R. L. (2007). Microscopic kinetic determinants of macroscopic currents: insights from coupling and uncoupling of GABAA receptor desensitization and deactivation. J. Physiol. 584, 769–787. doi: 10.1113/jphysiol.2007.142364
Bianchi, M. T., Haas, K. F., and Macdonald, R. L. (2002). Alpha1 and alpha6 subunits specify distinct desensitization, deactivation and neurosteroid modulation of GABA(A) receptors containing the delta subunit. Neuropharmacology 43, 492–502. doi: 10.1016/S0028-3908(02)00163-6
Bicknese, A. R., Sheppard, A. M., O'leary, D. D., and Pearlman, A. L. (1994). Thalamocortical axons extend along a chondroitin sulfate proteoglycan-enriched pathway coincident with the neocortical subplate and distinct from the efferent path. J. Neurosci. 14, 3500–3510. doi: 10.1523/JNEUROSCI.14-06-03500.1994
Bortone, D., and Polleux, F. (2009). KCC2 expression promotes the termination of cortical interneuron migration in a voltage-sensitive calcium-dependent manner. Neuron 62, 53–71. doi: 10.1016/j.neuron.2009.01.034
Bosman, L. W., Rosahl, T. W., and Brussaard, A. B. (2002). Neonatal development of the rat visual cortex: synaptic function of GABAA receptor alpha subunits. J. Physiol. 545, 169–181. doi: 10.1113/jphysiol.2002.026534
Bouzigues, C., Holcman, D., and Dahan, M. (2010). A mechanism for the polarity formation of chemoreceptors at the growth cone membrane for gradient amplification during directional sensing. PLoS ONE 5:e9243. doi: 10.1371/journal.pone.0009243
Bovolin, P., Santi, M. R., Memo, M., Costa, E., and Grayson, D. R. (1992). Distinct developmental patterns of expression of rat alpha 1, alpha 5, gamma 2S, and gamma 2L gamma-aminobutyric acidA receptor subunit mRNAs in vivo and in vitro. J. Neurochem. 59, 62–72. doi: 10.1111/j.1471-4159.1992.tb08876.x
Brady, M. L., and Jacob, T. C. (2015). Synaptic localization of α5 GABA (A) receptors via gephyrin interaction regulates dendritic outgrowth and spine maturation. Develop. Neurobiol. 75, 1241–1251. doi: 10.1002/dneu.22280
Brickley, S. G., and Mody, I. (2012). Extrasynaptic GABA(A) receptors: their function in the CNS and implications for disease. Neuron 73, 23–34. doi: 10.1016/j.neuron.2011.12.012
Brown, A. R., Mitchell, S. J., Peden, D. R., Herd, M. B., Seifi, M., Swinny, J. D., et al. (2016). During postnatal development endogenous neurosteroids influence GABA-ergic neurotransmission of mouse cortical neurons. Neuropharmacology 103, 163–173. doi: 10.1016/j.neuropharm.2015.11.019
Cancedda, L., Fiumelli, H., Chen, K., and Poo, M. M. (2007). Excitatory GABA action is essential for morphological maturation of cortical neurons in vivo. J. Neurosci. 27, 5224–5235. doi: 10.1523/JNEUROSCI.5169-06.2007
Caraiscos, V. B., Elliott, E. M., You-Ten, K. E., Cheng, V. Y., Belelli, D., Newell, J. G., et al. (2004). Tonic inhibition in mouse hippocampal CA1 pyramidal neurons is mediated by alpha5 subunit-containing gamma-aminobutyric acid type A receptors. Proc. Natl. Acad. Sci. U S A 101, 3662–3667. doi: 10.1073/pnas.0307231101
Catalano, S. M., Robertson, R. T., and Killackey, H. P. (1991). Early ingrowth of thalamocortical afferents to the neocortex of the prenatal rat. Proc. Natl. Acad. Sci. U S A 88, 2999–3003. doi: 10.1073/pnas.88.8.2999
Chancey, J. H., Adlaf, E. W., Sapp, M. C., Pugh, P. C., Wadiche, J. I., and Overstreet-Wadiche, L. S. (2013). GABA depolarization is required for experience-dependent synapse unsilencing in adult-born neurons. J. Neurosci. 33, 6614–6622. doi: 10.1523/JNEUROSCI.0781-13.2013
Chuang, S.-H., and Reddy, D. S. (2018). Genetic and molecular regulation of extrasynaptic GABA-A receptors in the brain: therapeutic insights for epilepsy. J. Pharmacol. Exper. Therap. 364, 180–197. doi: 10.1124/jpet.117.244673
Cuzon Carlson, V. C., and Yeh, H. H. (2011). GABAA receptor subunit profiles of tangentially migrating neurons derived from the medial ganglionic eminence. Cereb. Cortex 21, 1792–1802. doi: 10.1093/cercor/bhq247
Cuzon, V. C., Yeh, P. W., Cheng, Q., and Yeh, H. H. (2006). Ambient GABA promotes cortical entry of tangentially migrating cells derived from the medial ganglionic eminence. Cereb. Cortex 16, 1377–1388. doi: 10.1093/cercor/bhj084
Daniel, C., Wahlstedt, H., Ohlson, J., Bjork, P., and Ohman, M. (2011). Adenosine-to-inosine RNA editing affects trafficking of the gamma-aminobutyric acid type A (GABA(A)) receptor. J. Biol. Chem. 286, 2031–2040. doi: 10.1074/jbc.M110.130096
Daw, M. I., Ashby, M. C., and Isaac, J. T. R. (2007). Coordinated developmental recruitment of latent fast spiking interneurons in layer IV barrel cortex. Nat. Neurosci. 10, 453–461. doi: 10.1038/nn1866
Delpire, E., and Staley, K. J. (2014). Novel determinants of the neuronal Cl− concentration. J. Physiol. 592, 4099–4114. doi: 10.1113/jphysiol.2014.275529
Deprez, F., Vogt, F., Floriou-Servou, A., Lafourcade, C., Rudolph, U., Tyagarajan, S. K., et al. (2016). Partial inactivation of GABAA receptors containing the α5 subunit affects the development of adult-born dentate gyrus granule cells. Eur. J. Neurosci. 44, 2258–2271. doi: 10.1111/ejn.13329
Dzhala, V. I., Talos, D. M., Sdrulla, D. A., Brumback, A. C., Mathews, G. C., Benke, T. A., et al. (2005). NKCC1 transporter facilitates seizures in the developing brain. Nat. Med. 11, 1205–1213. doi: 10.1038/nm1301
Engin, E., Benham, R. S., and Rudolph, U. (2018). An emerging circuit pharmacology of GABAA receptors. Trends Pharmacol. Sci. 39, 710–732. doi: 10.1016/j.tips.2018.04.003
Fertuzinhos, S., Li, M., Kawasawa Yuka, i., Ivic, V., Franjic, D., Singh, D., et al. (2014). Laminar and temporal expression dynamics of coding and noncoding RNAs in the mouse neocortex. Cell Rep. 6, 938–950. doi: 10.1016/j.celrep.2014.01.036
Fritschy, J. M., Paysan, J., Enna, A., and Mohler, H. (1994). Switch in the expression of rat GABAA-receptor subtypes during postnatal development: an immunohistochemical study. J. Neurosci. 14, 5302–5324. doi: 10.1523/JNEUROSCI.14-09-05302.1994
Fritschy, J. M., Weinmann, O., Wenzel, A., and Benke, D. (1998). Synapse-specific localization of NMDA and GABAA receptor subunits revealed by antigen-retrieval immunohistochemistry. J. Comp. Neurol. 390, 194–210. doi: 10.1002/(SICI)1096-9861(19980112)390:2<194::AID-CNE3>3.0.CO
Fukuda, A. (2020). Chloride homeodynamics underlying modal shifts in cellular and network oscillations. Neurosci. Res. 156, 14–23. doi: 10.1016/j.neures.2020.02.010
Ge, S., Goh, E. L., Sailor, K. A., Kitabatake, Y., Ming, G. L., and Song, H. (2006). GABA regulates synaptic integration of newly generated neurons in the adult brain. Nature 439, 589–593. doi: 10.1038/nature04404
Giusi, G., Facciolo, R. M., Rende, M., Alò, R., Di Vito, A., Salerno, S., et al. (2009). Distinct α subunits of the GABAA receptor are responsible for early hippocampal silent neuron-related activities. Hippocampus 19, 1103–1114. doi: 10.1002/hipo.20584
Glykys, J., Dzhala, V., Egawa, K., Balena, T., Saponjian, Y., Kuchibhotla, K. V., et al. (2014). Local impermeant anions establish the neuronal chloride concentration. Science 343, 670–675. doi: 10.1126/science.1245423
Glykys, J., Peng, Z., Chandra, D., Homanics, G. E., Houser, C. R., and Mody, I. (2007). A new naturally occurring GABA(A) receptor subunit partnership with high sensitivity to ethanol. Nat. Neurosci. 10, 40–48. doi: 10.1038/nn1813
Golshani, P., Truong, H., and Jones, E. G. (1997). Developmental expression of GABA(A) receptor subunit and GAD genes in mouse somatosensory barrel cortex. J. Comp. Neurol. 383, 199–219. doi: 10.1002/(SICI)1096-9861(19970630)383:2<199::AID-CNE7>3.0.CO
Hernandez, C. C., Xiangwei, W., Hu, N., Shen, D., Shen, W., Lagrange, A. H., et al. (2019). Altered inhibitory synapses in de novo GABRA5 and GABRA1 mutations associated with early onset epileptic encephalopathies. Brain 142, 1938–1954. doi: 10.1093/brain/awz123
Hortnagl, H., Tasan, R. O., Wieselthaler, A., Kirchmair, E., Sieghart, W., and Sperk, G. (2013). Patterns of mRNA and protein expression for 12 GABAA receptor subunits in the mouse brain. Neuroscience 236, 345–372. doi: 10.1016/j.neuroscience.2013.01.008
Inada, H., Watanabe, M., Uchida, T., Ishibashi, H., Wake, H., Nemoto, T., et al. (2011). GABA regulates the multidirectional tangential migration of GABAergic interneurons in living neonatal mice. PLoS ONE 6:e27048. doi: 10.1371/journal.pone.0027048
Inamura, N., Kimura, T., Tada, S., Kurahashi, T., Yanagida, M., Yanagawa, Y., et al. (2012). Intrinsic and extrinsic mechanisms control the termination of cortical interneuron migration. J. Neurosci. 32, 6032–6042. doi: 10.1523/JNEUROSCI.3446-11.2012
Inan, M., and Crair, M. C. (2007). Development of cortical maps: perspectives from the barrel cortex. Neuroscientist 13, 49–61. doi: 10.1177/1073858406296257
Jacobowitz, D. M., and Abbott, L. C. (1997). Chemoarchitectonic Atlas of the Developing Mouse Brain. New York: CRC Press. doi: 10.1201/9781466593411
Jang, H. J., Cho, K. H., Kim, M. J., Yoon, S. H., and Rhie, D. J. (2013). Layer- and cell-type-specific tonic GABAergic inhibition of pyramidal neurons in the rat visual cortex. Pflugers Arch. 465, 1797–1810. doi: 10.1007/s00424-013-1313-1
Kast, R. J., and Levitt, P. (2019). Precision in the development of neocortical architecture: from progenitors to cortical networks. Progr. Neurobiol. 175, 77–95. doi: 10.1016/j.pneurobio.2019.01.003
Kilb, W. (2021). When are depolarizing GABAergic responses excitatory? Front. Molec. Neurosci. 14:747835. doi: 10.3389/fnmol.2021.747835
Kilb, W., and Frotscher, M. (2016). Cajal-Retzius cells: organizers of cortical development. e-Neuroforum 7, 82–88. doi: 10.1007/s13295-016-0031-5
Klausberger, T., Roberts, J. D. B., and Somogyi, P. (2002). Cell type- and input-specific differences in the number and subtypes of synaptic GABAA receptors in the hippocampus. J. Neurosci. 22, 2513–2521. doi: 10.1523/JNEUROSCI.22-07-02513.2002
Kobayashi, M., Hamada, T., Kogo, M., Yanagawa, Y., Obata, K., and Kang, Y. (2008). Developmental profile of GABAA-mediated synaptic transmission in pyramidal cells of the somatosensory cortex. Eur. J. Neurosci. 28, 849–861. doi: 10.1111/j.1460-9568.2008.06401.x
Kovács, K., Basu, K., Rouiller, I., and Sík, A. (2014). Regional differences in the expression of K(+)-Cl(-) 2 cotransporter in the developing rat cortex. Brain Struct. Funct. 219, 527–538. doi: 10.1007/s00429-013-0515-9
Kroon, T., Van Hugte, E., Van Linge, L., Mansvelder, H. D., and Meredith, R. M. (2019). Early postnatal development of pyramidal neurons across layers of the mouse medial prefrontal cortex. Sci. Rep. 9:5037. doi: 10.1038/s41598-019-41661-9
Lagrange, A. H., Botzolakis, E. J., and Macdonald, R. L. (2007). Enhanced macroscopic desensitization shapes the response of alpha4 subtype-containing GABAA receptors to synaptic and extrasynaptic GABA. J. Physiol. 578, 655–676. doi: 10.1113/jphysiol.2006.122135
Lagrange, A. H., Hu, N., and Macdonald, R. L. (2018). GABA beyond the synapse: defining the subtype-specific pharmacodynamics of non-synaptic GABAA receptors. J. Physiol. 596, 4475–4495. doi: 10.1113/JP276187
Laurie, D. J., Wisden, W., and Seeburg, P. H. (1992). The distribution of thirteen GABAA receptor subunit mRNAs in the rat brain. III. Embryonic and postnatal development. J. Neurosci. 12, 4151–4172. doi: 10.1523/JNEUROSCI.12-11-04151.1992
Lazarus, M. S., and Huang, Z. J. (2011). Distinct maturation profiles of perisomatic and dendritic targeting GABAergic interneurons in the mouse primary visual cortex during the critical period of ocular dominance plasticity. J. Neurophysiol. 106, 775–787. doi: 10.1152/jn.00729.2010
Le Magueresse, C., and Monyer, H. (2013). GABAergic interneurons shape the functional maturation of the cortex. Neuron 77, 388–405. doi: 10.1016/j.neuron.2013.01.011
Li, G., Adesnik, H., Li, J., Long, J., Nicoll, R. A., Rubenstein, J. L. R., et al. (2008). Regional distribution of cortical interneurons and development of inhibitory tone are regulated by Cxcl12/Cxcr4 signaling. J. Neurosci. 28, 1085–1098. doi: 10.1523/JNEUROSCI.4602-07.2008
Llano, O., Rivera, C., and Ludwig, A. (2020). “Chapter 6 - KCC2 regulates dendritic spine development,” in Neuronal Chloride Transporters in Health and Disease, ed. X. Tang (London: Academic Press), 103–132. doi: 10.1016/B978-0-12-815318-5.00006-6
Lo, W.-Y., Lagrange, A. H., Hernandez, C. C., Gurba, K. N., and Macdonald, R. L. (2014). Co-expression of γ2 subunits hinders processing of N-linked glycans attached to the N104 glycosylation sites of GABAA receptor β2 subunits. Neurochem. Res. 39, 1088–1103. doi: 10.1007/s11064-013-1187-9
Lodge, M., Hernandez, M.-C., Schulz, J. M., and Bischofberger, J. (2021). Sparsification of AP firing in adult-born hippocampal granule cells via voltage-dependent α5-GABAA receptors. Cell Rep. 37:109768. doi: 10.1016/j.celrep.2021.109768
Lu, J., Karadsheh, M., and Delpire, E. (1999). Developmental regulation of the neuronal-specific isoform of K-Cl cotransporter KCC2 in postnatal rat brains. J. Neurobiol. 39, 558–568. doi: 10.1002/(SICI)1097-4695(19990615)39:4<558::AID-NEU9>3.0.CO
Ma, W., and Barker, J. L. (1995). Complementary expressions of transcripts encoding GAD67 and GABAA receptor a4, b1, and g1 subunits in the proliferative zone of the embryonic rat central nervous system. J. Neurosci. 15, 2547–2560. doi: 10.1523/JNEUROSCI.15-03-02547.1995
Ma, W., and Barker, J. L. (1998). GABA, GAD, and GABAA receptor a4, b1, and g1 subunits are expressed in the late embryonic and early postnatal neocortical germinal matrix and coincide with gliogenesis. Microsc. Res. Tech. 40, 398–407. doi: 10.1002/(SICI)1097-0029(19980301)40:5<398::AID-JEMT6>3.0.CO
Maravall, M., Koh, I. Y. Y., Lindquist, W. B., and Svoboda, K. (2004). Experience-dependent changes in basal dendritic branching of layer 2/3 pyramidal neurons during a critical period for developmental plasticity in rat barrel cortex. Cerebr. Cortex 14, 655–664. doi: 10.1093/cercor/bhh026
Markkanen, M., Karhunen, T., Llano, O., Ludwig, A., Rivera, C., Uvarov, P., et al. (2014). Distribution of neuronal KCC2a and KCC2b isoforms in mouse CNS. J. Compar. Neurol. 522, 1897–1914. doi: 10.1002/cne.23510
Markkanen, M., Ludwig, A., Khirug, S., Pryazhnikov, E., Soni, S., Khiroug, L., et al. (2017). Implications of the N-terminal heterogeneity for the neuronal K-Cl cotransporter KCC2 function. Brain Res. 1675, 87–101. doi: 10.1016/j.brainres.2017.08.034
Mckernan, R. M., and Whiting, P. J. (1996). Which GABAA-receptor subtypes really occur in the brain? Trends Neurosci. 19, 139–143. doi: 10.1016/S0166-2236(96)80023-3
Milenkovic, I., Vasiljevic, M., Maurer, D., Höger, H., Klausberger, T., and Sieghart, W. (2013). The parvalbumin-positive interneurons in the mouse dentate gyrus express GABAA receptor subunits α1, β2, and δ along their extrasynaptic cell membrane. Neuroscience 254, 80–96. doi: 10.1016/j.neuroscience.2013.09.019
Möhler, H. (2006). GABAA receptors in central nervous system disease: anxiety, epilepsy, and insomnia. J. Recept. Signal Transd. 26, 731–740. doi: 10.1080/10799890600920035
Molnár, Z., Luhmann, H. J., and Kanold, P. O. (2020). Transient cortical circuits match spontaneous and sensory-driven activity during development. Science 370:eabb2153. doi: 10.1126/science.abb2153
Murguia-Castillo, J., Beas-Zarate, C., Rivera-Cervantes, M. C., Feria-Velasco, A. I., and Urena-Guerrero, M. E. (2013). NKCC1 and KCC2 protein expression is sexually dimorphic in the hippocampus and entorhinal cortex of neonatal rats. Neurosci. Lett. 552, 52–57. doi: 10.1016/j.neulet.2013.07.038
Muth-Kohne, E., Terhag, J., Pahl, S., Werner, M., Joshi, I., and Hollmann, M. (2010). Functional excitatory GABAA receptors precede ionotropic glutamate receptors in radial glia-like neural stem cells. Mol. Cell Neurosci. 43, 209–221. doi: 10.1016/j.mcn.2009.11.002
Nusser, Z., Sieghart, W., Benke, D., Fritschy, J. M., and Somogyi, P. (1996). Differential synaptic localization of two major gamma-aminobutyric acid type A receptor alpha subunits on hippocampal pyramidal cells. Proc. Natl. Acad. Sci. 93, 11939–11944. doi: 10.1073/pnas.93.21.11939
Nyíri, G., Freund, T. F., and Somogyi, P. (2001). Input-dependent synaptic targeting of α2-subunit-containing GABAA receptors in synapses of hippocampal pyramidal cells of the rat. Eur. J. Neurosci. 13, 428–442. doi: 10.1046/j.1460-9568.2001.01407.x
Oh, W. C., Lutzu, S., Castillo, P. E., and Kwon, H.-B. (2016). De novo synaptogenesis induced by GABA in the developing mouse cortex. Science 353, 1037–1040. doi: 10.1126/science.aaf5206
Ohtaka-Maruyama, C. (2020). Subplate neurons as an Organizer of Mammalian Neocortical Development. Front. Neuroan. 14:8. doi: 10.3389/fnana.2020.00008
Okaty, B. W., Miller, M. N., Sugino, K., Hempel, C. M., and Nelson, S. B. (2009). Transcriptional and electrophysiological maturation of neocortical fast-spiking GABAergic interneurons. J. Neurosci. 29, 7040–7052. doi: 10.1523/JNEUROSCI.0105-09.2009
Owens, D. F., Liu, X., and Kriegstein, A. R. (1999). Changing properties of GABAA receptor–mediated signaling during early neocortical development. J. Neurophysiol. 82, 570–583. doi: 10.1152/jn.1999.82.2.570
Paxinos, G. (2007). Atlas of the Developing Mouse Brain at E17.5, P0 and P6. Amsterdam; Boston, MA: Elsevier.
Paxinos, G., and Franklin, K. B. J. (2004). The Mouse Brain in Stereotaxic Coordinates. San Diego, CA: Elsevier Academic Press.
Paysan, J., and Fritschy, J. M. (1998). GABAA-receptor subtypes in developing brain: actors or spectators? Perspect. Dev. Neurobiol 5, 179–192.
Paysan, J., Kossel, A., Bolz, J., and Fritschy, J. M. (1997). Area-specific regulation of gamma-aminobutyric acid type A receptor subtypes by thalamic afferents in developing rat neocortex. Proc. Natl. Acad. Sci. U S A 94, 6995–7000. doi: 10.1073/pnas.94.13.6995
Peerboom, C., and Wierenga, C. J. (2021). The postnatal GABA shift: a developmental perspective. Neurosci. Biobehav. Rev. 124, 179–192. doi: 10.1016/j.neubiorev.2021.01.024
Peng, Z., Huang, C. S., Stell, B. M., Mody, I., and Houser, C. R. (2004). Altered expression of the delta subunit of the GABAA receptor in a mouse model of temporal lobe epilepsy. J. Neurosci. 24, 8629–8639. doi: 10.1523/JNEUROSCI.2877-04.2004
Picton, A. J., and Fisher, J. L. (2007). Effect of the alpha subunit subtype on the macroscopic kinetic properties of recombinant GABA(A) receptors. Brain Res. 1165, 40–49. doi: 10.1016/j.brainres.2007.06.050
Pirker, S., Schwarzer, C., Wieselthaler, A., Sieghart, W., and Sperk, G. (2000). GABAA receptors: immunocytochemical distribution of 13 subunits in the adult rat brain. Neuroscience 101, 815–850. doi: 10.1016/S0306-4522(00)00442-5
Preibisch, S., Saalfeld, S., and Tomancak, P. (2009). Globally optimal stitching of tiled 3D microscopic image acquisitions. Bioinformatics 25, 1463–1465. doi: 10.1093/bioinformatics/btp184
Qu, G. J., Ma, J., Yu, Y. C., and Fu, Y. (2016). Postnatal development of GABAergic interneurons in the neocortical subplate of mice. Neuroscience 322, 78–93. doi: 10.1016/j.neuroscience.2016.02.023
Rahmati, N., Normoyle, K. P., Glykys, J., Dzhala, V. I., Lillis, K. P., Kahle, K. T., et al. (2021). Unique actions of GABA arising from cytoplasmic chloride microdomains. J. Neurosci. 41, 4957–4975. doi: 10.1523/JNEUROSCI.3175-20.2021
Renzel, R., Sadek, A. R., Chang, C. H., Gray, W. P., Seifert, G., and Steinhauser, C. (2013). Polarized distribution of AMPA, but not GABAA, receptors in radial glia-like cells of the adult dentate gyrus. Glia 61, 1146–1154. doi: 10.1002/glia.22505
Riquelme, R., Miralles, C. P., and De Blas, A. L. (2002). Bergmann glia GABAA receptors concentrate on the glial processes that wrap inhibitory synapses. J. Neurosci. 22, 10720–10730. doi: 10.1523/JNEUROSCI.22-24-10720.2002
Rivera, C., Voipio, J., Payne, J. A., Ruusuvuori, E., Lahtinen, H., Lamsa, K., et al. (1999). The K+/Cl- co-transporter KCC2 renders GABA hyperpolarizing during neuronal maturation. Nature 397, 251–255. doi: 10.1038/16697
Rula, E. Y., Lagrange, A. H., Jacobs, M. M., Hu, N., Macdonald, R. L., and Emeson, R. B. (2008). Developmental modulation of GABA(A) receptor function by RNA editing. J. Neurosci. 28, 6196–6201. doi: 10.1523/JNEUROSCI.0443-08.2008
Schambra, U. B., and Schambra, U. B. (2008). Prenatal Mouse Brain Atlas. 2nd ed. New York: Springer. doi: 10.1007/978-0-387-47093-1
Schneider Gasser, E. M., Straub, C. J., Panzanelli, P., Weinmann, O., Sassoe-Pognetto, M., and Fritschy, J. M. (2006). Immunofluorescence in brain sections: simultaneous detection of presynaptic and postsynaptic proteins in identified neurons. Nat. Protoc. 1, 1887–1897. doi: 10.1038/nprot.2006.265
Scimemi, A., Semyanov, A., Sperk, G., Kullmann, D. M., and Walker, M. C. (2005). Multiple and plastic receptors mediate tonic GABAA receptor currents in the hippocampus. J. Neurosci. 25:10016. doi: 10.1523/JNEUROSCI.2520-05.2005
Sebe, J. Y., Looke-Stewart, E. C., Estrada, R. C., and Baraban, S. C. (2010). Robust tonic GABA currents can inhibit cell firing in mouse newborn neocortical pyramidal cells. Eur. J. Neurosci. 32, 1310–1318. doi: 10.1111/j.1460-9568.2010.07373.x
Sedmak, G., Jovanov-Milosevic, N., Puskarjov, M., Ulamec, M., Kruslin, B., Kaila, K., et al. (2016). Developmental expression patterns of KCC2 and functionally associated molecules in the human brain. Cereb Cortex 26, 4574–4589. doi: 10.1093/cercor/bhv218
Serwanski, D. R., Miralles, C. P., Christie, S. B., Mehta, A. K., Li, X., and De Blas, A. L. (2006). Synaptic and nonsynaptic localization of GABAA receptors containing the alpha5 subunit in the rat brain. J. Compar. Neurol. 499, 458–470. doi: 10.1002/cne.21115
Sinha, R., Grimes, W. N., Wallin, J., Ebbinghaus, B. N., Luu, K., Cherry, T., et al. (2021). Transient expression of a GABA receptor subunit during early development is critical for inhibitory synapse maturation and function. Curr. Biol. 31:4314. doi: 10.1016/j.cub.2021.07.059
Stefanits, H., Milenkovic, I., Mahr, N., Pataraia, E., Hainfellner, J. A., Kovacs, G. G., et al. (2018). GABA(A) receptor subunits in the human amygdala and hippocampus: immunohistochemical distribution of 7 subunits. J. Comp. Neurol. 526, 324–348. doi: 10.1002/cne.24337
Stein, V., Hermans-Borgmeyer, I., Jentsch, T. J., and Hubner, C. A. (2004). Expression of the KCl cotransporter KCC2 parallels neuronal maturation and the emergence of low intracellular chloride. J. Comp. Neurol. 468, 57–64. doi: 10.1002/cne.10983
Sun, C., Zhu, H., Clark, S., and Gouaux, E. (2023). Cryo-EM structures reveal native GABA(A) receptor assemblies and pharmacology. Nature 622, 195–201. doi: 10.1038/s41586-023-06556-w
Takayama, C., and Inoue, Y. (2010). Developmental localization of potassium chloride co-transporter 2 (KCC2), GABA and vesicular GABA transporter (VGAT) in the postnatal mouse somatosensory cortex. Neurosci. Res. 67, 137–148. doi: 10.1016/j.neures.2010.02.010
Tonon, M. C., Vaudry, H., Chuquet, J., Guillebaud, F., Fan, J., Masmoudi-Kouki, O., et al. (2020). Endozepines and their receptors: structure, functions and pathophysiological significance. Pharmacol. Ther. 208:107386. doi: 10.1016/j.pharmthera.2019.06.008
Torres-Reveron, J., and Friedlander, M. J. (2007). Properties of persistent postnatal cortical subplate neurons. J. Neurosci. 27, 9962–9974. doi: 10.1523/JNEUROSCI.1536-07.2007
Unichenko, P., Kirischuk, S., and Luhmann, H. J. (2015). GABA transporters control GABAergic neurotransmission in the mouse subplate. Neuroscience 304, 217–227. doi: 10.1016/j.neuroscience.2015.07.067
Uvarov, P., Ludwig, A., Markkanen, M., Pruunsild, P., Kaila, K., Delpire, E., et al. (2007). A novel N-terminal isoform of the neuron-specific K-Cl cotransporter KCC2. J. Biol. Chem. 282, 30570–30576. doi: 10.1074/jbc.M705095200
Uvarov, P., Ludwig, A., Markkanen, M., Soni, S., Hübner, C. A., Rivera, C., et al. (2009). Coexpression and heteromerization of two neuronal K-Cl cotransporter isoforms in neonatal brain. J. Biol. Chem. 284, 13696–13704. doi: 10.1074/jbc.M807366200
Vanhatalo, S., Palva, J. M., Andersson, S., Rivera, C., Voipio, J., and Kaila, K. (2005). Slow endogenous activity transients and developmental expression of K+-Cl- cotransporter 2 in the immature human cortex. Eur. J. Neurosci. 22, 2799–2804. doi: 10.1111/j.1460-9568.2005.04459.x
Virtanen, M. A., Uvarov, P., Hübner, C. A., and Kaila, K. (2020). NKCC1, an elusive molecular target in brain development: making sense of the existing data. Cells 9:2607. doi: 10.3390/cells9122607
Virtanen, M. A., Uvarov, P., Mavrovic, M., Poncer, J. C., and Kaila, K. (2021). The multifaceted roles of KCC2 in cortical development. Trends Neurosci. 44, 378–392. doi: 10.1016/j.tins.2021.01.004
Viswanathan, S., Sheikh, A., Looger, L. L., and Kanold, P. O. (2016). Molecularly defined subplate neurons project both to thalamocortical recipient layers and thalamus. Cerebr. Cortex 27, 4759–4768. doi: 10.1093/cercor/bhw271
Wang, D. D., and Kriegstein, A. R. (2008). GABA regulates excitatory synapse formation in the neocortex via NMDA receptor activation. J. Neurosci. 28, 5547–5558. doi: 10.1523/JNEUROSCI.5599-07.2008
Wang, D. D., and Kriegstein, A. R. (2011). Blocking early GABA depolarization with bumetanide results in permanent alterations in cortical circuits and sensorimotor gating deficits. Cerebr. Cortex 21, 574–587. doi: 10.1093/cercor/bhq124
Wang, L. P., Kempermann, G., and Kettenmann, H. (2005). A subpopulation of precursor cells in the mouse dentate gyrus receives synaptic GABAergic input. Mol. Cell Neurosci. 29, 181–189. doi: 10.1016/j.mcn.2005.02.002
Warm, D., Schroer, J., and Sinning, A. (2022). Gabaergic interneurons in early brain development: conducting and orchestrated by cortical network activity. Front. Molec. Neurosci. 14:807969. doi: 10.3389/fnmol.2021.807969
Yamada, J., Furukawa, T., Ueno, S., Yamamoto, S., and Fukuda, A. (2007). Molecular basis for the GABAA receptor-mediated tonic inhibition in rat somatosensory cortex. Cereb. Cortex 17, 1782–1787. doi: 10.1093/cercor/bhl087
Yang, J.-M. M., Zhang, J., Yu, Y.-Q. Q., Duan, S., and Li, X.-M. M. (2014). Postnatal development of 2 microcircuits involving fast-spiking interneurons in the mouse prefrontal cortex. Cereb. Cortex 24, 98–109. doi: 10.1093/cercor/bhs291
Zavalin, K., Hassan, A., Fu, C., Delpire, E., and Lagrange, A. H. (2022). Loss of KCC2 in GABAergic neurons causes seizures and an imbalance of cortical interneurons. Front. Molec. Neurosci. 15:826427. doi: 10.3389/fnmol.2022.826427
Keywords: GABA-A receptors, potassium chloride co-transporter 2 (KCC2), developmental expression pattern, cortical development, GABAA subtypes, Western blot (WB), immunohistochemistry (IHC)
Citation: Zavalin K, Hassan A, Zhang Y, Khera Z and Lagrange AH (2024) Region and layer-specific expression of GABAA receptor isoforms and KCC2 in developing cortex. Front. Cell. Neurosci. 18:1390742. doi: 10.3389/fncel.2024.1390742
Received: 23 February 2024; Accepted: 13 May 2024;
Published: 04 June 2024.
Edited by:
Goichi Miyoshi, Gunma University, JapanReviewed by:
Miho Terunuma, Niigata University, JapanCopyright © 2024 Zavalin, Hassan, Zhang, Khera and Lagrange. This is an open-access article distributed under the terms of the Creative Commons Attribution License (CC BY). The use, distribution or reproduction in other forums is permitted, provided the original author(s) and the copyright owner(s) are credited and that the original publication in this journal is cited, in accordance with accepted academic practice. No use, distribution or reproduction is permitted which does not comply with these terms.
*Correspondence: Andre H. Lagrange, YW5kcmUuaC5sYWdyYW5nZUB2dW1jLm9yZw==
†These authors have contributed equally to this work and share first authorship
Disclaimer: All claims expressed in this article are solely those of the authors and do not necessarily represent those of their affiliated organizations, or those of the publisher, the editors and the reviewers. Any product that may be evaluated in this article or claim that may be made by its manufacturer is not guaranteed or endorsed by the publisher.
Research integrity at Frontiers
Learn more about the work of our research integrity team to safeguard the quality of each article we publish.