
95% of researchers rate our articles as excellent or good
Learn more about the work of our research integrity team to safeguard the quality of each article we publish.
Find out more
CORRECTION article
Front. Cell. Neurosci. , 07 December 2023
Sec. Cellular Neurophysiology
Volume 17 - 2023 | https://doi.org/10.3389/fncel.2023.1340688
 Doris Lam1*
 Heather A. Enright1
 Jose Cadena2
 Vivek Kurien George2David A. Soscia2Angela C. Tooker2Michael Triplett2Sandra K. G. Peters1
 Piyush Karande2
 Alexander Ladd2Chandrakumar Bogguri1Elizabeth K. Wheeler2
 Nicholas O. Fischer1*
A corrigendum on
Spatiotemporal analysis of 3D human iPSC-derived neural networks using a 3D multi-electrode array
by Lam, D., Enright, H. A., Cadena, J., George, V. K., Soscia, D. A., Tooker, A. C., Triplett, M., Peters, S. K. G., Karande, P., Ladd, A., Bogguri, C., Wheeler, E. K., and Fischer, N. O. (2023). Front. Cell. Neurosci. 17:1287089. doi: 10.3389/fncel.2023.1287089
In the published article, there were errors in the legend for Figure 5 as published. “ε” symbol was mistakenly used for “≥” and the color scheme for high and low synchrony was incorrect. The correct color scheme is purple for “high” synchrony and yellow for “low” synchrony. The corrected legend appears below.
“The effect of BIC, AP-5, and CNQX on synchronized neural network activity within a 3D neuron-astrocyte co-culture. (A) The heat map illustrates the average synchrony value per array within (bottom, middle 1, middle 2, and top) and between cross sections before and after the sequential addition of BIC, AP-5, and CNQX. (B) Overlay bar graph compares the average number of synchronized networks (or edges) detected within the 3D culture, independent of the electrode's position, across treatment conditions (e.g., baseline, BIC, AP-5+BIC, and CNQX+AP-5+BIC). Data was normalized to the total edges identified during BIC treatment (see Results for rationale). Edge activity has been categorized by the degree of synchrony: “high synchrony” has a 1-SPIKE distance ≥ 0.40 (purple), “low synchrony” has a 1-SPIKE distance < 0.40 (yellow), or inactive electrodes (white). Data is shown as mean ± SEM. (C) Scatter plot illustrates the shift in synchrony value for an active edge (dot) detected in BIC treatment (Reference, black line), its value before (e.g., baseline,), and after (e.g., AP-5 and CNQX) BIC treatment. The line of best fit was determined based on all available edges, categorized by the location within (i) or between (ii) cross sections, and the slope and intercept reported for each antagonist in brackets. (D) Scatter plot illustrates the shift in synchrony value for an active edge detected in BIC treatment (Reference, black line) based on its cross sectional position (e.g., bottom, middle 1, middle 2, and top graph) for baseline (i), AP-5 (ii), and CNQX (iii). The slope and intercept are reported based on the line of best fit for each cross section. Electrode data has been aggregated for 9 3D MEAs.”
In the published article, there was an error in Figure 2 as published. For panel B, the graph shown in burst per minute for the middle 2 cross section is incorrect. The corrected Figure 2 and its original caption appear below.
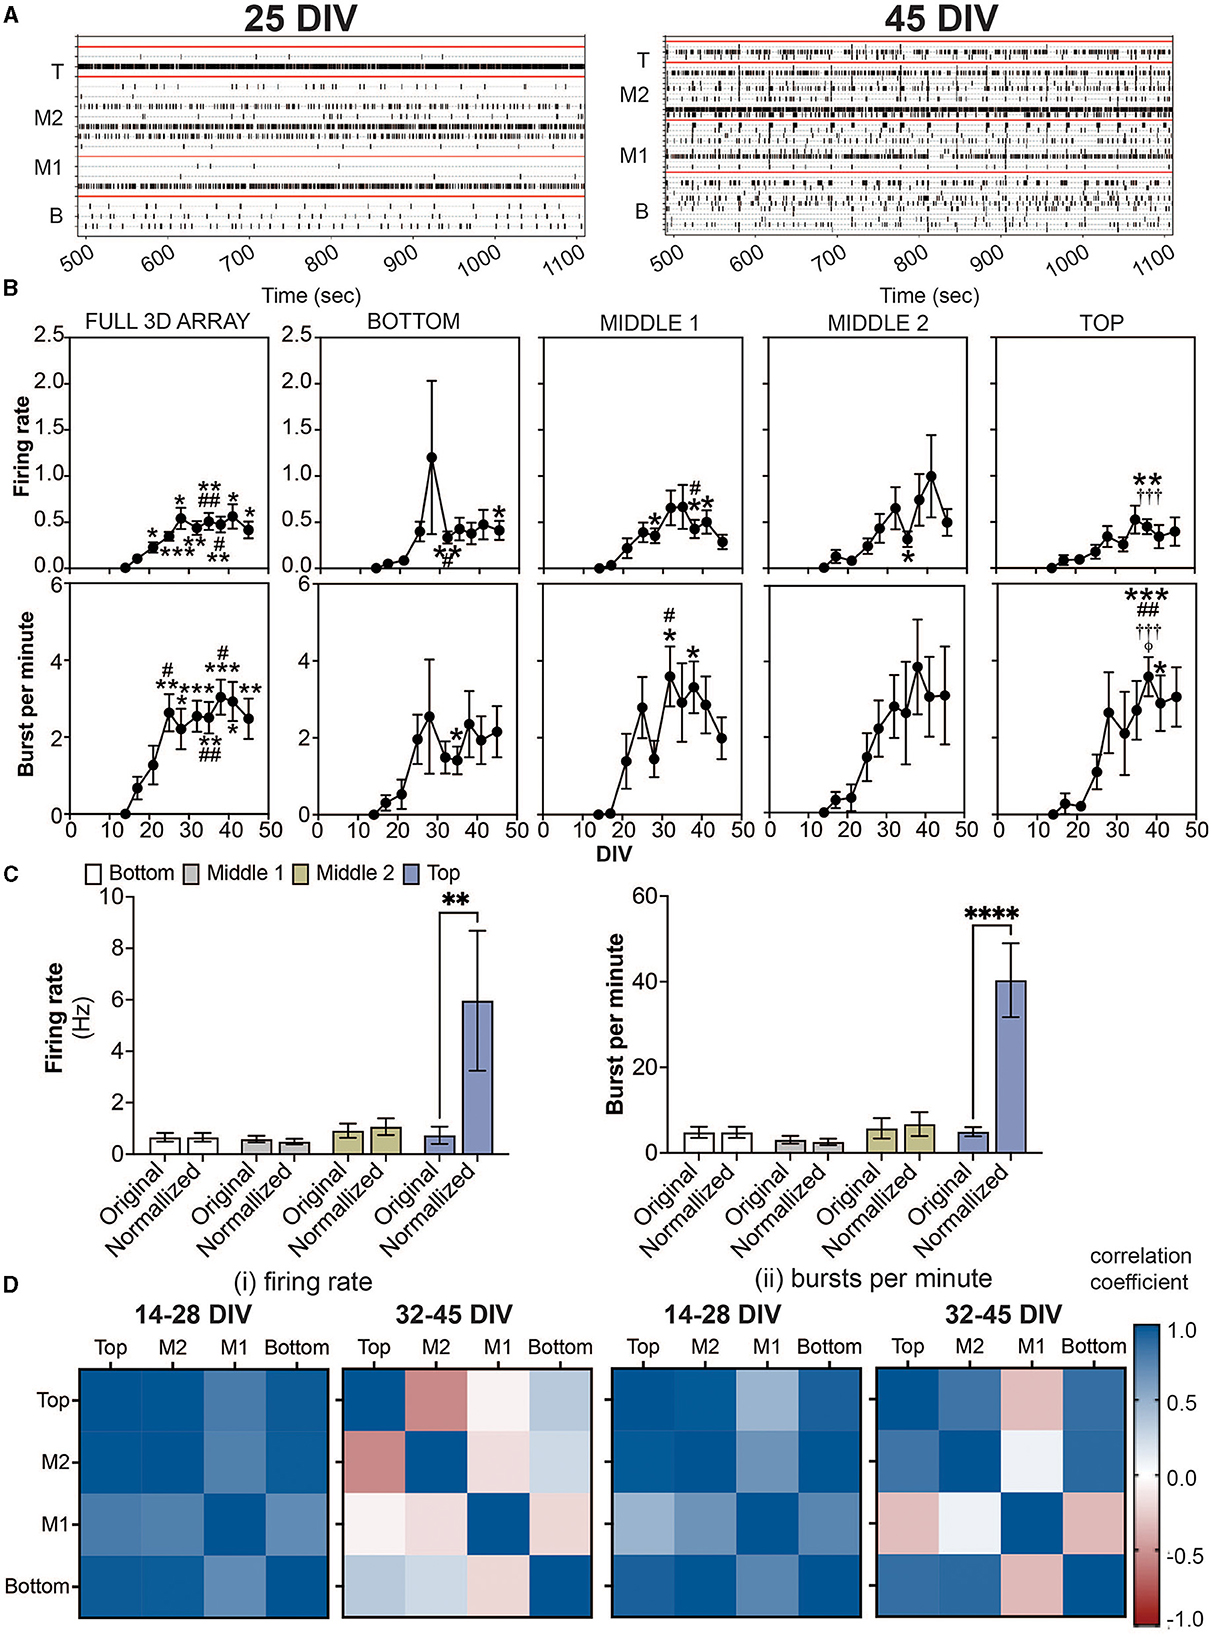
Figure 2. Detection of spikes and bursts within a 3D neuron-astrocyte co-culture monitored over 45 DIV. (A) Representative 10 min-raster plots of spiking and bursting activity within bottom, middle 1, middle 2 and top cross sections, delineated by the red line, of the flexible probes within the 3D MEA at 25 and 45 DIV. (B) Dot plots summarizes the firing rate (top row) and bursts per minute (bottom row) detected over the 30-min recordings. From left to right, graphs are shown with respect to the total activity across all electrodes within the (i.e.., full 3D array) and sections of the 3D array based on electrode positions (i.e., bottom, middle 1, middle 2 and top). Data is presented as the mean ± SEM for n = 15 wells and were analyzed using mixed model of two-way ANOVA with Tukey's post hoc test. Statistical significances (symbol) are observed for the feature of spike and burst activity when compared to 14 DIV (*), 17 DIV (#), 21 DIV (†), 25 DIV (‡), and 28 DIV (ϕ) at a level (number of symbols) of #p < 0.05, ## p < 0.01, ### p < 0.001. (C) Bar graph compares the original data for the firing rate (left) and bursts per minute (right) for each cross section, and when the average data is normalized by the cell density within each cross section, determined from (Figure 1C). Data is presented as the mean ± SEM for n = 15 wells and were analyzed using two-way ANOVA with Bonferroni's post hoc test. Statistical significance is reported at a level of **p < 0.01, ****p < 0.0001 (D) Correlation coefficient matrices display the strong positive (correlation score closer to 1.0) and negative relationships (score closer to −1.0) between layers (top, middle 2, middle 1, and bottom) of the 3D culture for the mean firing rate (i) and burst per minute (ii) grouped by the growth phase (development) of the active culture (14–28 DIV), and plateau (maturation) phase (32–45 DIV).
In the published article, Supplementary Table 1 was mistakenly not included in the publication.
The authors apologize for these errors and state that this does not change the scientific conclusions of the article in any way. The original article has been updated.
All claims expressed in this article are solely those of the authors and do not necessarily represent those of their affiliated organizations, or those of the publisher, the editors and the reviewers. Any product that may be evaluated in this article, or claim that may be made by its manufacturer, is not guaranteed or endorsed by the publisher.
Keywords: 3D multi-electrode array, microelectrode array, neural networks, electrophysiology, 3D culture, hiPSC, collagen
Citation: Lam D, Enright HA, Cadena J, George VK, Soscia DA, Tooker AC, Triplett M, Peters SKG, Karande P, Ladd A, Bogguri C, Wheeler EK and Fischer NO (2023) Corrigendum: Spatiotemporal analysis of 3D human iPSC-derived neural networks using a 3D multi-electrode array. Front. Cell. Neurosci. 17:1340688. doi: 10.3389/fncel.2023.1340688
Received: 18 November 2023; Accepted: 22 November 2023;
Published: 07 December 2023.
Edited and reviewed by: Emilio Carbone, University of Turin, Italy
Copyright © 2023 Lam, Enright, Cadena, George, Soscia, Tooker, Triplett, Peters, Karande, Ladd, Bogguri, Wheeler and Fischer. This is an open-access article distributed under the terms of the Creative Commons Attribution License (CC BY). The use, distribution or reproduction in other forums is permitted, provided the original author(s) and the copyright owner(s) are credited and that the original publication in this journal is cited, in accordance with accepted academic practice. No use, distribution or reproduction is permitted which does not comply with these terms.
*Correspondence: Nicholas O. Fischer, ZmlzY2hlcjI5QGxsbmwuZ292; Doris Lam, bGFtMzFAbGxubC5nb3Y=
Disclaimer: All claims expressed in this article are solely those of the authors and do not necessarily represent those of their affiliated organizations, or those of the publisher, the editors and the reviewers. Any product that may be evaluated in this article or claim that may be made by its manufacturer is not guaranteed or endorsed by the publisher.
Research integrity at Frontiers
Learn more about the work of our research integrity team to safeguard the quality of each article we publish.