 Oanh Tran
 Holly J. Hughes
 Tom Carter
 Katalin Török
94% of researchers rate our articles as excellent or good
Learn more about the work of our research integrity team to safeguard the quality of each article we publish.
Find out more
ORIGINAL RESEARCH article
Front. Cell. Neurosci., 18 May 2023
Sec. Cellular Neurophysiology
Volume 17 - 2023 | https://doi.org/10.3389/fncel.2023.1155406
Introduction: Genetically encoded biosensors for monitoring intracellular calcium changes have advanced our understanding of cell signaling and neuronal activity patterns in health and disease. Successful application of GCaMP biosensors to a wide range of biological questions requires that sensor properties such as brightness and dynamic range, ligand affinity and response kinetics be tuned to the specific conditions or phenomena to be investigated. Random as well as rational targeted mutations of such sensor molecules have led to a number of important breakthroughs in this field, including the calcium sensors GCaMP6f and GCaMP6fu. jGCaMP8f of the most recently developed generation is promising a step-change in in vivo imaging with further increased fluorescence dynamic range. Here, we critically examine the biophysical properties of jGCaMP8f and report development by rational design of two novel variants of jGCaMP8f.
Methods: We determined the in vitro biophysical properties of jGCaMP8f and selected variants by fluorescence spectroscopies and compared their performance monitoring intracellular Ca2+ transients with previously developed fast and bright GCaMP sensors by live cell imaging.
Results: We demonstrate that the physiologically highly relevant Mg2+ not only majorly affects the kinetic responses of GCaMPs but also their brightness and fluorescence dynamic range. We developed novel variants jGCaMP8f L27A which has threefold faster off-kinetics and jGCaMP8f F366H which shows a ∼3-fold greater dynamic range than jGCaMP8f, in vitro as well as in HEK293T cells and endothelial cell line HUVEC in response to ATP stimulation.
Discussion: We discuss the importance of optimization of biosensors for studying neurobiology in the context of the novel variants of jGCaMP8f. The jGCaMP8f F366H variant with a large dynamic range has the potential to improve in vivo imaging outcomes with increased signal-to-noise ratio. The L27A variant with faster kinetics than jGCaMP8f has larger cellular responses than previous fast GCaMP variants. The jGCaMP8f generation and novel improved variants presented here will further increase the application potential of GECIs in health and disease.
GCaMP -style genetically encoded Ca2+ indicators (GECIs) superseded fluorescent Ca2+ indicator dyes as they enable imaging in tissues and organisms of higher integrity, with in vivo imaging of neuronal activity being the prize target (Dana et al., 2019; Shen et al., 2020). The development of GCaMPs stemmed from the creation of cpEGFP (Baird et al., 1999) in which the β-barrel structure of EGFP is disrupted and then corrected by Ca2+ binding to calmodulin (CaM) which in turn forms a high affinity complex with smooth muscle MLCK peptide (RS20). Fluorescence intensity increases as a result of a conformational change in the CaM-RS20-cpEGFP complex (Nakai et al., 2001). GCaMP generations from GCaMP to GCaMP3, GCaMP6 and GCaMP7, had increased brightness and fluorescence dynamic range (the fluorescence enhancement that occurs upon Ca2+ binding) (Tallini et al., 2006; Tian et al., 2009; Akerboom et al., 2012; Chen et al., 2013). The response on-rate determined by a conformational change in the CaM-RS20-cpEGFP complex varied from variant to variant while the response off-rate was generally inherently slow compared to action potential (AP) firing rate at the presynaptic terminals where GCaMPs were initially introduced (Tian et al., 2009; Steinmetz et al., 2017). Faster off-kinetics increase the time resolution of the observations, however, it is also important that the Ca2+ affinity remains appropriate for the intracellular [Ca2+] changes monitored so that the sensor signal represents a large fraction of the fluorescence dynamic range. Increased off-rates in GCaMP3fast, GCaMP6fu, and red fluorescent sensors f-RGECO1 and 2 were achieved by weakening the binding of the CaM-RS20 complex by introducing mutations to the CaM Ca2+-binding EF-hands and/or mutations in the RS20 peptide (Helassa et al., 2015, 2016; Kerruth et al., 2019). The targeted mutations in GCaMP3fast, GCaMP6fu, however, also lessened the restorative effect on cpEGFP and hence resulted in reduced brightness and dynamic range.
jGCaMP8f (Figure 1) is a member of the latest generation of GECIs and is reported to have increased sensitivity and dynamic range (Zhang et al., 2023). jGCaMP8f also has significantly faster off-kinetics than GCaMP6f. We measured the biophysical properties of jGCaMP8f in order to determine how targeted mutations affect them. We report novel variants L27A and F366H with further increased off-rate and fluorescence dynamic range, respectively, demonstrated in vitro and in cellular environments.
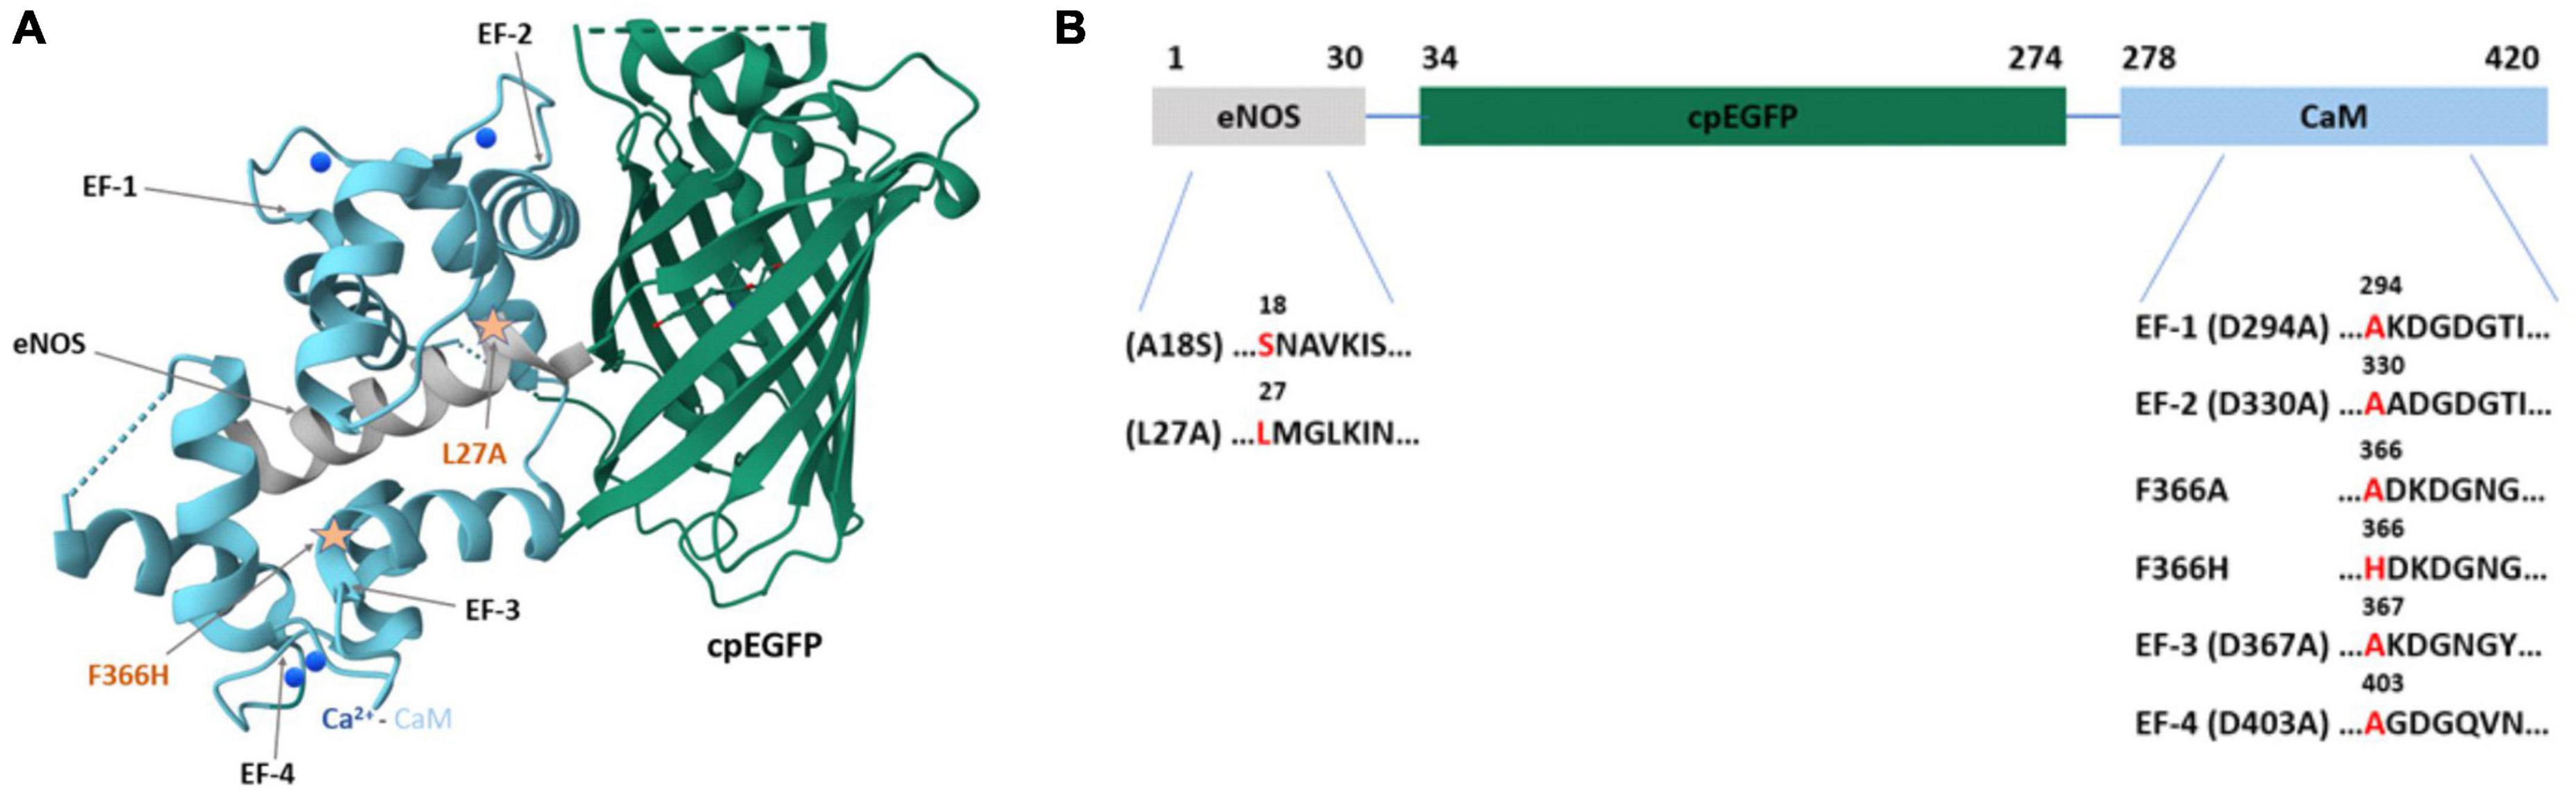
Figure 1. The structure of jGCaMP8f and mutation sites introduced. (A) The crystal structure of jGCaMP8f (PDB 7ST4). The CaM EF-hands and the position of some applied mutations is indicated by arrows. (B) Domain structure of jGCaMP8f with mutation sites highlighted.
pGP-AAV-syn-FLEX-jGCaMP8f-WPRE was purchased from Addgene (Plasmid #162379). pET30b vectors were obtained from Novagen. E. coli XL10-Gold and BL21 (DE3) Gold cells were purchased from Invitrogen. Subsequently, jGCaMP8f was cloned into a bacterial expression vector (jGCaMP8f pET30b) using DNA assembly (NEBuilder® HiFi DNA Assembly Cloning Kit, New England Biolabs, Inc.).
Using Q5® Site-Directed Mutagenesis Kit (New England Biolabs), a range of mutations of jGCaMP8f pET30b were generated. Primers (5′-3′) used for mutagenesis were:
A18S: CAAGGAGGTGAGCACCGCCGTG
L27A: CATCGCCCGCGCAATGGGCCTGAAG
D294A (EF-1): CTCCCTATTTGCCAAGGACGGGG
D330A (EF-2): AATGAAGTAGCTGCCGACGGTG
F366A: GTTCGGTGTGGCTGATAAGGATG
F366H: GTTCGGTGTGCATGATAAGGATG
D367A (EF-3): GGTGTGTTTGCTAAGGATGGC
D403A (EF-4): AGGGAAGCAGCCATCGATGGG
After mutagenesis, DNA sequences were sent to Genewiz for checking.
jGCaMP8f and variant proteins which contained His-tag were overexpressed in E. coli B21 Gold cells using 0.5 mM isopropyl thio-β-D-galactoside (IPTG) then purified on a NiNTA column (QIAGEN, ÄKTA Purifier, GE Healthcare) at 4 °C as described previously (Helassa et al., 2015). Protein purity was checked using SDS-PAGE then stored at −80°C.
Protein concentration was calculated from the absorption spectra of the proteins at wavelength 280 nm using the molar extinction coefficient of 26,360 M–1 cm–1 for jGCaMP8f and all variants calculated using the ProtParam tool (Expasy).
Fluorescence emission spectra of 0.5–1 μM jGCaMP8f or variant proteins in assay buffer (50 mM HEPES-K+, 100 mM KCl and 5 mM EGTA in the presence or absence of 2 mM MgCl2, pH 7.5) at 20°C were recorded using a Fluorolog-3 spectrofluorometer (Horiba©) at 492 nm excitation and 500 – 550 nm emission wavelengths. Subsequently, a saturated amount of CaCl2 was added to obtain the maximum fluorescence emission intensity. Data were normalized and plotted using GraphPad Prism 9 software.
The concentration of jGCaMP8f proteins was adjusted such that the absorbance at the excitation wavelength (492 nm) was between 0.001 and 0.1. A series of dilutions was prepared in a buffered solution (50 mM HEPES, pH 7.5, 100 mM KCl, 2 mM MgCl2 with either 5 mM EGTA, or 1 mM CaCl2) and the fluorescence spectra were recorded on a Fluorolog-3 (Horiba©). GCaMP6f quantum yield measured in Ca2+ -saturated buffer was used as a reference (Φ+Ca2+ = 0.59) (Chen et al., 2013). Data were plotted as integrated fluorescence intensity as a function of absorbance and fitted to linear gradient, S. Quantum yields were obtained using the following equation: Φprotein = ΦGCaMP6f × (Sprotein/SGCaMP6f).
To determine the apparent pKa for each jGCaMP8f protein, a series of buffers were prepared. Depending on their respective pH buffering range, an appropriate buffer was used for the measurements (MES for pH 6–6.5, HEPES for pH 7–8, TRIS for pH 8.5–9 and CAPS for pH 10). The pH titrations were performed by recording fluorescence spectra in Ca2+ -free (50 mM buffer, 100 mM KCl, 2 mM MgCl2, 2 mM BAPTA) or Ca2+-saturated (50 mM buffer, 100 mM KCl, 2 mM MgCl2,1 mM CaCl2) measuring 1 μM protein at 0.5 pH unit intervals at 20°C (Fluorolog-3, Horiba©). Excitation wavelength was set at 492 nm and emission in the 500–600 nm range was recorded. BAPTA was chosen as Ca2+ chelator because of its stable affinity for Ca2+ over the pH range.
Ca2+ association and dissociation rates were measured using a TgK Scientific KinetAsyst™ double-mixing stopped-flow apparatus in single mixing mode at 20°C. The fluorescence was excited at 492 nm and the emission was collected using a 530 nm cut-off filter. For Ca2+ association, 500 nM jGCaMP8f or variant proteins in 50 mM HEPES-K+, 100 mM KCl, 2 mM MgCl2, 5 mM EGTA, pH 7.5 at 20°C were rapidly mixed with increasing concentrations of Ca2+ (CaCl2 in 50 mM HEPES-K+, 100 mM KCl, 2 mM MgCl2, 5 mM EGTA, pH 7.5 at 20°C), calculated free [Ca2+] ranged from 108 nM to 252 μM in the mixing chamber). For Ca2+ dissociation, 500 nM jGCaMP8f or variant proteins in 50 mM HEPES-K+, 100 mM KCl, 2 mM MgCl2, 200 μM CaCl2, pH 7.5 at 20°C were rapidly mixed with 50 mM HEPES-K+, 100 mM KCl, 2 mM MgCl2, 10 mM EGTA, pH 7.5 at 20°C. Experiments were repeated at least three times. Kinetic records shown are the average of at least four traces. Averaged data were fitted to a single or double exponential using KinetAsyst software (TgK Scientific) to obtain association or dissociation rates. The error quoted is the standard error of the fit. For the rate plots, the mean values obtained from at least three experiments are shown, the error bars represent S.E.M.
Free Ca2+ concentration [Ca2+] was calculated using the two-chelators Maxchelator program (Schoenmakers et al., 1992). Fluo-3 (Biotium) with known apparent dissociation constant for calcium (Kd, the Ca2+ concentration at which half-maximum fluorescence intensity is achieved, 450 nM) was used to verify the calculated [Ca2+].
Fluorescence emission spectra were recorded using a Fluorolog-3 spectrofluorometer (Horiba©) at specific excitation and emission wavelengths, 20°C. When bound to Ca2+, the Fluo-3 excitation peak is at 506 nm and the emission peak is at 526 nm; the respective wavelengths for jGCaMP8f and all variant proteins are 492 nm and 512 nm. One μM jGCaMP8f or variant proteins in assay buffer (50 mM HEPES-K+, 100 mM KCl, 2 mM MgCl2 and 5 mM EGTA, pH 7.5 at 20°C) were titrated by stepwise addition of a solution of 500 mM CaCl2 until no further changes in fluorescence emission intensity were observed. Experiments were done in triplicates. Data was corrected for dilution, normalized and expressed as mean ± S.E.M. Kd and Hill coefficient for indication of cooperativity (n) were obtained by fitting the data to the Hill equation using GraphPad Prism 9 software.
HEK293T cells were maintained in Dulbecco’s Modified Eagle’s Media (DMEM, high glucose, from Sigma D6546) supplemented with 10% fetal bovine serum and 4 mM L-glutamine, in 75 cm2 flasks. At 90% confluence, cells were grown in poly-D-lysine coated glass-bottomed dishes (MatTek Corporation) at 300,000 cells per dish for 24 h. Cryopreserved pooled primary human umbilical vein endothelial cells (HUVEC) were purchased from PromoCell GmbH (Heidelberg Germany). HUVEC were grown in a human growth medium (HGM) which comprised media M199 supplemented with 20% FCS. A total of 50 μg/mL of the antibiotic gentamicin along with ECGS (endothelial cell growth supplement; 30 μg/mL) and heparin (10 U/mL) were added to the media. HUVEC were grown on 24 well trays or 9 mm glass coverslips that had been pre-treated with porcine skin gelatine (1% w/v) for 30 min at 37°C. Cells were cultured for 4 days in a 5% CO2 incubator at 37 °C until fully confluent as assessed by visual examination by light microscopy.
Transfection of HEK293T was accomplished using Lipofectamine™ 2000 (Invitrogen): 2.5 μg of plasmid DNA was combined with 5 μL Lipofectamine™ 2000 reagent in Opti-MEM, this was then added to the 2 mL cell culture medium per dish. Transfection of HUVEC was by Nucleofection using an Amaxa Nucleofector 2b device and the HUVEC old transfection reagent (Lonza, Slough, UK) according to manufactures. Experiments were performed 24 h after transfection.
Transfected HEK293T cells or HUVEC were transferred to a physiological saline solution (145 mM NaCl, 5 mM KCl, 1.2 mM CaCl2, 1 mM MgCl2, 1 mM NaH2PO4, 10 mM glucose, 20 mM Na+-HEPES pH 7.4) and placed on the stage of an inverted Olympus IX71 fluorescence microscope. The microscope was equipped with an Olympus UPLSAPO × 100 1.40 NA objective and an OptoLED light source (Cairn Research, Faversham, UK) for EGFP (470 ± 20 nm) fluorescence. Excitation light was directed to the specimen via a 500DCXR dichroic mirror (Chroma Rockingham, USA) and emitted light collected through a 535 ± 30 nm emission filter onto an Ixon3 EMCCD camera (Andor, Belfast, UK) operated in frame transfer mode at full gain and cooled to −68 °C. Images were acquired at 20 frames/s using Winfluor software.1 Intracellular Ca2+ release in HEK293T cells was induced by ATP. ATP was administered as a bolus of 50 μL diluted in imaging buffer to give a final concentration of 50 μM in HEK293T cells and 2 μM for HUVEC. The higher sensitivity of HUVEC to ATP is reflected in the different ATP concentrations used. Full dynamic range was measured following the addition of 10 μM ionomycin. The fluorescence changes during ATP stimulation were analyzed using Winflour software. A square region of interest (ROI) was placed over a peripheral cytoplasmic region of each cell. The mean background fluorescence was measured by placing an ROI with the same dimensions at a point at which no cell was present. GraphPad Prism 9 was used to plot and fit data. Time-to-peak was determined by the time in which the rise amplitude increased from 10 to 90%. Decay t1/2 was determined from an exponential function fitted for individual records when possible, or by determining the time required for the signal dropping to half the amplitude. Data are expressed as mean ± S.E.M. For further statistical analysis one-way ANOVA tests were carried out with post-hoc Dunnett’s multiple comparison test. Different number of data points could be extracted for the different parameters due to the variability of individual cell responses. For example, following a clear rising phase, the decay phase may include oscillations or plateaus that complicate fitting and analysis. In some cells when ionomycin was added, no clear response was seen.
In creating jGCaMP8f, the RS20 peptide used in most previous GCaMP designs was substituted for the CaM binding domain of nitric oxide synthase (eNOS) (Zhang et al., 2023). The relative positions of the Ca2+/CaM–peptide complex and cpEGFP are revealed in an adaptation of the crystal structure of jGCaMP8f (PDB ID: 7ST4) (Figure 1A).
We generated variants by introducing mutations in the CaM EF-hands and selected sites in the eNOS peptide (Figure 1B). Mutation at the EF-hands gave the D294A (EF-1), D330A (EF-2), D367A (EF-3), and D403A (EF-4) variants. In the eNOS peptide we made the A18S, L27A and in CaM the F366H and F366A mutations.
Mutations in the Ca2+ binding sites of CaM and/or in the eNOS peptide of jGCaMP8f will weaken the binding affinity resulting in faster calcium off-kinetics [L27A, A18S, D294A (EF-1), D330A (EF-2), D367A (EF-3), D403A (EF-4)] (Figure 1B). In designing the D294A (EF-1), D330A (EF-2), D367A (EF-3), and D403A (EF-4) variants, mutation of the first Asp residue of the EF-hand, known to disable Ca2+ binding (Jama et al., 2011), was expected to increase the Ca2+ off-rate. Likewise, the L27A and A18S mutations in the eNOS peptide were made to destabilize hydrophobic interactions with Ca2+/CaM with the expectation of increasing the off-rate, albeit to a lesser extent.
In turn, mutations that stabilize the Ca2+/CaM – eNOS peptide complex may increase the brightness and fluorescence dynamic range (F366A, F366H). The F366 residue in CaM is adjacent to EF-3 and is involved in hydrophobic interactions with the peptide. We designed two mutations, F366H and F366A, with the view of reducing hydrophobicity and size to increase dynamic range.
We were interested to see how these mutations affected the brightness and dynamic range, apparent Ca2+ affinity and kinetic responses of the variants in comparison with jGCaMP8f. We furthermore tested the response of jGCaMP8f, its novel variants and previously generated fast GCaMP variants to ATP stimulation in HEK293T cells and HUVEC.
jGCaMP8f is reported to have a 79-fold fluorescence enhancement upon Ca2+ binding and an off-rate of 37 s–1 at 20°C (Zhang et al., 2023). Surprisingly, we measured an only sevenfold increase for jGCaMP8f (Figure 2A). Puzzled by the large discrepancy, we checked the experimental conditions. We found that the very high dynamic range was measured in the absence of Mg2+ and at pH 7.2 as opposed to our buffer that contains 2 mM Mg2+ and is adjusted to pH 7.5. Remeasuring the dynamic range of jGCaMP8f in the absence of Mg2+ (pH 7.5), we got a remarkably different result: the fluorescence of jGCaMP8f increased 31-fold upon Ca2+ binding. We then compared fluorescence intensities with or without added Mg2+ in the presence of EGTA and in the presence of Ca2+ (Figure 2A). We found equal intensities in Ca2+ with or without Mg2+. In the absence of Ca2+, however, the addition of 2 mM Mg2+ increased the fluorescence intensity of jGCaMP8f ∼4-fold.
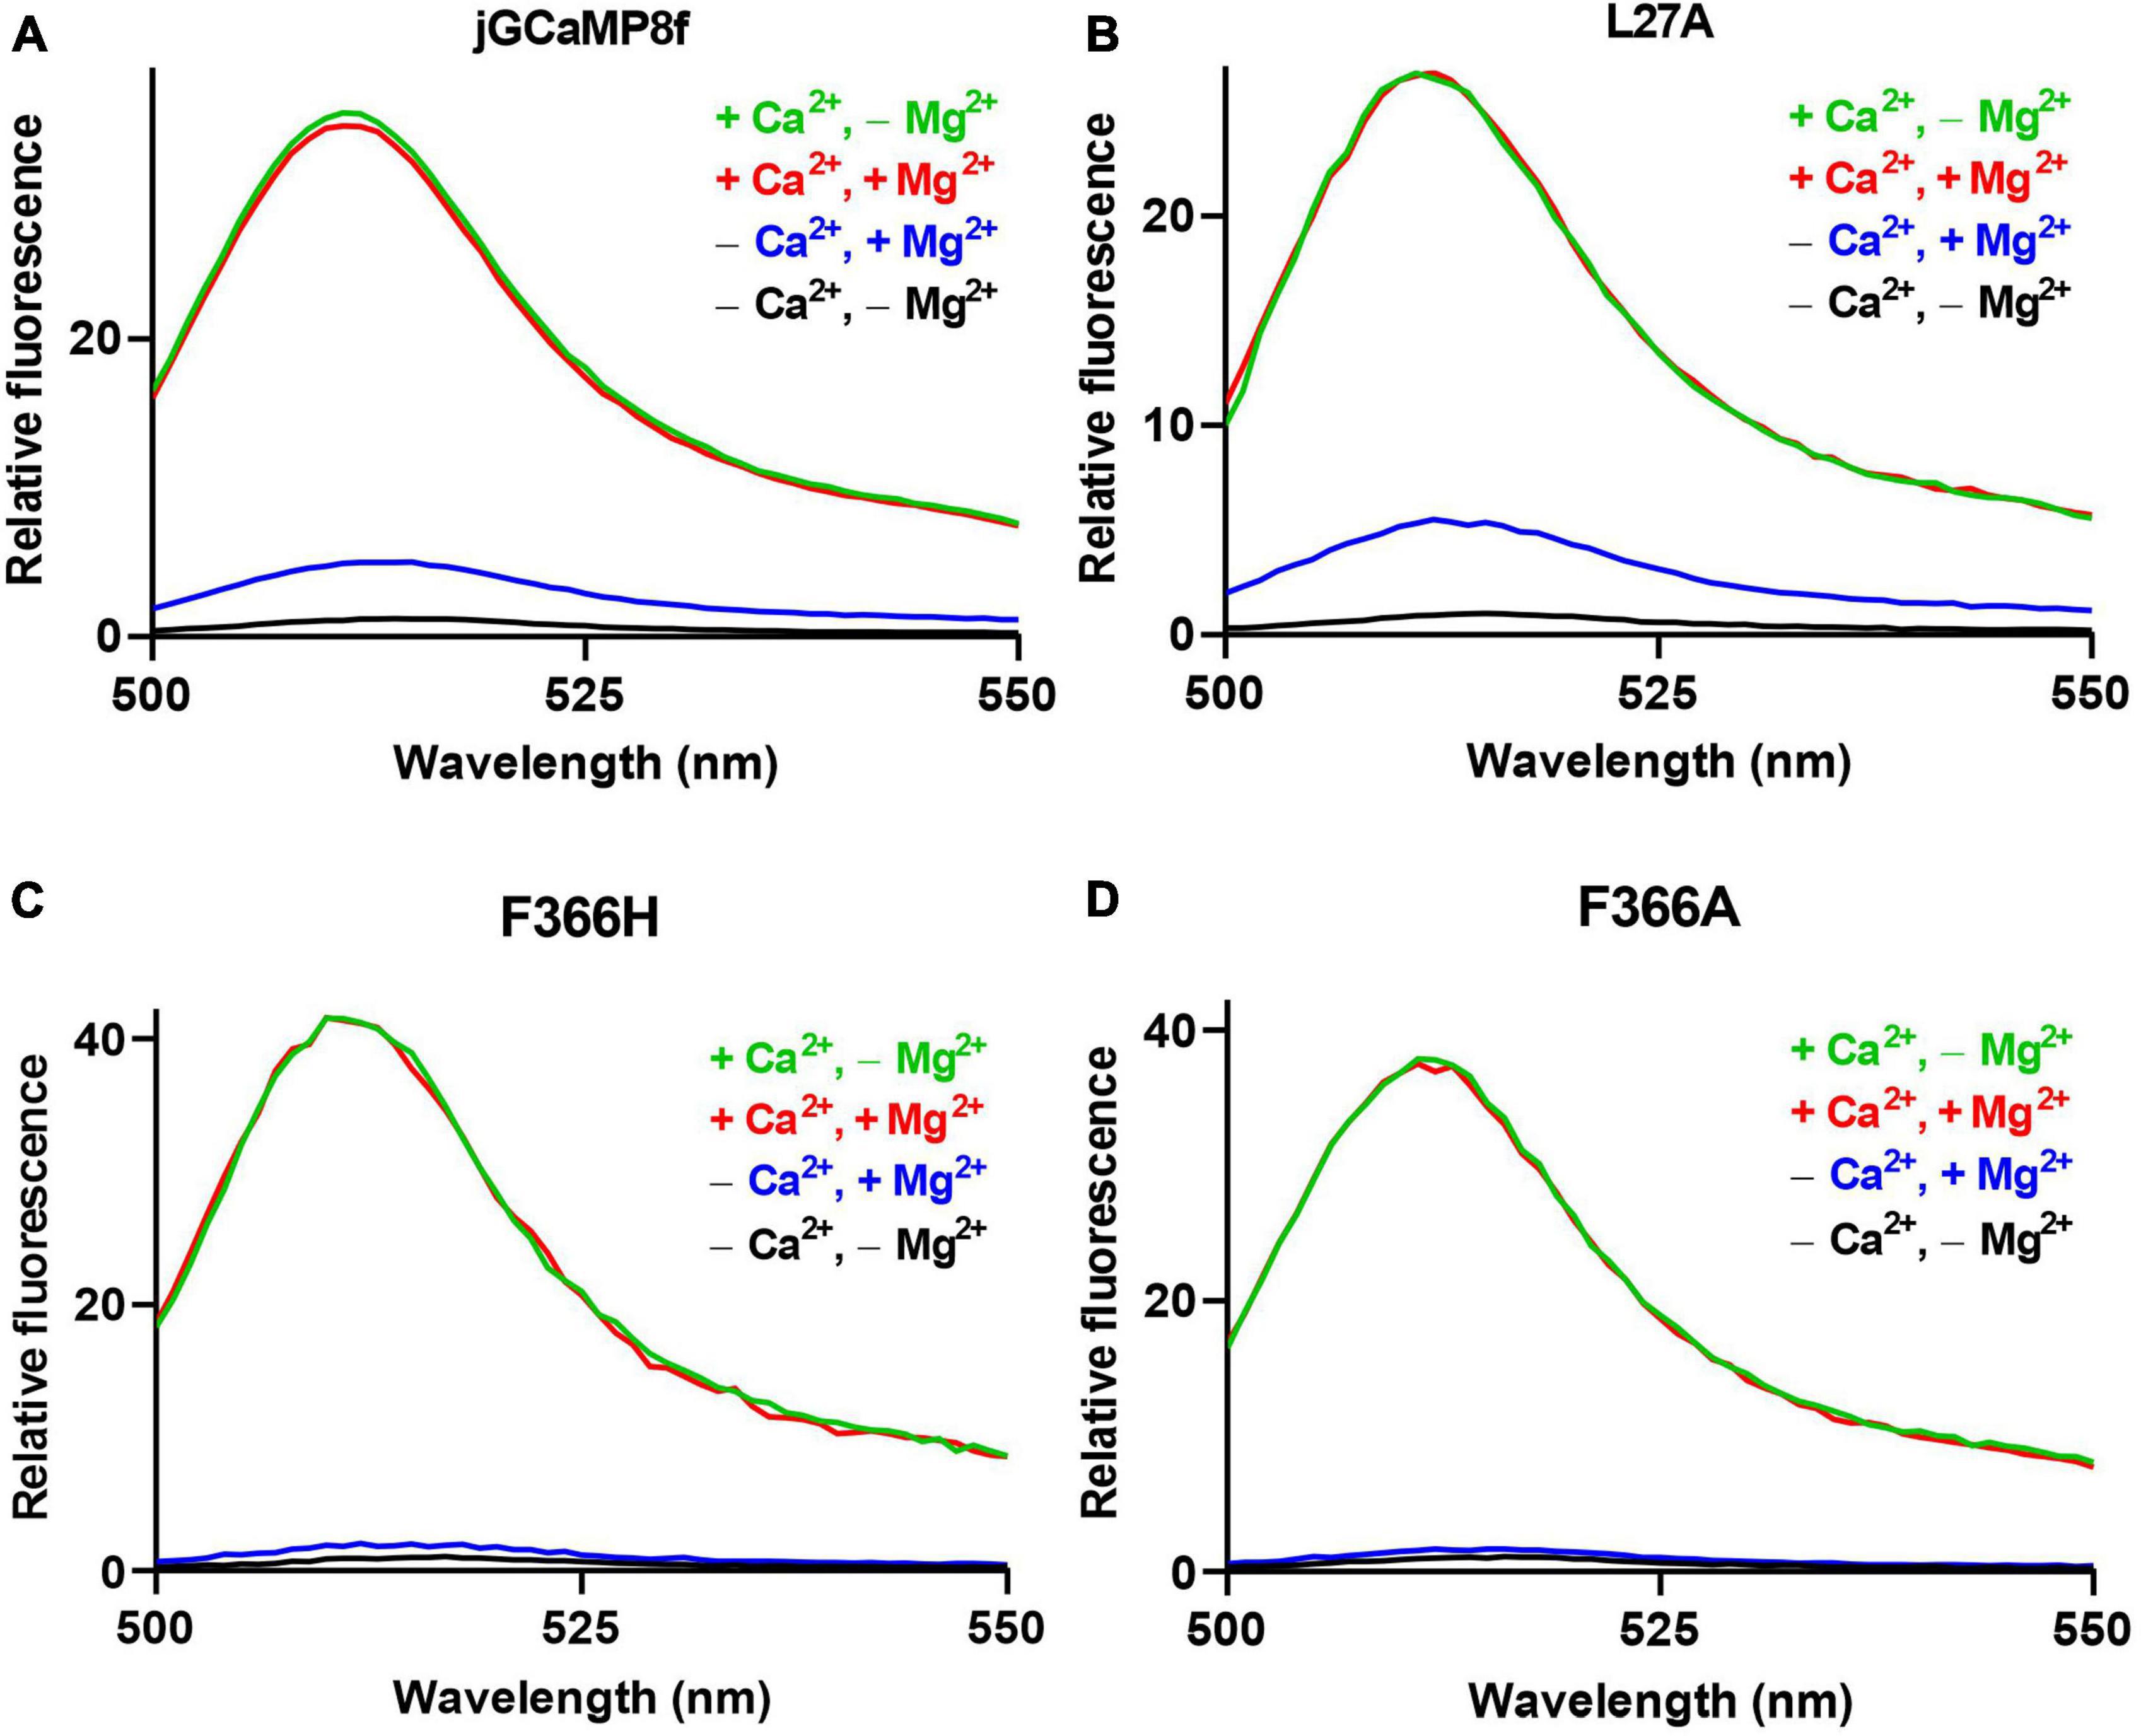
Figure 2. The effect of Mg2+ on the apo-state fluorescence intensity of jGCaMP8f and its variants. Fluorescence dynamic range measurements of (A) jGCaMP8f, (B) L27A, (C) F366H, and (D) F366A. Mg2+ does not affect the fluorescence intensity of the Ca2+-saturated form, green line (+Ca2+, –Mg2+), in 50 mM HEPES-K+, 100 mM KCl, 0.5 mM CaCl2, pH 7.5 and red line (+Ca2+, +Mg2+), in 50 mM HEPES-K+, 100 mM KCl, 2 mM MgCl2, 2 mM MgCl2, 0.5 mM CaCl2, pH 7.5. However, in the apo-form, black line (–Ca2+, –Mg2+), in 50 mM HEPES-K+, 100 mM KCl, 5 mM EGTA, pH 7.5, addition of 2 mM Mg2+ causes a fluorescence increase (–Ca2+, +Mg2+) in jGCaMP8f and its variants, thus reducing the dynamic range compared to that measured in the absence of Mg2+.
A similar pattern was seen for the L27, F366H, and F366A (Figures 2B–D; Table 1). For the L27A variant only a 5.5-fold increase (comparable to the sevenfold measured for jGCaMP8f) was found in the presence of Mg2+, this, however, increased to 27-fold in the absence of Mg2+ (Figure 2B; Table 1). In the presence of Mg2+, Ca2+ binding induced 25- and 27-fold increases for the F366H and F366A variants, respectively, ∼3-fold greater than jGCaMP8f (Figures 2C, D). When measuring the dynamic range of the F366H and F366A jGCaMP8f variants in the absence of Mg2+ (pH 7.5), we obtained a 42-fold and a 37-fold increase upon Ca2+ binding, respectively, compared to 31-fold for jGCaMP8f (Figure 2; Table 1). Thus, Mg2+ binding to apo-jGCaMP8f and its variants significantly affects their fluorescence intensity in vitro and hence it is likely significant in determining the fluorescence dynamic range in resting cells. Moreover, novel variants jGCaMP8 F366H and F366A have significantly increased fluorescence dynamic range compared to jGCaMP8f (Table 1). The other mutations that were introduced had little effect on the dynamic range of jGCaMP8f (Supplementary Table 2) and thus were not investigated in detail for the effect of Mg2+.
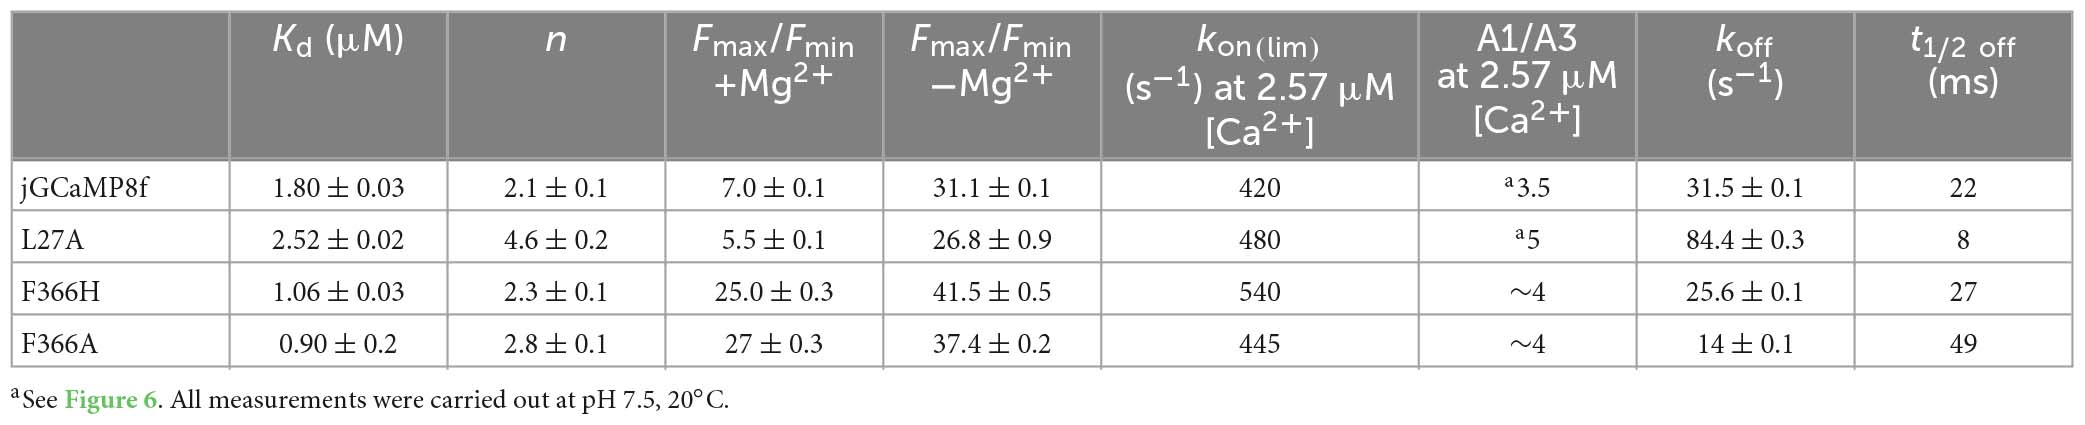
Table 1. Biophysical characterisation of jGCaMP8f and novel variants.
We measured the molecular brightness of jGCaMP8f and the L27A and F366H variants, in the presence of 2 mM Mg2+ (Supplementary Table 1). Measurement of molar extinction coefficient values at 492 nm [εo(492 nm)] in saturating Ca2+ of jGCaMP8f, 54,226 M–1cm–1 and a quantum yield of 0.52 gave a brightness value of 28.3 mM–1cm–1. This compares well with 29.7 mM–1cm–1 measured for GCaMP6f in the absence of Mg2+ (Chen et al., 2013) [N.B. in the presence of Ca2+, Mg2+ has no effect on brightness (Figure 2)]. The values measured for L27A, εo(492 nm) 48,107 M–1cm–1 (quantum yield 0.54) and F366H, εo(492 nm) 21,203 M–1s–1 (quantum yield 0.53) suggest that lower brightness of the apo-form rather than increased brightness of the Ca2+-bound form of the F366H variant underlies its increased fluorescence dynamic range compared to jGCaMP8f. In contrast, for the L27A variant, the Mg2+ induced large increase in fluorescence intensity in the apo form accounts for the loss in dynamic range. Neither fluorescence intensity nor εo(492 nm) is affected by Mg2+ in saturating Ca2+. The only available data for comparison of the apo form with and without Mg2+ is for jGCaMP8f (Supplementary Table 1) showing that while in Mg2+ εo(492 nm) is 8,413 M–1cm–1, in the absence of Mg2+it is reduced to 1,930 M–1cm–1, consistent with the 4-fold increase in fluorescence intensity by Mg2+ in the absence of Ca2+ (Figure 2; Table 1).
The pH dependence of the fluorescence intensity with or without Ca2+ (in the presence of 2 mM Mg2+) present revealed that for jGCaMP8f and the L27A and F366H variant, the intensities increased for both the Ca2+-bound and apo-forms, the dynamic ranges decreased with increasing pH, peaking at pH 7 (Supplementary Figure 1). pKa values for the Ca2+-bound form were 7.2, 7 and 7.5, respectively.
The Ca2+ association kinetics of jGCaMP8f measured in the presence of 2 mM Mg2+ at pH 7.5 proved remarkably complex, occurring in four phases. The pattern of the four phases was dependent on [Ca2+]. The four phases are illustrated in records taken at 1.4 μM [Ca2+] at a short timescale of 35 ms (Figure 3A) and a long timescale of 4.5 s (Figure 3B). The observed rates for phases 1, 2, 3, and 4 are denoted R1, R2, R3, and R4. In phases 1, 3, and 4 the fluorescence increases, however, in phase 2 the fluorescence intensity decreased. Phase 2 is no longer detected at [Ca2+] > 2.5 μM (Figure 3C). Phase 1 had a fast, ∼500 s–1 observed rate (kobs), R1 (Figure 3D). With an off-rate of 33.5 s–1, t1/2 for fluorescence decay upon Ca2+ sequestration was 22 ms (Figure 3E).
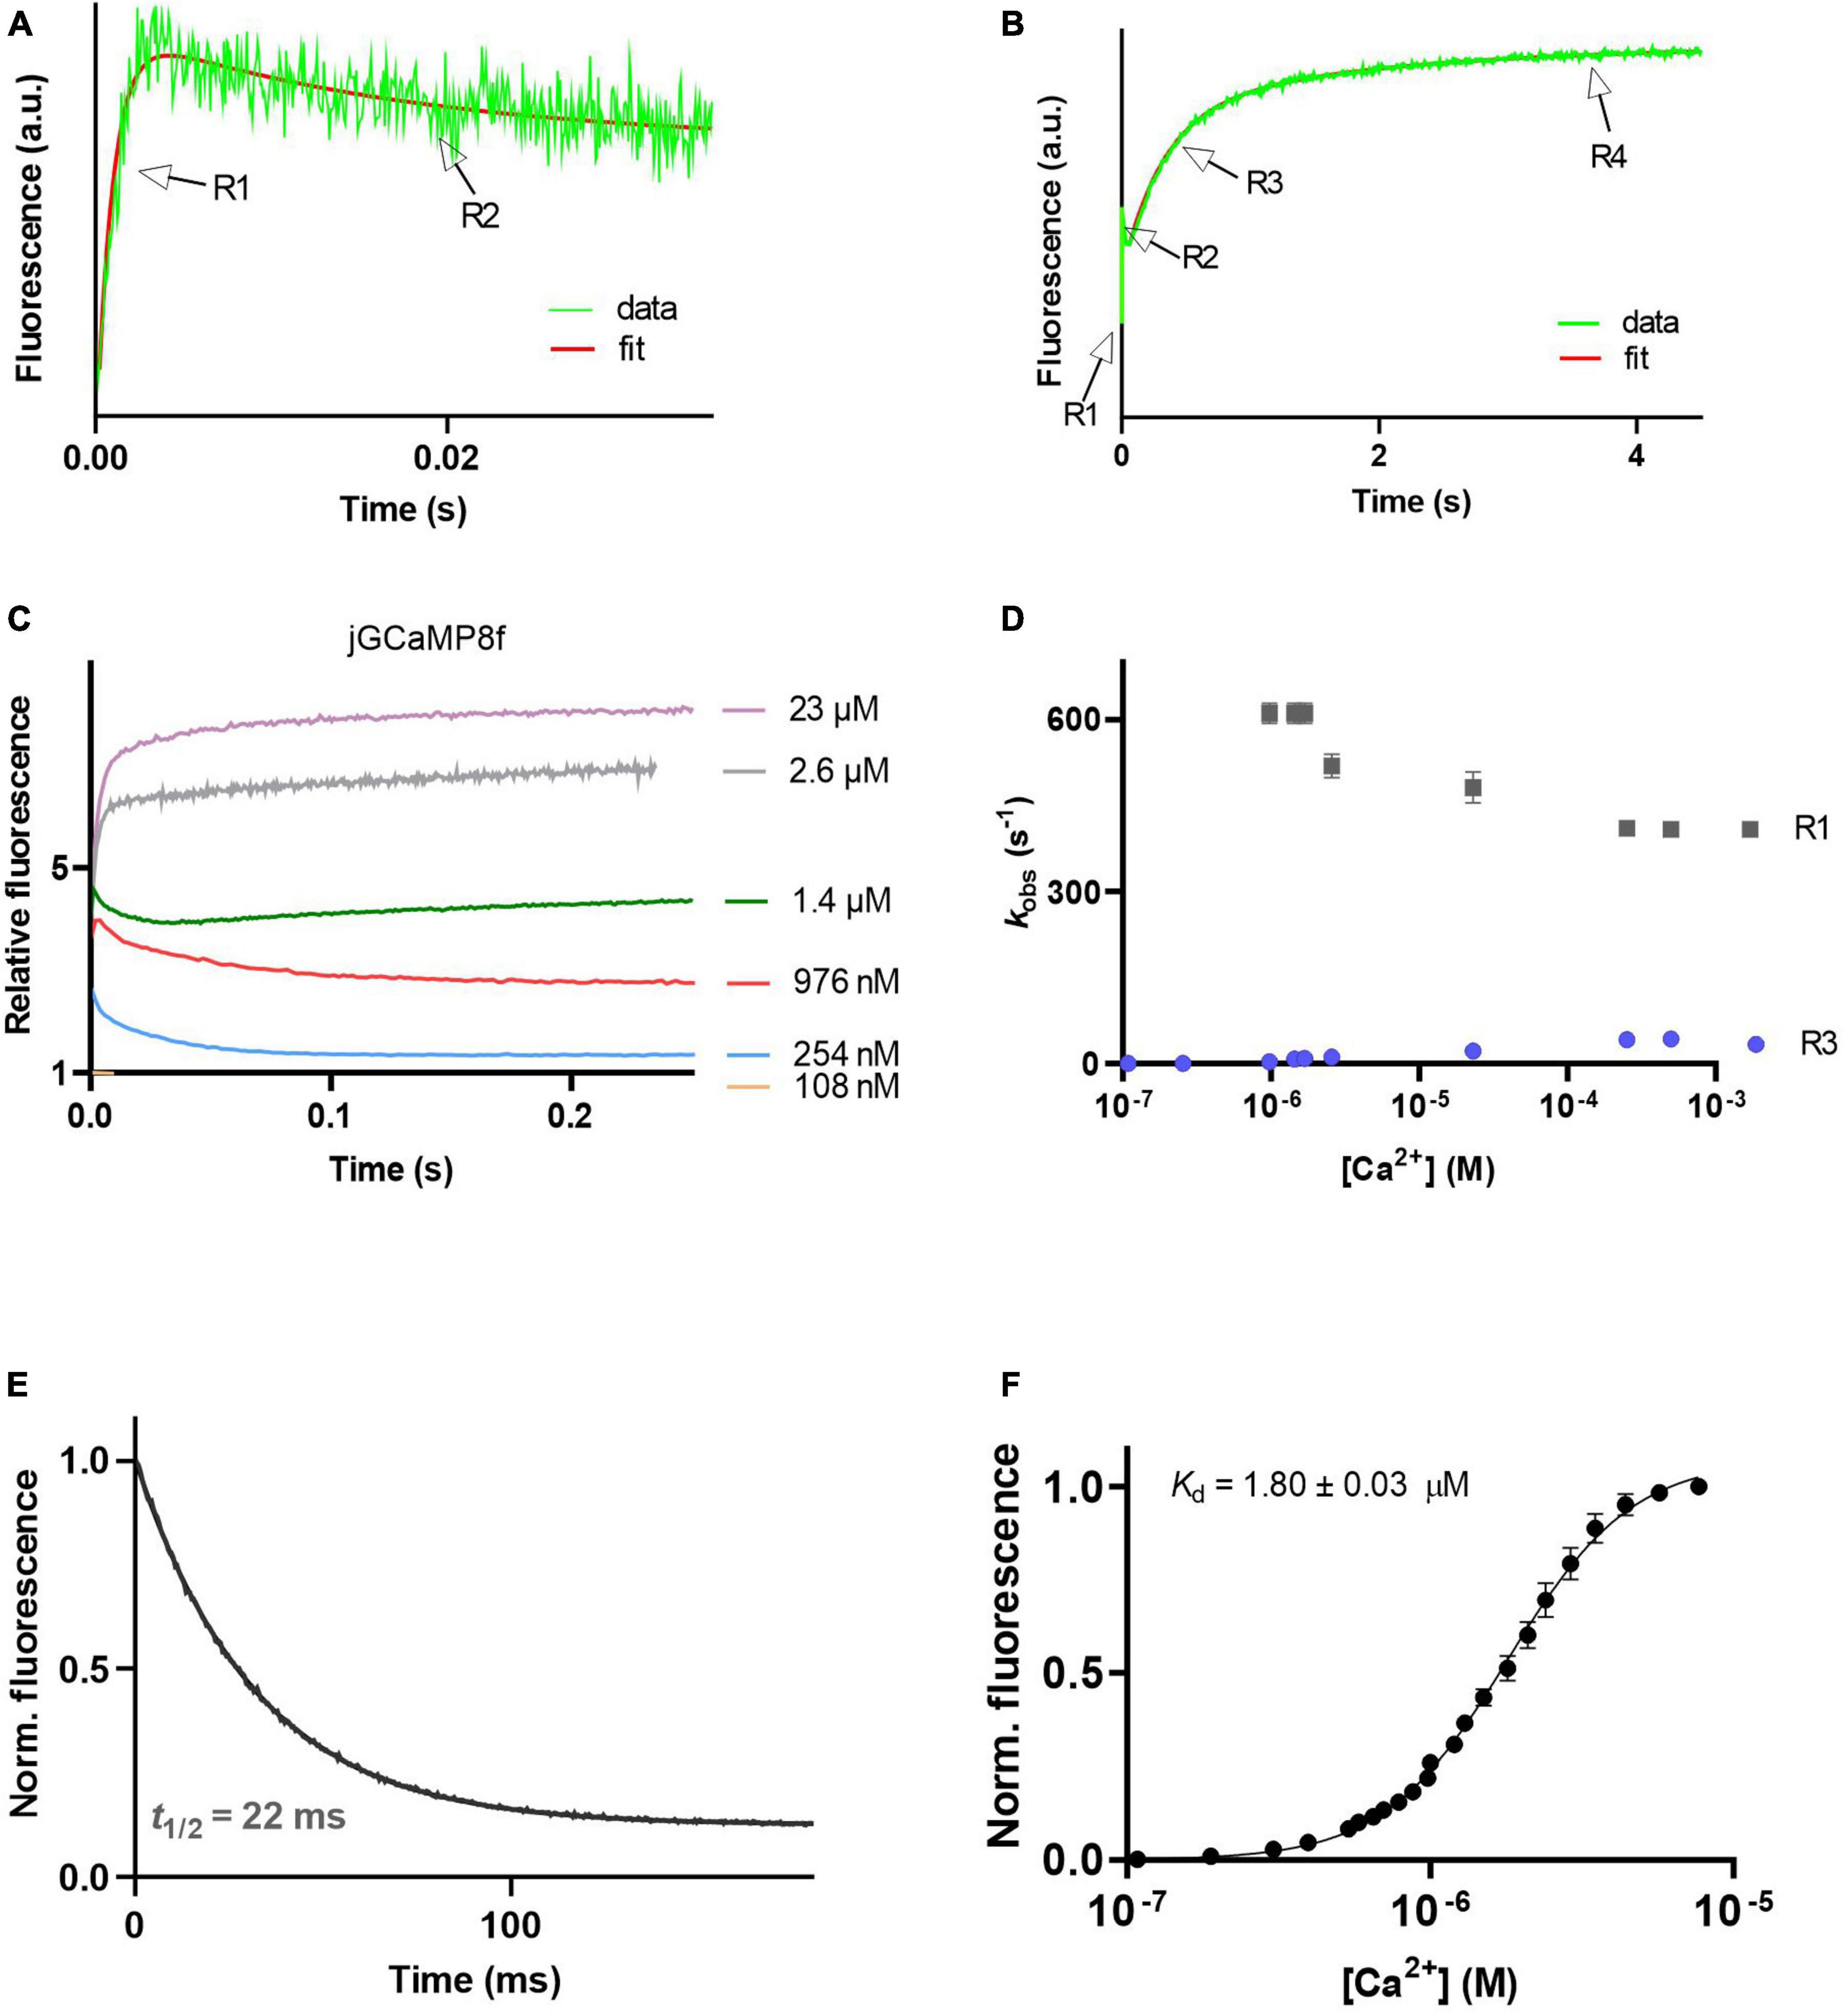
Figure 3. Ca2+ response kinetics and affinity of jGCaMP8f. (A) Stopped-flow association kinetic record obtained over 35 ms at 1.4 μM [Ca2+], the first and second phase of fluorescence changes are resolved, R1 and R2 refer to their observed rates, respectively. (B) Stopped-flow association kinetic record obtained over 4.5 s at 1.4 μM [Ca2+], revealing the four phases of fluorescence changes. Observed rates for the third and fourth phase are referred to as R1 and R2, respectively. (C) Association kinetic records obtained over a range of [Ca2+]. (D) Plot of observed association rates as a function of [Ca2+], kobs for phases 1 (R1) and 3 (R3) are displayed. (E) Dissociation kinetic record and (F) equilibrium Ca2+ titration curve. The fitted parameters are shown in Table 1.
The L27A variant had similarly complex on-kinetics to jGCaMP8f (Figure 4A), with fast (∼300 s–1) initial on-rate (R1) (Figure 4B). The off-rate of the L27A variant was 84.4 s–1 (decay t1/2 of 8.2 ms) (Figure 4C) threefold faster than that of jGCaMP8f.
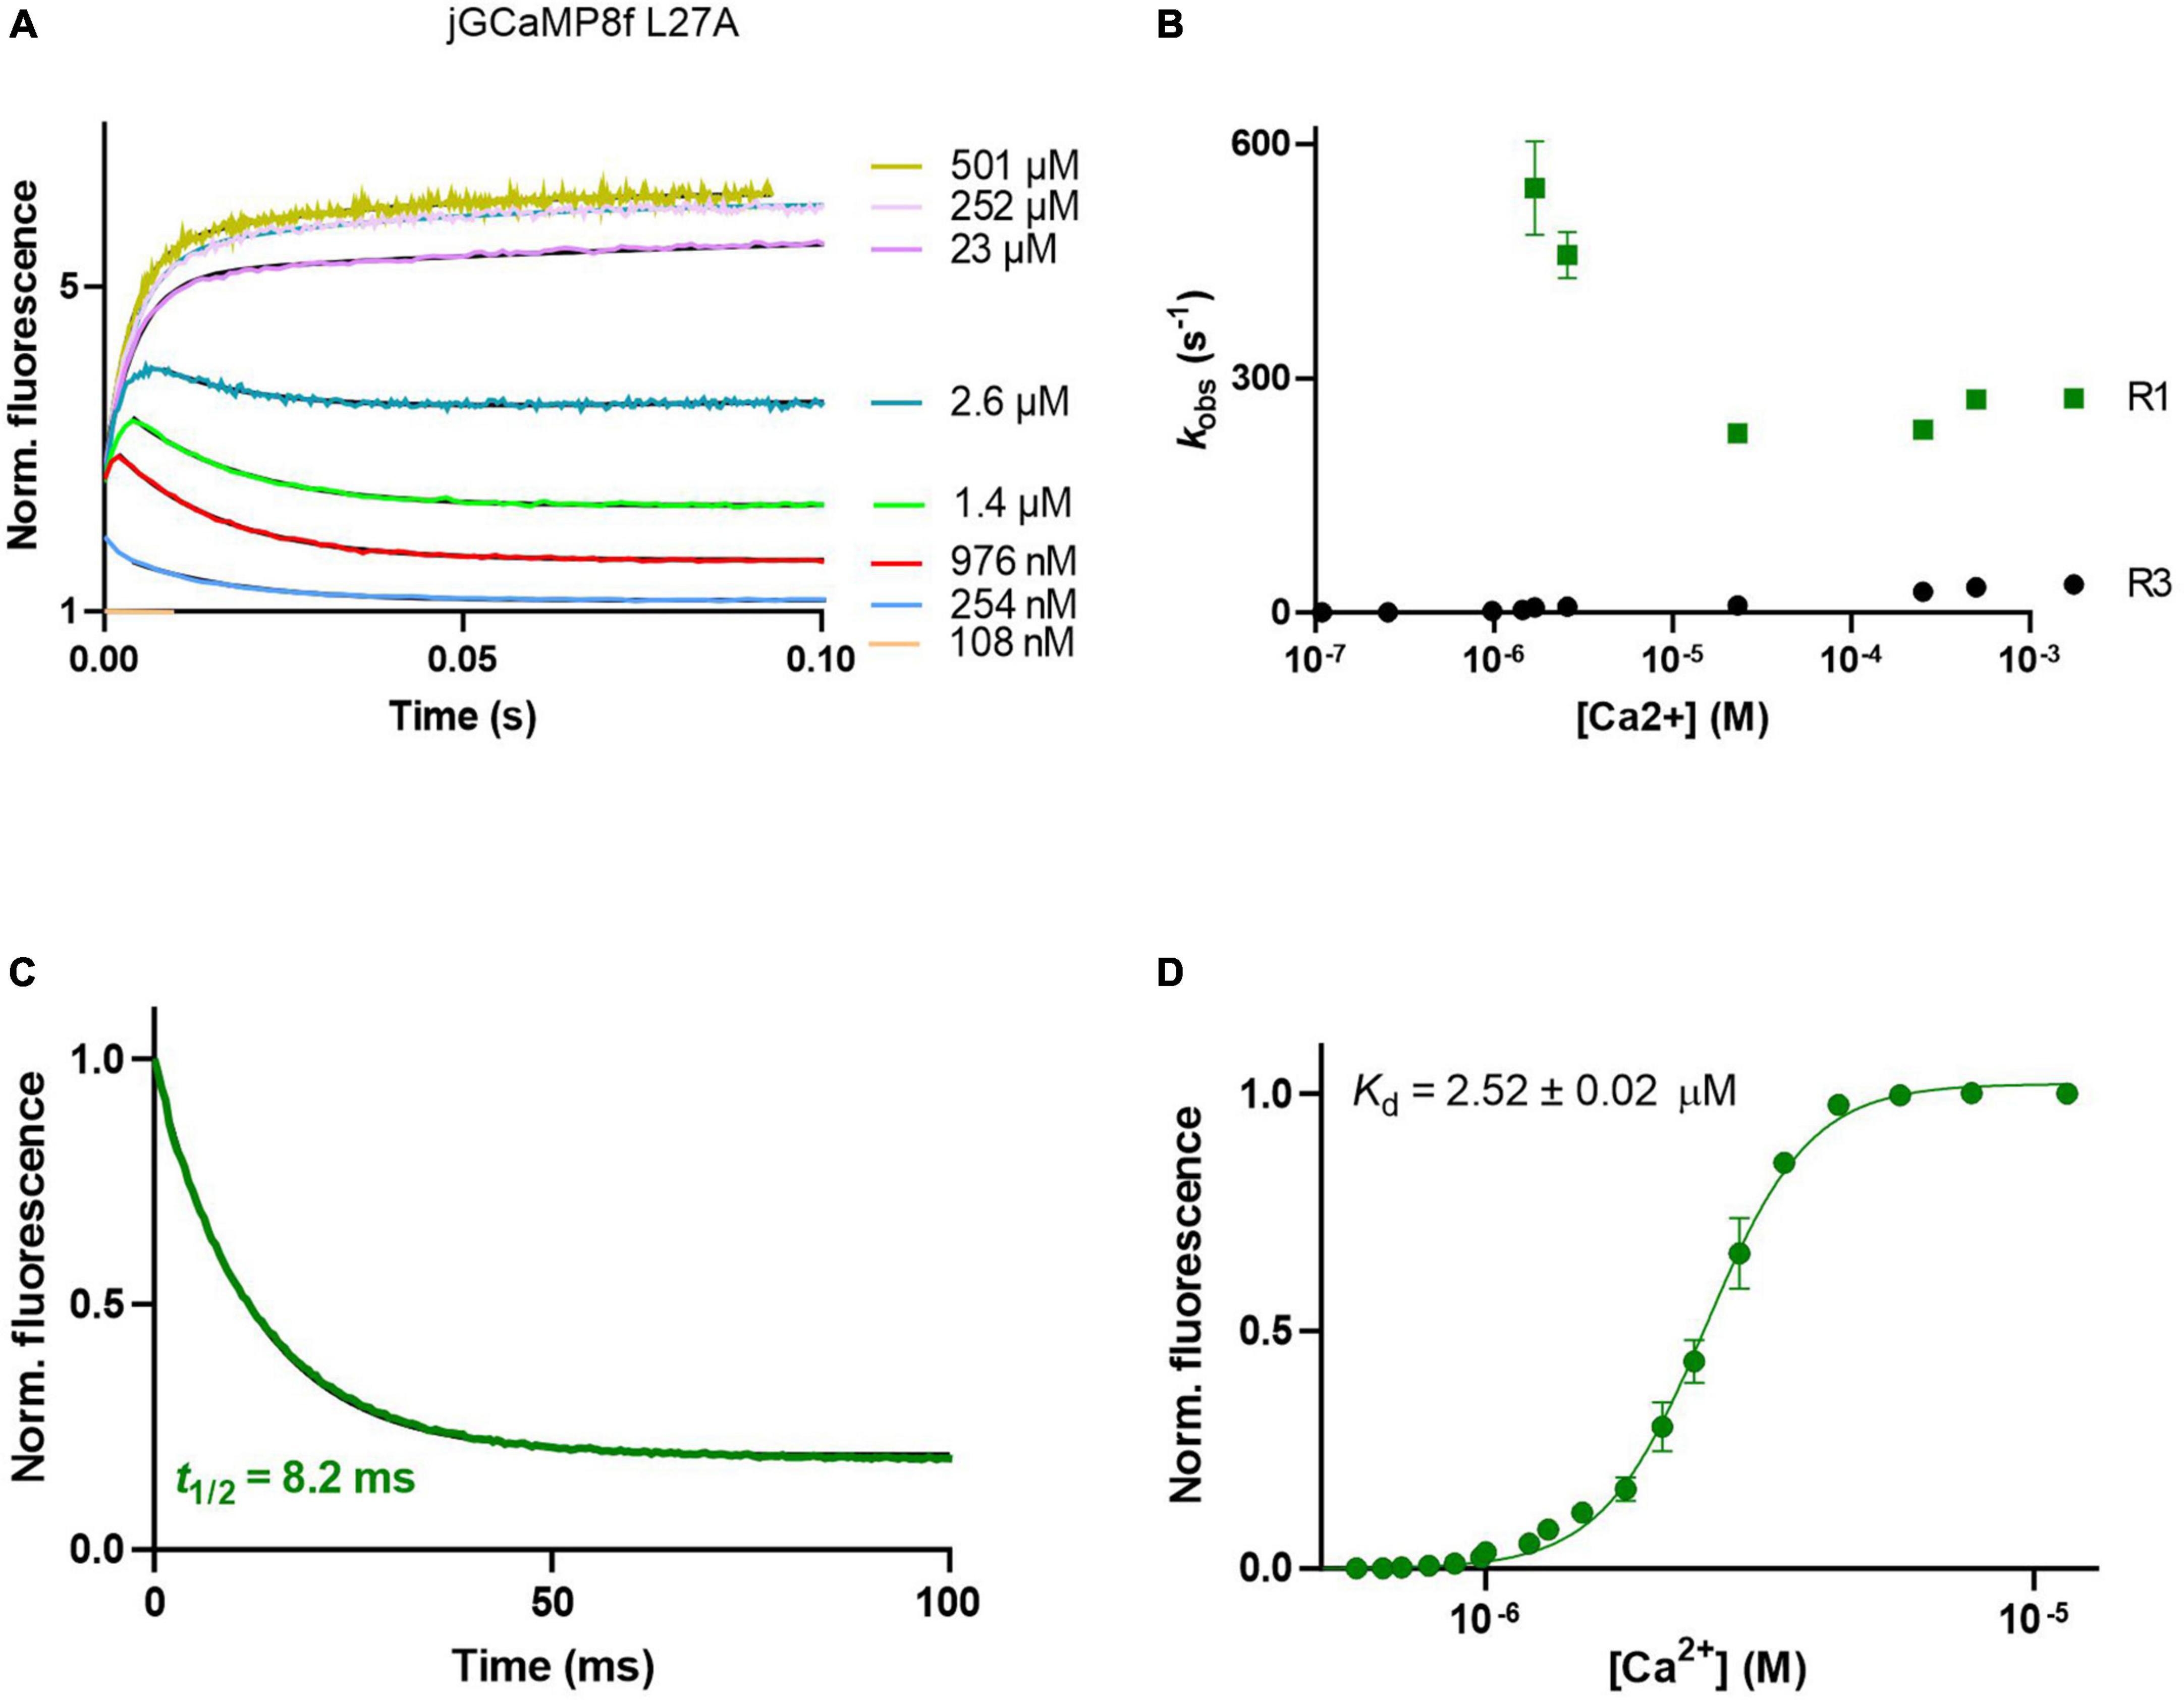
Figure 4. Ca2+ response kinetics and affinity of jGCaMP8f L27A. (A) Association kinetic records obtained over a range of [Ca2+]. (B) Plot of observed association rates as a function of [Ca2+], kobs for phases 1 (R1) and 3 (R3) are displayed. (C) Dissociation kinetic record and (D) equilibrium Ca2+ titration curve. The fitted parameters are shown in Table 1.
jGCaMP8f F366H showed a similar pattern of association kinetics to jGCaMP8f and the L27A variant (Figure 5A), with > 500 s–1 initial on-rates (R1) measurable in the μM [Ca2+] range (Figure 5B). The F366H variant had a similar off-rate of 33 s–1 to jGCaMP8f (Figure 5C). The F366A variant also had improved fluorescence enhancement (27-fold), however, both the on- and the off-rates of this variant are slowed down to 171 s–1 and 14 s–1, respectively (Supplementary Figures 3G, H; Table 1).
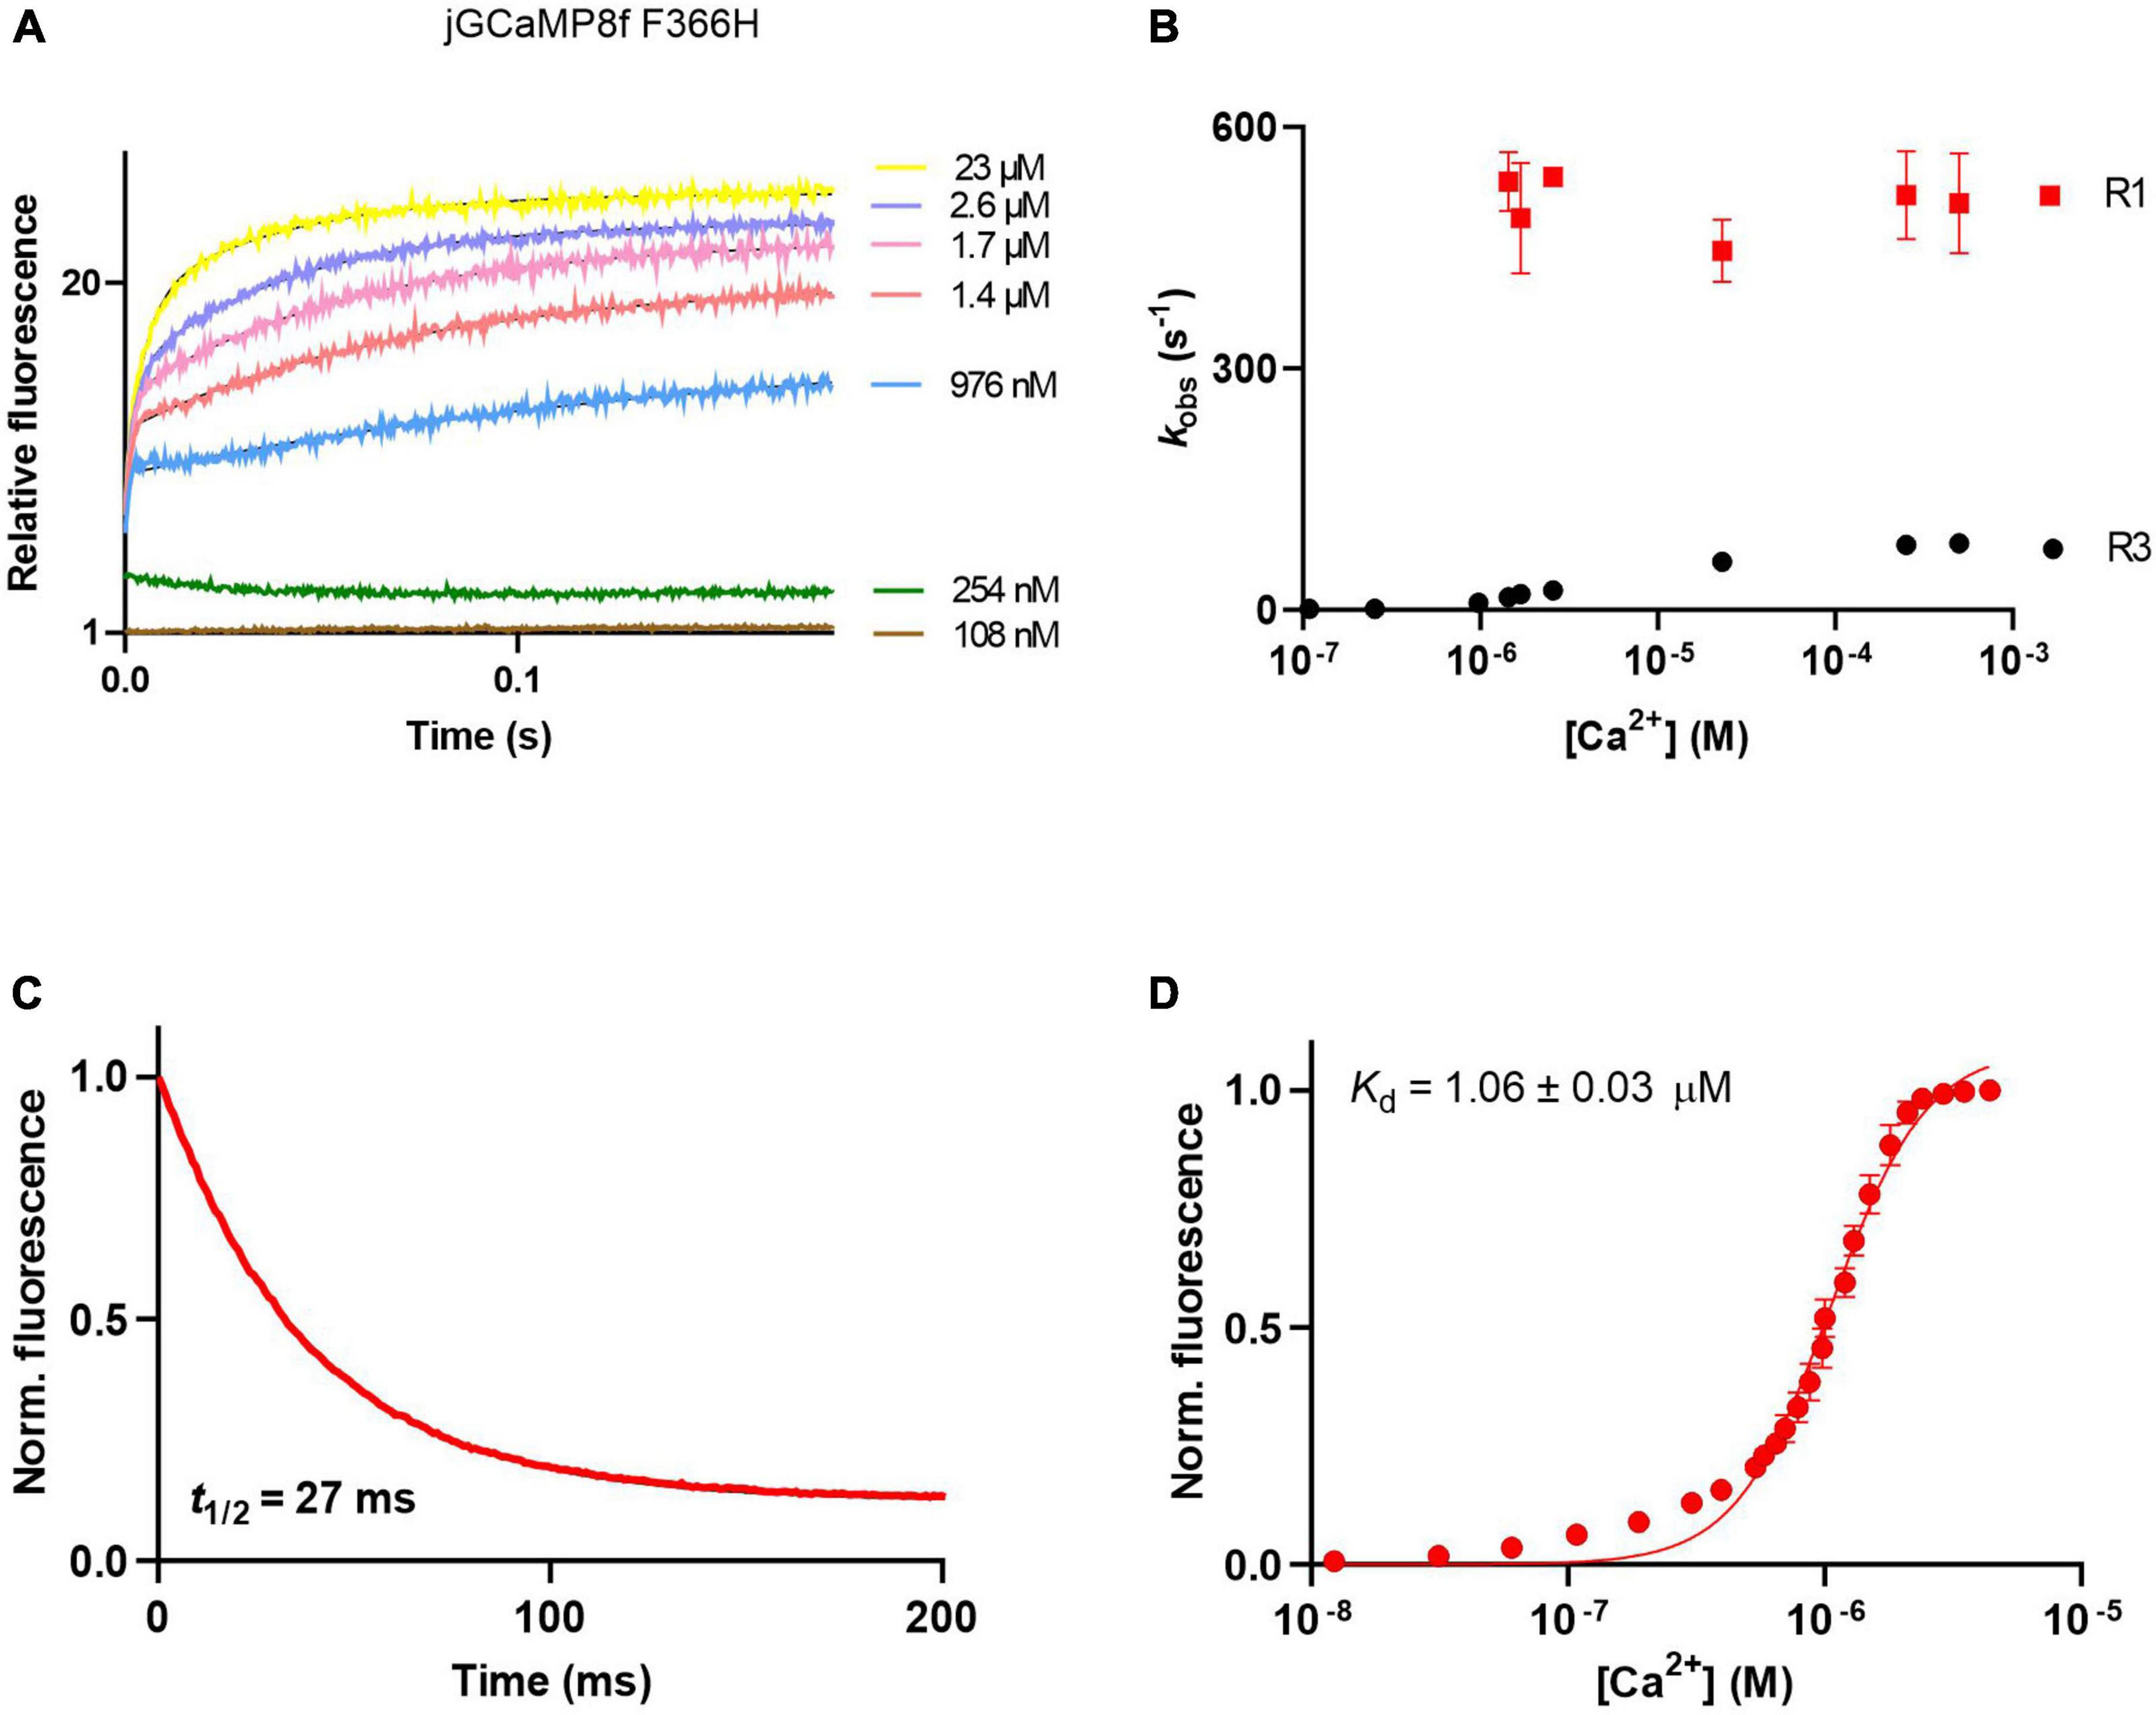
Figure 5. Ca2+ response kinetics and affinity of jGCaMP8f F366H. (A) Association kinetic records obtained over a range of [Ca2+]. (B) Plot of observed association rates as a function of [Ca2+], kobs for phases 1 (R1) and 3 (R3) are displayed. (C) Dissociation kinetic record and (D) equilibrium Ca2+ titration curve. The fitted parameters are shown in Table 1.
Supplementary Figure 3 shows the on- and off-kinetic responses of the other variants. Notably, the D367A (EF-3) and D403A (EF-4) mutations had very little effect on either the kinetic or fluorescence responses of jGCaMP8f (Supplementary Figures 3I, J; Supplementary Table 1). The A18S variant had a slightly increased, eightfold dynamic range and slightly slower off-rate (25 s–1) than jGCaMP8f (Supplementary Table 2).
Measurement of the Ca2+ on- and off-response rates of GCaMPs informs on the interaction mechanisms. Furthermore, simple rate and amplitude measurements are usually sufficient as screening tools for judging the sensors’ potential for cell imaging. However, given the complexity of their on-kinetics, for jGCaMP8f and its variants detailed analysis of the rate and amplitude patterns of the four phases of the on-response was required to see if the [Ca2+] range where the fast on-phase is the most significant is compatible for intracellular applications. Such analysis helped predict if our novel variants perform well in the cellular environment. As examples, the rate and amplitude patterns of the four phases of the on-response of jGCaMP8f, the L27A, D294A (EF-1), D330A (EF-2), and F366H variants were studied.
Figure 6 shows the Ca2+ dependence of the four phases of the on-fluorescence response of jGCaMP8f and its L27A, D294A (EF-1), D330A (EF-2), and F366H variants, revealing that rates (R1 ↑) of the fast, rising phase (400–1,000 s–1) are highest at around 1–2.5 μM [Ca2+] for all five proteins (Figure 6A). In the second phase R2 ↓ of 50–250 s–1, the fluorescence change is inverted and shows little Ca2+ dependence (Figure 6B). The third phase is upward with a slow kobs (R3 ↑) of 5 s–1 which increases to ∼30 s–1 in the 1–2.5 μM [Ca2+] range for the F366H variant, while only at high [Ca2+] for the other four proteins (Figure 6C). kobs for the fourth phase (R4 ↑) is slow ∼1 s–1 (Figure 6D). The low μM [Ca2+] range, in which the response rates and patterns are considered most relevant to function in the cellular environment, is highlighted by a red box.
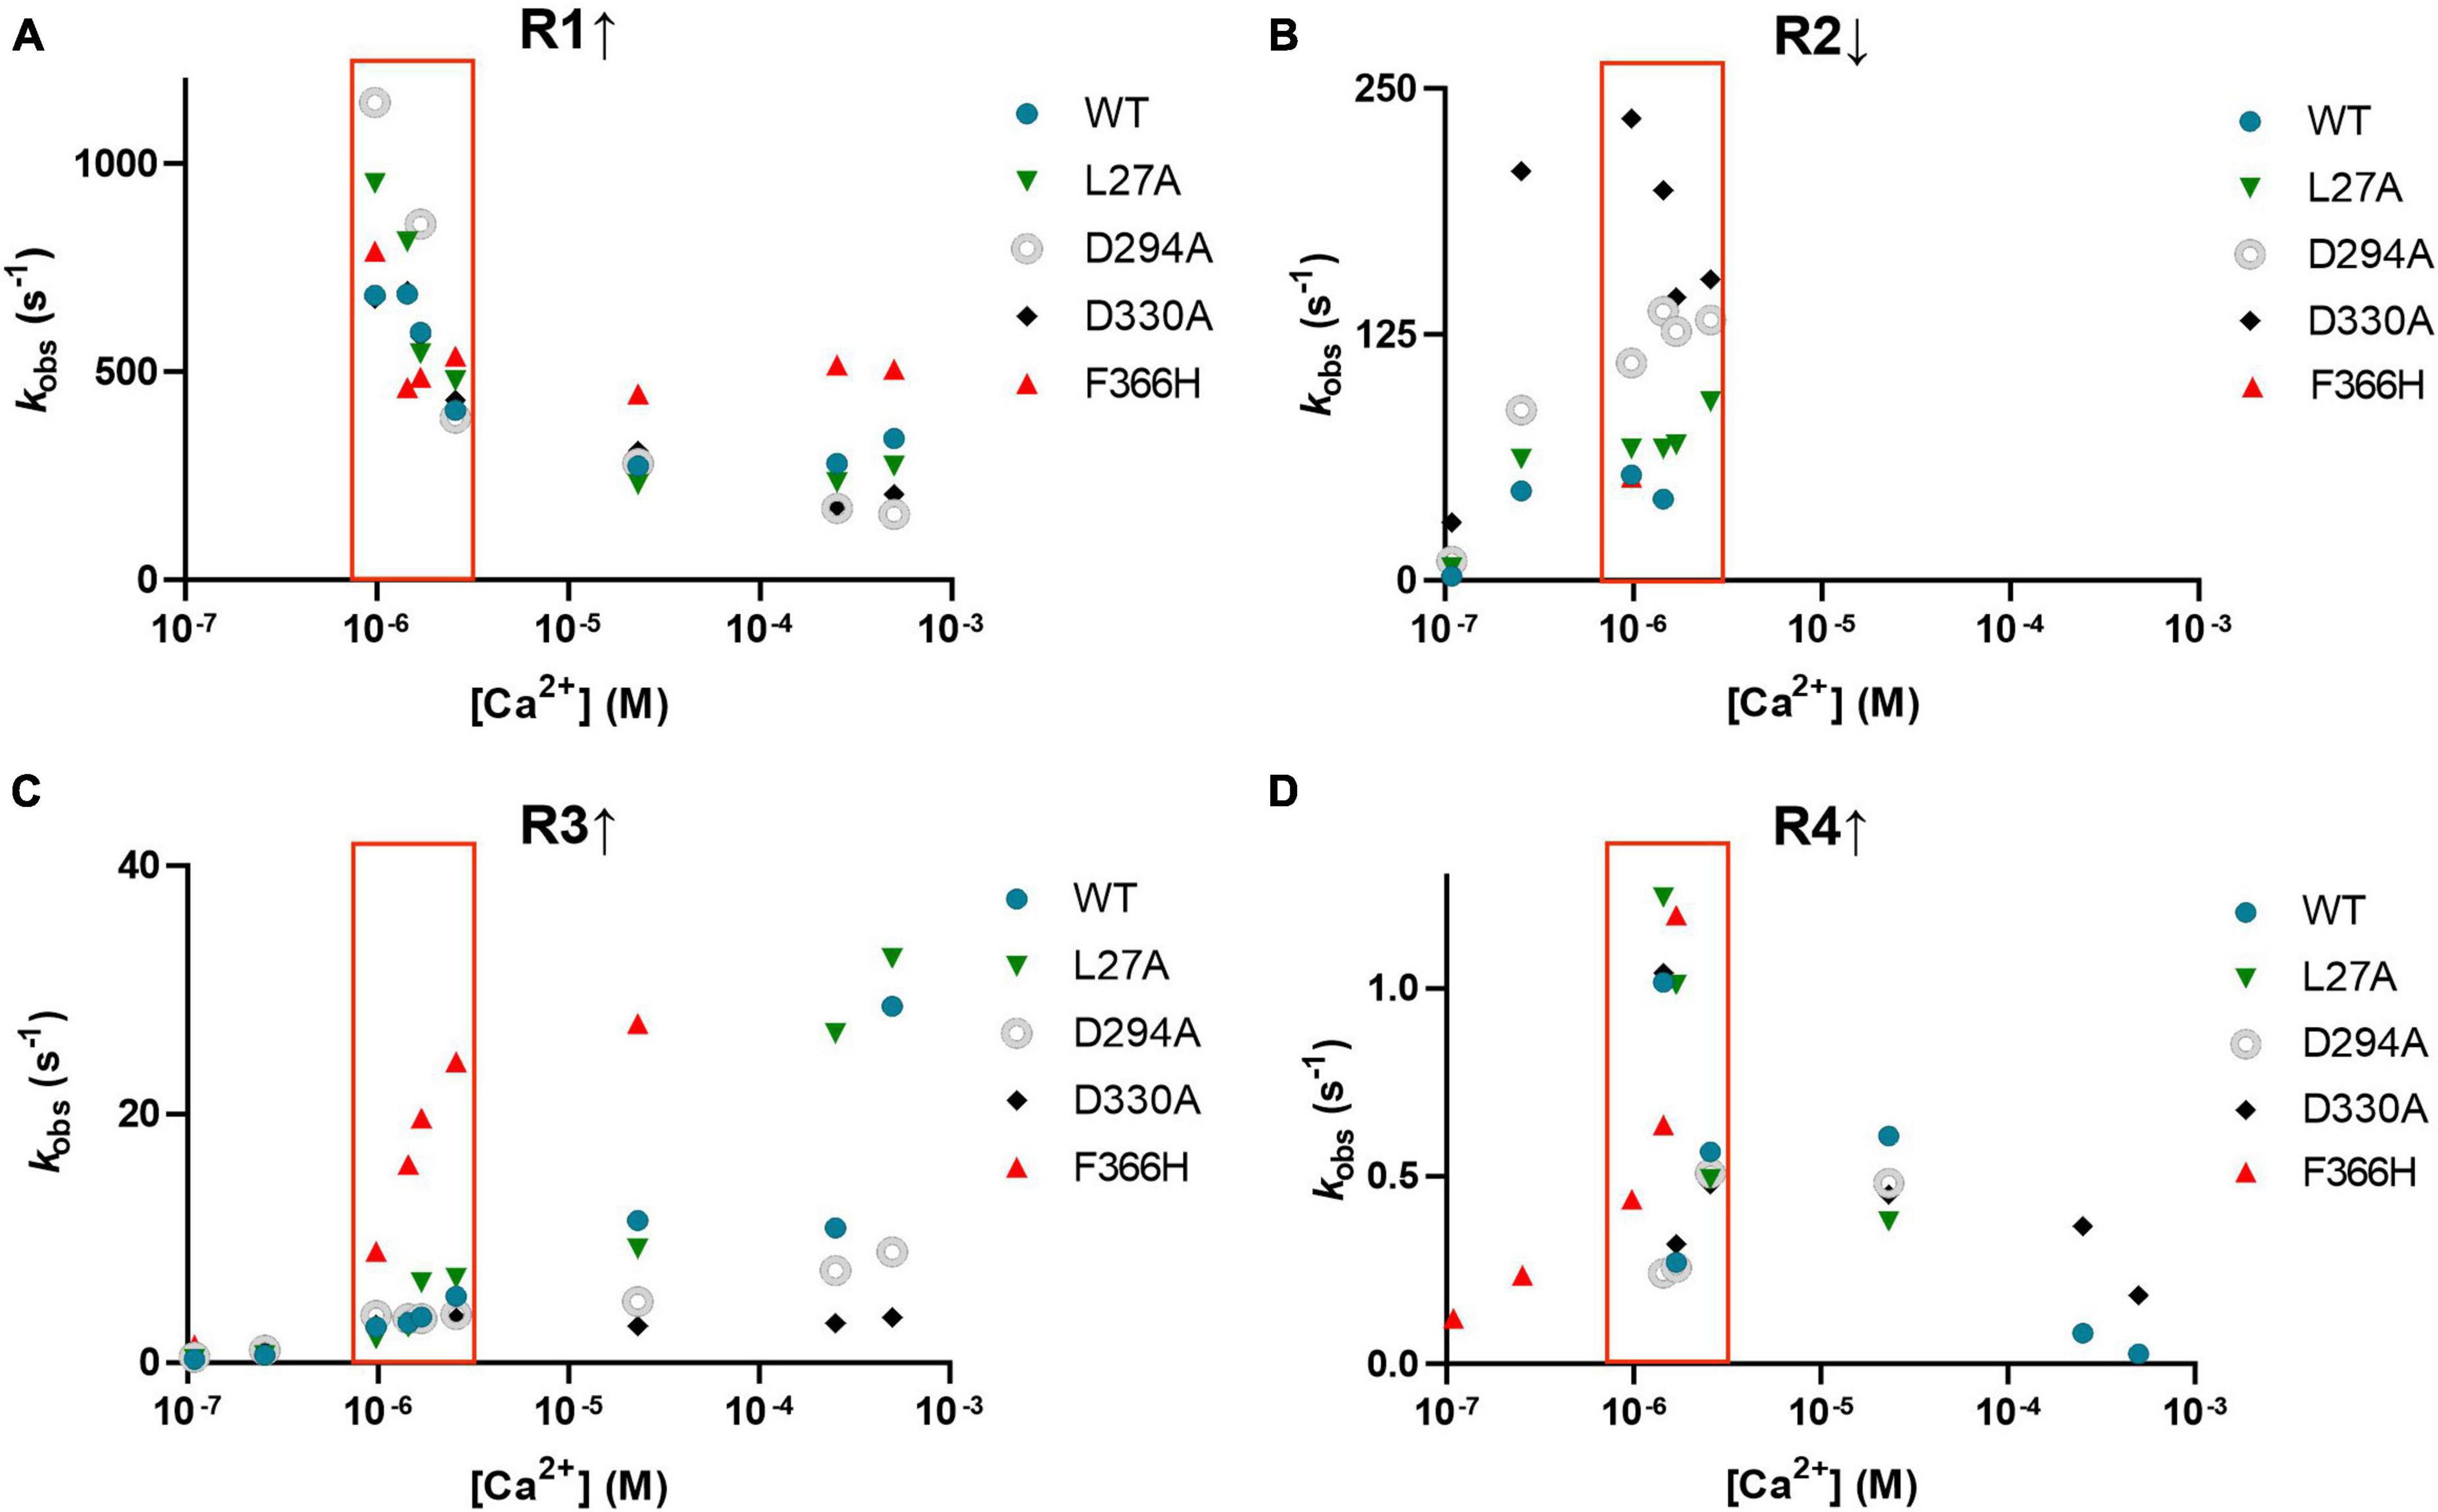
Figure 6. Observed rates of each of the four phases of the association kinetic records measured over a range of [Ca2+] of jGCaMP8f and selected variants. (A) R1 ↑ (B) R2 ↓, (C) R3 ↑ and (D) R4 ↑. The low μM [Ca2+] range, in which the response rates and patterns are considered most relevant to function in the cellular environment, is highlighted by a red box.
Analysis of the amplitudes (A1, A2, A3, and A4, corresponding to phases 1, 2, 3, and 4 with rates R1, R2, R3, and R4) shows that for the jGCaMP8f, the L27A and F366H variants the rapid first phase represents the major fraction of the amplitude (Figures 7A, B, E). In contrast, for the D294A (EF-1) and D330A (EF-2) variants the major part of the amplitude derives from the slow third phase, but even that only becomes significant at [Ca2+] of 20 μM and greater, with time to peak of ∼200 ms (Figures 7C, D). Therefore, even though, the off-rates for these two variants are quite fast (153 and 303 s–1, Supplementary Figures 3C–F; Supplementary Table 2), they would only function as useful sensors at [Ca2+] concentrations that exist in organelles rather than the cytoplasm and only in time-insensitive experimental setups. The F366H variant scores best in terms of reaching maximum amplitude in the first, fastest phase (incidentally, also in phase 3 and 4 (Figure 7E). The low μM [Ca2+] range, in which the response rates and patterns are considered most relevant to function in the cellular environment, is highlighted by a red box.
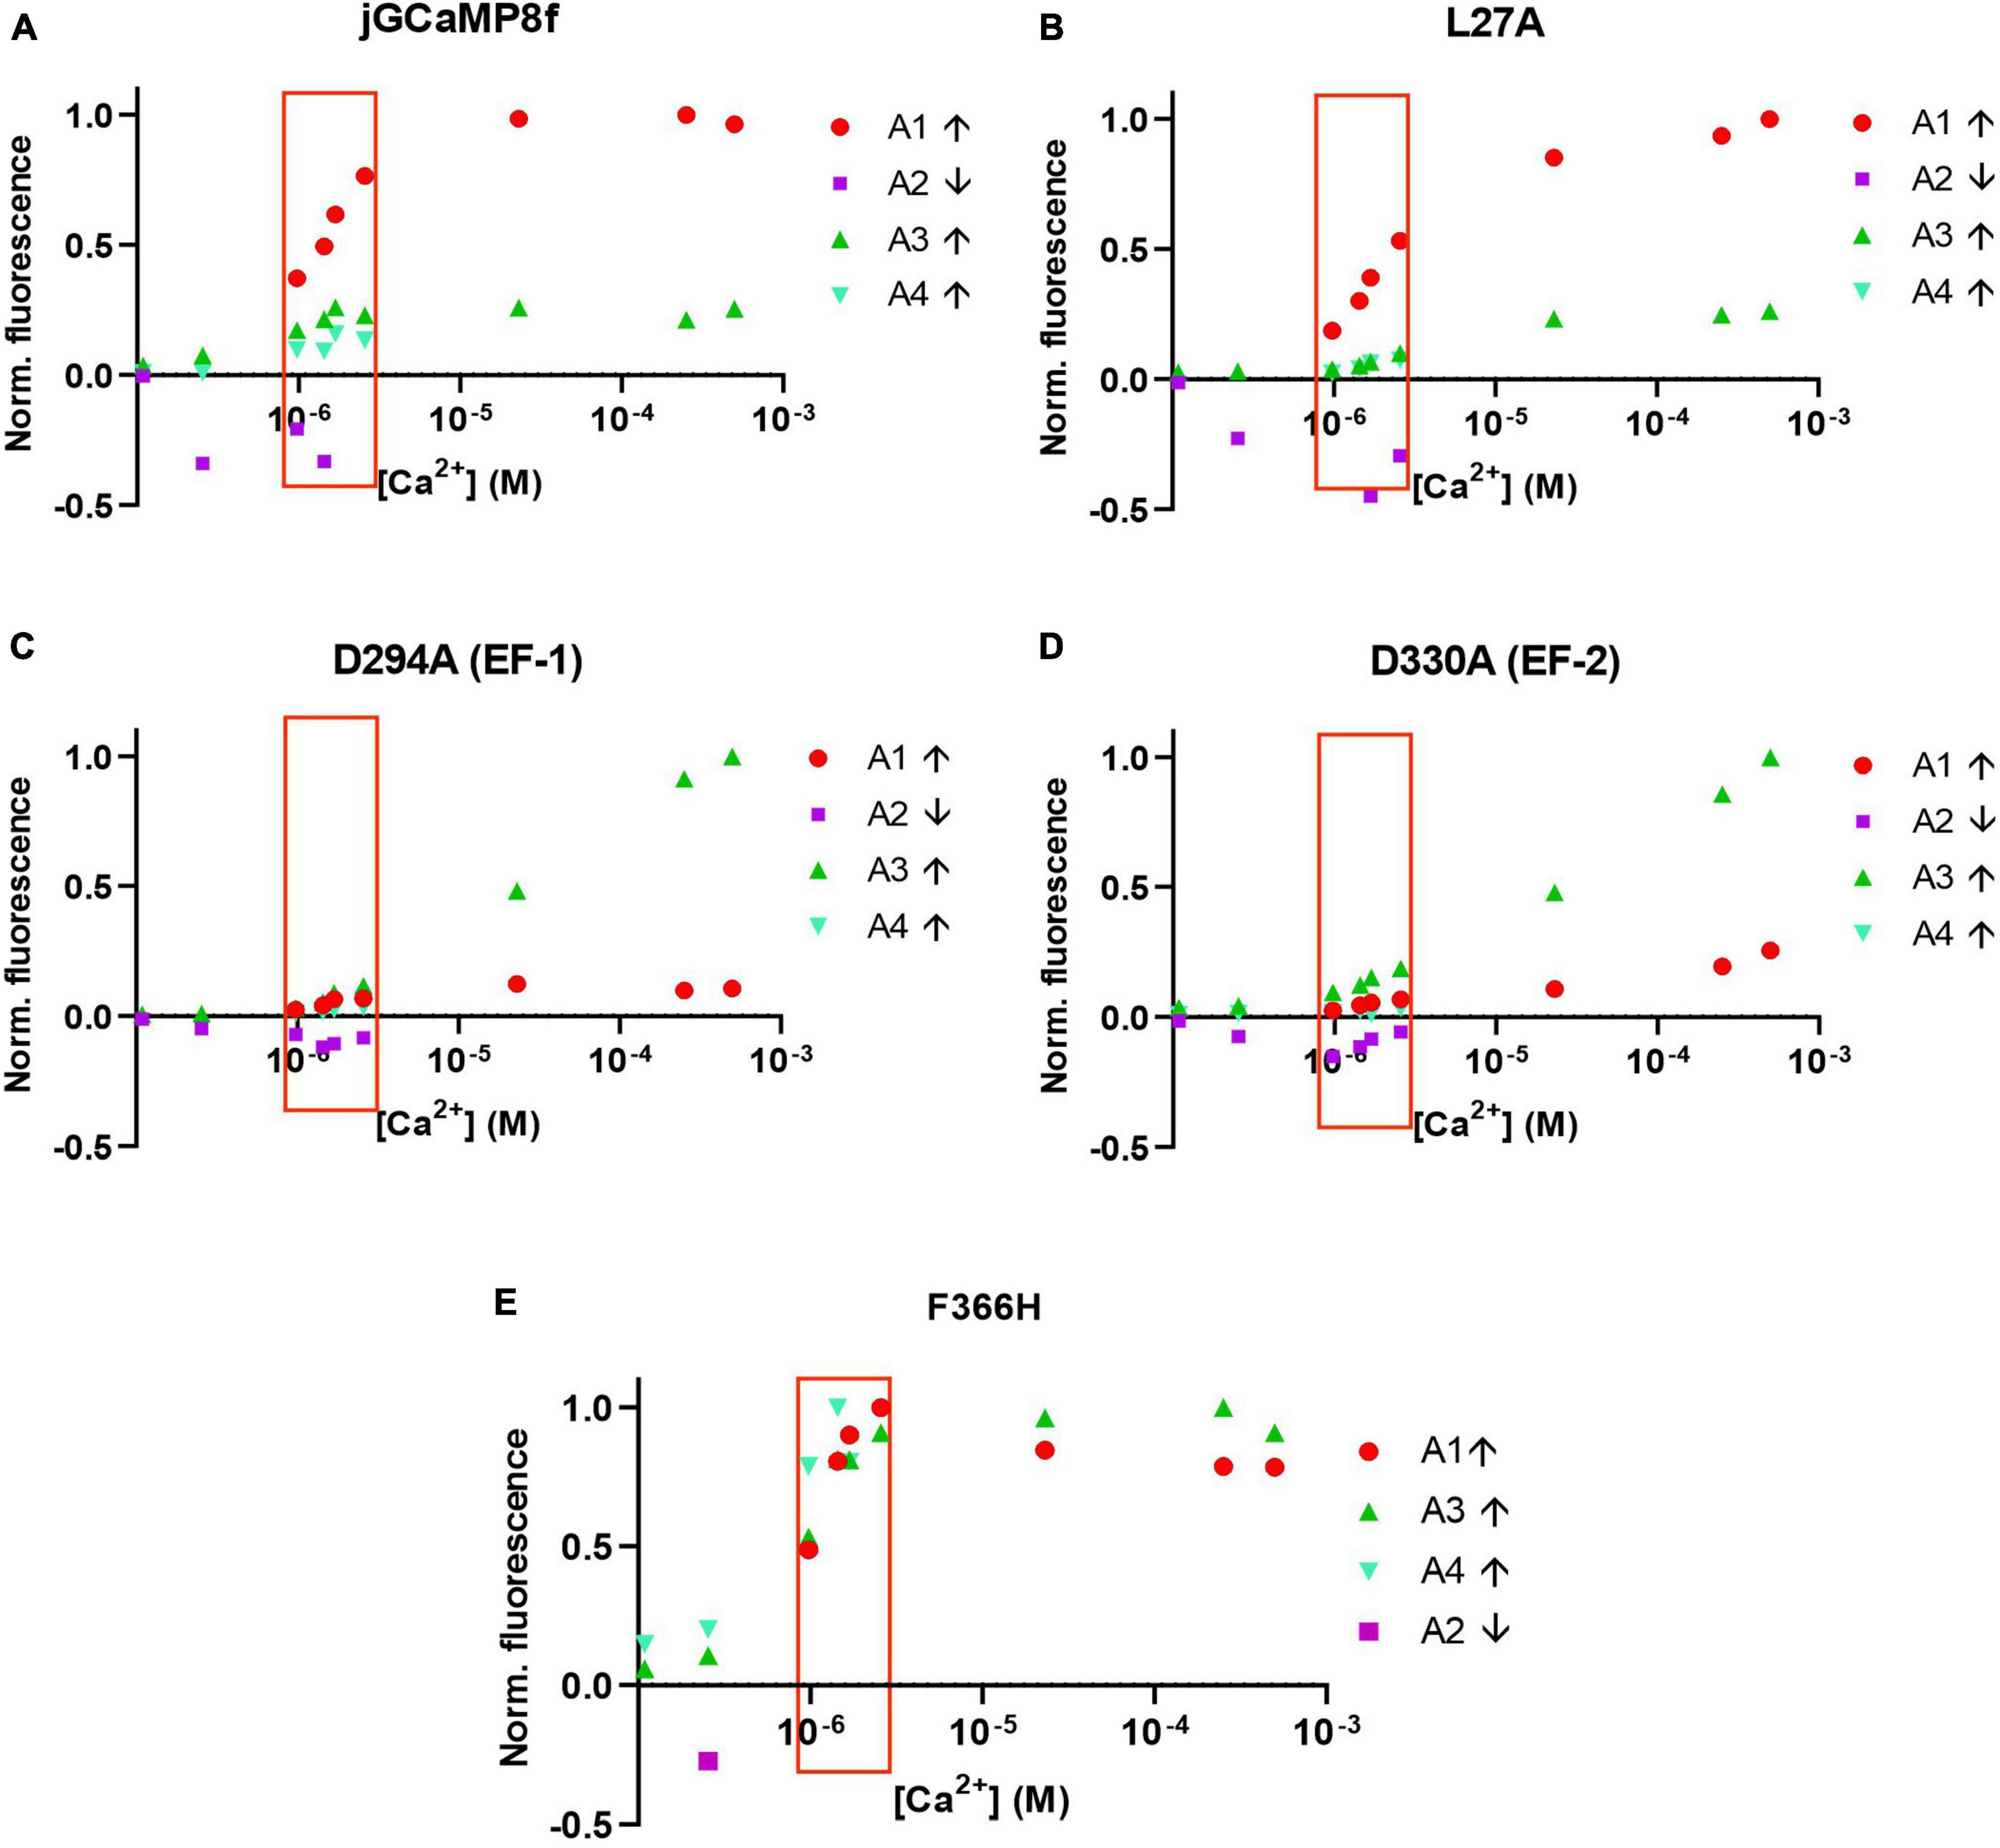
Figure 7. Normalized amplitudes of each of the four phases of the association kinetic records measured over a range of [Ca2+] of jGCaMP8f and selected variants. (A) jGCaMP8f, (B) L27A, (C) D294A (EF-1), (D) D330A (EF-2), and (E) F366H. The low μM [Ca2+] range, in which the response rates and patterns are considered most relevant to function in the cellular environment, is highlighted by a red box.
jGCaMP8f and all its variants had apparent Kd for Ca2+ in the low 1–4 μM range with Hill coefficient (n) values of 2–5 (Figures 3F, 4D, 5D; Supplementary Figure 2; Table 1; Supplementary Table 2). In our hands, the apparent Kd of jGCaMP8f for Ca2+ was 1.80 ± 0.03 μM (Figure 3F), in contrast with a Kd of 334 ± 18 nM measured in the absence of Mg2+ (Zhang et al., 2023). The Hill coefficient for Ca2+ binding was 2.1 ± 0.1–0.2 in both sets of measurements (Table 1). For the L27A variant a Kd for Ca2+ of 2.52 ± 0.02 μM with n of 4.6 ± 0.2 was measured (Figure 4D; Table 1). The F366H and F366A variants had Kd for Ca2+ of 1.06 ± 0.03 μM and 0.90 ± 0.2 μM, respectively, with n of 2.3 ± 0.1 and 2.8 ± 0.1, respectively (Figure 5D; Table 1; Supplementary Figure 2).
From in vitro experiments, compared with jGCaMP8f, L27A has faster kinetics and F366H has greater dynamic range whilst kinetics is preserved therefore these variants were tested in cells at 37°C. [Ca2+] elevation was induced in HEK293T cells by stimulation with 50 μM ATP (Supplementary Videos 1–3). Figure 8A shows a montage of images at the indicated points of the ΔF/Fo time course for each jGCaMP8f, the L27A and F366H variants at the indicated region of interest. In each case, the first Ca2+ transient is followed by one or more smaller further Ca2+ rises, indicating oscillating [Ca2+]. This can often be seen in response to ATP stimulation. jGCaMP8f detected intracellular Ca2+ elevation with a fluorescence increase, ΔF/Fo of 2.4 (ΔF/Fo measured in response to 2 μM ionomycin was 3.2). The F366H variant responded with a ΔF/Fo of 9 (ΔF/Fo measured in response to 2 μM ionomycin was 12), while for L27A the ΔF/Fo was 1 (ΔF/Fo measured in response to 2 μM ionomycin was 2.8). Time to peak values were 1.4 s, 1.8 s and 1 s for jGCaMP8f and its F366H and L27A variants, respectively. Thus, the on-kinetic responses of the three proteins were similar, however, the decay t1/2 for the L27A variant of 4.6 s was 2.3-fold smaller than for jGCaMP8f (10 s) and F366H variant (11 s). Moreover, the amplitude of fluorescence increase for jGCaMP8f F366H was 3.75-fold greater than for jGCaMP8f (Figure 8; Table 2), while preserving the fast off-kinetics of jGCaMP8f.
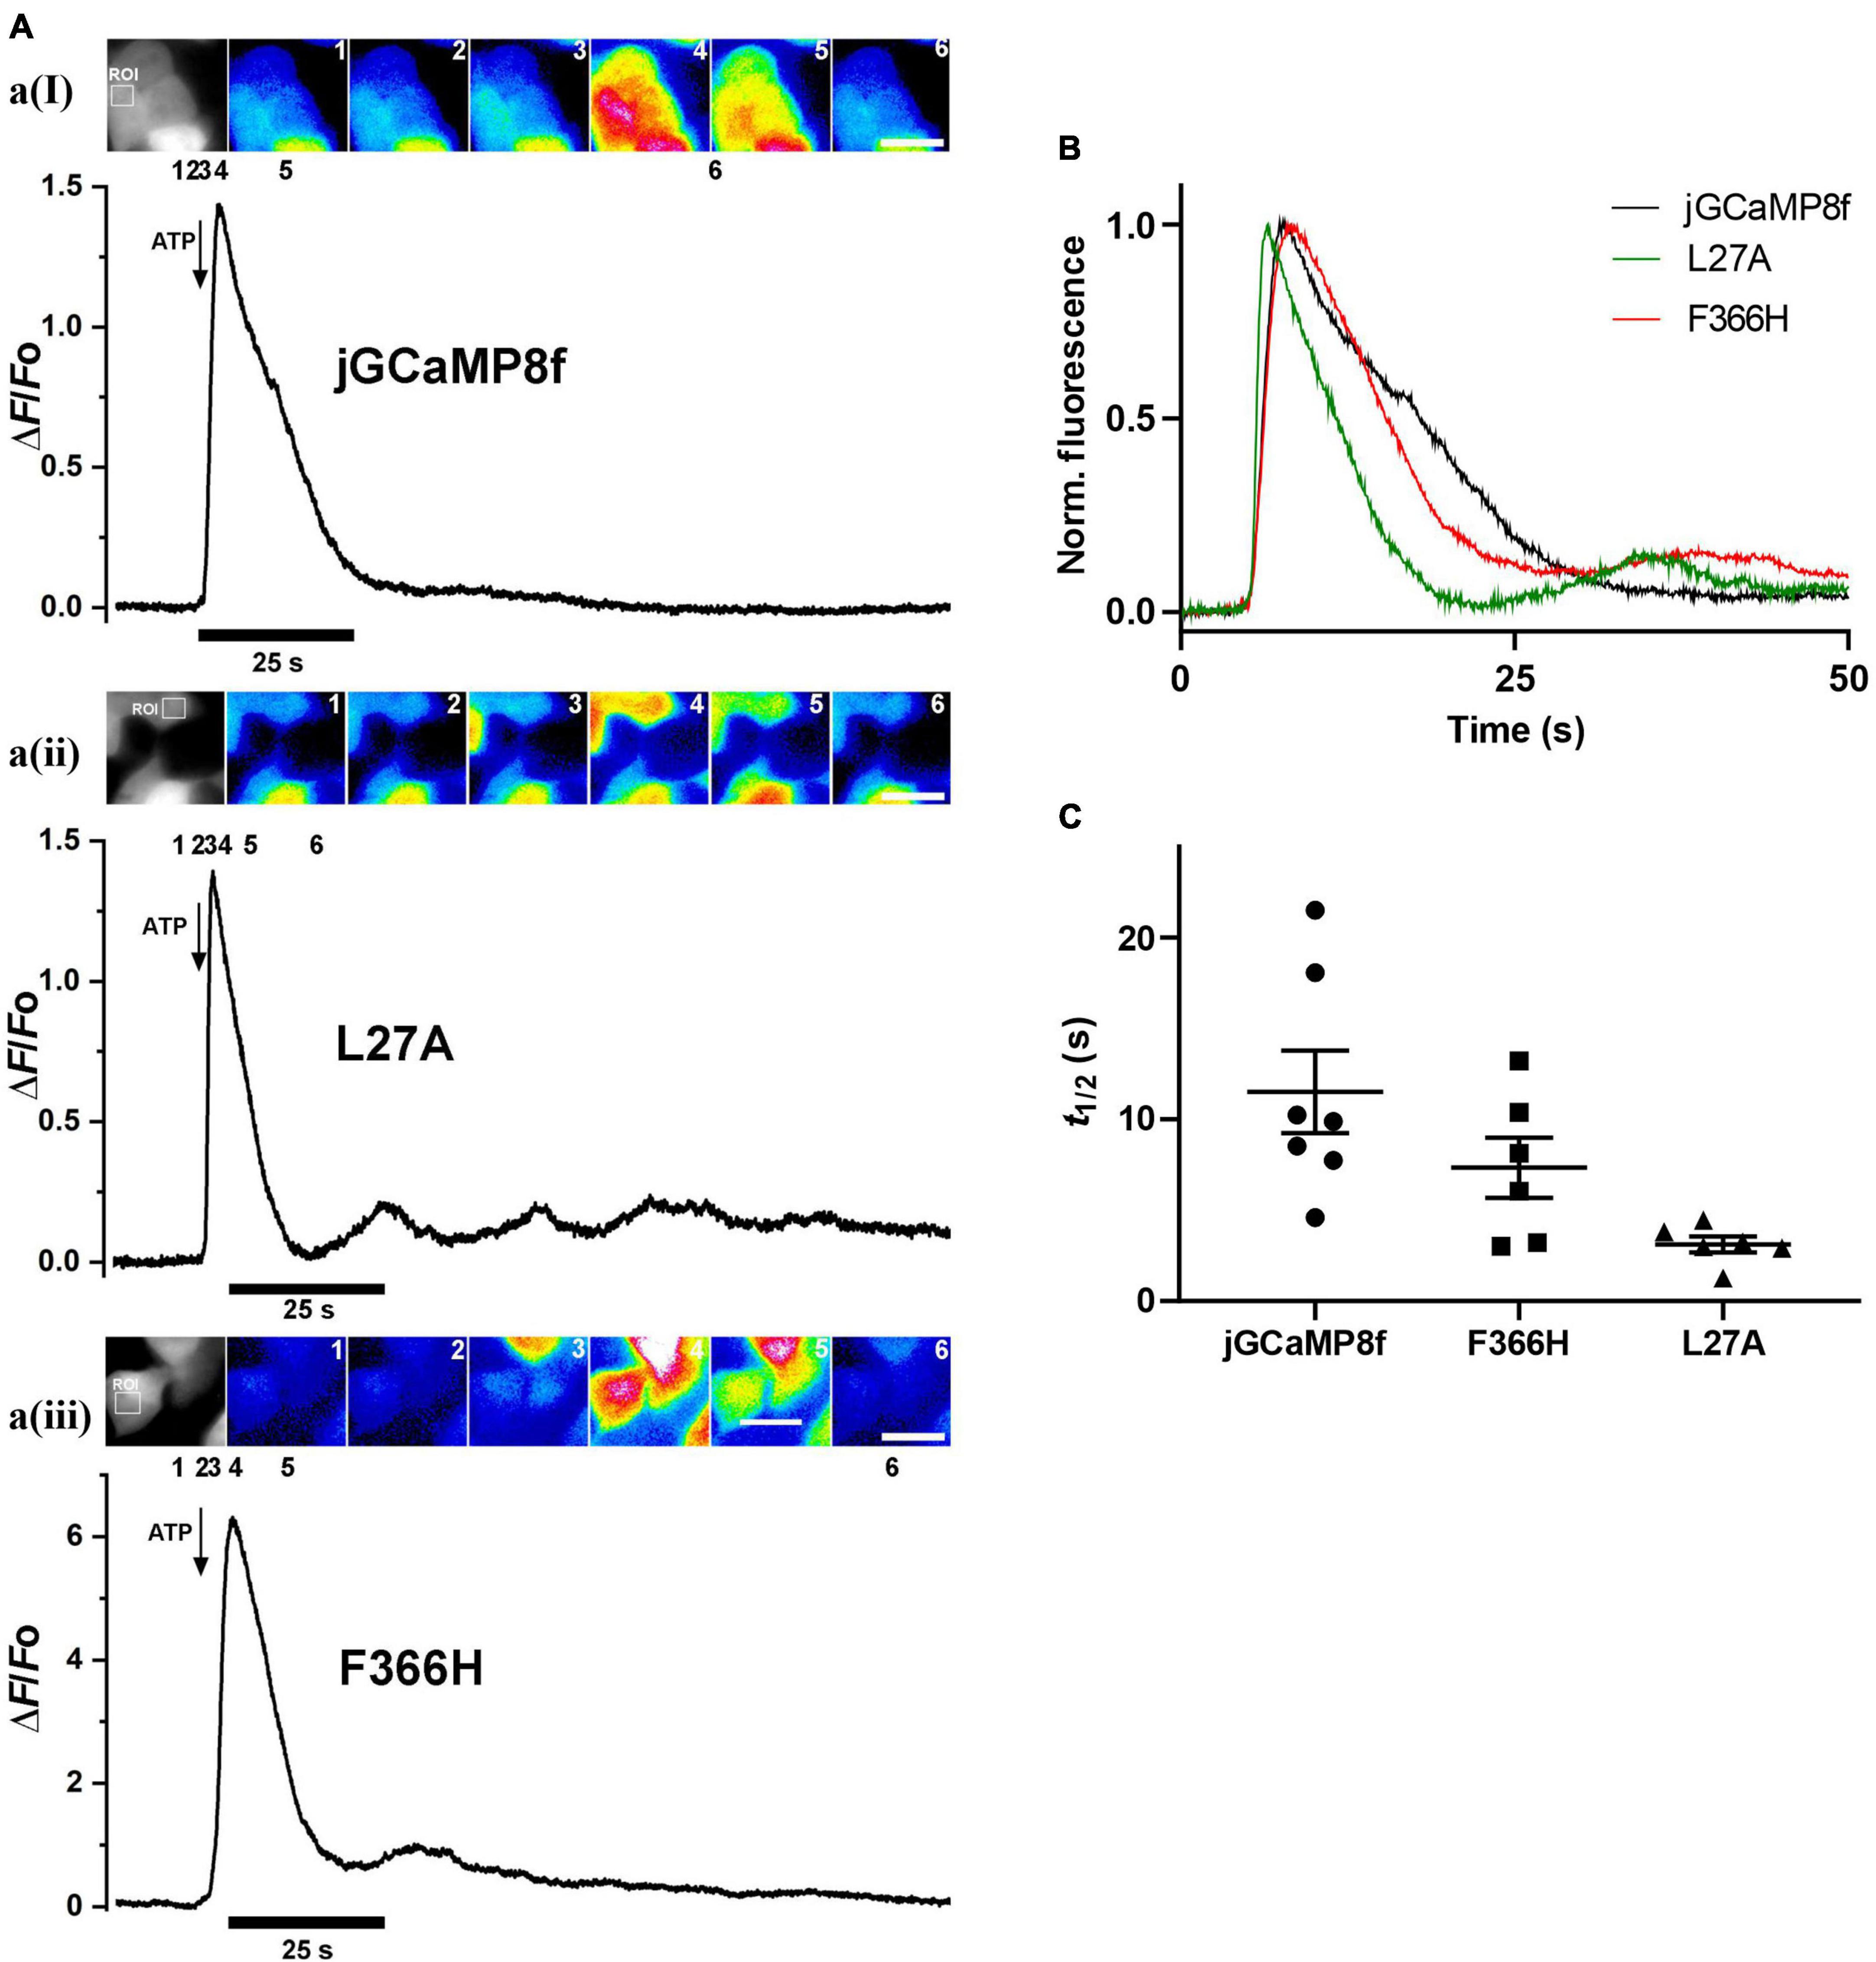
Figure 8. Fluorescence live cell imaging of jGCaMP8f and its L27A and F366H variants in HEK293T cells at 37°C. (A) Image montages and ΔF/Fo plots of (ai) jGCaMP8f, (aii) jGCaMP8f L27A, and (aiii) jGCaMP8f F366H transfected HEK293T cells with the region of interest (ROI) shown in the grayscale image. The time points where the selected frames originate from are indicated by numbers 1–6. The scale bar represents 20 μM. Addition of 50 μM ATP is indicated by the arrows. (B) Normalized records and (C) dot plot of the decay t1/2 values for jGCaMP8f and its L27A and F366H variants, displaying the individual data points and S.E.M.
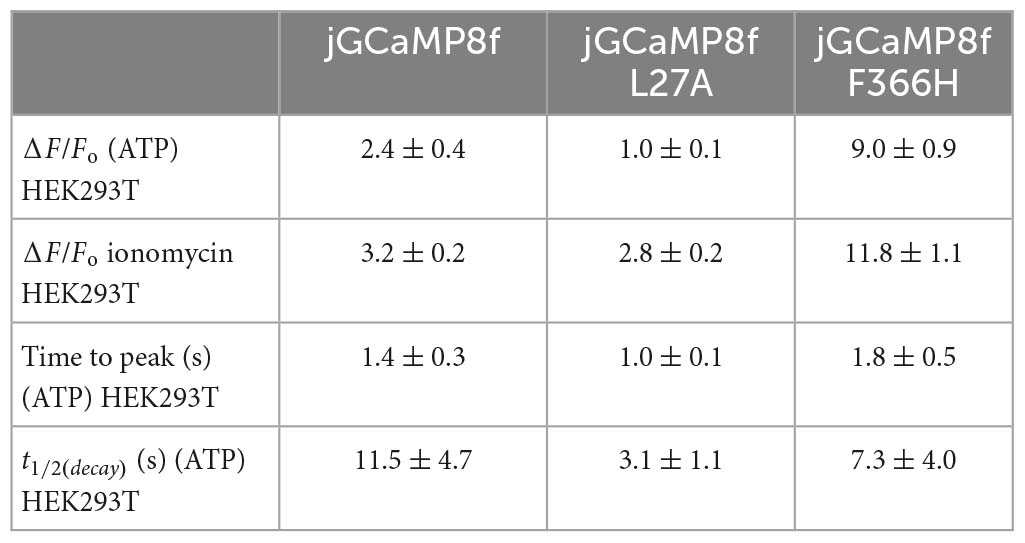
Table 2. Live cell imaging of ATP evoked intracellular Ca2+ transients monitored by GCaMP variant sensors in HEK293T cells.
jGCaMP8f has 13-fold faster decay rate than GCaMP6f (in vitro decay t1/2 22 ms at 20°C). Previously, GCaMP3fast and GCaMP6fu were developed which had in vitro decay t1/2 of 11 and 8 ms, respectively, at 20°C (Helassa et al., 2015, 2016). We were interested to see how these differences in in vitro off-rates translate to differences in cell responses at 37°C. Therefore, we compared the kinetics of the responses of jGCaMP8f and three previously developed fast decay sensors GCaMP3fast and GCaMP6fu and GCaMP6f, in addition to the two novel jGCaMP8f variants, L27A and F366H, to 2 μM ATP in HUVEC (Figures 9A, B). As seen in the record for GCaMP6fu, the first Ca2+ transient is followed by a smaller second Ca2+ rise, indicating oscillating [Ca2+]. This can often be seen in response to ATP stimulation and can distort the response kinetics. Comparison of the rise times revealed no significant difference between the sensors when compared to jGCaMP8f except for GCaMP3fast the rise time for which was significantly shorter than for the others, with a p-value of 0.1 (Figure 9C). The decay times of the responses suggest similar kinetics for the sensors, however, accurate comparison was hindered by the saturation effect most noticeable for GCaMP6f and the jGCaMP8f F366H variant (Figures 9B, D; Table 3). In terms of response dynamic ranges, jGCaMP8f sensitively detected intracellular Ca2+ elevation with a fluorescence increase, ΔF/Fo of 2.1, similar to the 2.4 measured in HEK293T cells and significantly higher than 0.23 (p > 0.0001) for GCaMP3fast and 0.44 (p = 0.003) for GCaMP6fu (Figure 9E; Table 3). There was no significant difference between jGCaMP8f and its L27A variant, however, both the jGCaMP8f F366H variant and GCaMP6f responded with 1.9- (p = 0.0009) and 3.5-fold (p < 0.0001) greater ΔF/Fo than jGCaMP8f. The full dynamic ranges (ΔF/Fo measured in response to 10 μM ionomycin) of the sensors were similar with, interestingly, GCaMP6f exceeding even that of jGCaMP8f F366H (p = 0.002) (Figure 9F; Table 3), suggesting that a lower apparent Kd for Ca2+ compared to that of GCaMP3fast and GCaMP6fu is likely to underlie the much greater amplitude of jGCaMP8f in response to 2 μM ATP.
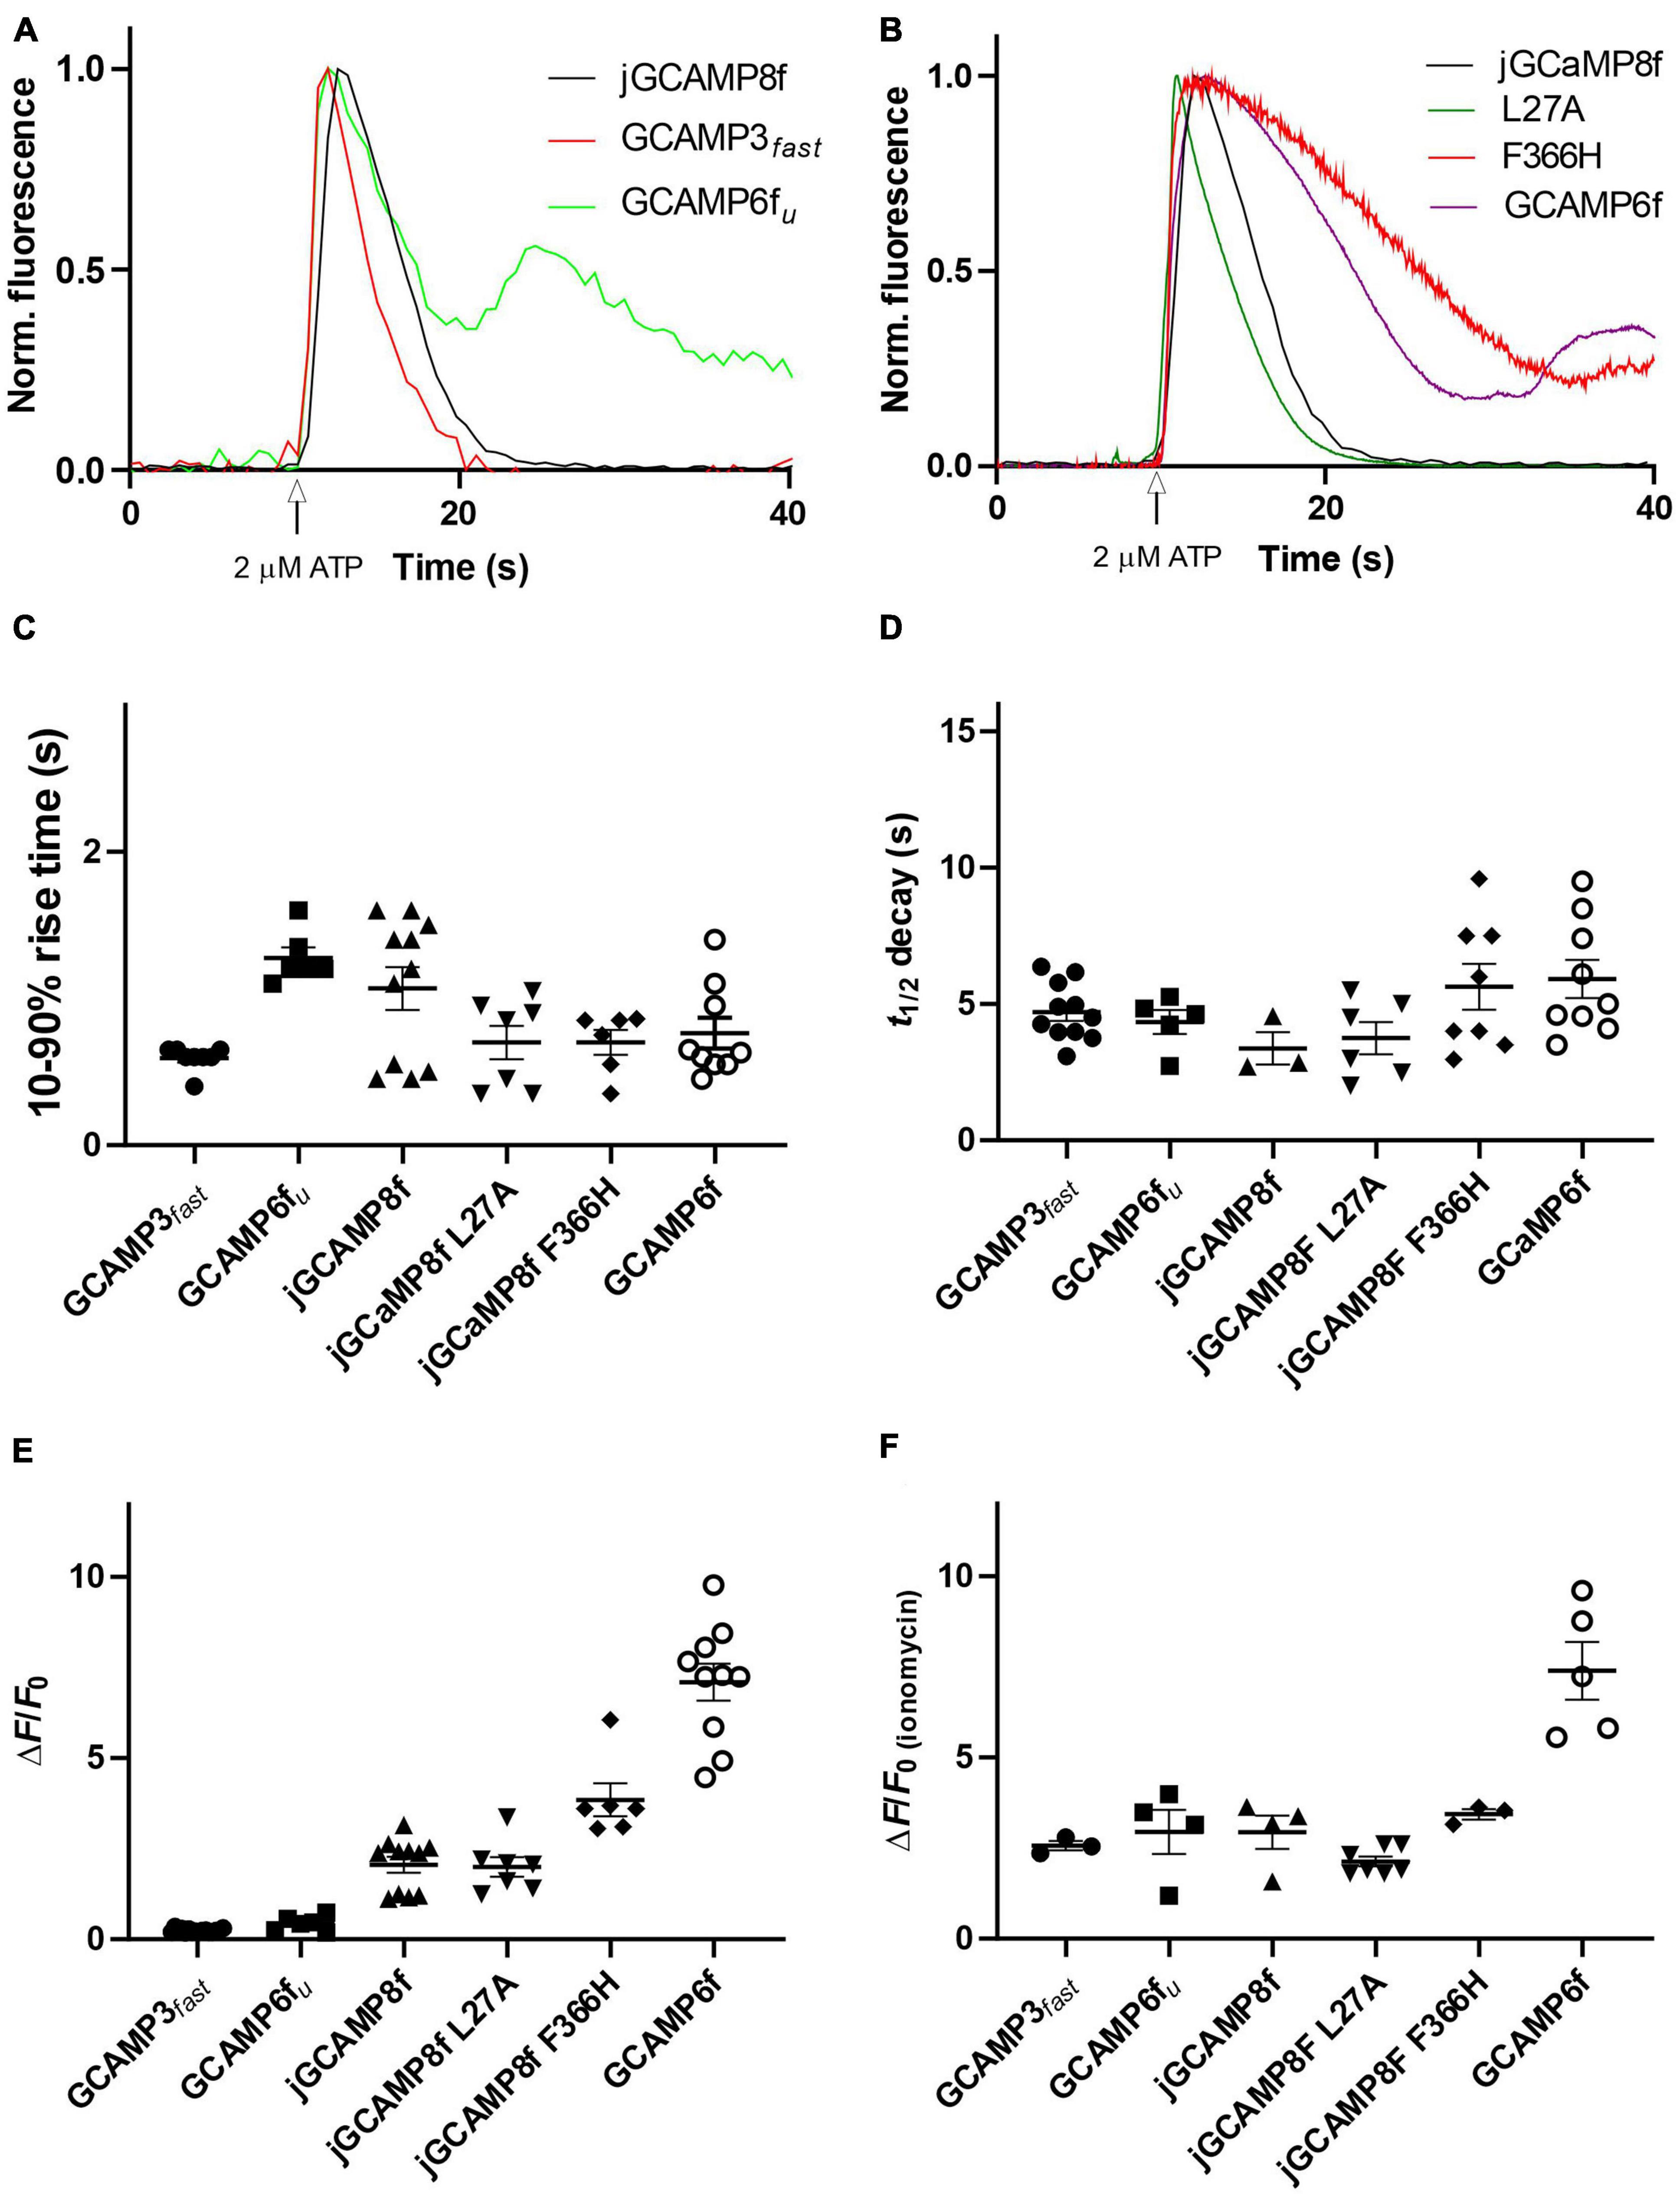
Figure 9. Fluorescence live cell imaging of jGCaMP8f, GCaMP6fu and GCaMP3fast in HUVEC at 37°C. (A) Example records. Ca2+ transients evoked by 2 μM ATP monitored by jGCaMP8f, GCaMP6fu, and GCaMP3fast. Normalized data are shown. (B) Example records. Ca2+ transients evoked by 2 μM ATP monitored by jGCaMP8f [duplicate of record shown in panel (A)], jGCaMP8f L27A, jGCaMP8f F366H, and GCaMP6f. Normalized data are shown. Dot plots of (C) 10–90% rise time (s), (D) decay t1/2 (s), (E) ΔF/Fo in response to 2 μM ATP and (F) after adding 10 μM ionomycin. Dot plots show individual data points and thus provide the n numbers (number of cells) for the experiments. Mean and S.E.M. is indicated.
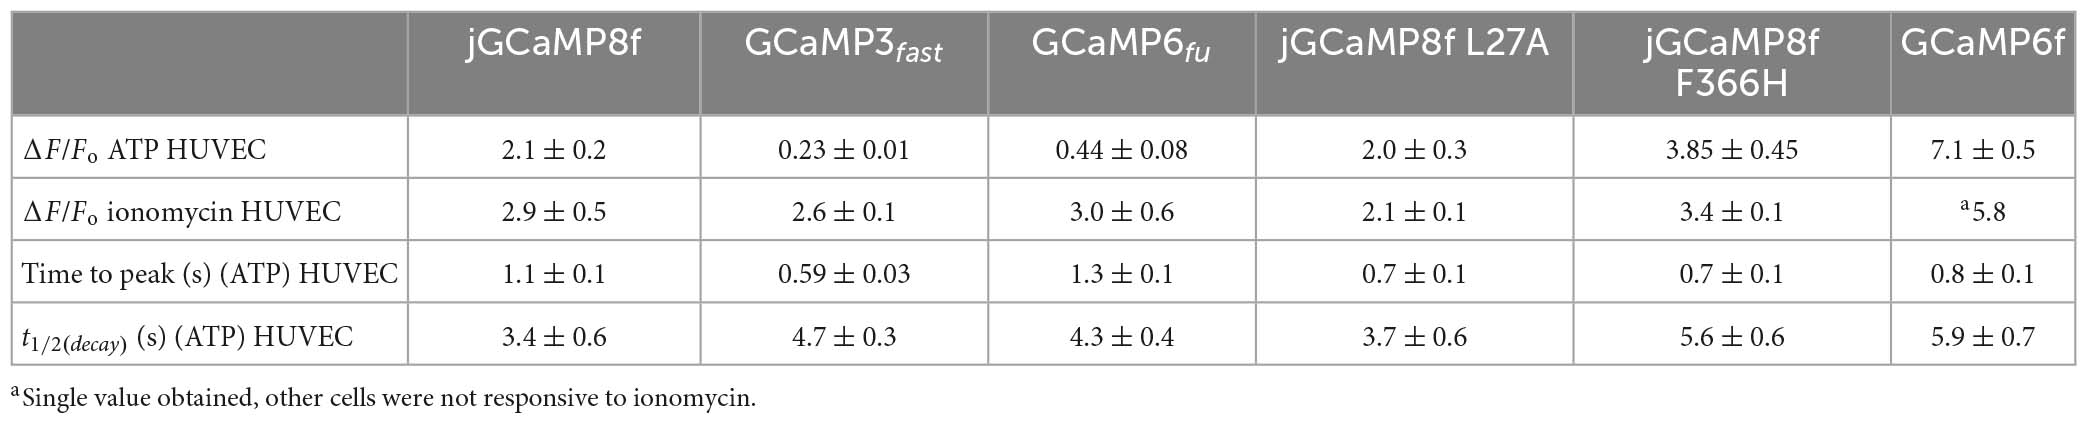
Table 3. Live cell imaging of ATP evoked intracellular Ca2+ transients monitored by GCaMP variant sensors in HUVEC.
As Ca2+ binding to CaM and hence its interaction with target peptides and proteins is affected by Mg2+ and Mg2+ is also present in the cells, our measurements are carried out in a buffer containing 2 mM MgCl2 and found striking differences in the dynamic ranges when comparing results obtained in the absence of Mg2+. jGCaMP8f is reported to have a significantly greater fluorescence dynamic range than the GCaMP6 generation, in comparable conditions, in the absence of Mg2+ at pH 7.2 (Zhang et al., 2023). Brightness measurements reveal similar brightness (Supplementary Table 1) and, in Mg2+, greater dynamic range of 14.3 for GCaMP6f (Helassa et al., 2016) than 7, measured for jGCaMP8f. The lower pH of 7.2 compared to our 7.5 used could have further contributed to the very high dynamic range value measured in the absence of Mg2+ as jGCaMP8f shows increasing dynamic range as pH is lowered (Supplementary Figure 1). The experimental conditions may explain the differences in the measured Kd values, too.
Ca2+ binding increases the quantum yield of the C-lobe Tyr fluorescence. Mg2+ has the same effect, though to a lesser degree (Kilhoffer et al., 1981). Thus, although Mg2+ binding to N-lobe EF-hands stabilizes the closed state (Senguen and Grabarek, 2012), its binding to the C-lobe resembles that of Ca2+. Therefore, in the absence of or at low, resting level [Ca2+], Mg2+ that is present in cells will bind to CaM and affect the interaction of the CaM C-lobe with the target peptide or protein. Thus, it is not surprising that in the presence of 2 mM Mg2+ the basal fluorescence of jGCaMP8f and its variants is increased, interestingly, to different extents. Most pronounced was the effect of Mg2+ on the L27A variant, increasing fluorescence intensity of the apo-state sixfold. Thus, reducing its fluorescence dynamic range to 5.5 even though the brightness of 25.9 mM–1cm–1 for the L27A variant is comparable to that of jGCaMP8f. A lesser effect by Mg2+ is seen on the apo-state for the F366H and F366A variants with a 2- and 1.6-fold increase, respectively. This property is highly relevant in the application of GCaMP-type Ca2+ sensors, as indeed for other CaM-based sensors, e.g., NCaMP7 (Subach et al., 2020). Mg2+ will furthermore affect the apparent Kd for Ca2+ and the kinetics of Ca2+ sensing and the Ca2+ on-kinetics of jGCaMP8f could be affected by the release kinetics of Mg2+ from Mg2+-bound jGCaMP8f.
The complex on-kinetics of jGCaMP8f and its variants at [Ca2+] < 2.5 μM provides an insight into the Ca2+ binding mechanism. The very fast initial on-rate (R1) of ≥500 s–1 likely represents Ca2+ binding to the CaM EF-1 and EF-2 sites of the N-lobe, the transient drop of fluorescence in the second phase (R2) then corresponds to Ca2+dissociation from the N-lobe as the [Ca2+] is not sufficient for saturating N-lobe Ca2+ binding. Slow Ca2+ binding to the C-lobe follows in phase 3 (R3) and the binding is stabilized in phase 4 (R4). At [Ca2+] > 2.5 μM, the N-lobe can hold onto Ca2+ better and the second phase is no longer detectable. Thus, fluorescence rapidly increases in a more straightforward manner. Our data with the D294A (EF-1) and D330A) (EF-2) variants, which only show the slow 3rd and 4th phases, support this explanation.
The pattern of on-rates and amplitudes is favorable for the L27A and F366H variants with fast initial on-rates (R1) of ≥500 s–1 in the physiologically relevant 1–2.5 μM intracellular [Ca2+], together with jGCaMP8f. The on-rate of jGCaMP8f and its L27A and F366H variants is 3.4 and 1.5-fold faster than that the fast decay GCaMP3fast and GCaMP6fu, respectively, at 20°C (Helassa et al., 2015, 2016).
jGCaMP8f and the F366H variant have a 13-fold faster off-rate than GCaMP6f with decay t1/2 of 22 ms. The jGCaMP8f L27A variant is a further 3∼fold faster with decay t1/2 of 8 ms at 20°C, similar to GCaMP3ffast and GCaMP6fu (Helassa et al., 2015, 2016). Notably, the off-rate increase of GCaMPffast and GCaMP6fu was achieved by the combination of mutating the CaM EF-hand 3 and a hydrophobic residue (W) involved in peptide binding to the CaM C-lobe. In contrast, in jGCaMP8f EF-3 or the EF-4 mutation that disabled Ca2+ binding did not significantly affect the properties of jGCaMP8f, while mutating EF-1 and EF-2 resulted in very fast off-rates but drastically slowed-down on-response times, implicating their important role in binding the eNOS peptide which is essential for restoring fluorescence of the cp-EGFP β barrel.
The fluorescence dynamic range of ∼5 is similar for the fast-decay jGCaMP8f L27A, GCaMPffast and GCaMP6fu variants, in each case reduced compared to the parent GCaMP. In contrast, jGCaMP8f F366H shows a 25-fold fluorescence enhancement upon Ca2+ binding, 3-fold greater than jGCaMP8f in our hands (in the presence of Mg2+), but similar off-rate to jGCaMP8f. Thus, simultaneously increasing brightness, dynamic range and off-rate of GCaMPs remains elusive.
The greater amplitude (3.75-fold in HEK293T and 1.9-fold in HUVEC) of the response to ATP stimulation by our F366H variant compared to jGCaMP8f is consistent with the 3-fold difference we measured in vitro. However, response to cell [Ca2+] transients is not always entirely consistent with what the in vitro experiments predict. There are many possible reasons for this, for example there can be affinity differences in the cells compared to what is measured in solution, pH changes can affect sensor responses.
Comparison of jGCaMP8f, its L27A and F366H variants in two different cell lines reveals differences in sensor responses. This is not surprising as cell responses are heterogenous, different cell lines respond differently to hormones, e.g., due to the purinergic receptor subtypes present and subtleties in signal transduction ATP action on individual cells often results in Ca2+ transients of different magnitude and time course. Our cell data show the expected range of response times and amplitudes, similar to other reports of GCaMP cell responses (Zhang et al., 2023). Interestingly, while our data in HEK293T cells clearly show a faster decay time for L27A and a larger dynamic range for F366H than jGCaMP8f, the differences are less clear cut in HUVEC. The decay times of the responses suggest similar kinetics for the sensors, however, accurate comparison was hindered by the saturation effect most noticeable for GCaMP6f and the jGCaMP8f F366H variant. The dynamic range for F366H is larger than either of the other two variants, however, it is diminished in HUVEC compared to HEK293T cells. In conclusion, sensor responses differ both quantitatively and qualitatively in different cell types and experimental conditions, which is partly expected. Hormone, e.g., ATP-induced intracellular transients are particularly large in endothelial cells, e.g., HUVEC, reaching 10–30 μM (Carter and Ogden, 1997) which is likely the reason for signal saturation, which is evident from the non-exponential decay kinetics of GCaMP6f and the jGCaMP8f F366H variant. Ionomycin in HUVEC only increases the dynamic range for GCaMP3fast and GCaMP6fu, both these indicators have higher Kd-s than the other featured GCaMPs.
We note that in spite of the large Ca2+ transient in HUVEC (Carter and Ogden, 1997) compared to HEK293T cells, the sensor dynamic ranges are diminished, except for GCaMP6f. This may be attributable to less transparency due to the geometry and composition of HUVEC. The apparent Kd values of cpEGFP-based sensors can also be affected by the cell composition, e.g., glutamate sensors have much higher affinity following cell expression.
In summary, we present a thorough characterization of jGCaMP8f and two newly developed variants, the faster decay L27A and F366H with an increased dynamic range, through which we highlight the complexities of the kinetics of this sensor generation. We demonstrate how Mg2+, present at mM concentrations in all cells, increases the apo-state fluorescence and is thus an important factor in defining the achievable changes in fluorescence dynamic range of GCaMP-type Ca2+ sensors in physiological conditions. We demonstrate the superior performance of two novel variants of jGCaMP8f, one with faster kinetics and one with increased fluorescence dynamic range (in the presence of Mg2+), both in vitro and in cellular environments. The off-kinetics of L27A is as fast as that of GCaMP3fast and GCaMP6fu, however, the jGCaMP8f L27A variant may be more advantageous in imaging applications as it has a greater fluorescence dynamic range in the cellular environment than the earlier fast variants. The jGCaMP8f F366H variant gives a 2–3.75-fold greater fluorescence increase in cells than jGCaMP8f whilst preserving its fast kinetics unless saturation distorts its response kinetics.
Genetically encoded Ca2+ indicators are highly applicable for studying cell signaling involving transient rises of intracellular [Ca2+] to understand physiological or disease conditions. An important consideration for the application for GECIs for imaging neural activity is the kinetics of the intracellular [Ca2+] transient generated by AP-evoked Ca2+ influx and terminated by Ca2+ pumps, which is slower than the ion channel activities driving APs. In cells, the millisecond response times of GECIs translate into transients over seconds. Nevertheless, increasing the off-rate of GCaMPs is important for faithful reporting of intracellular Ca2+ transients and for increasing the resolution of oscillating Ca2+ transients. However, there are still limitations to the sensitivity and fidelity of detection. It is important to understand how closely the fluorescence changes map the neural activity under investigation. We note that many in vivo or in cell studies cannot give detailed kinetic data of Ca2+ signals. This may be explained by the low expression level and/or low brightness of GECIs in vivo, their action as a Ca2+ buffer, slow kinetics, the complexity arising from the non-linearity of the data (for a review, see Rose et al., 2014). jGCaMP8f of the latest GECI generation has showed pronounced results in repetitive stimulation and monitoring Ca2+ transients in larval Drosophila and mouse visual cortex models (Zhang et al., 2023). Our jGCaMP8f variants L27A and F366H offer further advantages in kinetics and dynamic range in the cellular environment (in the presence of Mg2+), respectively, therefore have potential applications to study physiological or disease conditions. For example, simultaneous recording of APs and GCaMP6s or GCaMP6f fluorescence in vivo in the primary visual cortex of transgenic mice revealed that in typical population imaging conditions only ∼10% of single AP events were detected (Huang et al., 2021). jGCaMP8f F366H with a large dynamic range has the potential to improve this outcome by increasing the signal-to-noise ratio. Conversely, a study in Huntington’s disease mouse models using GCaMP3 revealed the increase of evoked Ca2+ signals, but a significant reduction in the frequency, duration, and amplitude of spontaneous Ca2+ signals (Jiang et al., 2016). jGCaMP8f L27A with faster kinetics and larger cellular responses than previous fast GCaMP variants might help understand the underlying mechanisms of dysfunctional Ca2+ signaling.
Genetically encoded Ca2+ indicators are important and powerful tools in the investigation of neuro- and other pathologies. The latest jGCaMP8f generation and novel improved variants presented here will further increase the application potential of GECIs in health and disease.
The original contributions presented in this study are included in the article/Supplementary material, further inquiries can be directed to the corresponding author.
OT generated the D294A (EF-1), D330A (EF-2), A18S as well as designed, generated the F366A and F366H variants by SDM, and carried out all in vitro experiments including expression, purification, and measurements. HH and TC carried out the live cell imaging. KT designed the project. KT and OT wrote the manuscript. All authors contributed to the article and approved the submitted version.
This work was funded by BBSRC grant BB/M02556X/1 to KT.
Dr. A. Mohammed is acknowledged for subcloning jGCaMP8f into the pET30b vector and carried out site directed mutagenesis (SDM) to generate the D367A (EF-3), D403A (EF-4), and L27A variant plasmids.
The authors declare that the research was conducted in the absence of any commercial or financial relationships that could be construed as a potential conflict of interest.
All claims expressed in this article are solely those of the authors and do not necessarily represent those of their affiliated organizations, or those of the publisher, the editors and the reviewers. Any product that may be evaluated in this article, or claim that may be made by its manufacturer, is not guaranteed or endorsed by the publisher.
The Supplementary Material for this article can be found online at: https://www.frontiersin.org/articles/10.3389/fncel.2023.1155406/full#supplementary-material
Akerboom, J., Chen, T. W., Wardill, T. J., Tian, L., Marvin, J. S., Mutlu, S., et al. (2012). Optimization of a GCaMP calcium indicator for neural activity imaging. J. Neurosci. 32, 13819–13840. doi: 10.1523/JNEUROSCI.2601-12.2012
Baird, G. S., Zacharias, D. A., and Tsien, R. Y. (1999). Circular permutation and receptor insertion within green fluorescent proteins. Proc. Natl. Acad. Sci. U.S.A. 96, 11241–11246. doi: 10.1073/pnas.96.20.11241
Carter, T. D., and Ogden, D. (1997). Kinetics of Ca2 + release by InsP(3) in pig single aortic endothelial cells: evidence for an inhibitory role of cytosolic Ca2 + in regulating hormonally evoked Ca2 + spikes. J. Physiol. Lond. 504, 17–33. doi: 10.1111/j.1469-7793.1997.00017.x
Chen, T. W., Wardill, T. J., Sun, Y., Pulver, S. R., Renninger, S. L., Baohan, A., et al. (2013). Ultrasensitive fluorescent proteins for imaging neuronal activity. Nature 499, 295–300. doi: 10.1038/nature12354
Dana, H., Sun, Y., Mohar, B., Hulse, B. K., Kerlin, A. M., Hasseman, J. P., et al. (2019). High-performance calcium sensors for imaging activity in neuronal populations and microcompartments. Nat. Methods 16, 649–657. doi: 10.1038/s41592-019-0435-6
Helassa, N., Podor, B., Fine, A., and Torok, K. (2016). Design and mechanistic insight into ultrafast calcium indicators for monitoring intracellular calcium dynamics. Sci. Rep. 6:38276. doi: 10.1038/srep38276
Helassa, N., Zhang, X. H., Conte, I., Scaringi, J., Esposito, E., Bradley, J., et al. (2015). Fast-response calmodulin-based fluorescent indicators reveal rapid intracellular calcium dynamics. Sci. Rep. Uk 5:15978. doi: 10.1038/srep15978
Huang, L., Ledochowitsch, P., Knoblich, U., Lecoq, J., Murphy, G. J., Reid, R. C., et al. (2021). Relationship between simultaneously recorded spiking activity and fluorescence signal in GCaMP6 transgenic mice. Elife 10:51675. doi: 10.7554/eLife.51675
Jama, A. M., Gabriel, J., Al-Nagar, A. J., Martin, S., Baig, S. Z., Soleymani, H., et al. (2011). Lobe-specific functions of Ca2 +⋅calmodulin in alpha Ca2 +⋅calmodulin-dependent protein kinase II activation. J. Biol. Chem. 286, 12308–12316. doi: 10.1074/jbc.M110.157057
Jiang, R. T., Diaz-Castro, B., Looger, L. L., and Khakh, B. S. (2016). Dysfunctional calcium and glutamate signaling in striatal astrocytes from Huntington’s disease model mice. J. Neurosci. 36, 3453–3470. doi: 10.1523/JNEUROSCI.3693-15.2016
Kerruth, S., Coates, C., Durst, C. D., Oertner, T. G., and Torok, K. (2019). The kinetic mechanisms of fast-decay red-fluorescent genetically encoded calcium indicators. J. Biol. Chem. 294, 3934–3946. doi: 10.1074/jbc.RA118.004543
Kilhoffer, M. C., Demaille, J. G., and Gerard, D. (1981). Tyrosine fluorescence of ram testis and octopus calmodulins - effects of calcium, magnesium, and ionic-strength. Biochemistry 20, 4407–4414. doi: 10.1021/bi00518a027
Nakai, J., Ohkura, M., and Imoto, K. (2001). A high signal-to-noise Ca2 + probe composed of a single green fluorescent protein. Nat. Biotechnol. 19, 137–141. doi: 10.1038/84397
Rose, T., Goltstein, P. M., Portugues, R., and Griesbeck, O. (2014). Putting a finishing touch on GECIs. Front. Mol. Neurosci. 7:88. doi: 10.3389/fnmol.2014.00088
Schoenmakers, T. J., Visser, G. J., Flik, G., and Theuvenet, A. P. (1992). CHELATOR: an improved method for computing metal ion concentrations in physiological solutions. Biotechniques 12, 870–879.
Senguen, F. T., and Grabarek, Z. (2012). X-ray structures of magnesium and manganese complexes with the N-terminal domain of calmodulin: insights into the mechanism and specificity of metal ion binding to an EF-Hand. Biochemistry 51, 6182–6194. doi: 10.1021/bi300698h
Shen, Y., Nasu, Y., Shkolnikov, I., Kim, A., and Campbell, R. E. (2020). Engineering genetically encoded fluorescent indicators for imaging of neuronal activity: progress and prospects. Neurosci. Res. 152, 3–14. doi: 10.1016/j.neures.2020.01.011
Subach, O. M., Sotskov, V. P., Plusnin, V. V., Gruzdeva, A. M., Barykina, N. V., Ivashkina, O. I., et al. (2020). Novel genetically encoded bright positive calcium indicator NCaMP7 based on the mNeonGreen fluorescent protein. Int. J. Mol. Sci. 21:1644. doi: 10.3390/ijms21051644
Steinmetz, N. A., Buetfering, C., Lecoq, J., Lee, C. R., Peters, A. J., Jacobs, E. A. K., et al. (2017). Aberrant cortical activity in multiple GCaMP6-expressing transgenic mouse lines. Eneuro 4, 1–15. doi: 10.1523/ENEURO.0207-17.2017
Tallini, Y. N., Ohkura, M., Choi, B. R., Ji, G. J., Imoto, K., Doran, R., et al. (2006). Imaging cellular signals in the heart in vivo: cardiac expression of the high-signal Ca2 + indicator GCaMP2. Proc. Natl. Acad. Sci. U.S.A. 103, 4753–4758. doi: 10.1073/pnas.0509378103
Tian, L., Hires, S. A., Mao, T., Huber, D., Chiappe, M. E., Chalasani, S. H., et al. (2009). Imaging neural activity in worms, flies and mice with improved GCaMP calcium indicators. Nat. Methods 6, 875–881. doi: 10.1038/nmeth.1398
Keywords: biosensor, calcium, calmodulin, eNOS, fluorescence, imaging, cpEGFP
Citation: Tran O, Hughes HJ, Carter T and Török K (2023) Development and characterization of novel jGCaMP8f calcium sensor variants with improved kinetics and fluorescence response range. Front. Cell. Neurosci. 17:1155406. doi: 10.3389/fncel.2023.1155406
Received: 31 January 2023; Accepted: 28 April 2023;
Published: 18 May 2023.
Edited by:
Peng Zhang, Shanghai Jiao Tong University, ChinaReviewed by:
Yajun Zhang, University of Virginia, United StatesCopyright © 2023 Tran, Hughes, Carter and Török. This is an open-access article distributed under the terms of the Creative Commons Attribution License (CC BY). The use, distribution or reproduction in other forums is permitted, provided the original author(s) and the copyright owner(s) are credited and that the original publication in this journal is cited, in accordance with accepted academic practice. No use, distribution or reproduction is permitted which does not comply with these terms.
*Correspondence: Katalin Török, ay50b3Jva0BzZ3VsLmFjLnVr
Disclaimer: All claims expressed in this article are solely those of the authors and do not necessarily represent those of their affiliated organizations, or those of the publisher, the editors and the reviewers. Any product that may be evaluated in this article or claim that may be made by its manufacturer is not guaranteed or endorsed by the publisher.
Research integrity at Frontiers
Learn more about the work of our research integrity team to safeguard the quality of each article we publish.