
95% of researchers rate our articles as excellent or good
Learn more about the work of our research integrity team to safeguard the quality of each article we publish.
Find out more
ORIGINAL RESEARCH article
Front. Cell. Neurosci. , 22 April 2022
Sec. Cellular Neuropathology
Volume 16 - 2022 | https://doi.org/10.3389/fncel.2022.861733
This article is part of the Research Topic Environmental Effect on Neuroinflammation and Neurodegeneration View all 9 articles
 Kelley T. Patten1
 Anthony E. Valenzuela1
 Christopher Wallis2
 Danielle J. Harvey3
 Keith J. Bein2,4
 Anthony S. Wexler2,5,6
 Fredric A. Gorin1,7
 Pamela J. Lein1*
Epidemiological studies have demonstrated that air pollution is a significant risk factor for age-related dementia, including Alzheimer’s disease (AD). It has been posited that traffic-related air pollution (TRAP) promotes AD neuropathology by exacerbating neuroinflammation. To test this hypothesis, serum and hippocampal cytokines were quantified in male and female TgF344-AD rats and wildtype (WT) Fischer 344 littermates exposed to TRAP or filtered air (FA) from 1 to 15 months of age. Luminex™ rat 23-cytokine panel assays were used to measure the levels of hippocampal and serum cytokines in 3-, 6-, 10-, and 15-month-old rats (corresponding to 2, 5, 9, and 14 months of exposure, respectively). Age had a pronounced effect on both serum and hippocampal cytokines; however, age-related changes in hippocampus were not mirrored in the serum and vice versa. Age-related changes in serum cytokine levels were not influenced by sex, genotype, or TRAP exposure. However, in the hippocampus, in 3-month-old TgF344-AD and WT animals, TRAP increased IL-1ß in females while increasing TNF ɑin males. In 6-month-old animals, TRAP increased hippocampal levels of M-CSF in TgF344-AD and WT females but had no significant effect in males. At 10 and 15 months of age, there were minimal effects of TRAP, genotype or sex on hippocampal cytokines. These observations demonstrate that TRAP triggers an early inflammatory response in the hippocampus that differs with sex and age and is not reflected in the serum cytokine profile. The relationship of TRAP effects on cytokines to disease progression remains to be determined.
Alzheimer’s disease (AD) is the most prevalent cause of age-related dementia. At present, there are limited therapeutic options for preventing or even slowing the progression of this disease, thus, considerable efforts are being made to understand modifiable risk factors, such as environmental exposures (Eid et al., 2019; Mir et al., 2020). One environmental factor strongly associated with increased risk of AD is chronic exposure to traffic-related air pollution (TRAP) (Peters et al., 2019; Fu and Yung, 2020). Recent studies suggest that TRAP interacts with non-modifiable risk factors for AD, such as genetic susceptibilities and age, to influence individual AD risk. For example, women > 65 years with the APOE-e4 risk allele for AD who were exposed to high levels of particulate matter 2.5 (PM2.5) showed increased risk of cognitive decline and dementia compared to APOE-ε4 women exposed to low PM2.5 levels (Cacciottolo et al., 2017). However, how environmental risk factors, aging, and genetic susceptibilities interact to influence AD risk remains largely unknown.
Neuroinflammation is associated with TRAP exposure, aging, and AD pathogenesis (Calderon-Garciduenas et al., 2016; Guzman-Martinez et al., 2019). Several studies have shown increased levels of pro-inflammatory cytokines such as IL-6 and TNFɑin the serum and cerebrospinal fluid (CSF) of aged individuals compared to young controls (Michaud et al., 2013a). Likewise, a growing list of AD genetic risk factors have been linked to neuroinflammation (Kloske and Wilcock, 2020). For example, APOE-e4 may play a role in nitric oxide regulation in the brain (Vitek et al., 2009), while mutations or single-nucleotide polymorphisms in innate immune genes such as TREM2 (triggering receptor expressed on myeloid cells 2) (Liddelow et al., 2017), CR1 (complement receptor 1) (Efthymiou and Goate, 2017), and CD33 (Karch and Goate, 2015) have been associated with altered microglial function in the context of AD. Many of these innate immune genes are also expressed in peripheral immune cells, such as leukocytes, monocytes, and macrophages (Forabosco et al., 2013; Guerreiro et al., 2013; Jonsson et al., 2013), and may contribute to altered peripheral inflammation in AD (Cao and Zheng, 2018). Finally, cytokines such as TNFɑ, IL-1β, and IL-6 are increased in the brains and serum of experimental animals and humans exposed to air pollution (Mumaw et al., 2016; Jayaraj et al., 2017).
Immune activity in the CNS is controlled in part by cytokines and chemokines, and their differential expression in the brains of AD patients is an active area of research. Cytokines and chemokines are paracrine and autocrine signaling molecules that are crucial in sensing and responding to damage in the brain. Increased levels of these cytokines are often observed in neurodegenerative processes. For example, injured neurons in the brain release cytokines such as IL-1b and tumor-necrosis factor alpha (TNFɑ) (Griffin and Barger, 2010; Stamouli and Politis, 2016), which can lead to neuronal apoptosis or the activation of local glial cells. The release of chemokines such as C-C motif ligand 2 (CCL2; also known as monocyte chemoattractant protein 1 or MCP-1) from glia can recruit monocytes or microglia to sites of damage in the brain (Platten et al., 2003; Kim et al., 2014). In AD, Ab peptides and plaques are known to activate surrounding microglia, leading to increased levels of proinflammatory cytokines such as TNFɑand IL-6 in the area adjacent to the plaque (Rubio-Perez and Morillas-Ruiz, 2012; Wang et al., 2015). Conversely, anti-inflammatory cytokines such as IL-4 and IL-10 can dampen microglial activation and thereby reduce the damaging effects of pro-inflammatory cytokines (Gadani et al., 2012), or they may decrease the ability of microglia to phagocytose Ab (Guillot-Sestier et al., 2015). These examples illustrate the complex effects of cytokines in AD, which have been previously reviewed (Cacquevel et al., 2004; Angelopoulos et al., 2008; Reale et al., 2008; Lee et al., 2009; Rubio-Perez and Morillas-Ruiz, 2012; Nagae et al., 2016; Su et al., 2016).
Cytokines and chemokines in the serum are of interest as biomarkers of disease progression in AD patients. Although cytokine levels in CSF are often highly correlated with levels in brain tissue (Mitrasinovic et al., 2003; Choi et al., 2008; Olson and Humpel, 2010), obtaining CSF requires a lumbar puncture and therefore is not routinely evaluated in AD patients. Consequently, there is great interest in identifying prognostic AD biomarkers in blood. Given the strong role of inflammation in AD, numerous studies have measured cytokines in the serum of patients with mild cognitive impairment or AD. However, the results of these studies have been inconsistent. For example, TNFɑserum levels, which are known to be elevated in conditions such as depression, have been evaluated in several AD studies with contradictory results (Zheng et al., 2016). Several studies have shown that serum TNFɑlevels were elevated in AD patients with advanced disease, compared to those with mild disease (Morimoto et al., 2011). Additional studies have found no difference in TNFɑconcentrations between AD patients and controls (Guerreiro et al., 2007; Khemka et al., 2014; Lai et al., 2017). Similar contradictory findings have been reported for IL-6 and transforming-growth factor beta (TGF-b) (Angelopoulos et al., 2008; Khemka et al., 2014; Lai et al., 2017).
An objective of this study was to identify potential biomarkers that would reflect interactions between TRAP and ongoing neurodegeneration in a rat model of AD. We analyzed samples taken from a larger study (Patten et al., 2021) characterizing the effects of chronic traffic-related air pollution (TRAP) exposure on expression of AD phenotypes in wildtype (WT) vs. transgenic rats that expressed human AD risk genes (TgF344-AD rats). In the larger study, we demonstrated that exposure to TRAP accelerated amyloid plaque deposition, increased hyperphosphorylated tau levels, promoted neuronal cell loss, and caused cognitive deficits in an age, genotype and sex-dependent manner (Patten et al., 2021). We also observed that TRAP increased microglial cell activation, but not astrogliosis in both male and female WT and TgF344-AD rats (Patten et al., 2021). We measured the profiles of cytokines, chemokines, and growth factors in serum and hippocampal tissue as affected by age, TRAP exposure, and AD genetic susceptibility, and whether there were any interactions between these risk factors.
All procedures involving animals were conducted in accordance with the NIH Guide for the Care and Use of Laboratory Animals and were approved by the University of California Davis Animal Care and Use Committee. Protocols conformed to the ARRIVE guidelines (Kilkenny et al., 2010). Animal facilities were maintained under controlled environmental conditions (20–26°C, 12:12 light dark cycle) with food and tap water provided ad libitum. Rats were fed a Global 18% Protein Rodent Diet (Tekland) throughout the study.
The animals used to generate the data reported here were part of a larger study designed to evaluate the effects of TRAP on cardiovascular and AD phenotypes and have been described previously (Edwards et al., 2020; Patten et al., 2021). Briefly, male TgF344-AD rats (Cohen et al., 2013) that express the human AD risk genes APPswe (Swedish mutation) and presenilin-1 Δ exon 9 (PS1ΔE9 mutation) were obtained from Emory University and housed in vivaria on the University of California, Davis campus. Hemizygous male TgF344-AD rats were paired with female wildtype CDF344 (WT) rats from Charles River Laboratories (Shrewsbury, MA, United States) to generate 60 litters of hemizygous and WT males and females. Animals were genotyped at postnatal day (PND) 8, weaned at PND 21, and randomly assigned to TRAP- or FA-exposure groups. At ∼PND 28, animals were transported to the tunnel exposure facility (described below). Multiple cages with open-wire lids were placed inside each exposure chamber, and thus animals were exposed to whole-body FA or TRAP. The longest exposure for animals was 14 months from September 2017 to November 2018. Cytokine analyses were performed on 4–5 animals per group.
The tunnel exposure facility, which was inspected and approved by the UC Davis Institutional Animal Care and Use Committee, has been previously described (Edwards et al., 2020; Patten et al., 2020, 2021). Briefly, a vivarium was built within a mobile facility adjacent to a major highway tunnel, and air from the tunnel was delivered unchanged in real time to exposure chambers inside the vivarium. Both light- and heavy-duty vehicular traffic contributed to vehicular emissions within the tunnel. Control animals housed in the same vivarium adjacent to the tunnel were exposed to ambient air captured immediately outside the facility that was sequentially filtered through: (1) A coarse filter to remove large debris; (2) activated carbon to remove volatile organic compounds; (3) barium oxide-based catalytic converters to remove nitrogen oxides; and (4) ultra-high efficiency filters to remove coarse, fine, and ultrafine particulate matter (PM) before being delivered to the FA exposure chamber. Briefly, mean 24 h PM2.5 levels were 0.25 ± 0.11 μg/m3 in FA and 15.6 ± 3.7 μg/m3 in TRAP, which is well below the United States 24-h PM2.5 National Ambient Air Quality Standard of 35 μg/m3 (Patten et al., 2021).
After 2, 5, 9, or 14 months of exposure, corresponding to animals aged 3, 6, 10, and 15 months, respectively), a subset of animals was transported back to the University of California, Davis campus. After 18 h recovery, animals were euthanized as previously described (Patten et al., 2021), and hippocampal tissue and serum were collected. Briefly, rats were deeply anesthetized using 4% isoflurane (Southmedic Inc., Barrie ON) in a 2:1 mixture of medical grade air and medical grade oxygen delivered via inhalation at a rate of 1.5 L/min. The chest cavity was opened and whole blood was collected from the heart via cardiac puncture into serum separator tubes (Becton-Dickinson, East Rutherford, NJ). Tubes stood for 30 min at room temperature before centrifugation at 1,500 × g for 10 min. Serum was pipetted into individual microcentrifuge tubes and immediately frozen and stored at –80 C. Immediately after collecting blood, rats were transcardially perfused with 100 ml of cold 0.1 M phosphate buffered saline (PBS; pH 7.2, 137 mM NaCl, 10 mM sodium phosphate dibasic, 1.8 mM potassium phosphate monobasic) at a rate of 15 ml/min using a Masterflex peristaltic pump (Cole Parmer, Vernon Hills, IL). The brain was removed and bisected sagittally using a stainless-steel rat brain matrix (Zivic Instruments, Pittsburgh, PA). The left hemisphere hippocampus was removed by microdissection on ice, snap-frozen in individual tubes, and immediately stored at –80°C until use. Other tissues were collected for additional immunohistochemical and biochemical analyses that were previously described (Edwards et al., 2020; Patten et al., 2021).
Both serum and hippocampal cytokines and chemokines were quantified using Bio-Plex Pro™ 23-plex cytokine assays (Bio-Rad, Hercules, CA) of the same lot. Kit analytes included the following: interleukin-1beta (IL-1β), interleukin-18 (IL-18), interleukin-1alpha (IL-1ɑ), tumor necrosis factor-alpha (TNFɑ), interleukin-6 (IL-6), interleukin-12 (IL-12), which is also known as p70, interkeukin-17 (IL-17), interleukin-7 (IL-7), interleukin-2 (IL-2), interferon-gamma (IFNɣ), interleukin-4 (IL-4), interleukin-5 (IL-5), interleukin-10 (IL-10), interleukin-13 (IL-13), granulocyte colony-stimulating factor (G-CSF), granulocyte-macrophage colony-stimulating factor (GM-CSF), macrophage colony-stimulating factor (M-CSF), C-X-C motif ligand 1/keratinocyte chemoattractant (CXCL1/KC), C-C motif ligand 2/monocyte chemoattractant protein 1 (CCL2/MCP-1), C-C motif ligand 3/macrophage inflammatory protein-1 alpha (CCL3/MIP-1ɑ), C-C motif ligand 5/regulated upon activation, normal T cells, expressed, and secreted (CCL5/RANTES), C-C motif ligand 20/macrophage inflammatory protein-3 alpha (CCL20/MIP3ɑ), and vascular endothelial growth factor (VEGF).
Assays were performed in accordance with the manufacturer’s instructions, with modifications as follows: For hippocampal tissue lysates, 300 mg of frozen hippocampal tissue per animals was homogenized with a hand-held VirSonic ultrasonic cell disruptor 100 (VirTis, Gardiner, NY), using 5–10 pulses of 1 s per sample. Tissue samples were homogenized in 1x cell lysis buffer (BioRad) supplemented with cOmplete™ protease inhibitor cocktail (Sigma Aldrich, St. Louis, MO). After homogenization, samples were frozen for 15 min on dry ice, thawed, and then centrifuged at 4,500 rcf for 4 min at 4°C. Levels of total protein in the supernatant were quantified using a bicinchoninic acid colorimetric assay, in accordance with manufacturer instructions (Pierce Biotechnology, Rockford IL). Samples were assayed in duplicate and were read on a BioTek Synergy H1 hybrid microplate reader (Winooski, VT). Aliquots of tissue lysates sufficient to run duplicates were diluted to 1,000 μg/ml in cell lysis buffer. For serum analyses, samples were simply diluted 1:4 in sample buffer provided by the manufacturer. Immediately before assaying, all samples were centrifuged at 13,000 rcf for 5 min at 4°C to remove any potential debris.
Cytokine and chemokine levels were measured using a Luminex™ 100 suspension array system (Bio-Plex 200, Bio-Rad, Hercules CA) at the University of California, Davis Intellectual and Developmental Disabilities Research Center (IDDRC) core facility. Individual chemokine and cytokine concentrations were calculated using a nine-point standard curve derived from reference cytokines, and the means of animals in each group (n = 4–5) were compared. If concentrations fell below the lowest standard, samples were assigned a value the limit of detection/2 for that plate. Because these plates did not include internal reference standards, samples from different plates were not directly compared unless standard curves matched. For visualization and comparisons for animals within a particular age, all cytokine changes were normalized to the geometric mean of the corresponding analyte in FA-exposed female WT animals. As cytokines have different baseline levels, this allowed us to visualize the magnitude of effects of sex, genotype and exposure on all analytes. Absolute cytokines levels were used to compare change as a function of age.
Statistical analyses were performed using GraphPad Prism statistical software, version 7.03 (GraphPad Software, La Jolla, CA). Within each time point, each analyte was analyzed separately by three-way ANOVA, using sex, genotype, and exposure as factors. Analyses for the effects of age were analyzed separately, using one-way ANOVA. Our primary goal was to determine the effect(s) of TRAP exposure on cytokine and chemokine levels in the brain and serum. However, we also reported statistically significant main effects of sex or genotype, or an interaction between any of the three ANOVA factors. Post hoc analyses were performed using Sidak’s test to correct for multiple tests. Serum cytokine and chemokine concentrations were natural log (ln)-transformed to meet model assumptions of normality and homogeneity of variances. All statistical tests were two-sided and evaluated at a significance level of 0.05.
We first evaluated the effect of age on protein expression levels of cytokines in both the serum and the hippocampus of WT and TgF344-AD rats exposed to FA or TRAP (Figure 1). To identify sex differences, mean values in each group were normalized to age-matched female WT animals exposed to FA. The temporal expression profiles varied across cytokines, chemokines and growth factors in the serum and the hippocampus, and for any given cytokine, the expression profile in the serum varied from that of the hippocampus (Figure 1). Analysis of the data using ANOVA identified significant age-dependent differences in expression levels in WT females, results of which are summarized in Supplementary Table 1 (female serum) Supplementary Table 2 (female hippocampus).
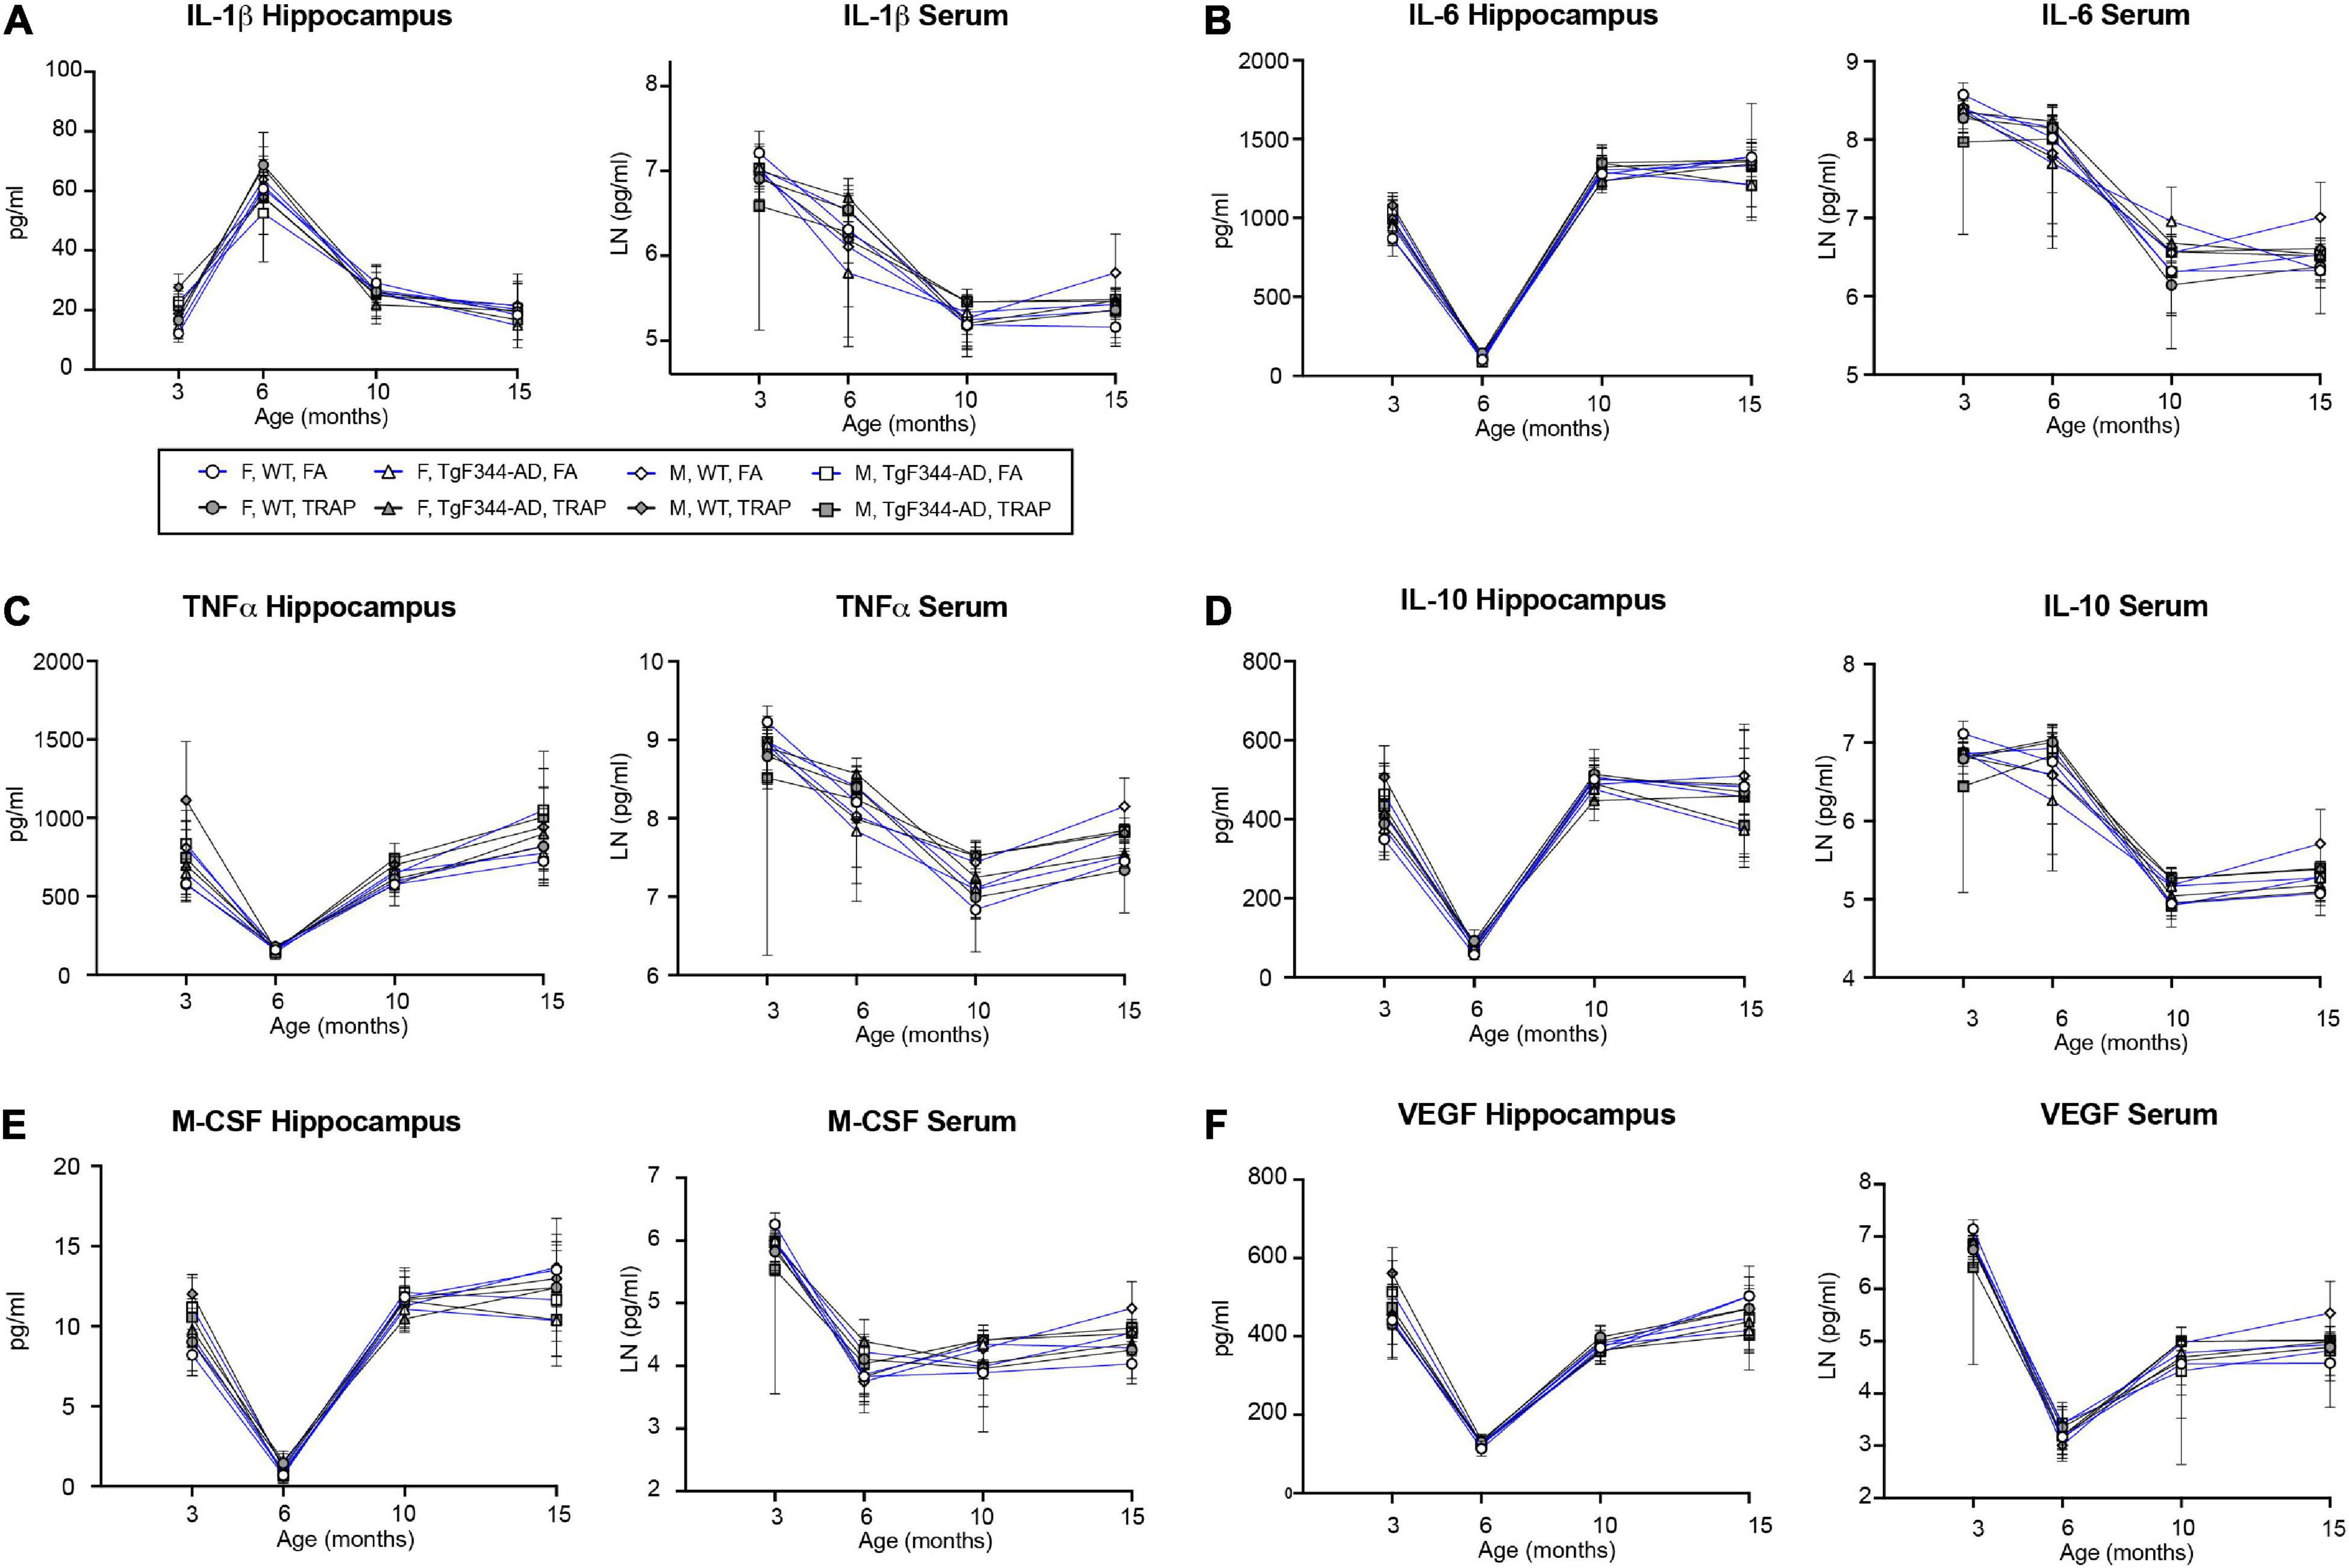
Figure 1. Neither TRAP exposure nor expression of AD risk genes significantly alter age-related changes in cytokines and growth factors in the rat hippocampus and serum. Hippocampal and serum levels of representative cytokines and growth factors in TgF344-AD and WT rats exposed to FA or TRAP beginning at postnatal day 28 and continuing for up to 15 months of age. Representative analytes include (A) IL-1β, representative of the inflammasome; (B) IL-6 and (C) TNFɑ, representative of Th1/pro-inflammatory cytokines; (D) IL-10, representative of Th2/anti-inflammatory cytokines; and (E) M-CSF and (F) VEGF, representative of growth factors. Data points represent the mean ± S.D. (n = 4–5 animals per group). Samples were assayed in duplicates; F, females; M, males.
In FA WT females, the serum cytokines generally exhibited one of three patterns (Figure 1 and Supplementary Table 1). For IL-1β, IL-18, IL-1ɑ, TNFɑ, IL-6, IL-12 (p70), IL-17, IL-2, IFNɣ, IL-5, IL-10, G-CSF, GM-CSF, and CXCL1, levels were highest at 3 months followed by 6 months and were lowest and approximately equal at 10 and 15 months. The cytokines IL-7, M-CSF, CCL3, CCL20, CCL5, and CCL2 exhibited a pattern in which the highest levels occurred at 3 months, but levels at 6, 10, and 15 were approximately equal. The cytokines IL-4, IL-13, and VEGF were highest at 3 months, followed by 10 and 15 months, with lowest levels observed at 6 months.
In FA WT female, hippocampal cytokines exhibited one of four patterns (Figure 1 and Supplementary Table 2). For IL-1ɑ, IFNɣ, IL-4, IL-5, IL-10, IL-13, G-CSF, M-CSF, CXCL1, CCL3, TNFɑ, and CCL20, approximately equal levels were observed at 3, 10, and 15 months, with lower levels at 6 months. For IL-6, IL-12 (p70), IL-17, IL-7, IL-2, GM-CSF, CCL2, and VEGF, levels were highest at 15 months, followed by 3, 10, and 6 months. TNFɑand CCL5 showed highest levels at 3 months, followed by 15, 10, and 6 months. Finally, IL-1β and IL-18 showed a different profile in which levels were highest at 6 months, followed by approximately equal levels at 3 and 10 months, and lowest levels at 15 months.
The serum cytokines, chemokines and growth factors were not significantly altered by sex, genotype or exposure in 3 (Figure 2), 6 (Figure 3), 10 (Figure 4), or 15 (Figure 5) month-old animals exposed to FA or TRAP for 2, 5, 9, or 14 months, respectively. Although there appeared to be an overall trend of decreased serum cytokines levels in transgenic males exposed to TRAP at 3 months compared to all other groups (Figure 2), this effect was not significant for any analyte. Cytokine levels were remarkably consistent between groups, and there were no significant effects with any factor (sex, genotype, exposure) at any age (Figures 2–5).
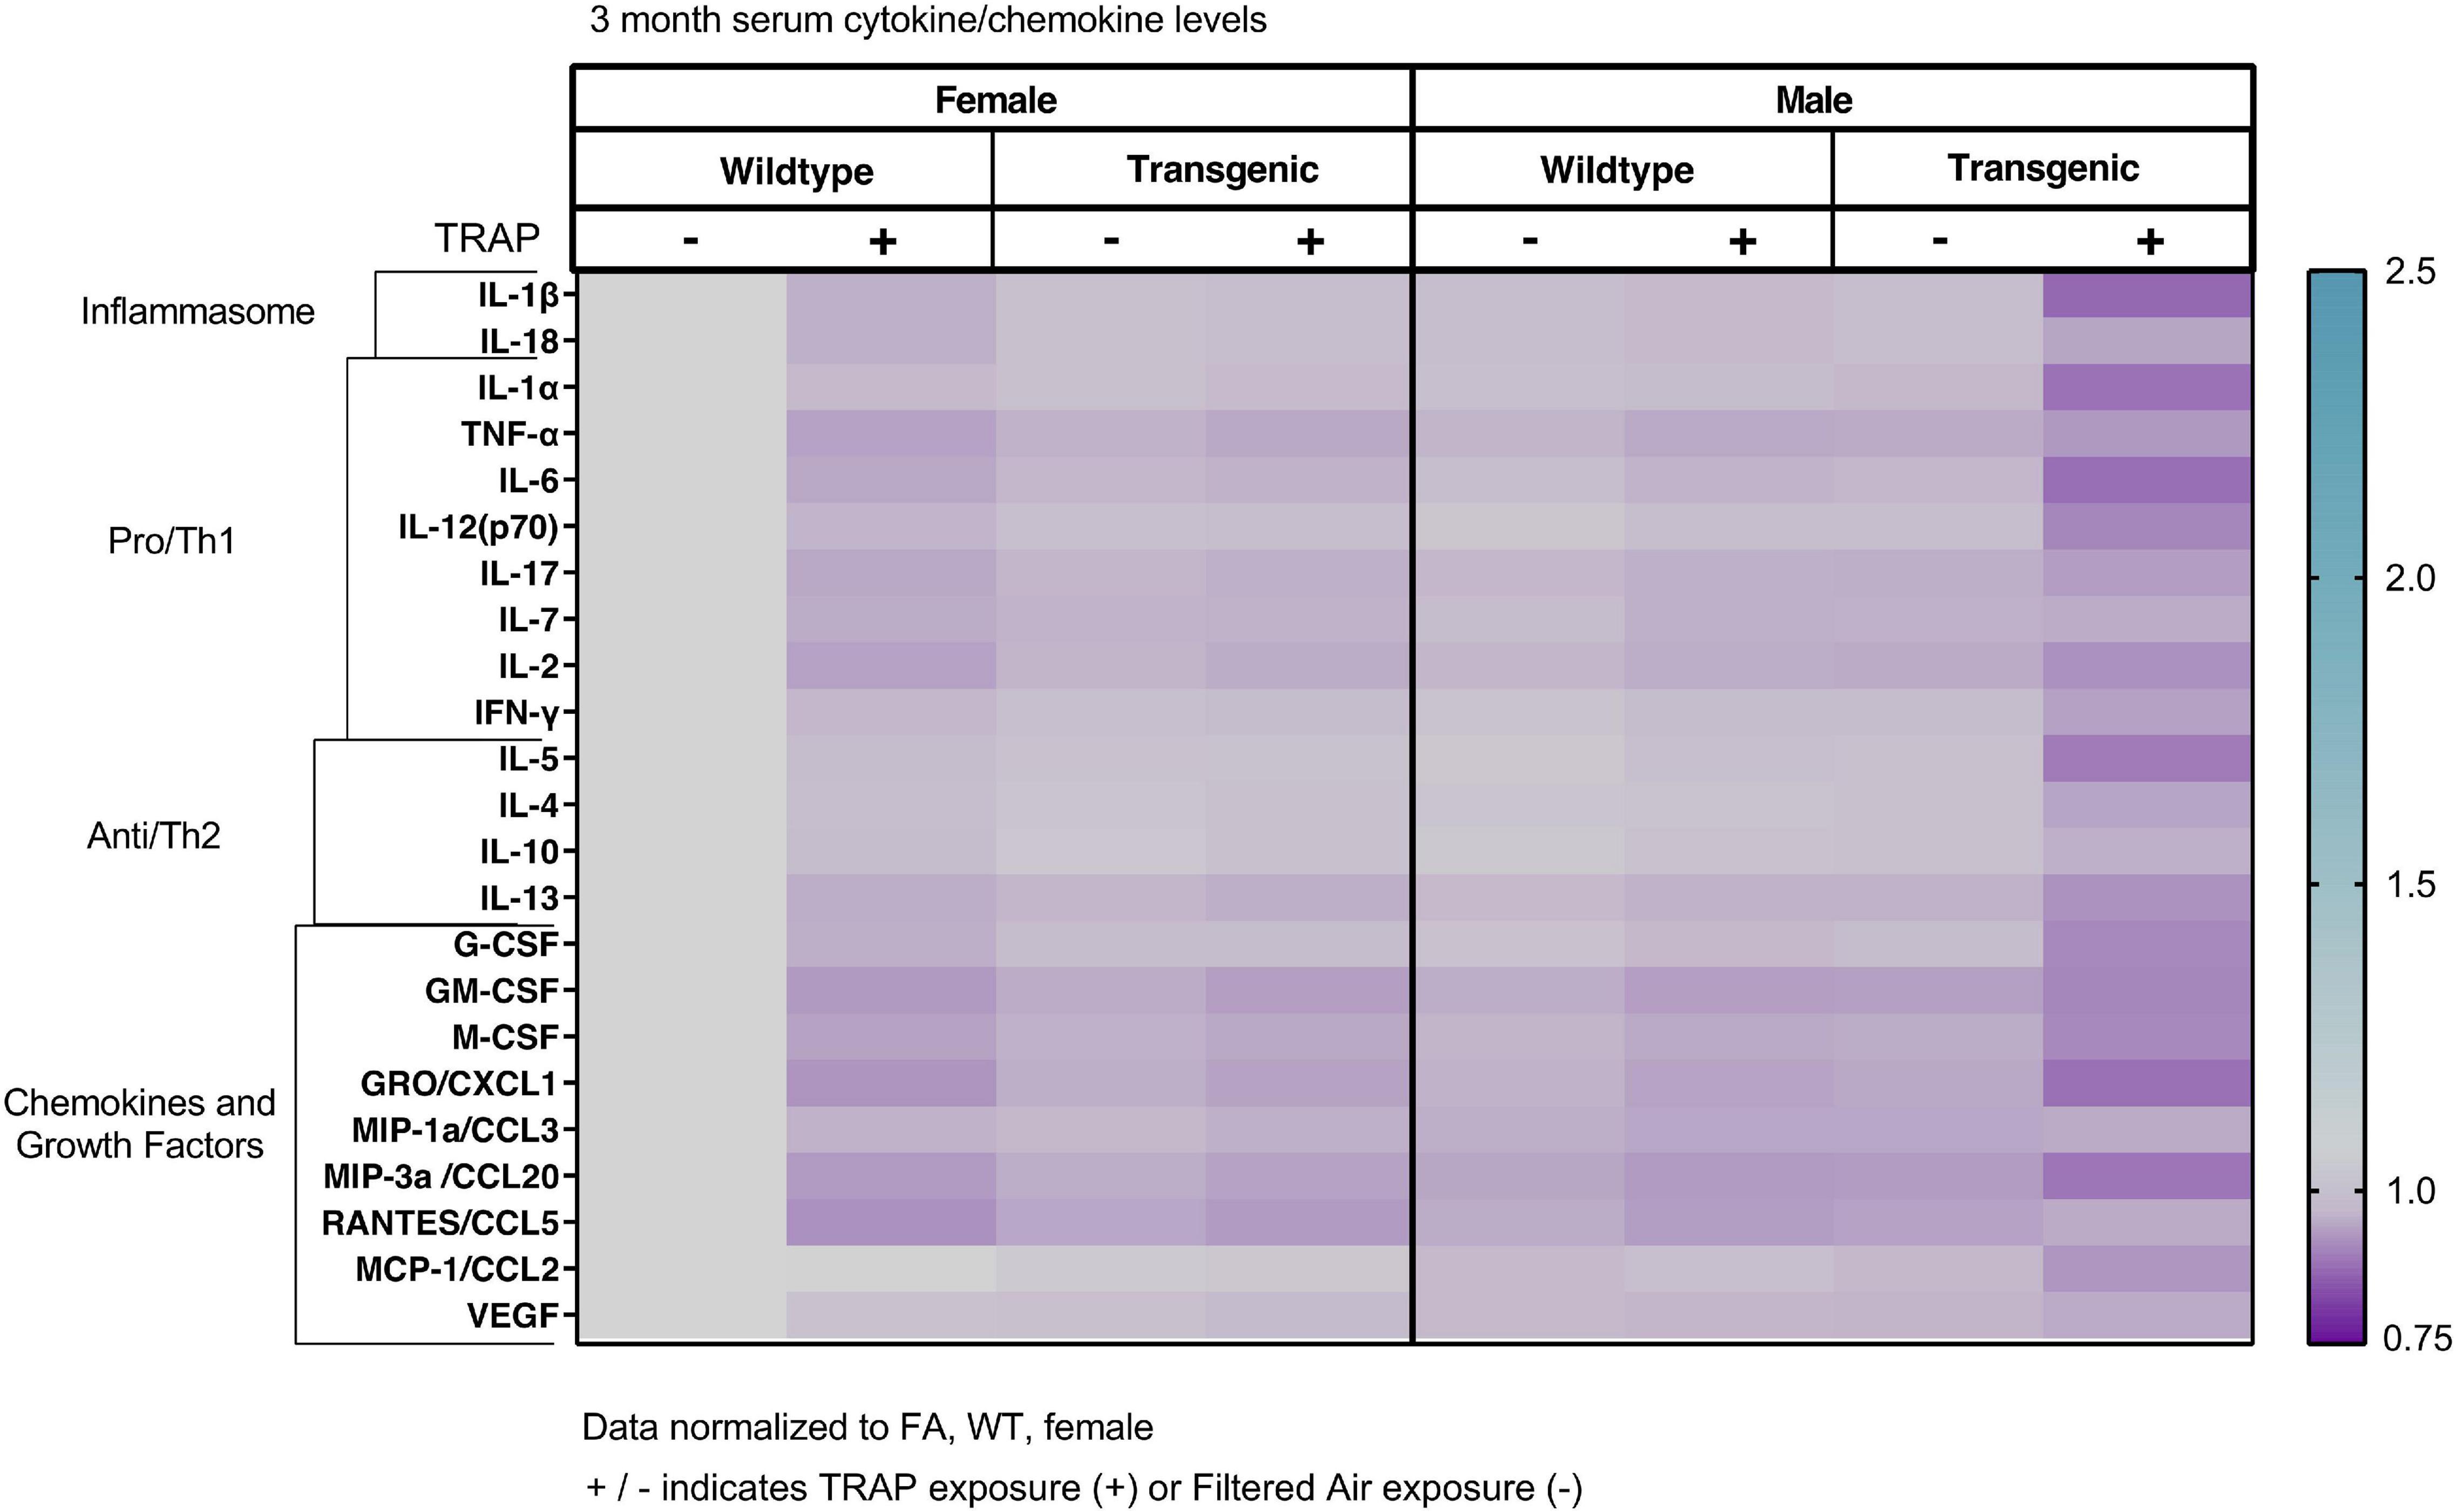
Figure 2. Heat map representation of serum cytokine, chemokine, and growth factor changes in response to TRAP in 3-month old TgF344-AD and WT rats. Serum levels of cytokines and growth factors in TgF344-AD and WT rats exposed to FA or TRAP for 2 months were analyzed using multiplex technology. For each analyte, individual values were normalized to the mean level of that same analyte in sera from female FA WT animals. Purple indicates normalized protein levels < 1.0; turquoise indicates normalized protein levels > 1.0. ± indicates exposure with + identifying TRAP-exposed animals; - indicating FA-exposed animals; n = 4–5 animals per group (duplicate samples were analyzed for each animal). Non-normalized cytokine values for female FA WT animals are provided in Supplementary Table 1.
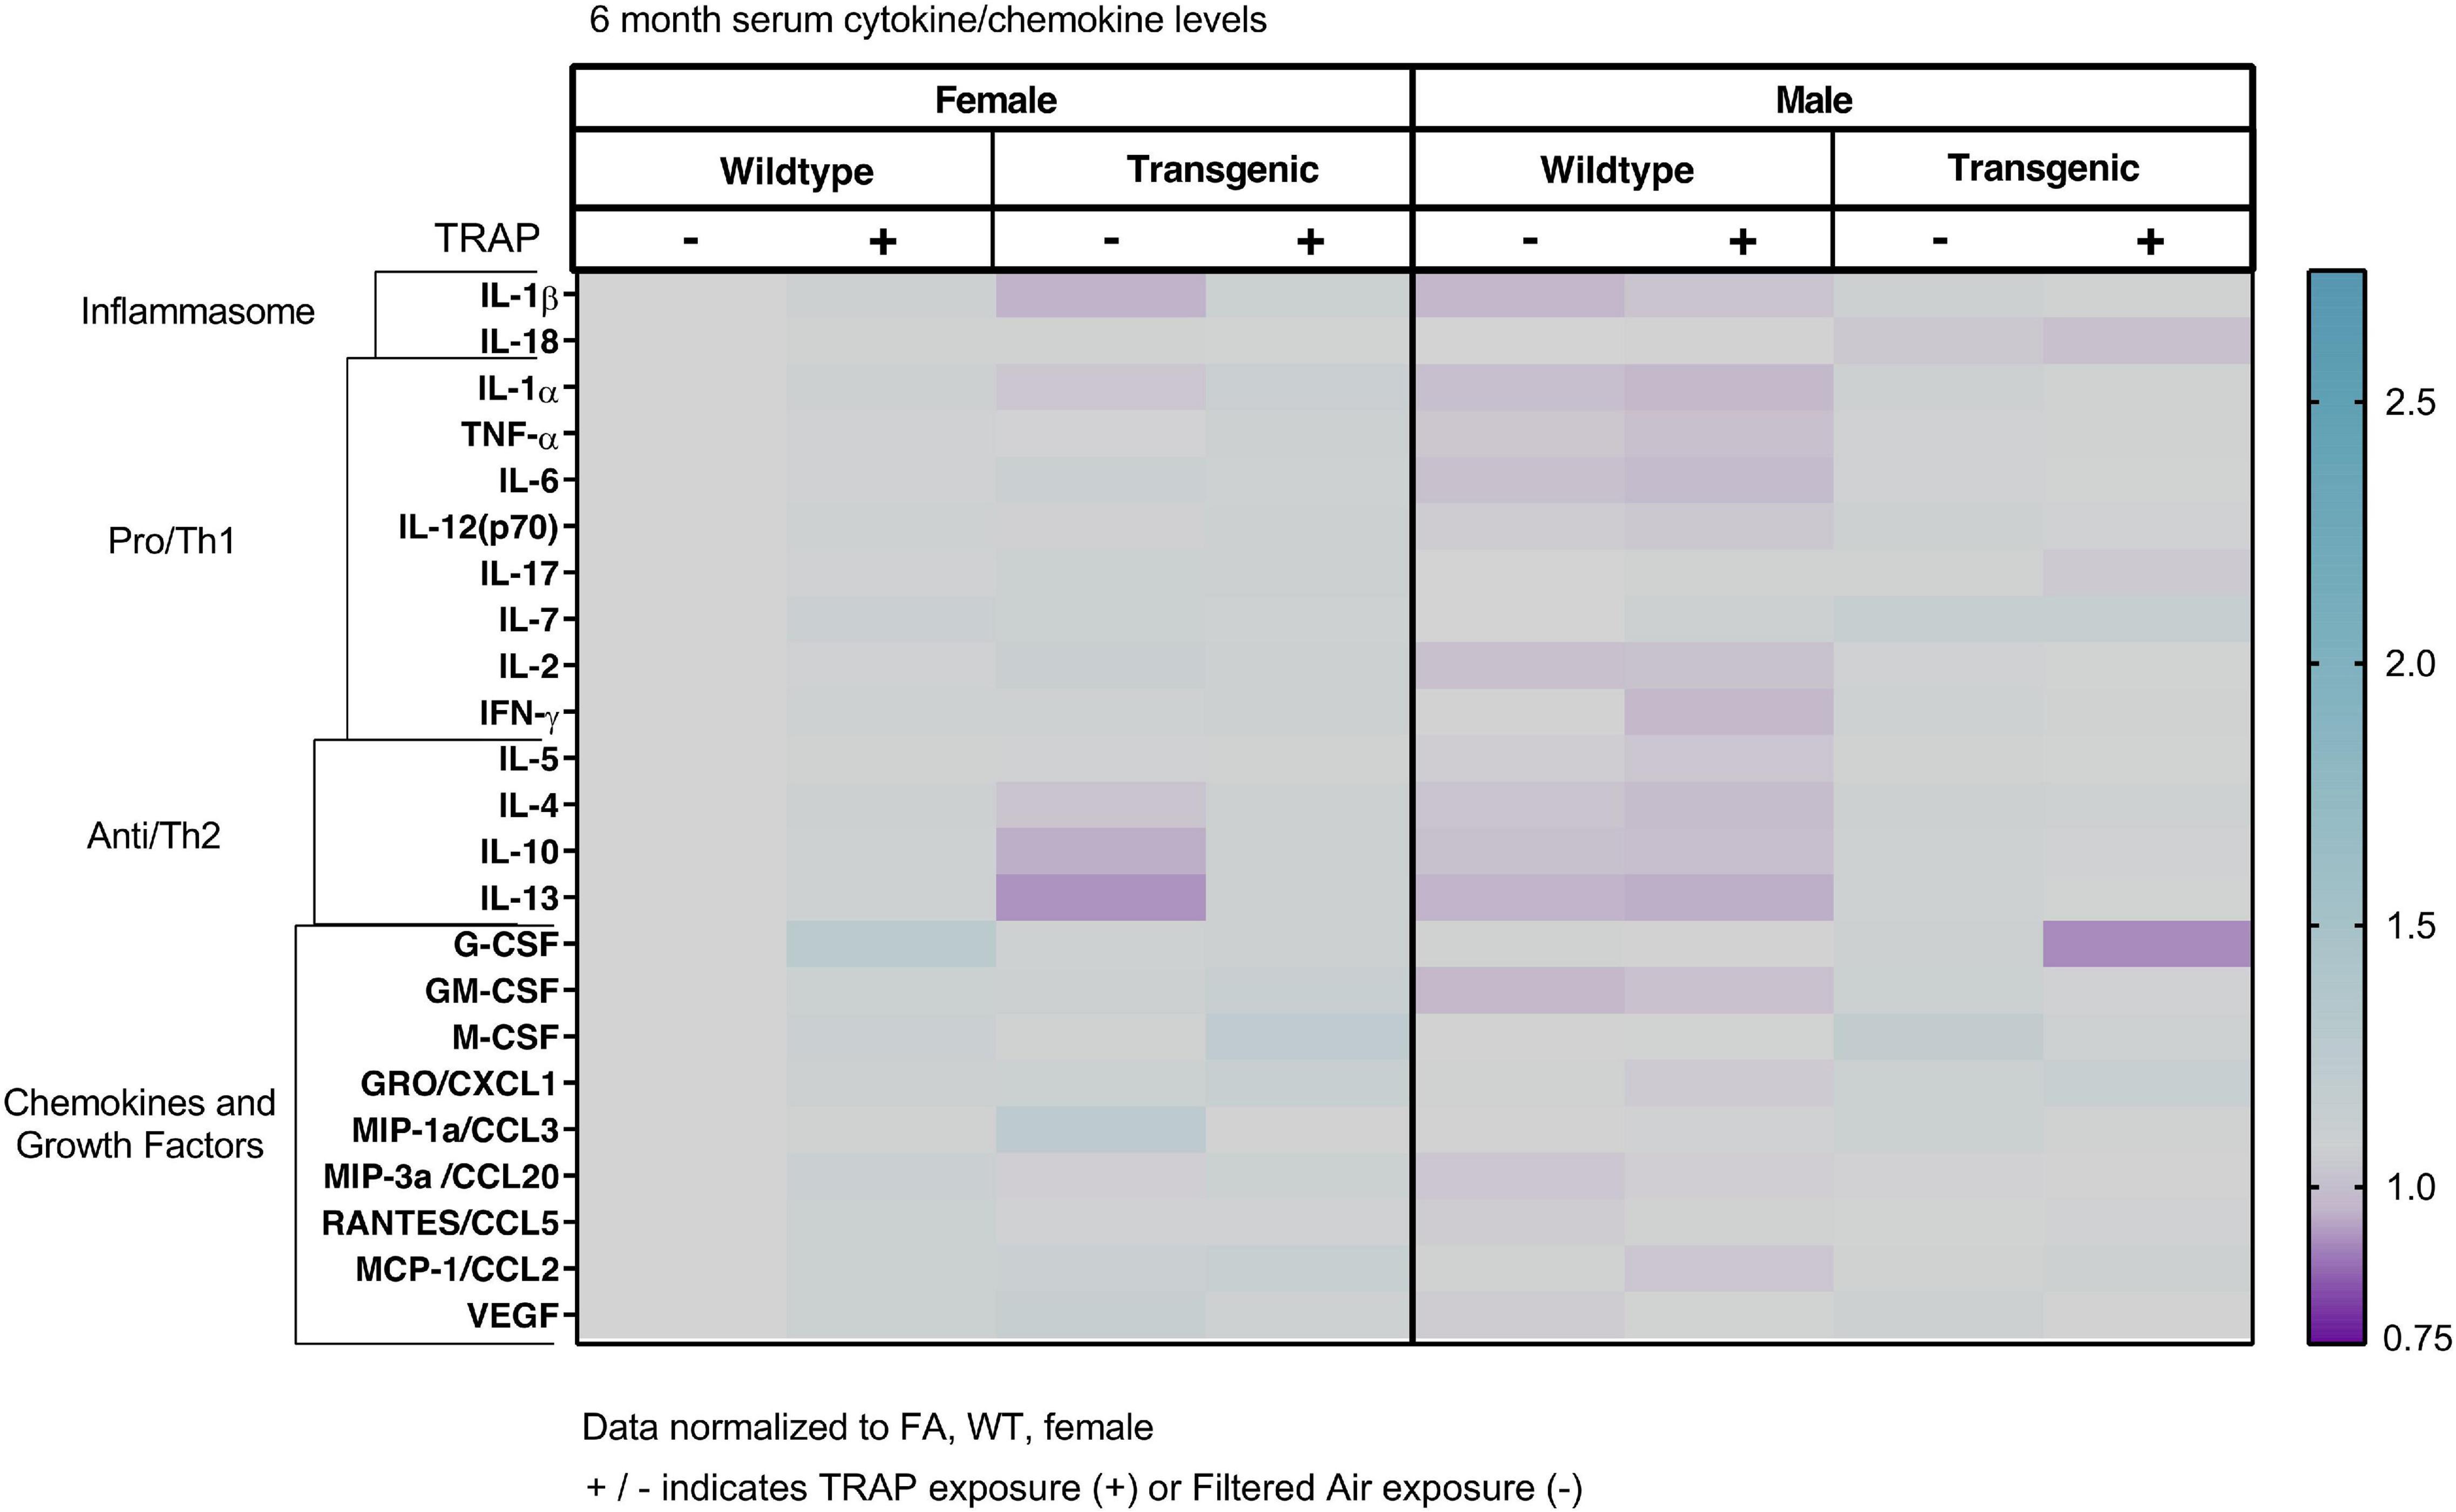
Figure 3. Heat map representation of serum cytokine, chemokine, and growth factor changes in response to TRAP in 6-month old TgF344-AD and WT rats. Serum levels of cytokines and growth factors in TgF344-AD and WT rats exposed to FA or TRAP for 5 months were analyzed using multiplex technology. For each analyte, individual values were normalized to the mean level of that same analyte in sera from female FA WT animals. Purple indicates normalized protein levels < 1.0; turquoise indicates normalized protein levels > 1.0. ± indicates exposure with + identifying TRAP-exposed animals; - indicating FA-exposed animals; n = 4–5 animals per group (duplicate samples were analyzed for each animal). Non-normalized cytokine values for female FA WT animals are provided in Supplementary Table 1.
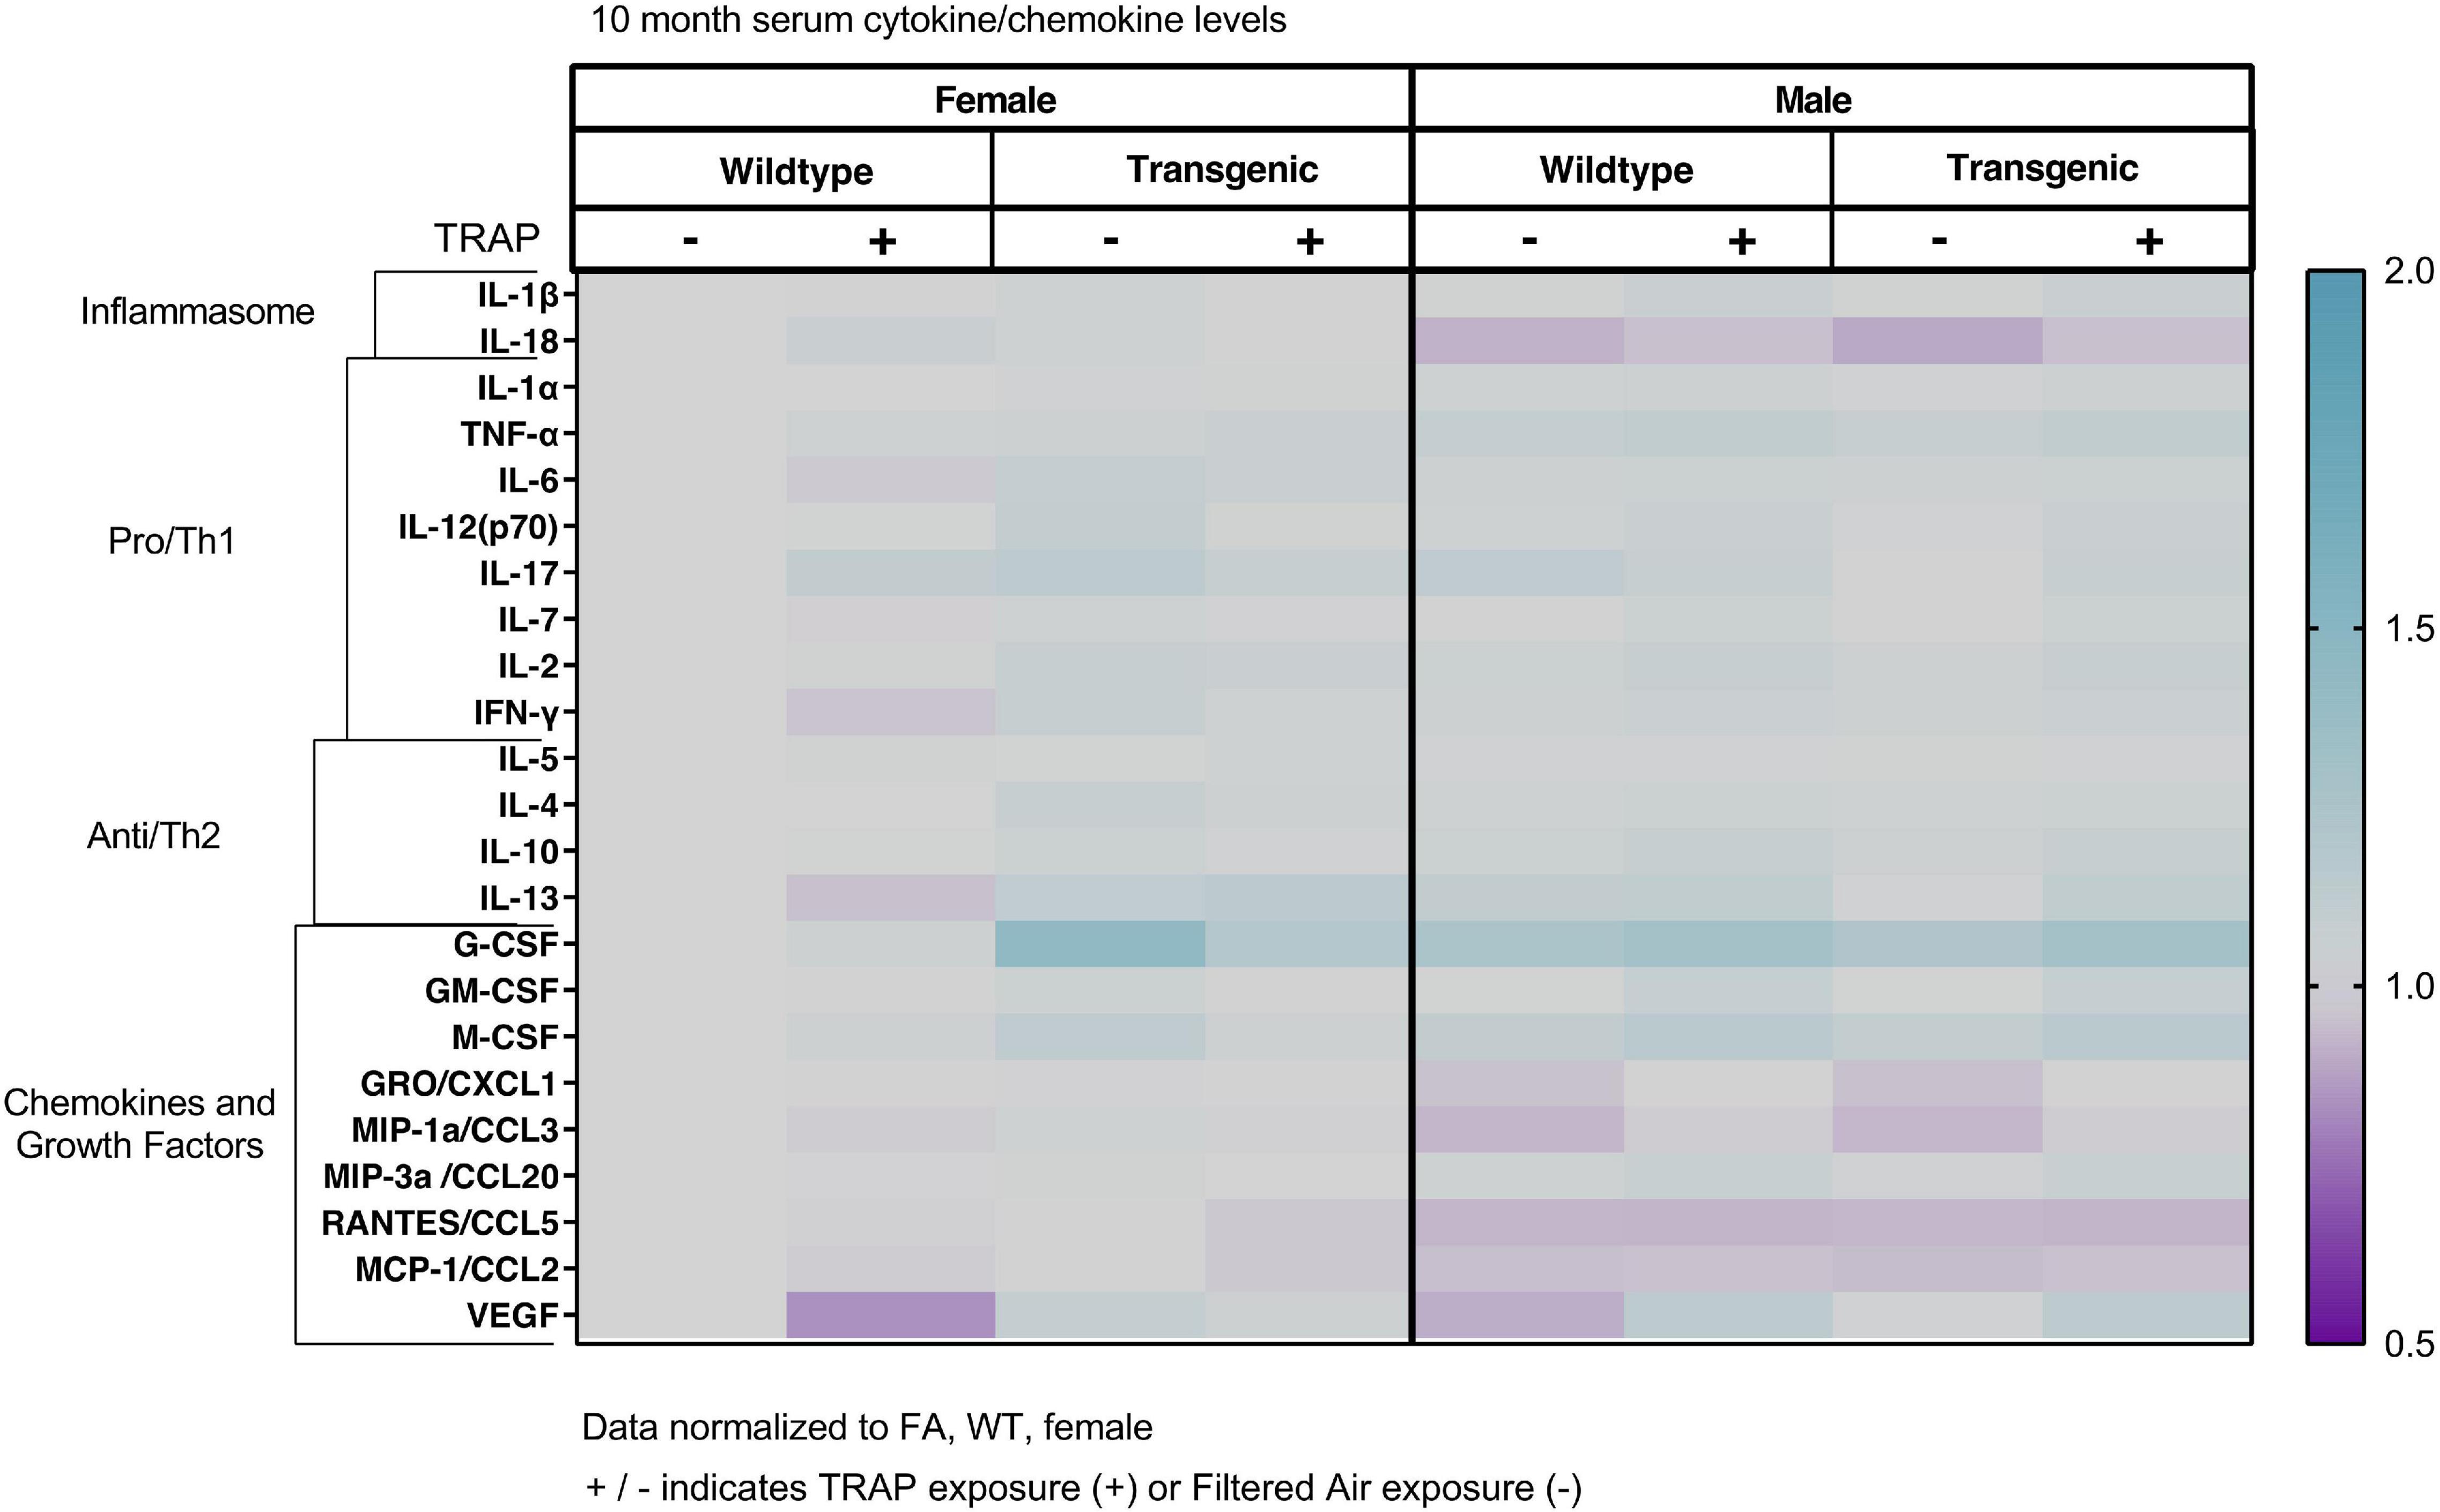
Figure 4. Heat map representation of serum cytokine, chemokine, and growth factor changes in response to TRAP in 10-month old TgF344-AD and WT rats. Serum levels of cytokines and growth factors in TgF344-AD and WT rats exposed to FA or TRAP for 9 months were analyzed using multiplex technology. For each analyte, individual values were normalized to the mean level of that same analyte in sera from female FA WT animals. Purple indicates normalized protein levels < 1.0; turquoise indicates normalized protein levels > 1.0. ± indicates exposure with + identifying TRAP-exposed animals; - indicating FA-exposed animals; n = 4–5 animals per group (duplicate samples were analyzed for each animal). Non-normalized cytokine values for female FA WT animals are provided in Supplementary Table 1.
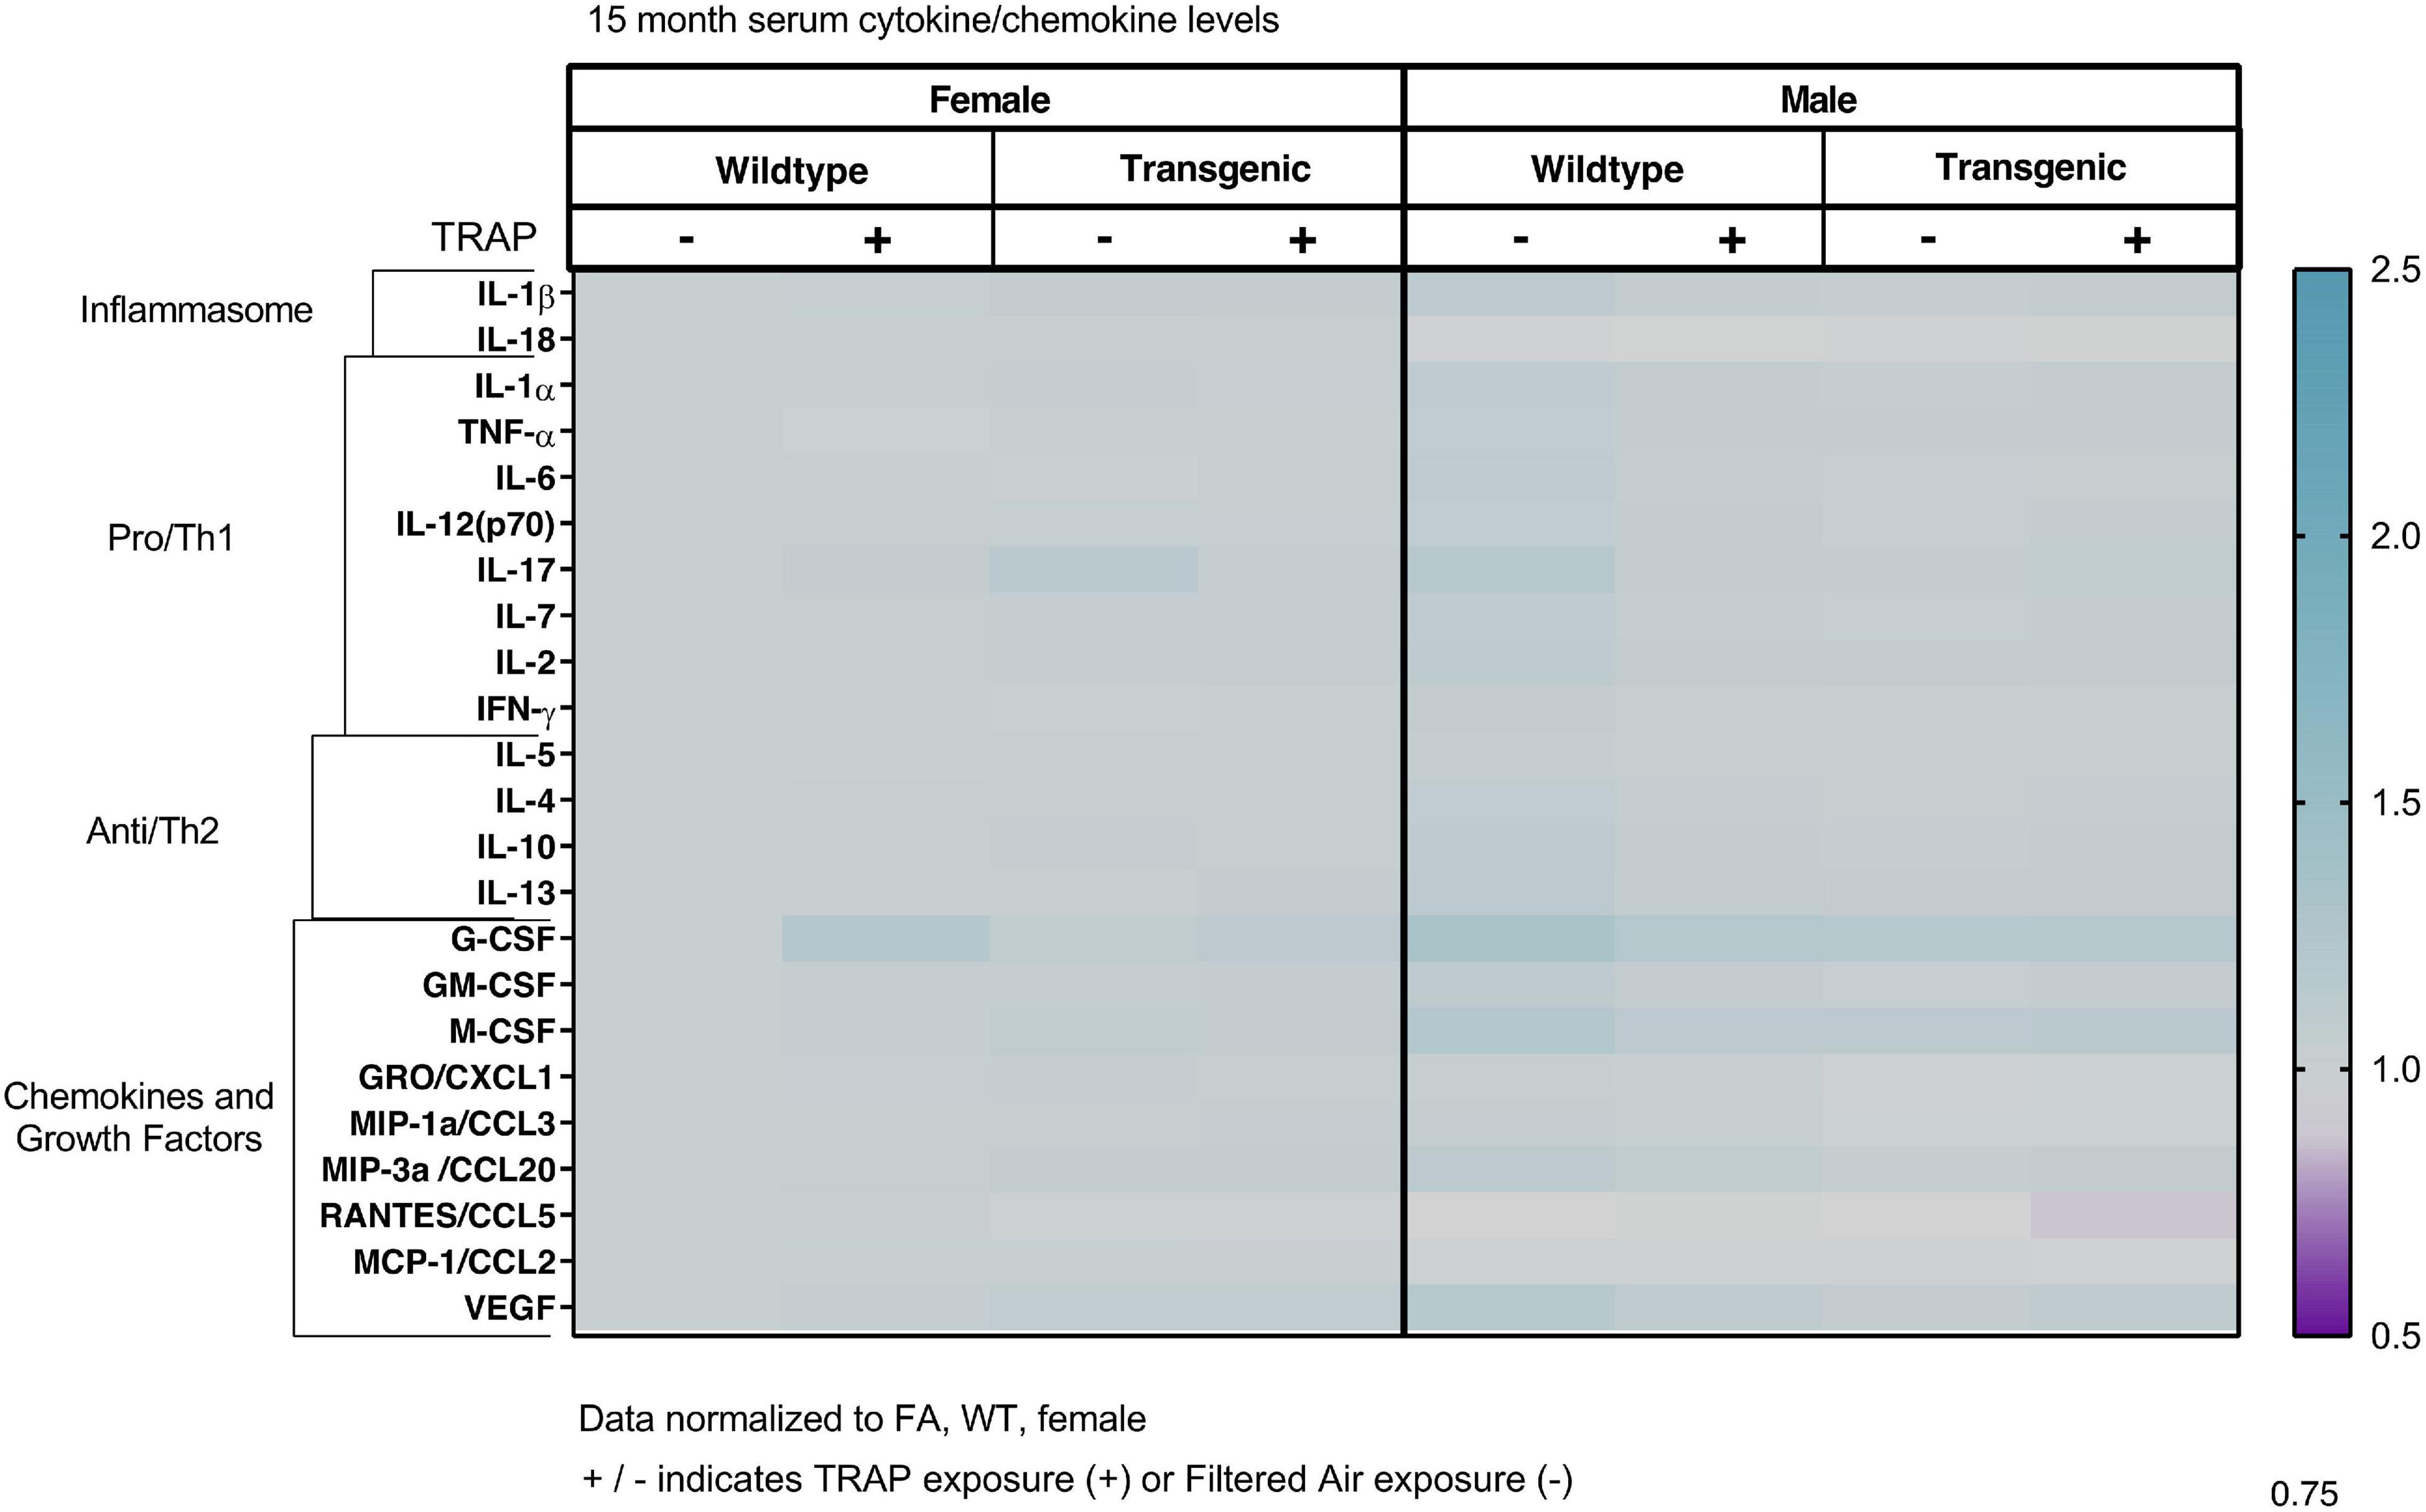
Figure 5. Heat map representation of serum cytokine, chemokine, and growth factor changes in response to TRAP in 15-month old TgF344-AD and WT rats. Serum levels of cytokines and growth factors in TgF344-AD and WT rats exposed to FA or TRAP for 14 months were analyzed using multiplex technology. For each analyte, individual values were normalized to the mean level of that same analyte in sera from female FA WT animals. Purple indicates normalized protein levels < 1.0; turquoise indicates normalized protein levels > 1.0. ± indicates exposure with + identifying TRAP-exposed animals; - indicating FA-exposed animals; n = 4–5 animals per group (duplicate samples were analyzed for each animal). Non-normalized cytokine values for female FA WT animals are provided in Supplementary Table 1.
Heat maps representing group differences in hippocampal cytokines after 2, 5, 9, and 14 months of exposure are shown in Figures 6–9, respectively. In 3-month-old animals exposed to FA or TRAP for 2 months, cytokine levels differed between males and females, and these differences were most pronounced for IL-1b. A 3-way ANOVA (Table 1) revealed a significant main effect of genotype, in which TgF344-AD animals had higher IL-1b than WT animals [F(1, 32) = 8.44, p = 0.0376]. We also observed a significant main effect of TRAP exposure [F(1, 32) = 2.43, p = 0.0468] and of sex [F(1, 32) = 16.54, p < 0.0001], and an interaction between sex and TRAP [F(1, 32) = 10.76, p = 0.0219]. Post hoc analysis showed that TRAP-exposed female TgF344-AD and WT animals had higher levels of IL-1b compared to their FA-exposed controls (1.41-fold in WT animals, p = 0.0219; and 1.76-fold in TgF344 animals, p = 0.0402, respectively). We also found a significant main effect of sex for TNFɑin 3-month-old animals [F(1, 32) = 9.877, p = 0.019], and a significant interaction between sex and TRAP exposure [F(1, 32) = 12.310, p = 0.003]. Post hoc analysis showed that male TRAP-exposed animals had higher TNFɑlevels than FA-exposed controls (p = 0.0271). No other post hoc analyses were significant.
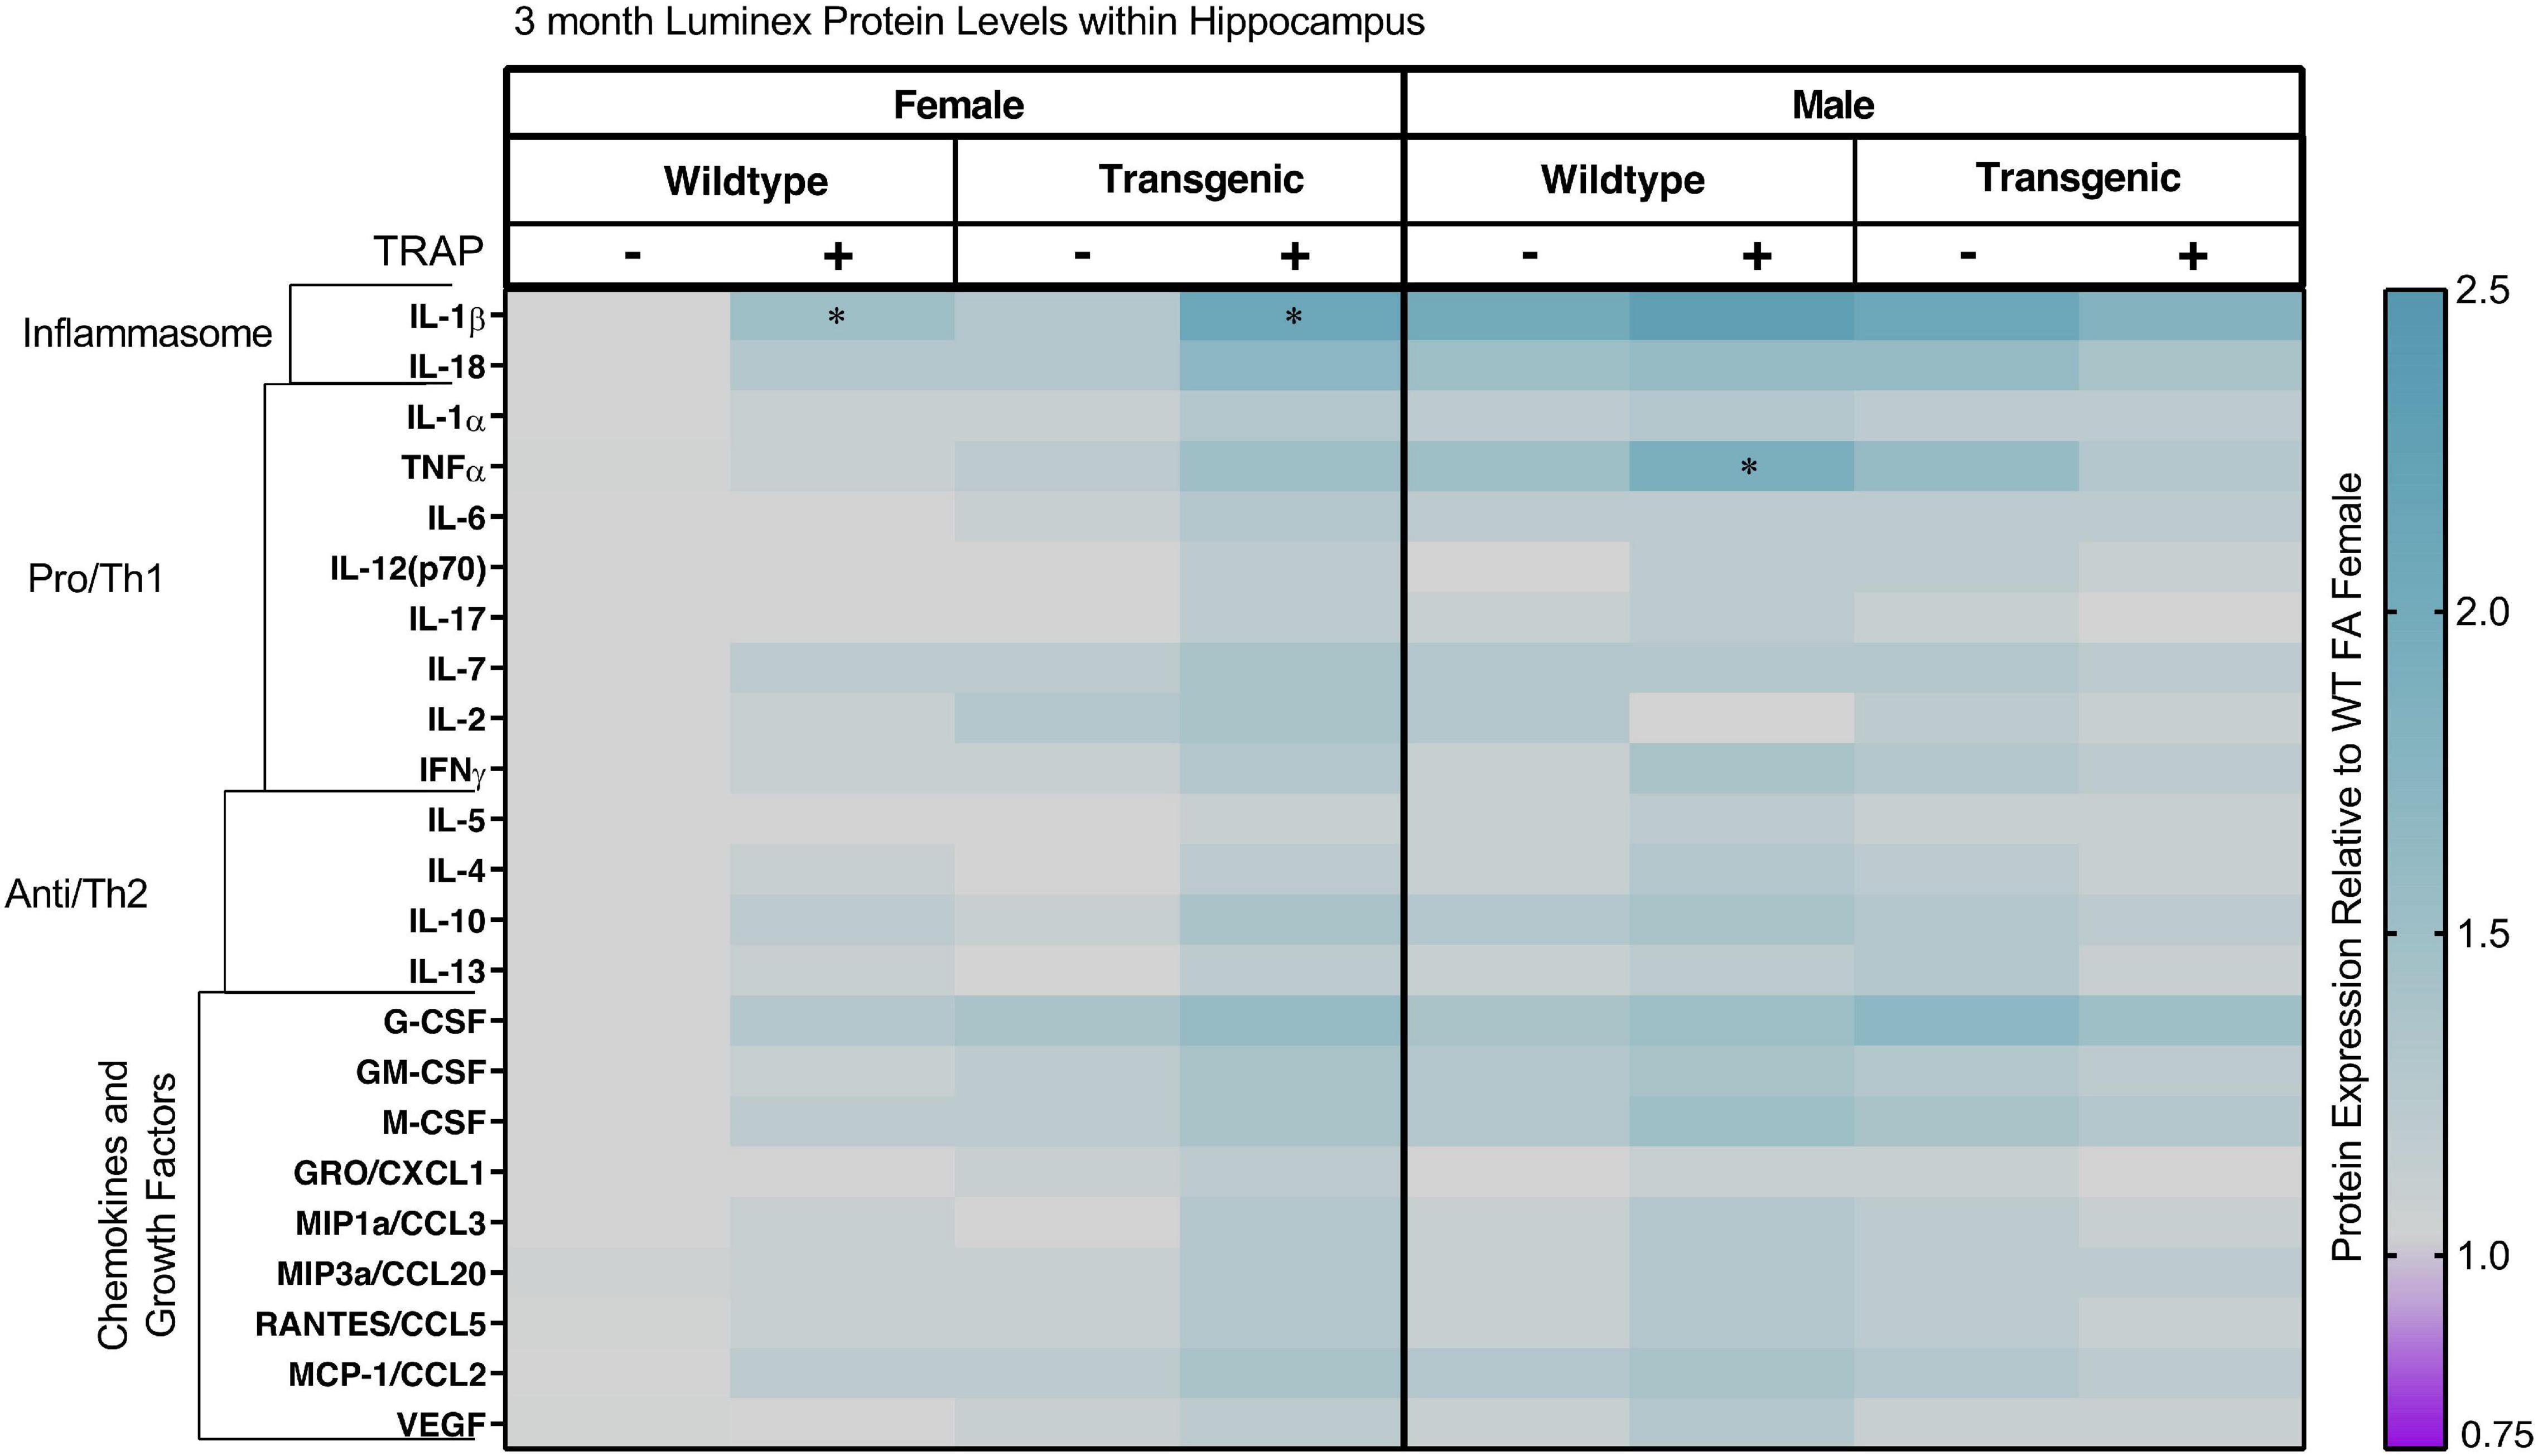
Figure 6. Heat map representation of hippocampal cytokine, chemokine, and growth factor changes in response to TRAP in 3-month old TgF344-AD and WT rats. Hippocampal levels of cytokines and growth factors in TgF344-AD and WT rats exposed to FA or TRAP for 2 months were analyzed using multiplex technology. For each analyte, individual values were normalized to the mean level of that same analyte in hippocampal tissue from female FA WT animals. Purple indicates normalized protein levels < 1.0; turquoise indicates normalized protein levels > 1.0. ± indicates exposure with + identifying TRAP-exposed animals; - indicating FA-exposed animals; n = 4–5 animals per group (duplicate samples were analyzed for each animal). *Significantly different from sex-matched WT FA control at p < 0.05 as determined by post hoc Sidak’s test. Non-normalized cytokine values for female WT animals are provided in Supplementary Table 2.
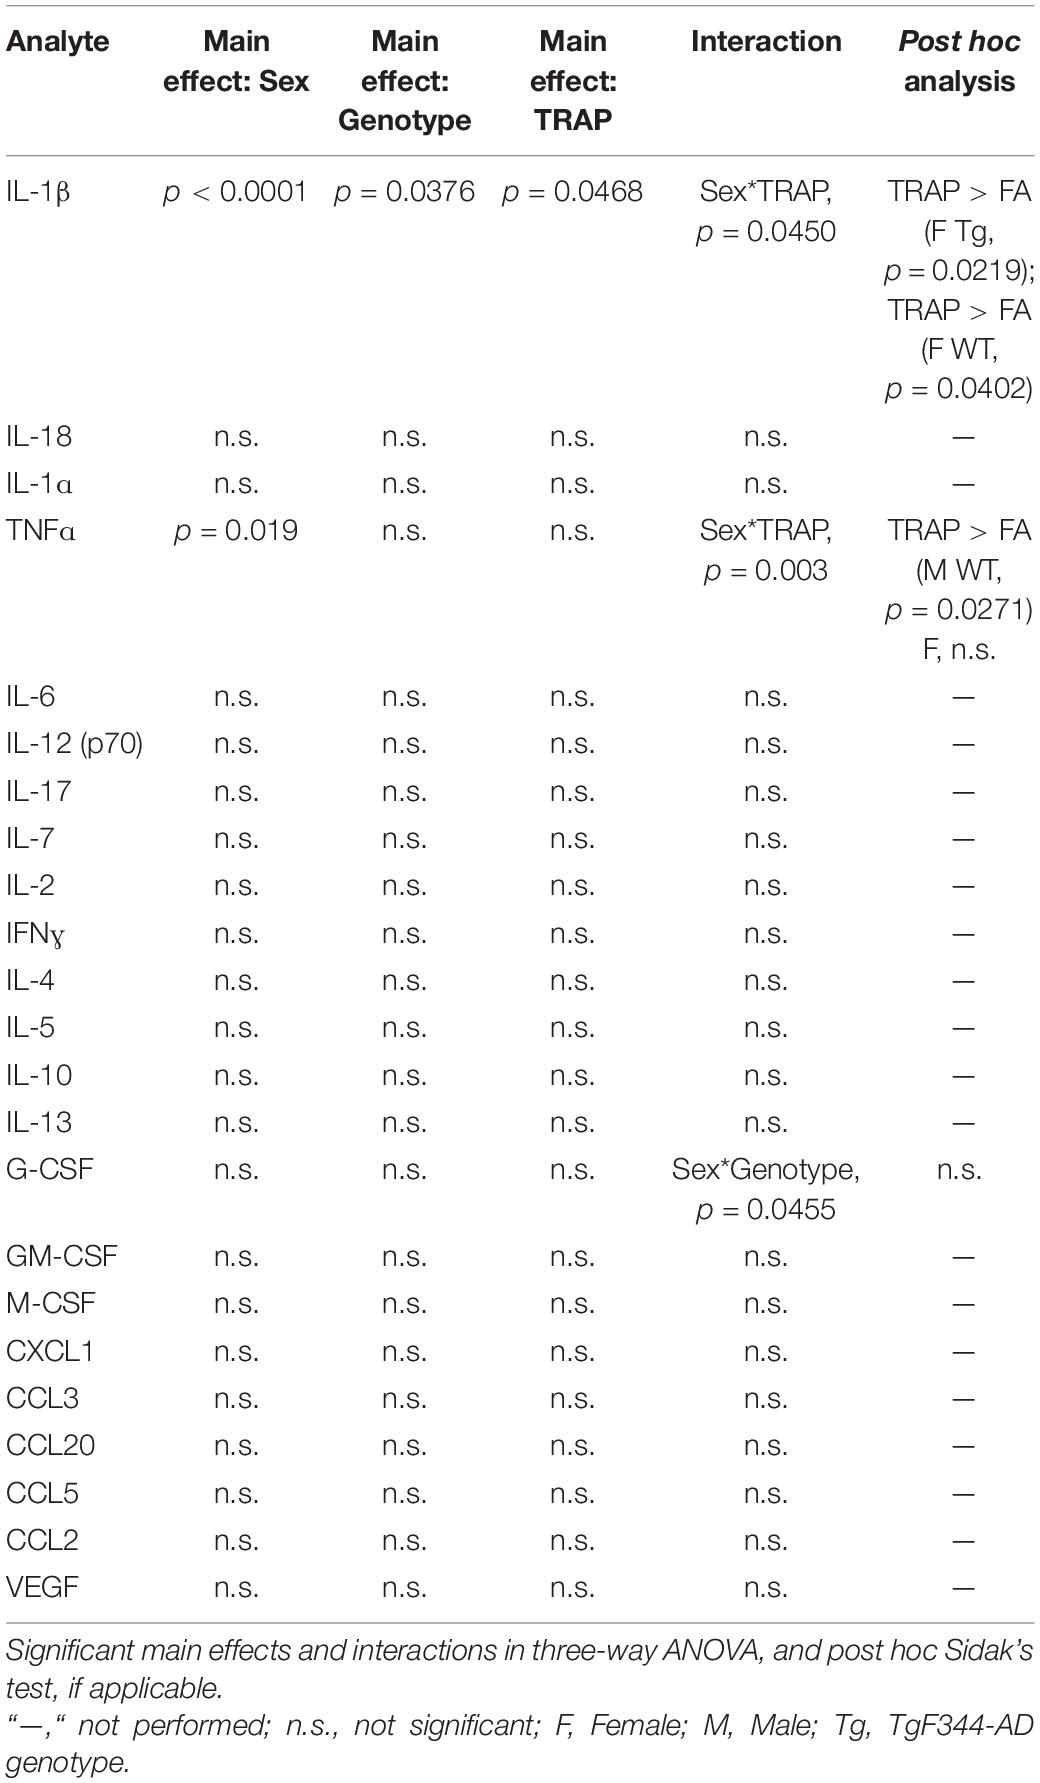
Table 1. Summary of statistical comparisons for levels of cytokines, chemokines, and growth factors in the hippocampus of 3-month old TgF344-AD and WT rats after 2 months of exposure.
In 6-month-old animals exposed to FA or TRAP (Figure 7 and Table 2), TRAP had an overall effect on the cytokine expression pattern in both TgF344-AD and WT female but not male animals. Statistical analysis indicated there was a significant interaction between sex and TRAP for IFNg (p = 0.0492); however, there were no significant post hoc comparisons. There was a significant main effect of sex for IL-2 [F(1, 32) = 14.056, p = 0.002], where males had 0.71-fold lower levels compared to females. In addition, there was an interaction between sex and TRAP for the growth factor G-CSF [F(1, 32) = 13.757, p = 0.0264], though post hoc analyses did not identify significant differences. For the growth factor M-CSF there was a significant interaction between sex, genotype, and TRAP [F(1, 32) = 9.256, p = 0.0392]. Post hoc analyses for M-CSF showed that TRAP-exposed TgF344-AD and WT females had higher levels of M-CSF than their FA-exposed controls (1.53 for TgF344-AD, p = 0.0459, and 1.39 for WT, p = 0.0398, respectively). There were no additional significant post hoc comparisons.
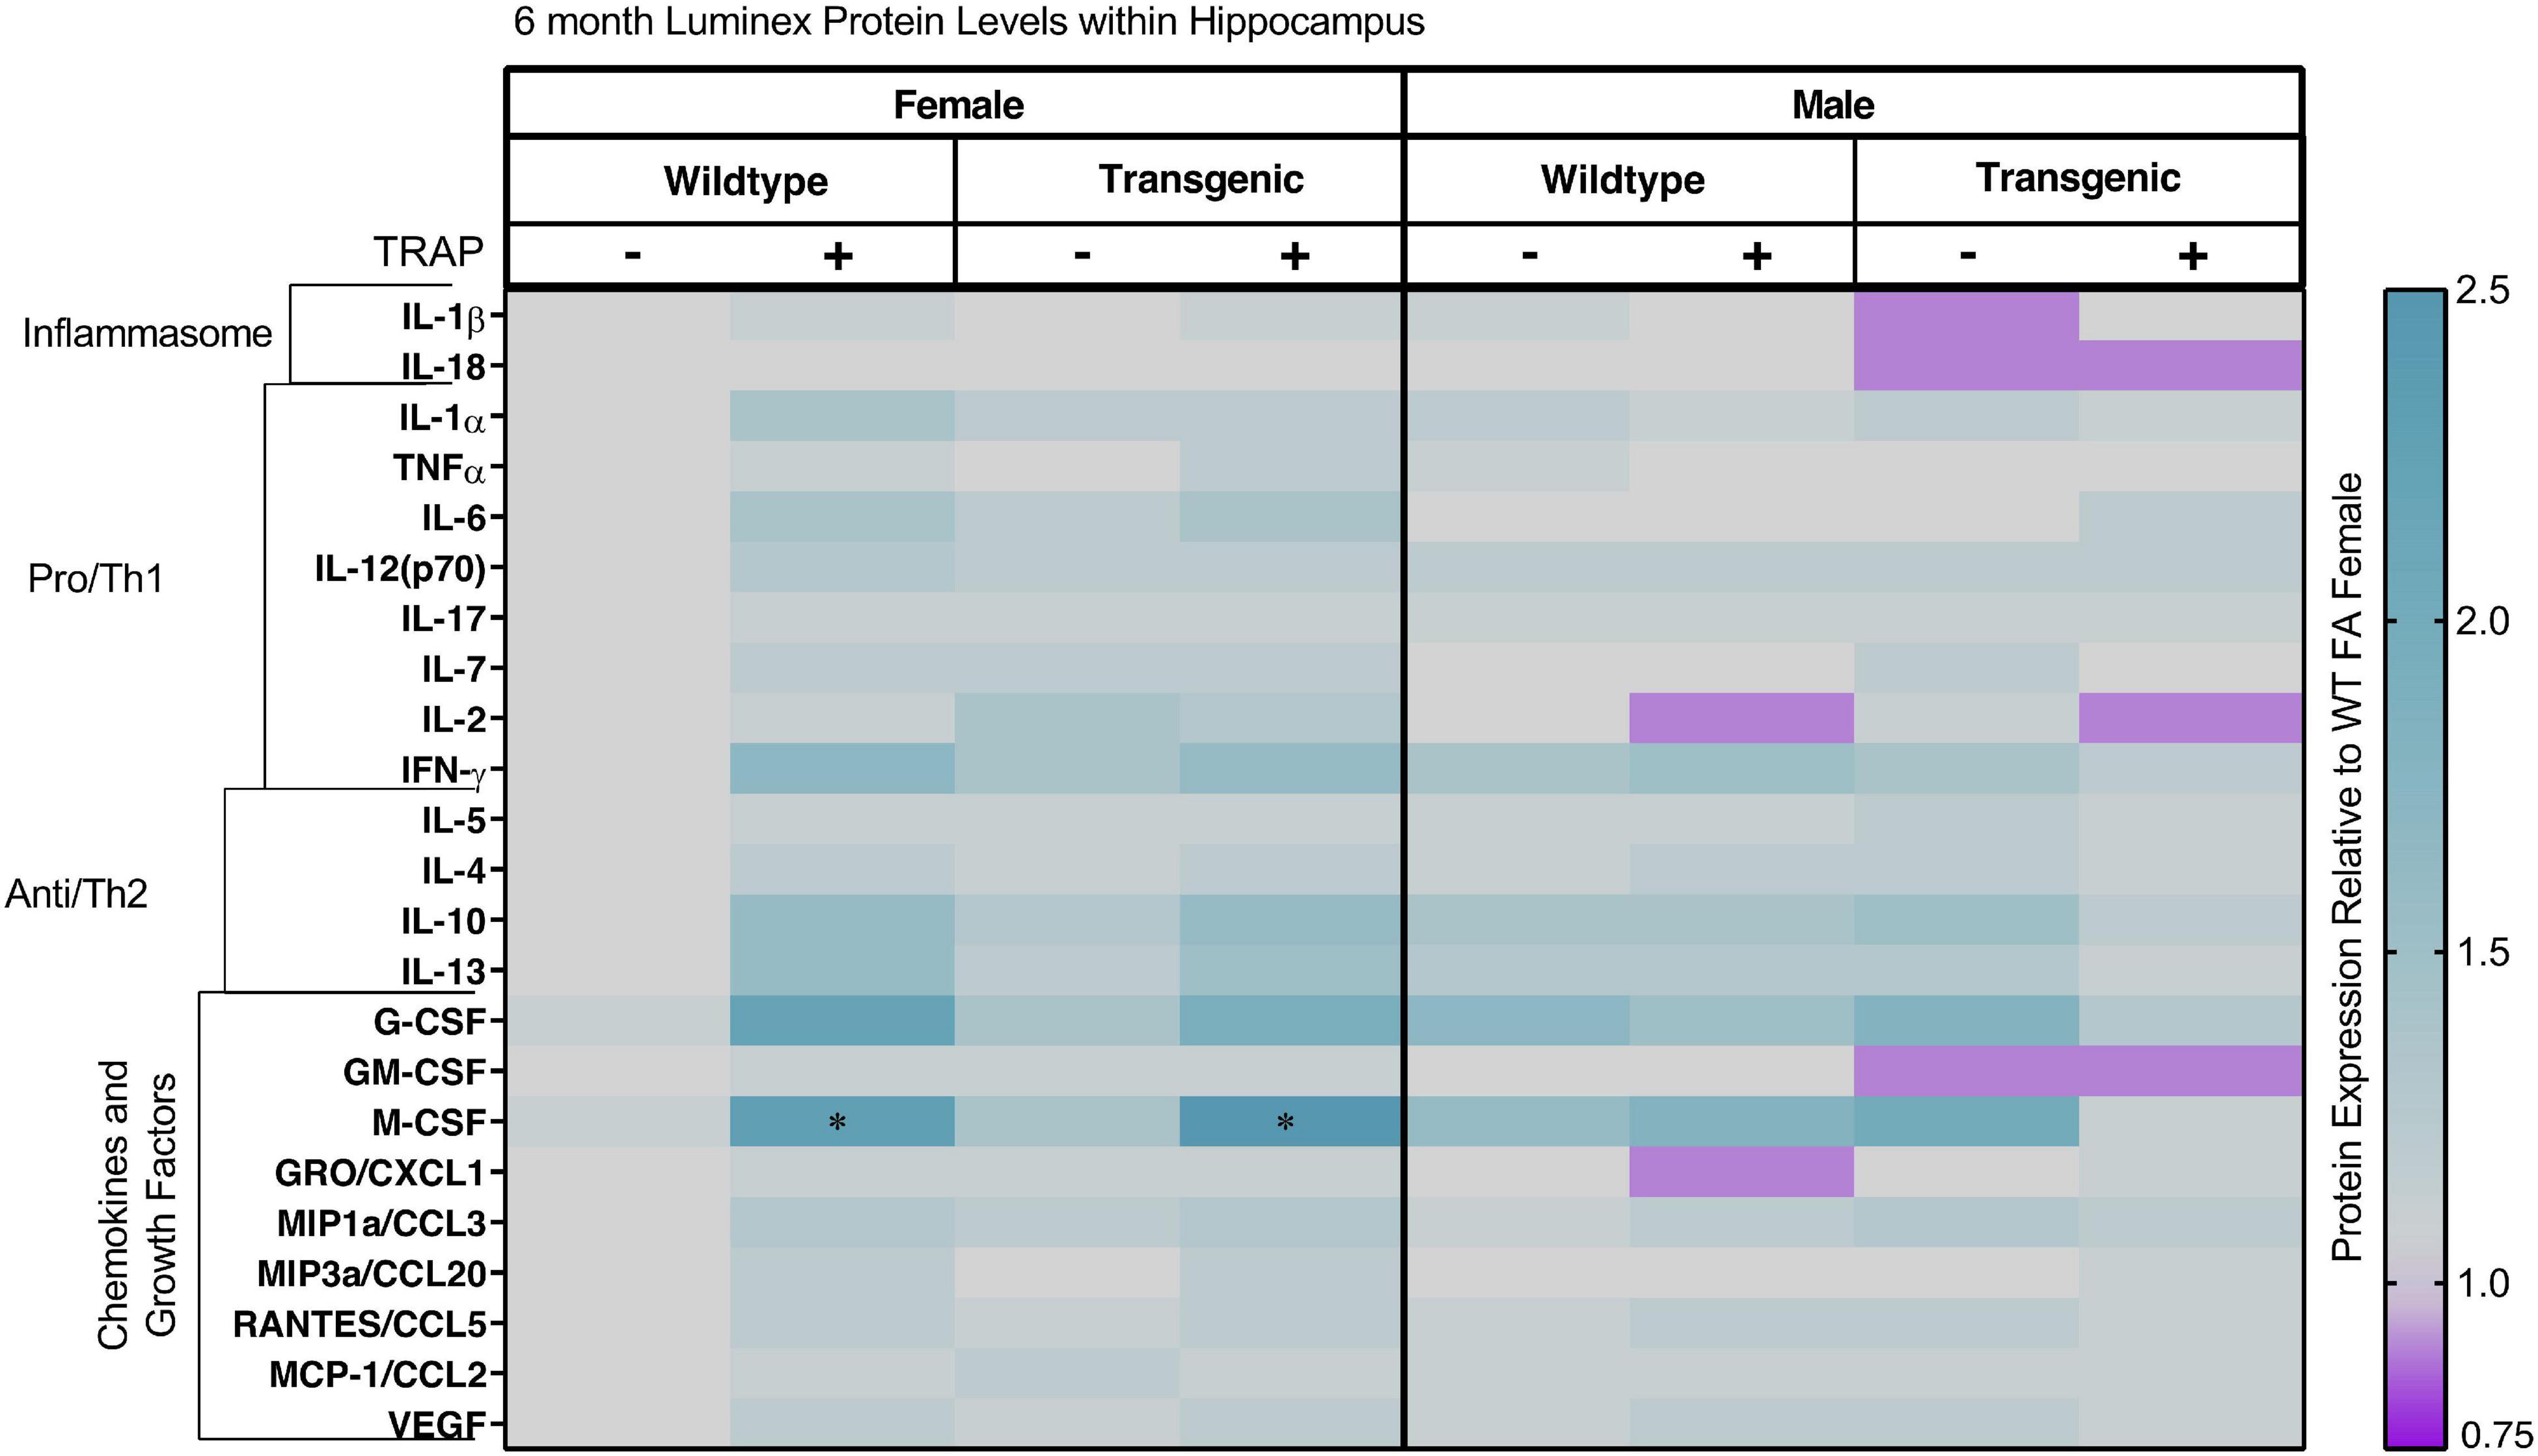
Figure 7. Heat map representation of hippocampal cytokine, chemokine, and growth factor changes in response to TRAP in 6-month old TgF344-AD and WT rats. Hippocampal levels of cytokines and growth factors in TgF344-AD and WT rats exposed to FA or TRAP for 5 months were analyzed using multiplex technology. For each analyte, individual values were normalized to the mean level of that same analyte in hippocampal tissue from female FA WT animals. Purple indicates normalized protein levels < 1.0; turquoise indicates normalized protein levels > 1.0. ± indicates exposure with + identifying TRAP-exposed animals; - indicating FA-exposed animals; n = 4–5 animals per group (duplicate samples were analyzed for each animal). *Significantly different from sex-matched WT FA control at p < 0.05 as determined by post hoc Sidak’s test. Non-normalized cytokine values for female WT animals are provided in Supplementary Table 2.
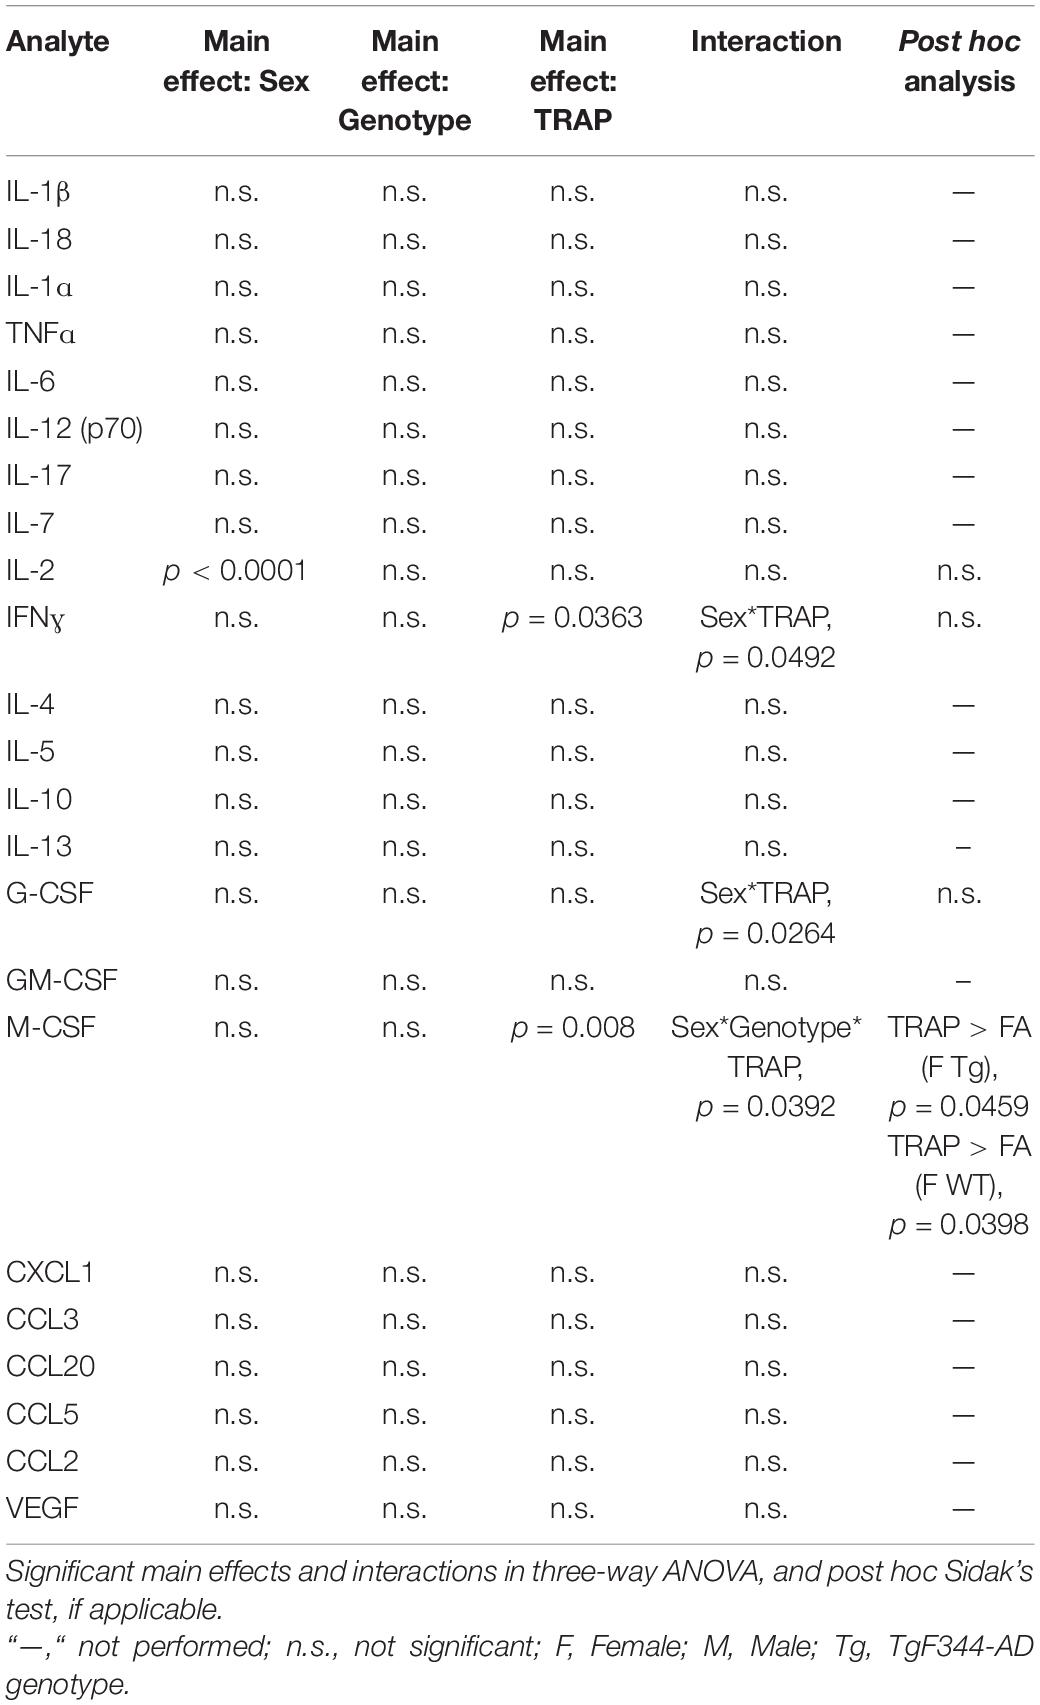
Table 2. Summary of statistical comparisons for levels of cytokines, chemokines, and growth factors in the hippocampus of 6-month-old TgF344-AD and WT rats exposed to TRAP or FA for 5 months.
In 10- and 15-month-old animals, sex, genotype and exposure had minimal effects on levels of cytokines, chemokines and growth factors (Figures 8, 9 and Tables 3, 4). In 10-month-old animals, TRAP exposure for 9 months increased levels of IL-1b compared to FA-exposed animals [F(1, 32) = 2.11, p = 0.0491]. However, there were no significant post hoc analyses and changes were restricted to a main effect. Similarly, we did not observe any clear effects of genotype or TRAP exposure on most analytes (Figure 9). The only significant effects was observed for M-CSF, where there was a significant interaction between TRAP and genotype [F(1, 32) = 13.482, p = 0.0233]. However, there were no significant post hoc analyses.
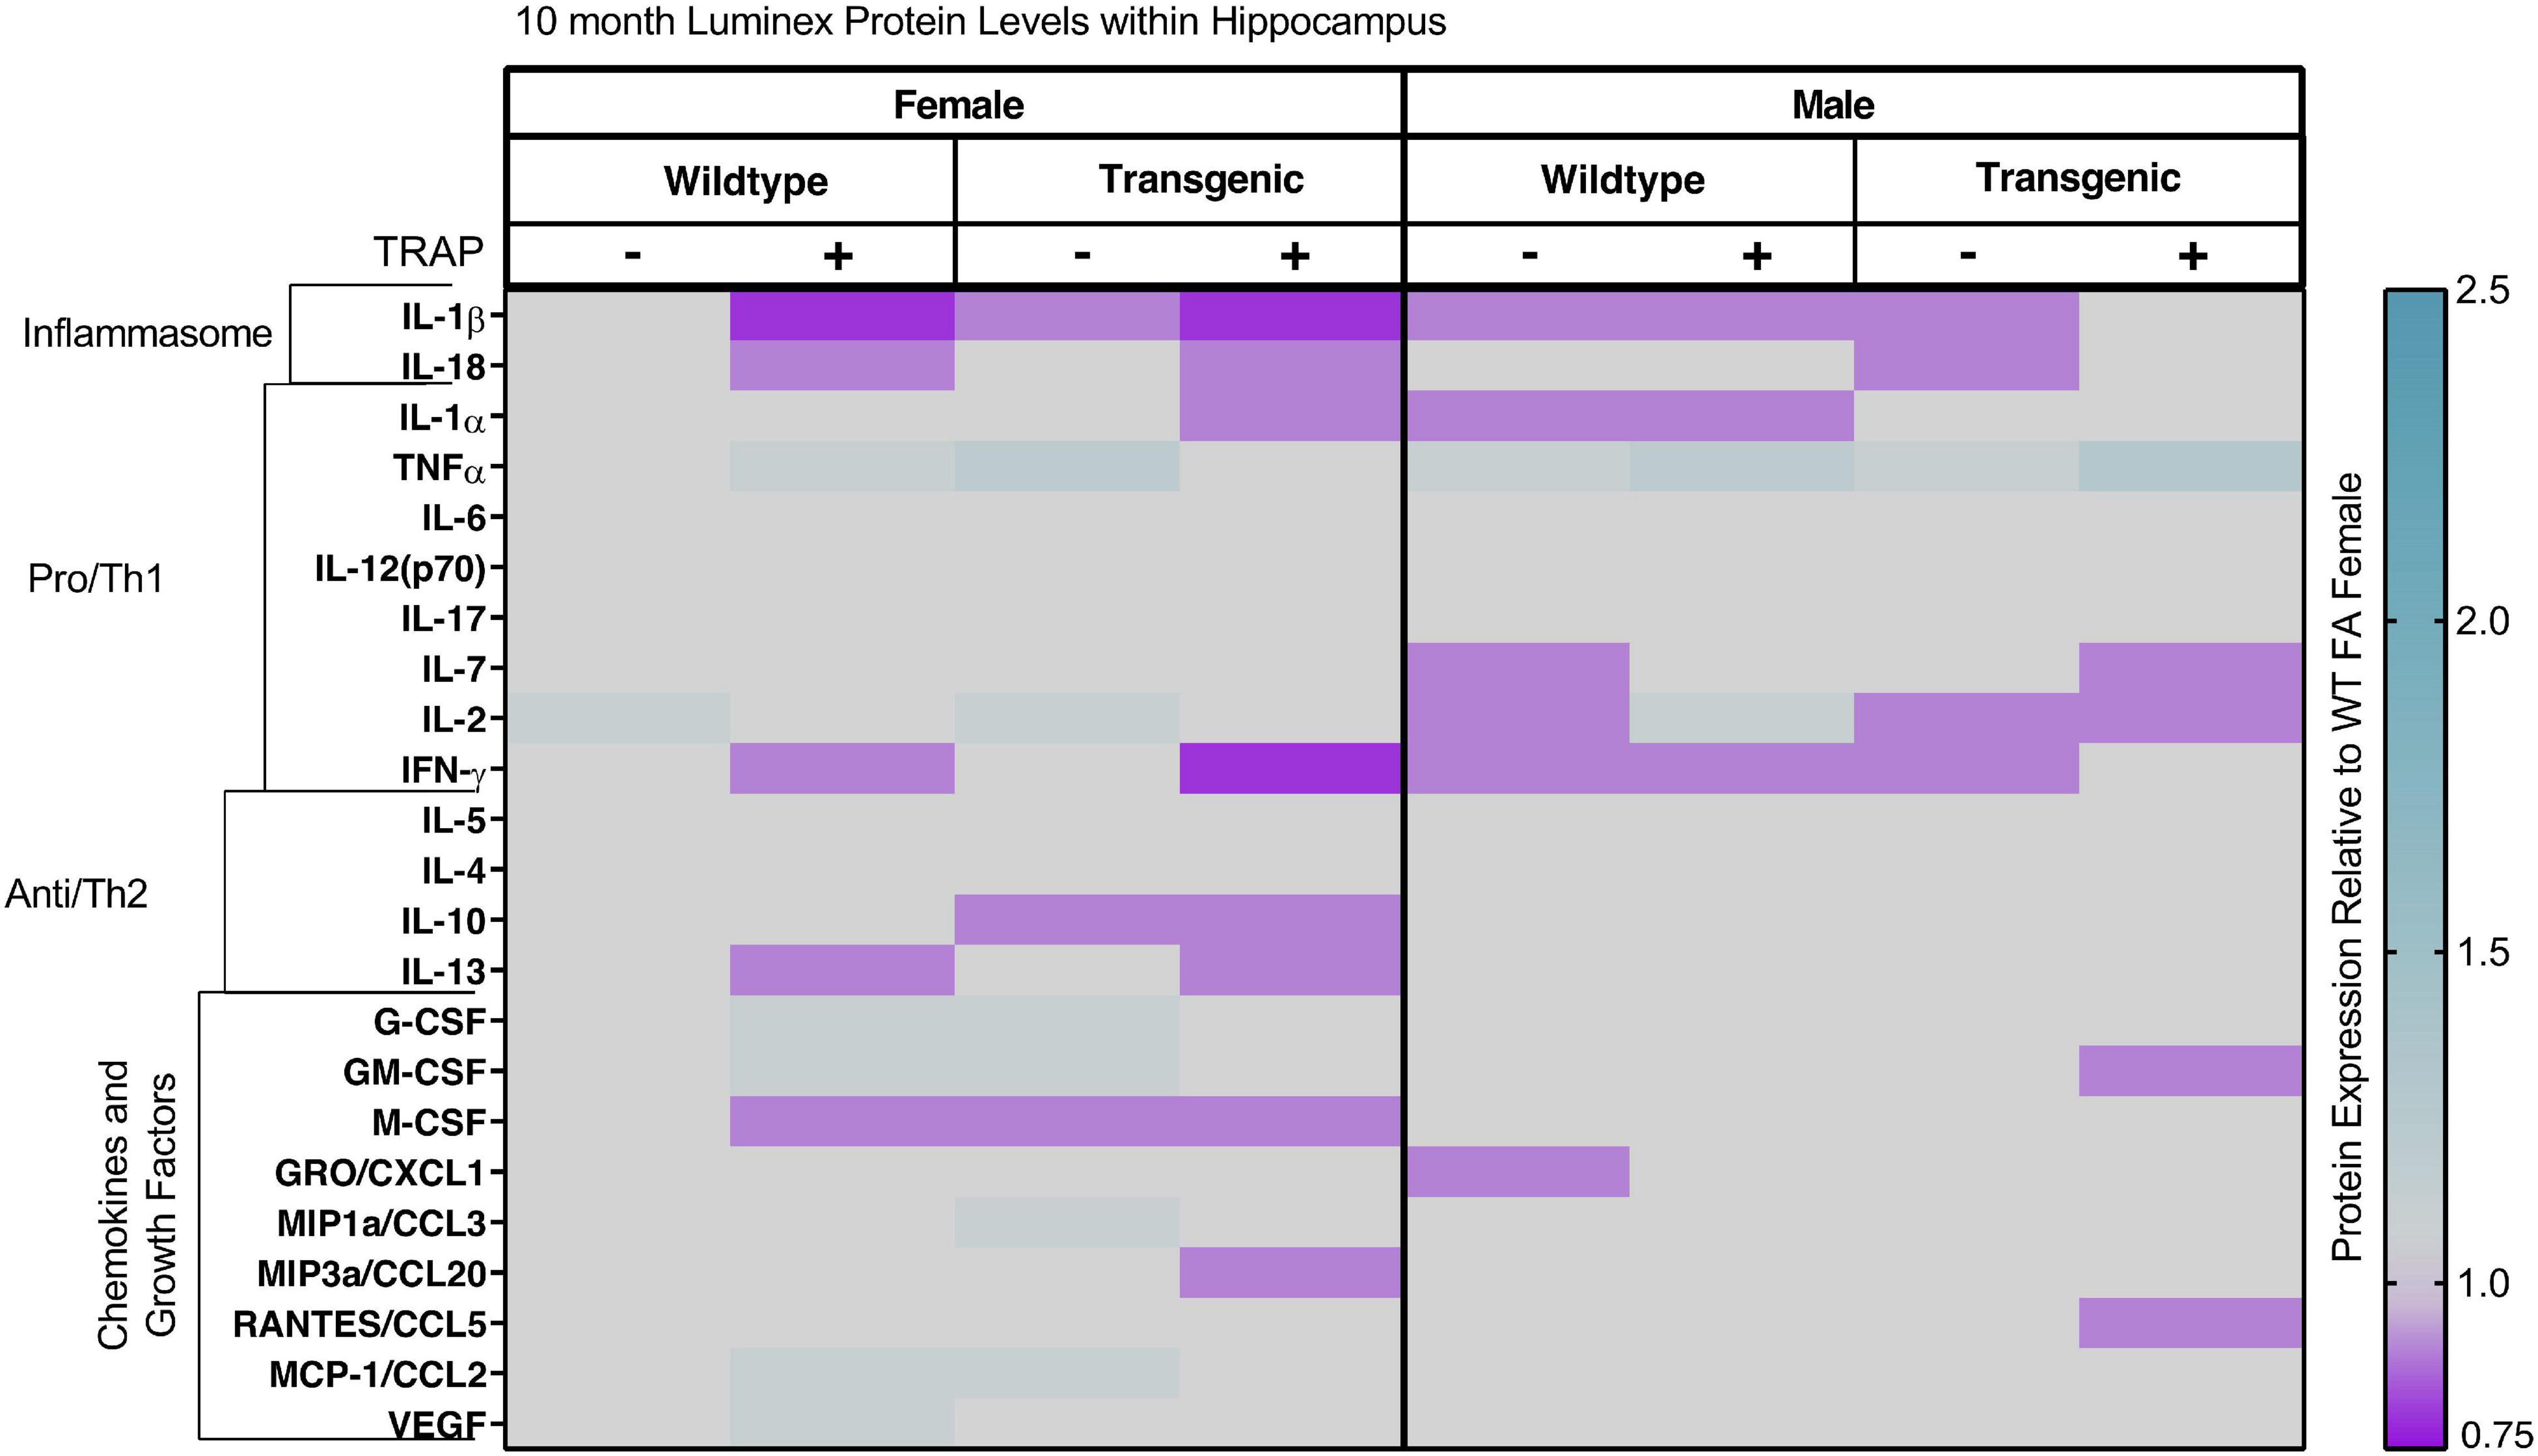
Figure 8. Heat map representation of hippocampal cytokine, chemokine, and growth factor changes in response to TRAP in 10-month old TgF344-AD and WT rats. Hippocampal levels of cytokines and growth factors in TgF344-AD and WT rats exposed to FA or TRAP for 9 months were analyzed using multiplex technology. For each analyte, individual values were normalized to the mean level of that same analyte in hippocampal tissue from female FA WT animals. Purple indicates normalized protein levels < 1.0; turquoise indicates normalized protein levels > 1.0. ± indicates exposure with + identifying TRAP-exposed animals; - indicating FA-exposed animals; n = 4–5 animals per group (duplicate samples were analyzed for each animal). Non-normalized cytokine values for female WT animals are provided in Supplementary Table 2.
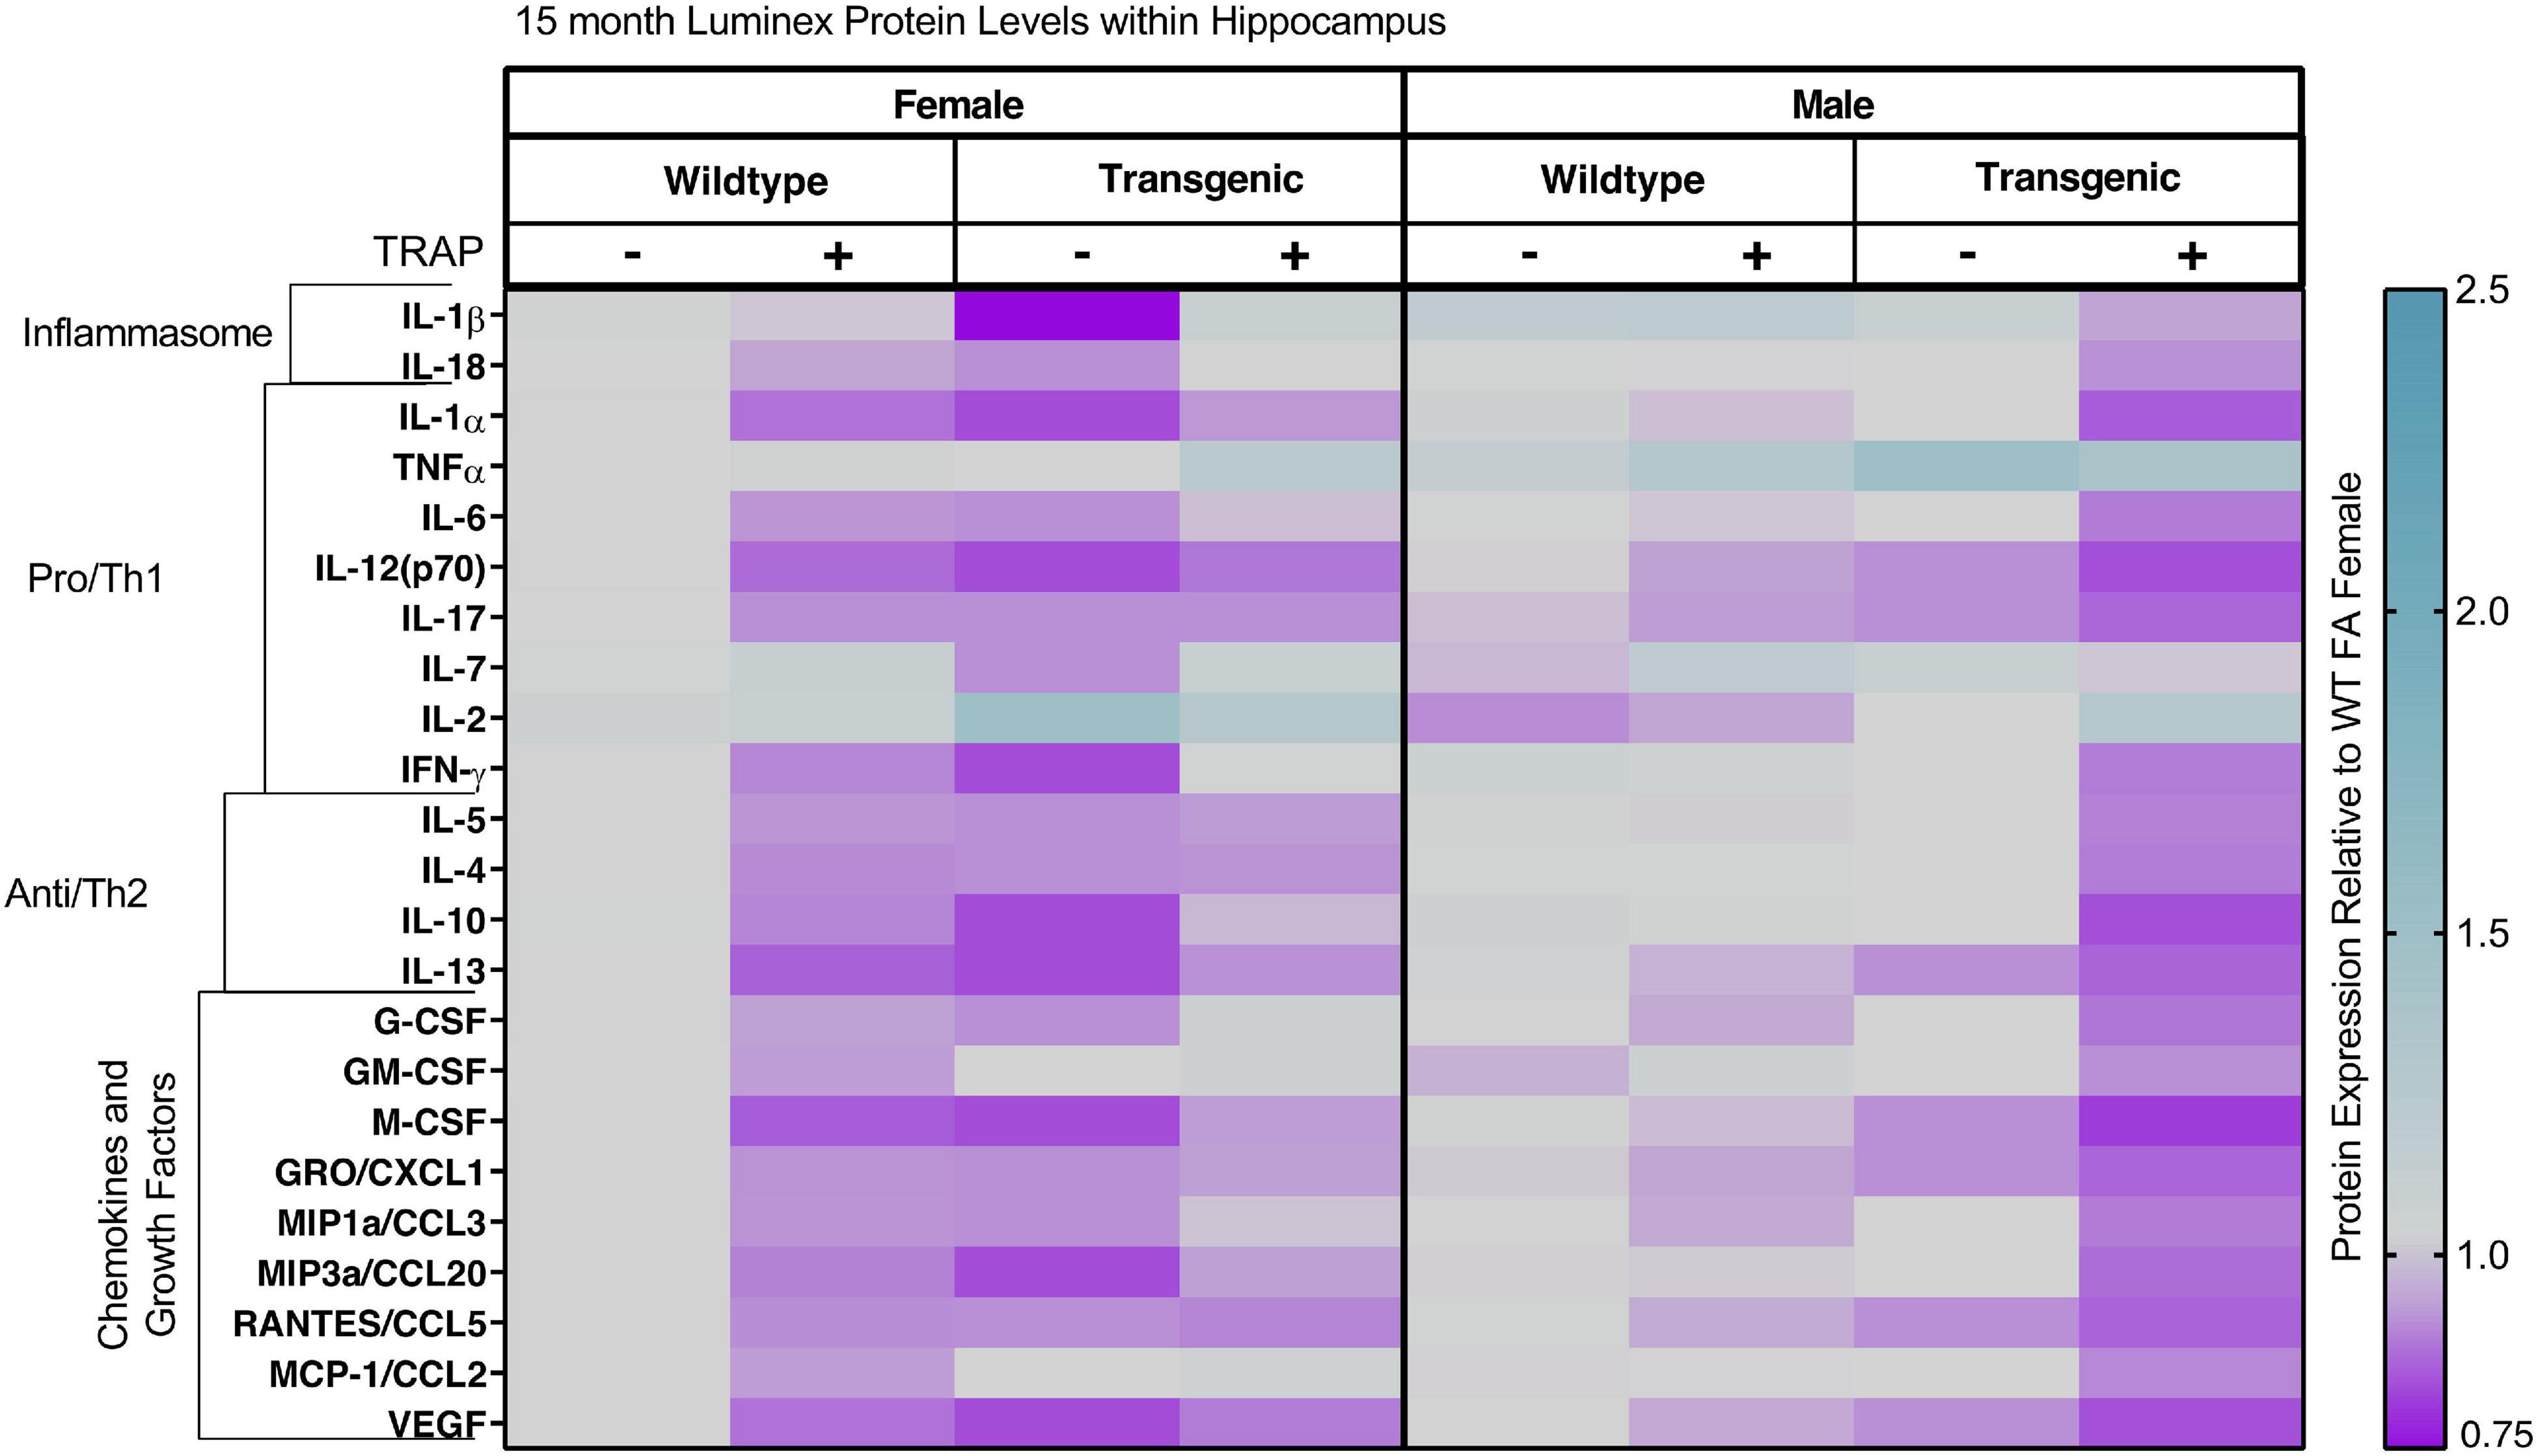
Figure 9. Heat map representation of hippocampal cytokine, chemokine, and growth factor changes in response to TRAP in 15-month old TgF344-AD and WT rats. Hippocampal levels of cytokines and growth factors in TgF344-AD and WT rats exposed to FA or TRAP for 14 months were analyzed using multiplex technology. For each analyte, individual values were normalized to the mean level of that same analyte in hippocampal tissue from female FA WT animals. Purple indicates normalized protein levels < 1.0; turquoise indicates normalized protein levels > 1.0. ± indicates exposure with + identifying TRAP-exposed animals; - indicating FA-exposed animals; n = 4–5 animals per group (duplicate samples were analyzed for each animal). Non-normalized cytokine values for female WT animals are provided in Supplementary Table 2.
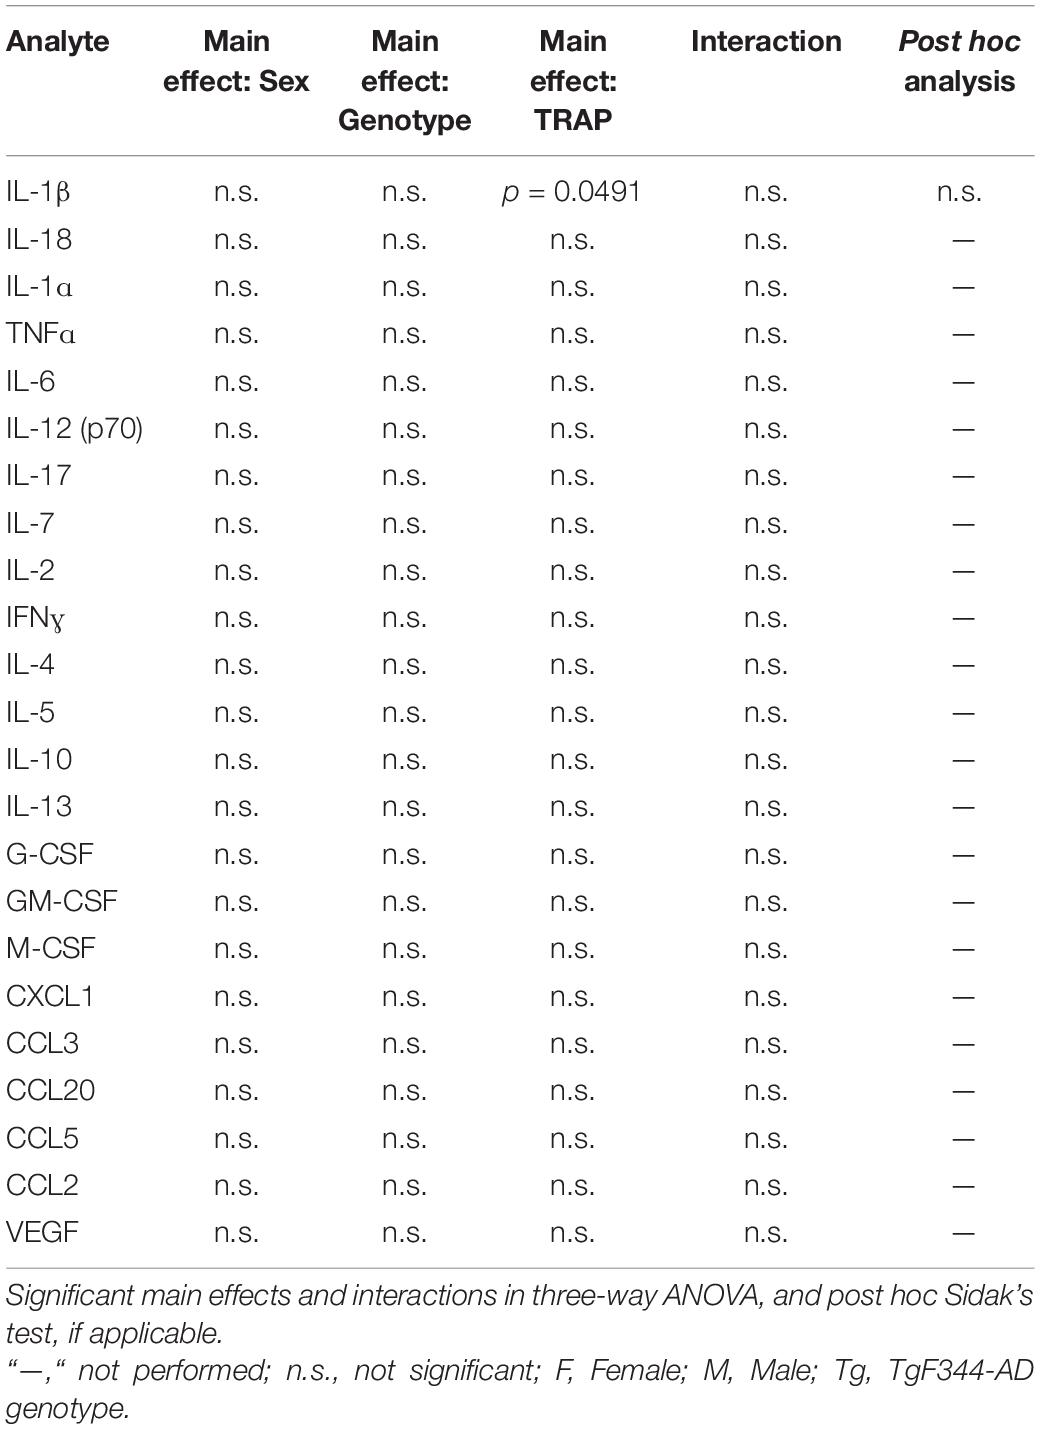
Table 3. Summary of statistical comparisons for levels of cytokines, chemokines, and growth factors in the hippocampus of 10-month-old TgF344-AD and WT rats exposed to TRAP or FA for 9 months.
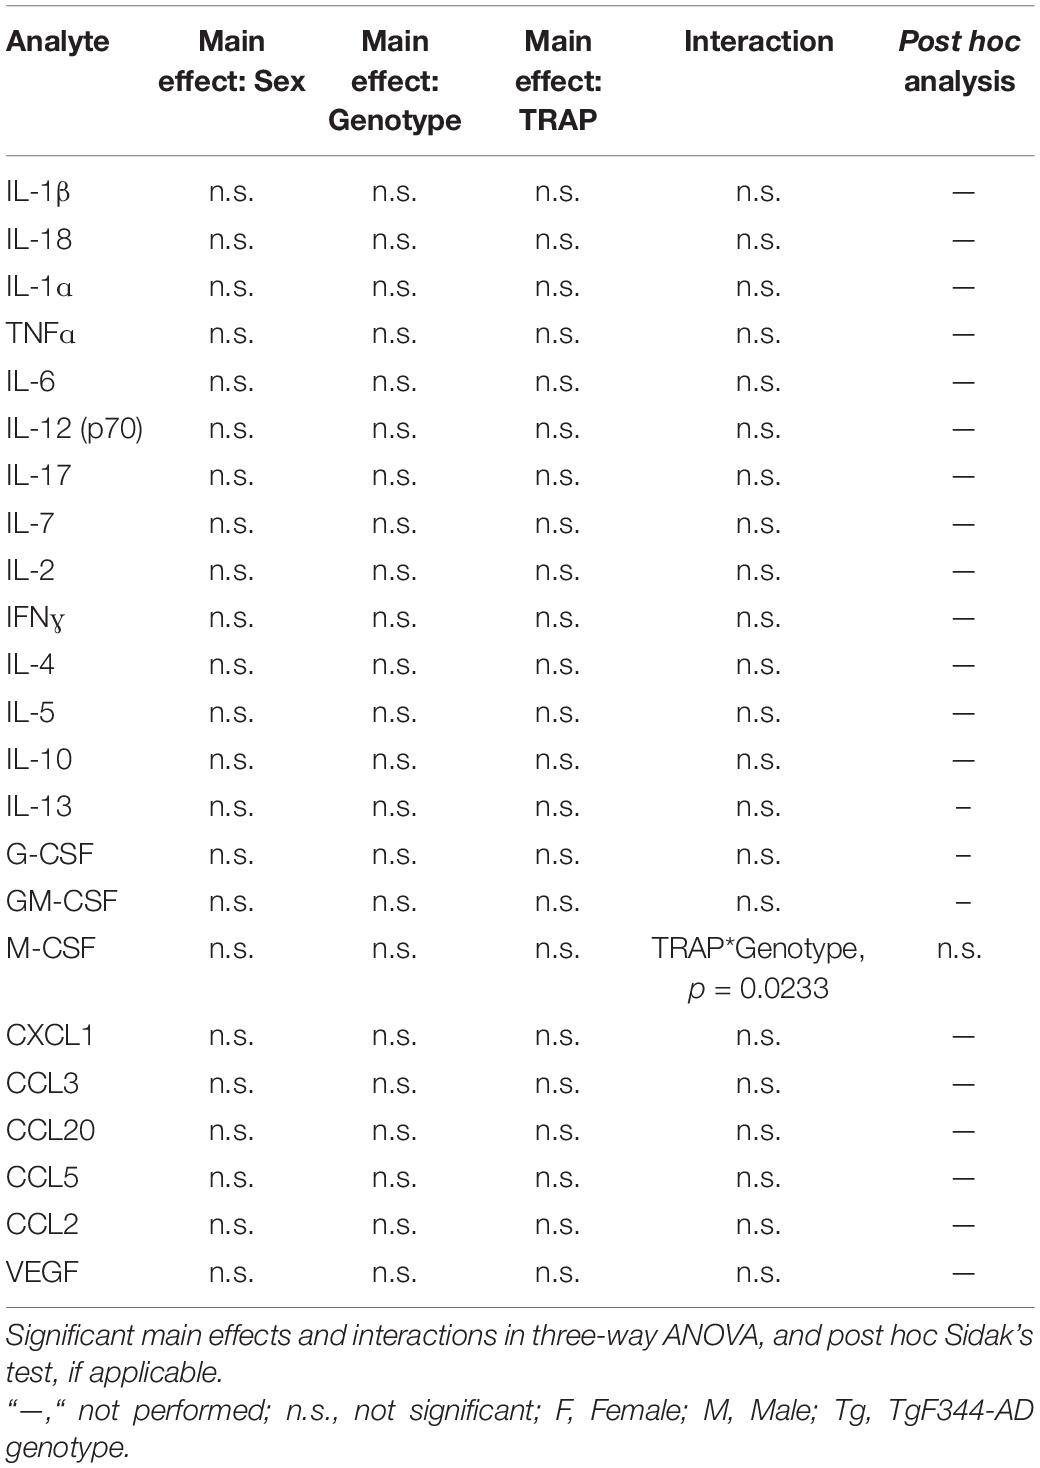
Table 4. Summary of statistical comparisons for levels of cytokines, chemokines, and growth factors in the hippocampus of 15-month-old TgF344-AD and WT rats exposed to TRAP or FA for 14 months.
In this study, we assayed tissue previously collected from TgF344-AD and WT animals exposed to TRAP or FA (Patten et al., 2021) to determine the impacts of age, TRAP exposure, and AD genetic susceptibility on cytokine and chemokine profiles in the serum and hippocampus. We also asked whether these factors had similar effects on cytokine and chemokine expression in the serum and hippocampus. The primary findings were: (1) Both serum and hippocampal cytokines were strongly affected by age, but specific temporal expression patterns varied by analyte, and for each individual analyte, differed between serum and hippocampus. (2) TRAP and genotype had no significant effects on the expression of cytokines in the serum at any of the ages we examined. (3) For hippocampal cytokines, TRAP generally had a stronger effect than sex or genotype. (4) The effects of TRAP on hippocampal cytokines were predominantly seen at younger ages (3 and 6 months).
Age was the most significant factor influencing cytokine/chemokine/growth factor levels in both the hippocampus and serum. These age-specific differences highlight the complexity of cytokine responses in TgF344-AD and WT rats over time and emphasize the need to exercise caution when interpreting the significance of cytokine changes for a single time-point in preclinical AD studies. Our observation that temporal expression patterns of serum and hippocampal cytokines did not mirror one another suggests that in this model, serum does not correspond with changes in CNS cytokine levels. This observation is not without precedent: peripheral immune challenges have been shown to stimulate pronounced inflammatory responses, including altered cytokine levels, that vary significantly between the serum and brain in aged mice (Barrientos et al., 2009) and juvenile rats (Bruce et al., 2019). These data suggest that serum cytokine profiles will not be a useful proxy or biomarker of brain cytokine levels.
Immune dysregulation is a well-characterized feature of aging (Rea et al., 2018), and historically has been associated with increased levels of pro-inflammatory cytokines, and decreased levels of anti-inflammatory cytokines (Michaud et al., 2013b; Charlton et al., 2018). Thus, it was somewhat unexpected that we did not observe significantly increased levels of pro-inflammatory cytokines with increasing age in either the hippocampus or the serum of TgF344-AD or WT rats. This is particularly surprising in the hippocampus, as many rodent studies have reported increased levels of pro-inflammatory cytokines in aged animals compared to young animals (Lynch, 2010; Barrientos et al., 2015). In humans, there are few postmortem studies comparing cytokine levels in the brain of healthy aged vs. young individuals, but cytokine measurements in CSF follow a trend similar to what is observed in rodent brain with aged individuals typically exhibiting higher and lower levels of pro- and anti-inflammatory cytokines, respectively, relative to younger controls (Hu et al., 2019). Human data of serum cytokine levels are similar, although several studies have reported no change in serum cytokines with age (Beharka et al., 2001), or have reported increases only in individuals > 65 years (Wyczalkowska-Tomasik et al., 2016). In our study, it is possible that these animals were not old enough to observe a significant increase in serum or hippocampal cytokine levels. Alternatively, it is possible that the immune changes in the brain are not mediated primarily by cytokines in rat models of aging.
AD has also been associated with increased levels of pro-inflammatory cytokines such as IL-1β, IL-6, and TNFɑ(Cacquevel et al., 2004). Elevated levels of these cytokines have been detected in postmortem brain from AD patients proximal to amyloid-β (Aβ) plaques (Zheng et al., 2016). We previously identified Aβ plaques and oligomers in TgF344-AD rats that increased with age, as well as significantly increased astrocyte reactivity and microglial activation in the hippocampus of TgF344-AD rats relative to age- and sex-matched WT littermates (Patten et al., 2021). Aβ plaques and oligomers are known to activate microglia to release cytokines, thus, it was surprising that we did not observe differences in hippocampal cytokines between WT and TgF344-AD animals at later ages, when TgF344-AD rats have numerous plaques. While cytokine and chemokine levels in the serum and hippocampus have not been previously evaluated in the TgF344-AD rat model, a recent study of cytokine expression in the brain stem of the TgF344-AD rat model is consistent with our findings. The authors reported no differences in brain stem levels of the cytokines IFN-γ, IL-1β, IL-4, IL-5, IL-10, IL-13, KC, and TNFɑbetween TgF344-AD and WT rats aged 8–11 months (Lucking et al., 2019). In contrast, the APP/PS1 mouse, which shares the same genetic mutations as the TgF344-AD rat, exhibited modest increases in TNFɑ, IL-1ɑ, and IL-1Rɑat 9 months compared to WT mice (Babcock et al., 2015). This may reflect species differences given emerging evidence that neuroinflammatory responses in the rat and mouse diverge significantly (Leist and Hartung, 2013; Seok et al., 2013; Zhang et al., 2016; Du et al., 2017; Kodamullil et al., 2017), with the rat more closely resembling the human neuroinflammatory response (Du et al., 2017).
Our findings are consistent with recent human studies that find inconsistent changes in cytokine levels in AD patients. A longitudinal study of patients with mild cognitive impairment (MCI) showed that serum levels of IFNγ, IL−1β, IL−2, IL−4, IL−6, and IL−10 decreased over time, and these decreases were highly correlated with decreased cognition (Thomas et al., 2020), and a study of post-mortem samples reported that relative to non-demented controls, AD brains and serum had decreased levels of IL-1b, IL-6, IL-7, IL-8, and IL-16 (Chen et al., 2016). Interestingly, a longitudinal study of patients with mild cognitive impairment (MCI) who progressively developed AD found that PET scans of neuroinflammation identified two peaks of neuroinflammation: one peak early in disease progression, and a second at a late stage (Fan et al., 2017). Specifically, in comparison to normal controls, patients with MCI initially had increased levels of neuroinflammation; however, this was followed by a period of decreased neuroinflammation that persisted for 14 months. Long-term, patients who developed AD showed a second increase in neuroinflammation (Fan et al., 2017). Although cytokines were not measured in this study, it is possible that a similar alternating pattern of cytokine expression may occur. It will be important in future work to determine whether hippocampal cytokines, particularly pro-inflammatory cytokines, increase significantly in animals older than 15 months and whether this is enhanced in animals with advanced AD pathology.
TRAP exposure had no effect on serum cytokine levels, but did significantly increase levels of a subset of cytokines in the hippocampus of 3- and 6-month-old animals. Specifically, at 3 months TRAP significantly increased levels of IL-1β in the hippocampus of female TgF344-AD and WT rats. IL-1β is a potent activator of astrocytes and microglia in the CNS (Mrak and Griffin, 2001; Veryard et al., 2012; Scarabino et al., 2020). While IL-1β is expressed at low levels in the healthy CNS, it can be rapidly induced in response to injury (Liu and Quan, 2018). In AD, the IL-1 family has been of interest due to its close association with neuroinflammation (Shaftel et al., 2008; Italiani et al., 2018; Liu and Quan, 2018), the presence of genetic mutations in IL-1 that link to AD (Licastro et al., 2004; Rainero et al., 2004), and the presence of IL-1 cytokines in AD brains (Swanson et al., 2018). More recently, work has implicated IL-1β very early in AD pathology through its role in the inflammasome (Heneka, 2017). Inflammasomes are innate immune system sensors that are activated in response to damage or danger signals (Heneka, 2017; Venegas and Heneka, 2017), and one hallmark of this is IL-1β and IL-18 release (van de Veerdonk et al., 2011). In AD, inflammasome activation has been shown to seed Aβ plaques and contribute to Aβ plaque pathology (Heneka, 2017; Venegas et al., 2017; Tejera et al., 2019). We previously showed that TRAP promoted Aβ deposition in the hippocampus of 3-month old TgF344-AD females, in contrast to 3 month-old TgF344-AD rats exposed to FA or age-matched TgF344-AD males exposed to either TRAP or FA that showed no Aβ deposition (Patten et al., 2021). The observation of increased IL-1β in the brains of these same animals suggests that TRAP promotes AD phenotypes via activation of the inflammasome, a hypothesis that will need to be confirmed in future work.
Although we observed that TRAP increased hippocampal levels of IL-1β in females and TNFβ in males at 3 months, by 6 months these effects had disappeared, and we instead found that TRAP significantly increased hippocampal levels of M-CSF in WT and TgF344-AD females. M-CSF is a hematopoietic growth factor that increases proliferation and phagocytosis of microglia in the CNS (Mitrasinovic et al., 2003; Pons et al., 2020). Its expression in the brain has also been shown to promote recruitment of peripheral monocytes and macrophages into the CNS (Mitrasinovic et al., 2005; Boissonneault and Rivest, 2009; Lampron et al., 2013; Daria et al., 2017; Pons et al., 2020). As IL-1β was elevated in the hippocampus of female TRAP-exposed rats at 3 months of age, coincident with increased AD pathology (Patten et al., 2021), one possibility is that an increase in M-CSF indicates a response of the immune system to AD pathology and inflammation (Elmore et al., 2014; Dagher et al., 2015; Sasaki, 2016; Unger et al., 2018). We did not observe this effect in TRAP-exposed male animals of either genotype, highlighting sex-specific responses to TRAP independent of genotype. Additionally, sex-specific differences included a significant effect of sex on hippocampal IL-2 levels at 6 months, with males exhibiting lower levels. IL-2 is typically produced by T cells, but in the brain can also be expressed by hippocampal neurons (Meola et al., 2013). Although its role in the context of AD is not clear, decreased levels of IL-2 in the hippocampus have been associated with exacerbated AD pathology in mice (Alves et al., 2017), and treatment of AD mice with exogenous IL-2 significantly reduced AD pathology via increased regulatory T cell activity (Dansokho et al., 2016; Alves et al., 2017). Although both species and sex used in these studies differed from our own, collectively our data support further investigation into the role of IL-2 in exacerbating AD pathology. At 10 and 15 months, we observed minimal effects of TRAP on hippocampal cytokines. At 10 months, IL-1β in the hippocampus was decreased in response to TRAP; at 15 months, we observed a significant interaction between TRAP and genotype, but post hoc analyses did not identify any significant differences between groups. Overall, our cytokine data are supported by our previous studies showing that TRAP activated microglia most robustly in 3- and 6-month-old animals (Patten et al., 2021). Although we did not determine the source of IL-1β in this study, IBA1 + microglia are thought to be the most significant producers of IL-1β in the CNS (Griffin and Barger, 2010; Italiani et al., 2018), and are a major source of many other cytokines.
In summary, this study revealed a strong effect of age on both hippocampal and serum cytokines, but indicated these effects were non-linear. However, a caveat to this conclusion is that multiple factors can influence cytokines, including differences in season. Because of the long exposure time (14 months), animals at different ages were exposed to different seasonal effects. Seasonal effects are known to affect cytokine levels, and are linked to changes in diseases such as multiple sclerosis (Ter Horst et al., 2016). In addition, a previous study of cardiovascular disease patients found that cytokine levels are much lower in the spring (Spath et al., 2017). In this study, animals aged 6 months were euthanized in the spring, and in our analyses, we found that many cytokines showed strikingly different values at 6 months, compared with other ages, although it is noted that cytokines were not universally decreased at 6 months, and indeed, hippocampal IL-1β levels were significantly increased at this age relative to earlier and later ages. Therefore, while it is tempting to ascribe purely age-dependent changes to serum and hippocampal cytokines, future work is necessary to determine whether these results were confounded by season. Second, we showed that serum cytokine patterns did not mirror hippocampal cytokines, suggesting that serum cytokines may have limited prognostic value in assessing CNS inflammation. While CSF cytokine profiles are often highly correlated with levels in brain tissue (Mitrasinovic et al., 2003; Choi et al., 2008; Olson and Humpel, 2010), obtaining CSF requires a lumbar puncture and therefore is not routinely evaluated in AD patients, and it is difficult to obtain sufficient quantities for analysis from rodents. Thus, CSF cytokine levels would be challenging as a routine biomarker. Third, within each age group, TRAP exposure had a stronger effect on cytokines than either genotype or sex. The most significant TRAP-induced cytokine changes occurred in 3- and 6-month-old animals, suggesting the possibility of early inflammatory changes as a key factor mediating TRAP effects on AD.
The raw data supporting the conclusions of this article will be made available by the authors, without undue reservation.
The animal study was reviewed and approved by the University of California, Davis Institutional Animal Care and Use Committee.
PL, KB, and AW obtained funding to support the work and supervised all aspects of the study. KB, CW, and AW constructed the tunnel vivarium and exposure chambers. AV maintained the rat colony. AV, KP, CW, and KB maintained the animals at the tunnel facility. KP and PL designed the experiments. AV and KP collected tissues for analysis. KP conducted the cytokine analyses, immunohistochemistry, image acquisition and image analysis, and drafted the initial manuscript, including the figures. DH conducted the statistical analyses of the data. FG and PL made significant edits to the early versions of the manuscript. All authors reviewed and made final edits to the manuscript prior to submission.
This work was funded by the National Institutes of Health (R21 ES026515, R21 ES025570, P30 ES023513, and P30 AG010129). KP was supported by the NIH-funded predoctoral training programs awarded to the University of California, Davis (T32 MH112507 and T32 ES007059). This project used core facilities supported by the UC Davis MIND Institute Intellectual and Developmental Disabilities Research Center (P50 HD103526). The contents of this work do not necessarily represent the official views of the NIH, and the NIH does not endorse the purchase of any commercial products or services mentioned in this publication.
The authors declare that the research was conducted in the absence of any commercial or financial relationships that could be construed as a potential conflict of interest.
All claims expressed in this article are solely those of the authors and do not necessarily represent those of their affiliated organizations, or those of the publisher, the editors and the reviewers. Any product that may be evaluated in this article, or claim that may be made by its manufacturer, is not guaranteed or endorsed by the publisher.
The Supplementary Material for this article can be found online at: https://www.frontiersin.org/articles/10.3389/fncel.2022.861733/full#supplementary-material
Aβ, amyloid-β; CSF, cerebrospinal fluid; FA, filtered air; G-CSF, granulocyte colony-stimulating factor; GM-CSF, granulocyte-macrophage colony-stimulating factor; GROɑ/CXCL-1/KC, growth-regulated protein alpha/C-X-C motif ligand 1/keratinocyte chemoattractant; IL, interleukin; IFN, interferon; M-CSF, macrophage colony-stimulating factor; MCP-1/CCL2, monocyte chemoattractant protein 1/C-C motif ligand 2; MIP-1ɑ, macrophage inflammatory protein-1 alpha; PBS, phosphate buffered saline; RANTES, regulated upon activation, normal T cells, expressed and secreted; TGF-β, transforming-growth factor beta; TNF, tumor necrosis factor; TRAP, traffic-related air pollution; VEGF, vascular endothelial growth factor; WT, wildtype.
Alves, S., Churlaud, G., Audrain, M., Michaelsen-Preusse, K., Fol, R., Souchet, B., et al. (2017). Interleukin-2 improves amyloid pathology, synaptic failure and memory in Alzheimer’s disease mice. Brain 140, 826–842. doi: 10.1093/brain/aww330
Angelopoulos, P., Agouridaki, H., Vaiopoulos, H., Siskou, E., Doutsou, K., Costa, V., et al. (2008). Cytokines in Alzheimer’s disease and vascular dementia. Int. J. Neurosci. 118, 1659–1672. doi: 10.1080/00207450701392068
Babcock, A. A., Ilkjaer, L., Clausen, B. H., Villadsen, B., Dissing-Olesen, L., Bendixen, A. T., et al. (2015). Cytokine-producing microglia have an altered beta-amyloid load in aged APP/PS1 Tg mice. Brain Behav. Immun. 48, 86–101.
Barrientos, R. M., Frank, M. G., Hein, A. M., Higgins, E. A., Watkins, L. R., Rudy, J. W., et al. (2009). Time course of hippocampal IL-1 beta and memory consolidation impairments in aging rats following peripheral infection. Brain Behav. Immun. 23, 46–54. doi: 10.1016/j.bbi.2008.07.002
Barrientos, R. M., Kitt, M. M., Watkins, L. R., and Maier, S. F. (2015). Neuroinflammation in the normal aging hippocampus. Neuroscience 309, 84–99. doi: 10.1016/j.neuroscience.2015.03.007
Beharka, A. A., Meydani, M., Wu, D., Leka, L. S., Meydani, A., and Meydani, S. N. (2001). Interleukin-6 Production Does Not Increase With Age. J. Gerontol. 56, B81–B88. doi: 10.1093/gerona/56.2.B81
Boissonneault, V., and Rivest, S. (2009). [The hematopoietic cytokine M-CSF as a cure for Alzheimer’s disease]. Med. Sci. (Paris) 25, 666–668.
Bruce, M., Streifel, K. M., Boosalis, C. A., Heuer, L., Gonzalez, E. A., Li, S., et al. (2019). Acute peripheral immune activation alters cytokine expression and glial activation in the early postnatal rat brain. J. Neuroinflammation 16:200. doi: 10.1186/s12974-019-1569-2
Cacciottolo, M., Wang, X., Driscoll, I., Woodward, N., Saffari, A., Reyes, J., et al. (2017). Particulate air pollutants, APOE alleles and their contributions to cognitive impairment in older women and to amyloidogenesis in experimental models. Transl. Psychiatry 7:e1022. doi: 10.1038/tp.2016.280
Cacquevel, M., Lebeurrier, N., Cheenne, S., and Vivien, D. (2004). Cytokines in neuroinflammation and Alzheimer’s disease. Curr. Drug Targets 5, 529–534. doi: 10.2174/1389450043345308
Calderon-Garciduenas, L., Leray, E., Heydarpour, P., Torres-Jardon, R., and Reis, J. (2016). Air pollution, a rising environmental risk factor for cognition, neuroinflammation and neurodegeneration: the clinical impact on children and beyond. Rev. Neurol. (Paris) 172, 69–80. doi: 10.1016/j.neurol.2015.10.008
Cao, W., and Zheng, H. (2018). Peripheral immune system in aging and Alzheimer’s disease. Mol. Neurodegen. 13:51. doi: 10.1186/s13024-018-0284-2
Charlton, R. A., Lamar, M., Zhang, A., Ren, X., Ajilore, O., Pandey, G. N., et al. (2018). Associations between pro-inflammatory cytokines, learning, and memory in late-life depression and healthy aging. Int. J. Geriatr. Psychiatry 33, 104–112. doi: 10.1002/gps.4686
Chen, A., Oakley, A. E., Monteiro, M., Tuomela, K., Allan, L. M., Mukaetova-Ladinska, E. B., et al. (2016). Multiplex analyte assays to characterize different dementias: brain inflammatory cytokines in poststroke and other dementias. Neurobiol. Aging 38, 56–67. doi: 10.1016/j.neurobiolaging.2015.10.021
Choi, C., Jeong, J. H., Jang, J. S., Choi, K., Lee, J., Kwon, J., et al. (2008). Multiplex analysis of cytokines in the serum and cerebrospinal fluid of patients with Alzheimer’s disease by color-coded bead technology. J. Clin. Neurol. 4, 84–88. doi: 10.3988/jcn.2008.4.2.84
Cohen, R. M., Rezai-Zadeh, K., Weitz, T. M., Rentsendorj, A., Gate, D., Spivak, I., et al. (2013). A transgenic Alzheimer rat with plaques, tau pathology, behavioral impairment, oligomeric abeta, and frank neuronal loss. J. Neurosci. 33, 6245–6256. doi: 10.1523/JNEUROSCI.3672-12.2013
Dagher, N. N., Najafi, A. R., Kayala, K. M. N., Elmore, M. R. P., White, T. E., Medeiros, R., et al. (2015). Colony-stimulating factor 1 receptor inhibition prevents microglial plaque association and improves cognition in 3xTg-AD mice. J. Neuroinflammation 12:139. doi: 10.1186/s12974-015-0366-9
Dansokho, C., Ait Ahmed, D., Aid, S., Toly-Ndour, C., Chaigneau, T., Calle, V., et al. (2016). “Regulatory T cells delay disease progression in Alzheimer-like pathology.”Brain 139, 1237–1251. doi: 10.1093/brain/awv408
Daria, A., Colombo, A., Llovera, G., Hampel, H., Willem, M., Liesz, A., et al. (2017). Young microglia restore amyloid plaque clearance of aged microglia. EMBO J. 36, 583–603. doi: 10.15252/embj.201694591
Du, Y., Deng, W., Wang, Z., Ning, M., Zhang, W., Zhou, Y., et al. (2017). Differential subnetwork of chemokines/cytokines in human, mouse, and rat brain cells after oxygen-glucose deprivation. J. Cereb. Blood Flow Metab. 37, 1425–1434. doi: 10.1177/0271678X16656199
Edwards, S., Zhao, G., Tran, J., Patten, K. T., Valenzuela, A., Wallis, C., et al. (2020). Pathological cardiopulmonary evaluation of rats chronically exposed to traffic-related air pollution. Environ. Health Perspect 128:127003. doi: 10.1289/ehp7045
Efthymiou, A. G., and Goate, A. M. (2017). Late onset Alzheimer’s disease genetics implicates microglial pathways in disease risk. Mol. Neurodegen. 12:43. doi: 10.1186/s13024-017-0184-x
Eid, A., Mhatre, I., and Richardson, J. R. (2019). Gene-environment interactions in Alzheimer’s disease: a potential path to precision medicine. Pharmacol. Ther. 199, 173–187. doi: 10.1016/j.pharmthera.2019.03.005
Elmore, M. R., Najafi, A. R., Koike, M. A., Dagher, N. N., Spangenberg, E. E., Rice, R. A., et al. (2014). Colony-stimulating factor 1 receptor signaling is necessary for microglia viability, unmasking a microglia progenitor cell in the adult brain. Neuron 82, 380–397. doi: 10.1016/j.neuron.2014.02.040
Fan, Z., Brooks, D. J., Okello, A., and Edison, P. (2017). An early and late peak in microglial activation in Alzheimer’s disease trajectory. Brain 140, 792–803. doi: 10.1093/brain/aww349
Forabosco, P., Ramasamy, A., Trabzuni, D., Walker, R., Smith, C., Bras, J., et al. (2013). Insights into TREM2 biology by network analysis of human brain gene expression data. Neurobiol. Aging 34, 2699–2714. doi: 10.1016/j.neurobiolaging.2013.05.001
Fu, P., and Yung, K. K. L. (2020). Air pollution and Alzheimer’s disease: a systematic review and meta-analysis. J. Alzheimers Dis. 77, 701–714. doi: 10.3233/JAD-200483
Gadani, S. P., Cronk, J. C., Norris, G. T., and Kipnis, J. (2012). IL-4 in the brain: a cytokine to remember. J. Immunol. 189, 4213–4219. doi: 10.4049/jimmunol.1202246
Griffin, W. S., and Barger, S. W. (2010). Neuroinflammatory cytokines-the common thread in Alzheimer’s pathogenesis. US Neurol 6, 19–27. doi: 10.17925/usn.2010.06.02.19
Guerreiro, R., Wojtas, A., Bras, J., Carrasquillo, M., Rogaeva, E., Majounie, E., et al. (2013). TREM2 variants in Alzheimer’s disease. N Engl J Med 368, 117–127. doi: 10.1056/NEJMoa1211851
Guerreiro, R. J., Santana, I., Brás, J. M., Santiago, B., Paiva, A., and Oliveira, C. (2007). Peripheral inflammatory cytokines as biomarkers in Alzheimer’s disease and mild cognitive impairment. Neurodegenerative Dis. 4, 406–412. doi: 10.1159/000107700
Guillot-Sestier, M. V., Doty, K. R., Gate, D., Rodriguez, J. Jr., Leung, B. P., Rezai-Zadeh, K., et al. (2015). Il10 deficiency rebalances innate immunity to mitigate Alzheimer-like pathology. Neuron 85, 534–548. doi: 10.1016/j.neuron.2014.12.068
Guzman-Martinez, L., Maccioni, R. B., Andrade, V., Navarrete, L. P., Pastor, M. G., and Ramos-Escobar, N. (2019). Neuroinflammation as a common feature of neurodegenerative disorders. Front. Pharmacol. 10:1008. doi: 10.3389/fphar.2019.01008
Heneka, M. T. (2017). Inflammasome activation and innate immunity in Alzheimer’s disease. Brain Pathol. 27, 220–222. doi: 10.1111/bpa.12483
Hu, W. T., Howell, J. C., Ozturk, T., Gangishetti, U., Kollhoff, A. L., Hatcher-Martin, J. M., et al. (2019). CSF cytokines in aging, multiple sclerosis, and dementia. Front. Immunol. 10:480. doi: 10.3389/fimmu.2019.00480
Italiani, P., Puxeddu, I., Napoletano, S., Scala, E., Melillo, D., Manocchio, S., et al. (2018). Circulating levels of IL-1 family cytokines and receptors in Alzheimer’s disease: new markers of disease progression? J. Neuroinflammation 15:342. doi: 10.1186/s12974-018-1376-1
Jayaraj, R. L., Rodriguez, E. A., Wang, Y., and Block, M. L. (2017). Outdoor ambient air pollution and neurodegenerative diseases: the neuroinflammation hypothesis. Curr. Environ. Health Rep. 4, 166–179. doi: 10.1007/s40572-017-0142-3
Jonsson, T., Stefansson, H., Steinberg, S., Jonsdottir, I., Jonsson, P. V., Snaedal, J., et al. (2013). Variant of TREM2 associated with the risk of Alzheimer’s disease. N. Engl. J. Med. 368, 107–116. doi: 10.1056/NEJMoa1211103
Karch, C. M., and Goate, A. M. (2015). Alzheimer’s disease risk genes and mechanisms of disease pathogenesis. Biol. Psychiatry 77, 43–51.
Khemka, V. K., Ganguly, A., Bagchi, D., Ghosh, A., Bir, A., Biswas, A., et al. (2014). Raised serum proinflammatory cytokines in Alzheimer’s disease with depression. Aging Dis. 5, 170–176. doi: 10.14336/AD.2014.0500170
Kilkenny, C., Browne, W. J., Cuthill, I. C., Emerson, M., and Altman, D. G. (2010). Improving bioscience research reporting: the ARRIVE guidelines for reporting animal research. PLoS Biol. 8:e1000412. doi: 10.1371/journal.pbio.1000412
Kim, R. Y., Hoffman, A. S., Itoh, N., Ao, Y., Spence, R., Sofroniew, M. V., et al. (2014). Astrocyte CCL2 sustains immune cell infiltration in chronic experimental autoimmune encephalomyelitis. J. Neuroimmunol. 274, 53–61. doi: 10.1016/j.jneuroim.2014.06.009
Kloske, C. M., and Wilcock, D. M. (2020). The important interface between apolipoprotein E and neuroinflammation in Alzheimer’s disease. Front. Immunol. 11:754. doi: 10.3389/fimmu.2020.00754
Kodamullil, A. T., Iyappan, A., Karki, R., Madan, S., Younesi, E., and Hofmann-Apitius, M. (2017). Of mice and men: comparative analysis of neuro-inflammatory mechanisms in human and mouse using cause-and-effect models. J. Alzheimers Dis. 59, 1045–1055. doi: 10.3233/JAD-170255
Lai, K. S. P., Liu, C. S., Rau, A., Lanctôt, K. L., Köhler, C. A., Pakosh, M., et al. (2017). Peripheral inflammatory markers in Alzheimer’s disease: a systematic review and meta-analysis of 175 studies. J. Neurol. Neurosurg. Psychiatry 88, 876–882. doi: 10.1136/jnnp-2017-316201
Lampron, A., Pimentel-Coelho, P. M., and Rivest, S. (2013). Migration of bone marrow-derived cells into the central nervous system in models of neurodegeneration. J. Comp. Neurol. 521, 3863–3876. doi: 10.1002/cne.23363
Lee, K. S., Chung, J. H., Choi, T. K., Suh, S. Y., Oh, B. H., and Hong, C. H. (2009). Peripheral cytokines and chemokines in Alzheimer’s disease. Dement Geriatr. Cogn. Disord. 28, 281–287. doi: 10.1159/000245156
Leist, M., and Hartung, T. (2013). Inflammatory findings on species extrapolations: humans are definitely no 70-kg mice. Arch. Toxicol 87, 563–567. doi: 10.1007/s00204-013-1038-0
Licastro, F., Veglia, F., Chiappelli, M., Grimaldi, L. M., and Masliah, E. (2004). A polymorphism of the interleukin-1 beta gene at position +3953 influences progression and neuro-pathological hallmarks of Alzheimer’s disease. Neurobiol. Aging 25, 1017–1022. doi: 10.1016/j.neurobiolaging.2003.11.002
Liddelow, S. A., Guttenplan, K. A., Clarke, L. E., Bennett, F. C., Bohlen, C. J., Schirmer, L., et al. (2017). Neurotoxic reactive astrocytes are induced by activated microglia. Nature 541, 481–487. doi: 10.1038/nature21029
Liu, X., and Quan, N. (2018). Microglia and CNS interleukin-1: beyond immunological concepts. Front. Neurol. 9:8. doi: 10.3389/fneur.2018.00008
Lucking, E. F., Murphy, K. H., Burns, D. P., Jaisimha, A. V., Barry-Murphy, K. J., Dhaliwal, P., et al. (2019). No evidence in support of a prodromal respiratory control signature in the TgF344-AD rat model of Alzheimer’s disease. Respir. Physiol. Neurobiol. 265, 55–67. doi: 10.1016/j.resp.2018.06.014
Lynch, M. A. (2010). Age-related neuroinflammatory changes negatively impact on neuronal function. Front. Aging Neurosci. 1:6. doi: 10.3389/neuro.24.006.2009
Meola, D., Huang, Z., and Petitto, J. M. (2013). Selective neuronal and brain regional expession of IL-2 in IL2P 8-GFP transgenic mice: relation to sensorimotor gating. J. Alzheimers Dis. Parkinsonism 3:1000127. doi: 10.4172/2161-0460.1000127
Michaud, M., Balardy, L., Moulis, G., Gaudin, C., Peyrot, C., Vellas, B., et al. (2013a). Proinflammatory cytokines, aging, and age-related diseases. J. Am. Med. Dir. Assoc. 14, 77–82. doi: 10.1016/j.jamda.2013.05.009
Michaud, M., Balardy, L., Moulis, G., Gaudin, C., Peyrot, C., Vellas, B., et al. (2013b). Roinflammatory cytokines, aging, and age-related diseases. J. Am. Med. Dir. Assoc. 14, 877–882. doi: 10.1016/j.jamda.2013.05.009
Mir, R. H., Sawhney, G., Pottoo, F. H., Mohi-Ud-Din, R., Madishetti, S., and Jachak, S. M. (2020). Role of environmental pollutants in Alzheimer’s disease: a review. Environ. Sci. Pollut. Res. Int. 27, 44724–44742.
Mitrasinovic, O. M., Grattan, A., Robinson, C. C., Lapustea, N. B., Poon, C., Ryan, H., et al. (2005). Microglia overexpressing the macrophage colony-stimulating factor receptor are neuroprotective in a microglial-hippocampal organotypic coculture system. J. Neurosci. 25, 4442–4451.
Mitrasinovic, O. M., Vincent, V. A., Simsek, D., and Murphy, G. M. Jr. (2003). Macrophage colony stimulating factor promotes phagocytosis by murine microglia. Neurosci. Lett. 344, 185–188. doi: 10.1016/s0304-3940(03)00474-9
Morimoto, K., Horio, J., Satoh, H., Sue, L., Beach, T., and Arita, S. (2011). Expression profiles of cytokines in the brains of Alzheimer’s disease (ad) patients compared to the brains of non-demented patients with and without increasing AD pathology. J. Alzheimers Dis. 25, 59–76. doi: 10.3233/JAD-2011-101815
Mrak, R. E., and Griffin, W. S. (2001). Interleukin-1, neuroinflammation, and Alzheimer’s disease. Neurobiol. Aging 22, 903–908. doi: 10.1016/s0197-4580(01)00287-1
Mumaw, C. L., Levesque, S., McGraw, C., Robertson, S., Lucas, S., and Stafflinger, J. E. (2016). Microglial priming through the lung-brain axis: the role of air pollution-induced circulating factors. FASEB J. 30, 1880–1891. doi: 10.1096/fj.201500047
Nagae, T., Araki, K., Shimoda, Y., Sue, L. I., Beach, T. G., and Konishi, Y. (2016). Cytokines and cytokine receptors involved in the pathogenesis of Alzheimer’s disease. J. Clin. Cell Immunol. 7:441. doi: 10.4172/2155-9899.1000441
Olson, L., and Humpel, C. (2010). Growth factors and cytokines/chemokines as surrogate biomarkers in cerebrospinal fluid and blood for diagnosing Alzheimer’s disease and mild cognitive impairment. Exp. Gerontol. 45, 41–46. doi: 10.1016/j.exger.2009.10.011
Patten, K. T., Gonzalez, A., Valenzuela, A., Berg, L., Wallis, C., Garbow, J. R., et al. (2020). Effects of early life exposure to traffic-related air pollution on brain development in juvenile Sprague-Dawley rats. Transl. Psychiatry 10:166. doi: 10.1038/s41398-020-0845-3
Patten, K. T., Valenzuela, A. E., Wallis, C., Berg, E. L., Silverman, J. L., Bein, K. J., et al. (2021). The effects of chronic exposure to ambient traffic-related air pollution on Alzheimer’s disease phenotypes in wildtype and genetically predisposed male and female rats. Environ. Health Perspect. 129:57005. doi: 10.1289/EHP8905
Peters, R., Ee, N., Peters, J., Booth, A., Mudway, I., and Anstey, K. J. (2019). Air pollution and dementia: a systematic review. J. Alzheimers Dis. 70, S145–S163. doi: 10.3233/JAD-180631
Platten, M., Kretz, A., Naumann, U., Aulwurm, S., Egashira, K., Isenmann, S., et al. (2003). Monocyte chemoattractant protein-1 increases microglial infiltration and aggressiveness of gliomas. Ann. Neurol. 54, 388–392.
Pons, V., Laflamme, N., Préfontaine, P., and Rivest, S. (2020). Role of macrophage colony-stimulating factor receptor on the proliferation and survival of microglia following systemic nerve and cuprizone-induced injuries. Front. Immunol. 11:47. doi: 10.3389/fimmu.2020.00047
Rainero, I., Bo, M., Ferrero, M., Valfrè, W., Vaula, G., and Pinessi, L. (2004). Association between the interleukin-1alpha gene and Alzheimer’s disease: a meta-analysis. Neurobiol. Aging 25, 1293–1298. doi: 10.1016/j.neurobiolaging.2004.02.011
Rea, I. M., Gibson, D. S., McGilligan, V., McNerlan, S. E., Alexander, H. D., and Ross, O. A. (2018). Age and age-related diseases: role of inflammation triggers and cytokines. Front. Immunol. 9:586. doi: 10.3389/fimmu.2018.00586
Reale, M., Iarlori, C., Feliciani, C., and Gambi, D. (2008). Peripheral chemokine receptors, their ligands, cytokines and Alzheimer’s disease. J. Alzheimers Dis. 14, 147–159. doi: 10.3233/jad-2008-14203
Rubio-Perez, J. M., and Morillas-Ruiz, J. M. (2012). A review: inflammatory process in Alzheimer’s disease, role of cytokines. Sci. World J. 2012:756357.
Sasaki, A. (2016). Microglia and brain macrophages: an update. Neuropathology 37, 452–464. doi: 10.1111/neup.12354
Scarabino, D., Peconi, M., Broggio, E., Gambina, G., Maggi, E., Armeli, F., et al. (2020). Relationship between proinflammatory cytokines (Il-1beta, Il-18) and leukocyte telomere length in mild cognitive impairment and Alzheimer’s disease. Exp. Gerontol. 136:110945. doi: 10.1016/j.exger.2020.110945
Seok, J., Warren, H. S., Cuenca, A. G., Mindrinos, M. N., Baker, H. V., Xu, W., et al. (2013). Genomic responses in mouse models poorly mimic human inflammatory diseases. Proc. Natl. Acad. Sci. U.S.A. 110, 3507–3512. doi: 10.1073/pnas.1222878110
Shaftel, S. S., Griffin, W. S., and O’Banion, M. K. (2008). The role of interleukin-1 in neuroinflammation and Alzheimer disease: an evolving perspective. J. Neuroinflammation 5:7. doi: 10.1186/1742-2094-5-7
Spath, P., Tisato, V., Gianesini, S., Tessari, M., Menegatti, E., Manfredini, R., et al. (2017). The calendar of cytokines: Seasonal variation of circulating cytokines in chronic venous insufficiency. JRSM Cardiovasc. Dis. 6:2048004017729279. doi: 10.1177/2048004017729279
Stamouli, E. C., and Politis, A. M. (2016). [Pro-inflammatory cytokines in Alzheimer’s disease]. Psychiatriki 27, 264–275.
Su, F., Bai, F., and Zhang, Z. (2016). Inflammatory cytokines and Alzheimer’s disease: a review from the perspective of genetic polymorphisms. Neurosci. Bull. 32, 469–480. doi: 10.1007/s12264-016-0055-4
Swanson, A., Wolf, T., Sitzmann, A., and Willette, A. A. (2018). Neuroinflammation in Alzheimer’s disease: pleiotropic roles for cytokines and neuronal pentraxins. Behav. Brain Res. 347, 49–56. doi: 10.1016/j.bbr.2018.02.015
Tejera, D., Mercan, D., Sanchez-Caro, J. M., Hanan, M., Greenberg, D., Soreq, H., et al. (2019). Systemic inflammation impairs microglial abeta clearance through NLRP3 inflammasome. EMBO J. 38:e101064. doi: 10.15252/embj.2018101064
Ter Horst, R., Jaeger, M., Smeekens, S. P., Oosting, M., Swertz, M. A., Li, Y., et al. (2016). Host and environmental factors influencing individual human cytokine responses. Cell 167, 1111-1124.e13. doi: 10.1016/j.cell.2016.10.018
Thomas, A. J., Hamilton, C. A., Donaghy, P. C., Martin-Ruiz, C., Morris, C. M., Barnett, N., et al. (2020). Prospective longitudinal evaluation of cytokines in mild cognitive impairment due to AD and lewy body disease. Int. J. Geriatr. Psychiatry 35:1250. doi: 10.1002/gps.5365
Unger, M. S., Schernthaner, P., Marschallinger, J., Mrowetz, H., and Aigner, L. (2018). Microglia prevent peripheral immune cell invasion and promote an anti-inflammatory environment in the brain of APP-PS1 transgenic mice. J. Neuroinflammation 15:274. doi: 10.1186/s12974-018-1304-4
van de Veerdonk, F. L., Netea, MG., Dinarello, CA., and Joosten, LA. (2011). Inflammasome activation and IL-1β and IL-18 processing during infection. Trends Immunol. 32, 110–116. doi: 10.1016/j.it.2011.01.003
Venegas, C., and Heneka, M. T. (2017). Danger-associated molecular patterns in Alzheimer’s disease. J. Leukoc Biol. 101, 87–98. doi: 10.1189/jlb.3MR0416-204R
Venegas, C., Kumar, S., Franklin, B. S., Dierkes, T., Brinkschulte, R., Tejera, D., et al. (2017). Microglia-derived ASC specks cross-seed amyloid-beta in Alzheimer’s disease. Nature 552, 355–361. doi: 10.1038/nature25158
Veryard, L., Jones, E., Weaving, G., Smith, E., Cheek, L., Wickramasinghe, A., et al. (2012). Pro-inflammatory cytokines IL-1beta and TNF-alpha are not associated with blood homocysteine concentration in Alzheimer’s disease. Curr. Alzheimer Res. 10, 174–179. doi: 10.2174/1567205011310020007
Vitek, M. P., Brown, C. M., and Colton, C. A. (2009). APOE genotype-specific differences in the innate immune response. Neurobiol. Aging 30, 1350–1360. doi: 10.1016/j.neurobiolaging.2007.11.014
Wang, W. Y., Tan, M. S., Yu, J. T., and Tan, L. (2015). Role of pro-inflammatory cytokines released from microglia in Alzheimer’s disease. Ann. Transl. Med. 3:136. doi: 10.3978/j.issn.2305-5839.2015.03.49
Wyczalkowska-Tomasik, A., Bozena C.-P., Magdalena Z., and Leszek P. (2016). Inflammatory markers change with age, but do not fall beyond reported normal ranges. Arch. Immunol. Ther. Exp. 64, 249–254. doi: 10.1007/s00005-015-0357-7
Zhang, Y., Sloan, S. A., Clarke, L. E., Caneda, C., Plaza, C. A., Blumenthal, P. D., et al. (2016). Purification and characterization of progenitor and mature human astrocytes reveals transcriptional and functional differences with mouse. Neuron 89, 37–53. doi: 10.1016/j.neuron.2015.11.013
Keywords: air pollution, Alzheimer’s disease, cytokines, IL-1β, microglia, neuroinflammation
Citation: Patten KT, Valenzuela AE, Wallis C, Harvey DJ, Bein KJ, Wexler AS, Gorin FA and Lein PJ (2022) Hippocampal but Not Serum Cytokine Levels Are Altered by Traffic-Related Air Pollution in TgF344-AD and Wildtype Fischer 344 Rats in a Sex- and Age-Dependent Manner. Front. Cell. Neurosci. 16:861733. doi: 10.3389/fncel.2022.861733
Received: 25 January 2022; Accepted: 24 March 2022;
Published: 22 April 2022.
Edited by:
Souvarish Sarkar, Brigham and Women’s Hospital and Harvard Medical School, United StatesReviewed by:
Dharmin Rokad, Covance, United StatesCopyright © 2022 Patten, Valenzuela, Wallis, Harvey, Bein, Wexler, Gorin and Lein. This is an open-access article distributed under the terms of the Creative Commons Attribution License (CC BY). The use, distribution or reproduction in other forums is permitted, provided the original author(s) and the copyright owner(s) are credited and that the original publication in this journal is cited, in accordance with accepted academic practice. No use, distribution or reproduction is permitted which does not comply with these terms.
*Correspondence: Pamela J. Lein, cGpsZWluQHVjZGF2aXMuZWR1
Disclaimer: All claims expressed in this article are solely those of the authors and do not necessarily represent those of their affiliated organizations, or those of the publisher, the editors and the reviewers. Any product that may be evaluated in this article or claim that may be made by its manufacturer is not guaranteed or endorsed by the publisher.
Research integrity at Frontiers

Learn more about the work of our research integrity team to safeguard the quality of each article we publish.