 Venkat Krishnan Sundaram1*†
 Tatiana El Jalkh1,2
 Rasha Barakat1,3
 Camille Julie Isabelle Fernandez1
 Charbel Massaad1
 Julien Grenier1*†
- 1INSERM UMRS 1124, Faculty of Basic and Biomedical Sciences, Université de Paris, Paris, France
- 2EC2M, Faculty of Sciences II, Lebanese University, Fanar, Lebanon
- 3INSERM UMRS 1016, Institut Cochin, Université de Paris, Paris, France
Embryonic Dissociated Dorsal Root Ganglia (DRG) cultures are often used to investigate the role of novel molecular pathways or drugs in Schwann cell development and myelination. These cultures largely recapitulate the order of cellular and molecular events that occur in Schwann cells of embryonic nerves. However, the timing of Schwann cell developmental transitions, notably the transition from Schwann Cell Precursors (SCP) to immature Schwann cells (iSC) and then to myelinating Schwann cells, has not been estimated so far in this culture system. In this study, we determined the expression profiles of Schwann cell developmental genes during the first week of culture and then compared our data to the expression profiles of these genes in developing spinal nerves. This helped in identifying that SCP transition into iSC between the 5th and 7th day in vitro. Furthermore, we also investigated the transition of immature cells into pro-myelinating and myelinating Schwann cells upon the induction of myelination in vitro. Our results suggest that Schwann cell differentiation beyond the immature stage can be observed as early as 4 days post the induction of myelination in cocultures. Finally, we compared the myelinating potential of coculture-derived Schwann cell monocultures to cultures established from neonatal sciatic nerves and found that both these culture systems exhibit similar myelinating phenotypes. In effect, our results allow for a better understanding and interpretation of coculture experiments especially in studies that aim to elucidate the role of a novel actor in Schwann cell development and myelination.
Introduction
Dissociated Dorsal Root Ganglia (DRG) cultures from mouse embryos have long been utilized as a resourceful model for exploring the nuances of Schwann cell development in vitro (Taveggia and Bolino, 2018). The co-culture system provides a solid experimental framework to study different aspects of Schwann cell development such as proliferation, migration, differentiation, and myelination of axons (Päiväläinen et al., 2008; Taveggia and Bolino, 2018). Furthermore, it recapitulates the different aspects of Schwann cell development that are observed in vivo. Hence, dissociated DRG cultures form an indispensable part of studies that aim to understand the role of a novel actor in Schwann cell development and differentiation.
It is well known that temporal differences exist between Schwann cell development in Dissociated DRG/SC coculture in vitro, and in developing spinal nerves in vivo. In developing spinal nerves of mice, Neural Crest Cells (NCC), destined to a glial fate, differentiate into Schwann Cell Precursors (SCP) and appear in the DRGs at around E11 (Jacob, 2015). Then, the SCPs start migrating on nascent axons between E12.5 and E13.5 to populate their peripheral targets. However, at around E15.5 in mice, SCPs undergo a transition into immature Schwann cells (iSC) that further differentiate into either myelinating or non-myelinating Schwann cells, perinatally (Monk et al., 2015; Fledrich et al., 2019; Jessen and Mirsky, 2019).
Nevertheless, these observations cannot be used to extrapolate the timing of Schwann cell developmental transitions in vitro because of certain technical issues. Firstly, the DRGs are dissected from mouse embryos towards the end of the 2nd week of gestation (E12.5 or E13.5). At this stage, SCP in vivo have already started departing from the DRGs and begun migrating on developing axons (Jessen et al., 1994; Jessen and Mirsky, 2005). However, once dissected and dissociated, the E13.5 DRG cells give rise to sensory neurons and SCP once again in vitro (Ratner et al., 2005; Kim and Maurel, 2009; Kim and Kim, 2018). This is rendered possible because of a reservoir of sensory neurons and SCP located inside the DRGs that repopulate the culture (Figure 1). Therefore, a significant portion of in vivo developmental events are repeated in cell culture albeit with a phase difference. Our objective in this study is to better understand these temporal differences in cocultures in an effort to provide a better experimental and inferential framework.
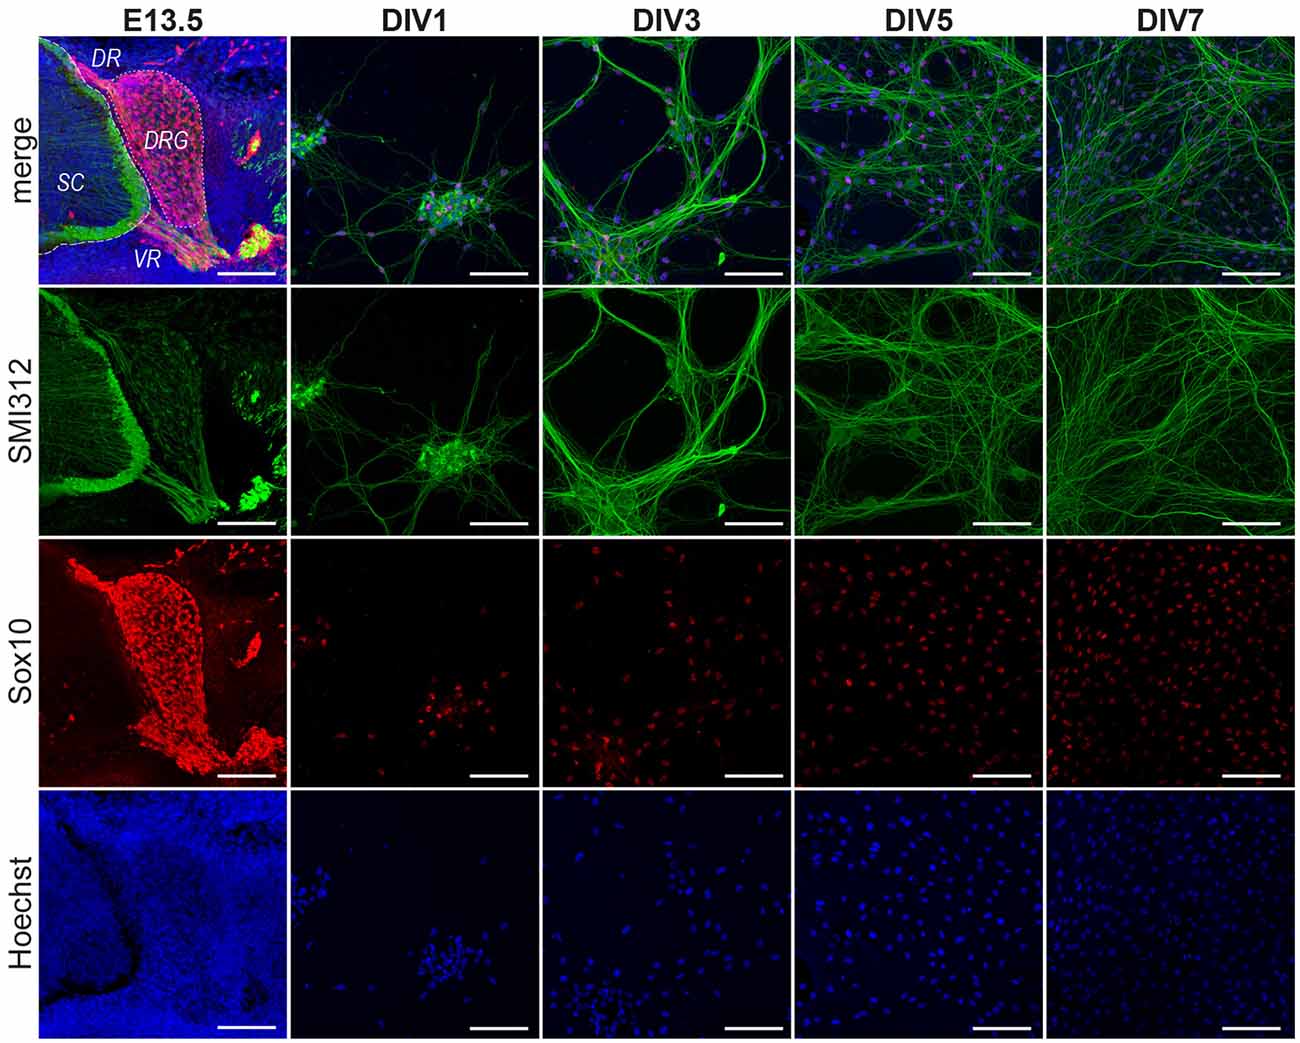
Figure 1. Progression of DRG/SC cocultures between Days in vitro 1 (DIV1) and DIV7. DRGs were dissociated and cultured from E13.5 embryos. The DRGs at the time of dissections contained SMI312+ neurons and Sox10+ glial cells. The cells sparsely populated the culture at DIV1. In the next 5 days, the neuron-SC network expanded and established a well-connected network by DIV7 containing Sox10+ SC situated on top of SMI312+ axonal extensions. Images shown here are representative images chosen arbitrarily. Although the area covered by axons increases progressively between DIV1 and DIV7, not all regions of the culture are equally dense at DIV7. SMI312—Neuronal Marker, Sox10—SC lineage marker, Hoechst—Nuclear Staining. SC, spinal cord; DR, dorsal root; VR, ventral root; DRG, dorsal root ganglia. Scale bar, 100 μm.
To this end, we first delineated the mRNA expression profiles of the genes expressed in SCP (Dhh, Mpz, Cnp, Plp, Mbp, Cad19, and Tfap2α) and iSC (Krox20). We then compared them to their profiles in vivo described in previous high-throughput studies conducted on embryonic peripheral nerves that provide extensive data on the differential expression of genes during Schwann Cell developmental transitions (Buchstaller et al., 2004; D’Antonio et al., 2006). This analysis helped us in determining the exact time window when SCP transition into iSC in Dissociated DRG/SC cocultures. Furthermore, we also verified that iSC at Days in vitro 7 (DIV7) transition into pro-myelinating (pro-mSC) and myelinating Schwann cells (mSC) upon the induction of myelination by the addition of Ascorbic Acid (AA) to DIV7 cocultures. Finally, we investigated if SC monocultures established from DIV7 cocultures possess the same myelinating potential as monocultures established from neonatal sciatic nerves.
Taken together, our results show that SCP transition into iSC between DIV5 and DIV7 in cocultures. Furthermore, we have also observed that the iSC/mSC transition in co-cultures occurs as early as 4 days post AA treatment. As for Schwann cell monocultures, SC obtained from DIV7 cocultures differentiate into mSC similar to SC isolated from neonatal sciatic nerves, further suggesting that the cells at DIV7 are comparable to neonatal Schwann cells in culture. In conclusion, our data provides a holistic understanding of the Schwann Cell Precursor/immature Schwann Cell/myelinating Schwann Cell transition in embryonic DRG/SC cocultures which is crucial for designing rigorous in vitro assays to study Schwann cell embryonic development and embryonic phenotypes of different Schwann cell mutants.
Materials and Methods
Animals and Tissue Harvesting
Timed pregnant C57Bl6/J mice at E13.5 were purchased from Janvier Labs. The pregnant mice were first anesthetized with isoflurane and sacrificed using cervical dislocation. Embryos were surgically removed and placed in ice-cold L-15 media. DRGs were harvested from these embryos based on existing protocols (Kim and Kim, 2018; Taveggia and Bolino, 2018). All aspects of animal care and animal experimentation were performed in accordance with the relevant guidelines and regulations of INSERM and Université de Paris (authorization APAFIS#7405-2016092216181520).
Dissociated DRG/SC Cocultures
A total of 40 DRGs were harvested from each embryo. DRGs were then trypsinized (0.25% Trypsin in HBSS 1×) for 30 min at 37°C. Trypsinization was stopped using L-15 media containing 10% Horse Serum (Gibco). DRGs were then spun down at 1,500 rpm for 5 min. The supernatant was removed, and the tissues were resuspended in DRG plating medium (refer to Media Compositions in Supplementary Material). The tissues were then triturated 10–20 times using flamed Pasteur pipettes until a homogenous cell suspension was obtained. For each time point (DIV1, DIV3, DIV5, DIV7), dissociated DRGs were plated on 12-well plates containing 14 mm coverslips coated with Poly L Lysine (Sigma) and Collagen (R&D Systems). Forty DRGs from each embryo were plated into eight wells at approximately five dissociated DRGs per well. Two wells were assigned to each time point. The cells were first plated with DRG plating medium for 16 h. The following day the medium was replaced with Supplemented Neurobasal medium to promote neurite growth and Schwann cell proliferation for a period of 7 days. Media was changed every 48 h. Myelination was induced at DIV7 by changing the media to DRG plating medium supplemented with 50 μg/ml AA (Sigma).
Schwann Cell Monocultures
SC monocultures were established using previously detailed protocols (Kim and Kim, 2018). Briefly, dissociated DRGs were obtained from E13.5 and were cultured on uncoated 35 mm Petri dishes (approx. 40 DRGs/Embryo) as explained above. At DIV7, the neurite network (neurons + Schwann cells) was mechanically lifted from the plate using a sterile 27 L1/2 G needle. The network was then enzymatically digested (0.25% Trypsin, 0.1% Collagenase in HBSS 1×) for 30 min at 37°C. Digestion was stopped by the addition of Schwann Cell Plating Media and the cell suspension was centrifuged at 1,500 rpm for 5 min. The pellet was then triturated 5–6 times using a 1 ml pipette tip. To obtain highly pure cultures without contaminating fibroblasts, the cell suspension was subjected to immunopanning to remove Thy1.2+ve fibroblasts as described elsewhere (Lutz, 2014). About 500,000 Schwann cells were obtained from each embryo after immunopanning and the cells were plated on 14 mm Poly L Lysine coated glass coverslips at a density of 50,000 cells/coverslip. Schwann cells were expanded using defined Schwann Cell Proliferation Media (see Supplementary Material) for 48 h. To induce differentiation, cell cultures were treated with Schwann Cell Differentiation Media (Proliferation media without Forskolin but supplemented with 1 mM dbcAMP) for a period of 48 h.
Immunohistochemistry
E13.5 and E16.5 embryos were surgically removed from the pregnant mouse and placed on ice-cold L-15 media. The head, the thoracic region along with the ventral internal organs, and the tail were dissected. The lumbar region along with the hindlimbs were fixed overnight with 4% PFA at 4°C. The following day, the embryos were extensively washed with PBS 1× and incubated overnight in Antigen Retrieval Buffer (10 mM Sodium Citrate, 0.05% Tween20, pH 6.0) at 4°C. The following day, the samples were boiled in the antigen retrieval buffer for 5 min and immediately placed in ice-cold 30% sucrose solution. The samples were then dehydrated in Sucrose overnight at 4°C. The following day, samples were embedded in 4% Agarose and placed on the vibratome such that the caudal aspect of the embryo was facing the chuck, the rostral aspect was facing upwards, and the lateral aspect was facing the blade. Fifty micrometer serial transverse sections of the lumbar region were made and transferred to a 12-well plate containing PBS 1×. Sections were quickly washed in PBS 1× and then stored at −20°C in a cryoprotectant (30% Glycerol, 30% Ethylene Glycol in PBS 1×) until immunostaining.
Immunostaining was performed by washing the sections first with PBS 1× followed by incubation in 0.1 M Glycine for 1 h. Sections were permeabilized and blocked with blocking buffer (0.5% Triton X100, 0.1% Tween20, 2% BSA, and 5% Normal Donkey Serum) for 1 h followed by incubation with primary antibodies against Neurofilament SMI312, Sox10 and Tfap2α for 36 h at 4°C (refer to Supplementary Material for primary and secondary antibody references and concentrations). Sections were then washed thrice (1 h per wash) in PBS 1× containing 0.1% Tween20 and were then incubated with the corresponding secondary antibodies for 1 h at RT in the dark. The sections were then washed, and nuclei were stained using Hoechst 33342 dye. Samples were then mounted on slides using Permaflour (Thermo Fisher Scientific) and stored at 4°C till confocal imaging.
Immunocytochemistry
DRG/SC cocultures and Schwann cell monocultures at different conditions were first fixed with 4% PFA at RT for 30 min. The coverslips were then washed with PBS 1× and stored at −20°C in a cryoprotectant until immunostaining.
Immunostaining was first performed by washing the coverslips first with PBS 1× followed by incubation in Antigen Retrieval Buffer (refer to “Immunohistochemistry” section) preheated to 95°C for 3 min. Samples were then washed with PBS 1× and incubated in 0.1 M Glycine solution for 30 min followed by permeabilization (0.25% Triton X100 0.1% Tween 20 in PBS 1×, 20 min at RT) and blocking (2% BSA, 0.1% Tween 20, 10% Normal Donkey Serum, 1 h at RT). Coverslips were then incubated with primary antibodies against, Neurofilament SMI312, Sox10, Tfap2α, Oct6, Krox20, and Ki67 overnight at 4°C (refer to Supplementary Material for primary and secondary antibody references and concentrations). The following day, the coverslips were washed thrice with PBS 1× (10 min per wash) and incubated with corresponding secondary antibodies for 1 h at RT in the dark. Samples were then washed, and nuclei were stained with Hoechst 33342 dye. Samples were then mounted on slides using Permafluor (Thermo Fisher Scientific) and stored at 4°C till confocal imaging.
Imaging and Image Analysis
Confocal imaging of tissue sections and coverslips was performed on the LSM710 microscope. Images were obtained as z-stacks and analyzed in ImageJ. For each experimental condition, 3–4 biological replicates (embryos) and three technical replicates/biological replicates were analyzed. Cell counting was performed on z-projections (Max intensity) using the Analyze particles function after thresholding the images. Data was exported to Microsoft Excel and graphs were plotted using Prism v8.0.
Total RNA Isolation
Total RNA was extracted from each sample using 1 ml of TRIzol reagent (Ambion Life Technologies 15596018) on ice as described in the manufacturer’s instructions with slight modifications. Briefly, 100% Ethanol was substituted for Isopropanol to reduce the precipitation of salts. Also, RNA precipitation was carried out overnight at −20°C in the presence of glycogen. The following day, precipitated RNA was pelleted by centrifugation and washed at least three times with 70% Ethanol to eliminate any residual contamination. Tubes were then spin-dried in vacuum for 5 min and RNA was resuspended in 20 μl of RNA resuspension buffer containing 0.1 mM EDTA, pH 8. RNA was then stored at −80°C till RTqPCR.
RNA Quality, Integrity, and Assay
RNA quantity was assayed using UV spectrophotometry on Nanodrop One (Thermo Scientific). Optical density absorption ratios A260/A280 and A260/A230 of the samples were above 1.8 and 1.5, respectively. The yield (mean ± SD) for each time point is as follows: DIV1 (26.74 ± 2.57 ng/μl), DIV3 (61.3 ± 8.01 ng/μl), DIV5 (51.86 ± 10.8 ng/μl), and DIV7 (77.34 ± 24.04 ng/μl). The extraction protocol used in the study was also validated using Agilent Bioanalyzer (RIN value 9.0 and above).
RTqPCR
Two-hundred and fifty nanogram of the total RNA was reverse transcribed with Random Primers (Promega C1181) and MMLV Reverse Transcriptase (Sigma M1302) according to prescribed protocols. Quantitative Real-time PCR (qPCR) was performed using Absolute SYBR ROX 2X qPCR mix (Thermo AB1162B) as a fluorescent detection dye. All reactions were carried out in a final volume of 7 μl in 384-well plates with 300 nM gene-specific primers, around 3.5 ng of cDNA (at 100% RT efficiency), and 1× SYBR Master Mix in each well. Each reaction was performed in triplicates. All qPCR experiments were performed on BioRad CFX384 with a No-Template-Control (NTC) to check for primer dimers and a No-RT-Control (NRT) to check for any genomic DNA contamination.
Primer Design and Efficiency
All primers used in the study were designed using the Primer 3 plus software1. Splice variants and the protein-coding sequence of the genes were identified using the Ensembl database2. Constitutively expressed exons among all splice variants were then identified using the ExonMine database3. Primer sequences that generated amplicons spanning two constitutively expressed exons were then designed using the Primer 3 plus software. For detailed information on Primer sequences used in the study, refer to the Supplementary Material. The amplification efficiencies of primers were calculated using serial dilution of cDNA molecules. Briefly, cDNA preparations from all the time points were pooled and serially diluted three times by a factor of 10. qPCR was then performed using these dilutions and the results were plotted as a standard curve against the respective concentrations of cDNA. Amplification efficiency (E) was calculated by linear regression of standard curves using the following equation:
E = 10−(1/slope of the standard curve)
Primer pairs that exhibited a theoretical Amplification Efficiency (E) of 1.9–2.1 (95%–105%) and an R2 value (Determination Coefficient) of 0.98 and above were chosen for this study.
qPCR Statistical Analysis and Data Visualization
qPCR readouts were analyzed in Precision Melt Analysis Software v1.2. The amplicons were subjected to Melt Curve analysis and were verified for a single dissociation peak at a Melting Temperature (Tm) > 75°C as expected from the primer constructs. The Cq data was exported to Microsoft Excel for further calculations. Each biological sample had three technical replicates thereby generating three individual Cq values. The arithmetic mean of the triplicates was taken to be the Cq representing the biological sample. The standard deviation (SD) of the triplicates was also calculated and samples that exhibited SD > 0.20 were considered inconsistent. In such cases, one outlier Cq was removed to have at least duplicate Cq values for each biological sample and an SD < 0.20.
For the DIV1 to DIV7 longitudinal dataset, reference gene validation was performed according to our qPCR data analysis workflow (Sundaram et al., 2019). Briefly, 10 conventional reference genes were chosen and screened using Coefficient of variation (CV) analysis and NormFinder (Supplementary Table 1) in R4 (Andersen et al., 2004). The algorithm predicted Tbp and Ppia to be the most stable references. The normalization factor was then determined as the mean Cq value of Tbp and Ppia for each sample (Supplementary Table 1). For the comparison of DIV7 vs. Schwann cell monocultures, reference gene validation was performed using CV analysis. Mrpl10 and Sdha exhibited the least collective variation (CV = 22%) and they were subsequently used for calculating the normalization factor. Relative expression of target genes was quantified using the 2−ΔΔCt method (Livak and Schmittgen, 2001; Schmittgen and Livak, 2008) and data was visualized using Prism v8.0.
To assess the statistical difference in relative RNA quantities between groups, One-way ANOVA was performed in Graph Pad Prism v8.0. If statistical significance was observed between the means of the groups, Tukey’s post hoc was performed to compare all the groups with each other. The alpha value threshold was set at 5% and the P-values are represented as follows: *P < 0.05, **P < 0.01, ***P < 0.001.
Results
Progression of Dissociated DRG/SC Cocultures
We first documented the cellular composition of DRGs at E13.5 as well as the progression of cultures at DIV1, DIV3, DIV5 and DIV7 (Figure 1). DRGs at E13.5 are comprised of sensory neurons with axonal projections towards the dorsal roots and the peripheral nerve. They are also comprised of neural crest derivatives (Sox10+ cells). Once dissected and dissociated, we observed a very sparse population of dissociated cells that are comprised of neurons and neural crest derivatives (Sox10+ cells) at DIV1. At DIV3, however, we could see a neurite network gradually being formed with cells located on top of neuronal extensions. These cells are presumably migratory SCP. The neurites then grew out and established a well-connected network by DIV5. Schwann cells now densely populated neurites. Not much difference was observed between DIV5 and DIV7 except that more connections were established in the neurite-Schwann cell network (Figure 1). From these observations, we could only deduce that Schwann cell precursors appear between DIV1 and DIV3 and they continue to populate the culture during the first 7 days.
Expression Profiles of Schwann Cell Developmental Genes
We then determined the expression profiles of Schwann cell developmental genes using RTqPCR (Figure 2A). The genes that we assayed include Dhh, Mpz, Mbp, Plp and, Cnp which are expressed in the Schwann cell lineage from the SCP stage in vivo (Jessen and Mirsky, 2019). We also assayed Cad19 and Tfap2α which are expressed in SCP but are downregulated in iSC in vivo (Stewart et al., 2001; Takahashi and Osumi, 2005). Finally, we assayed Krox20 mRNA levels which are upregulated as SCP transition into iSC in embryonic nerves (Topilko et al., 1994; Ghislain and Charnay, 2006).
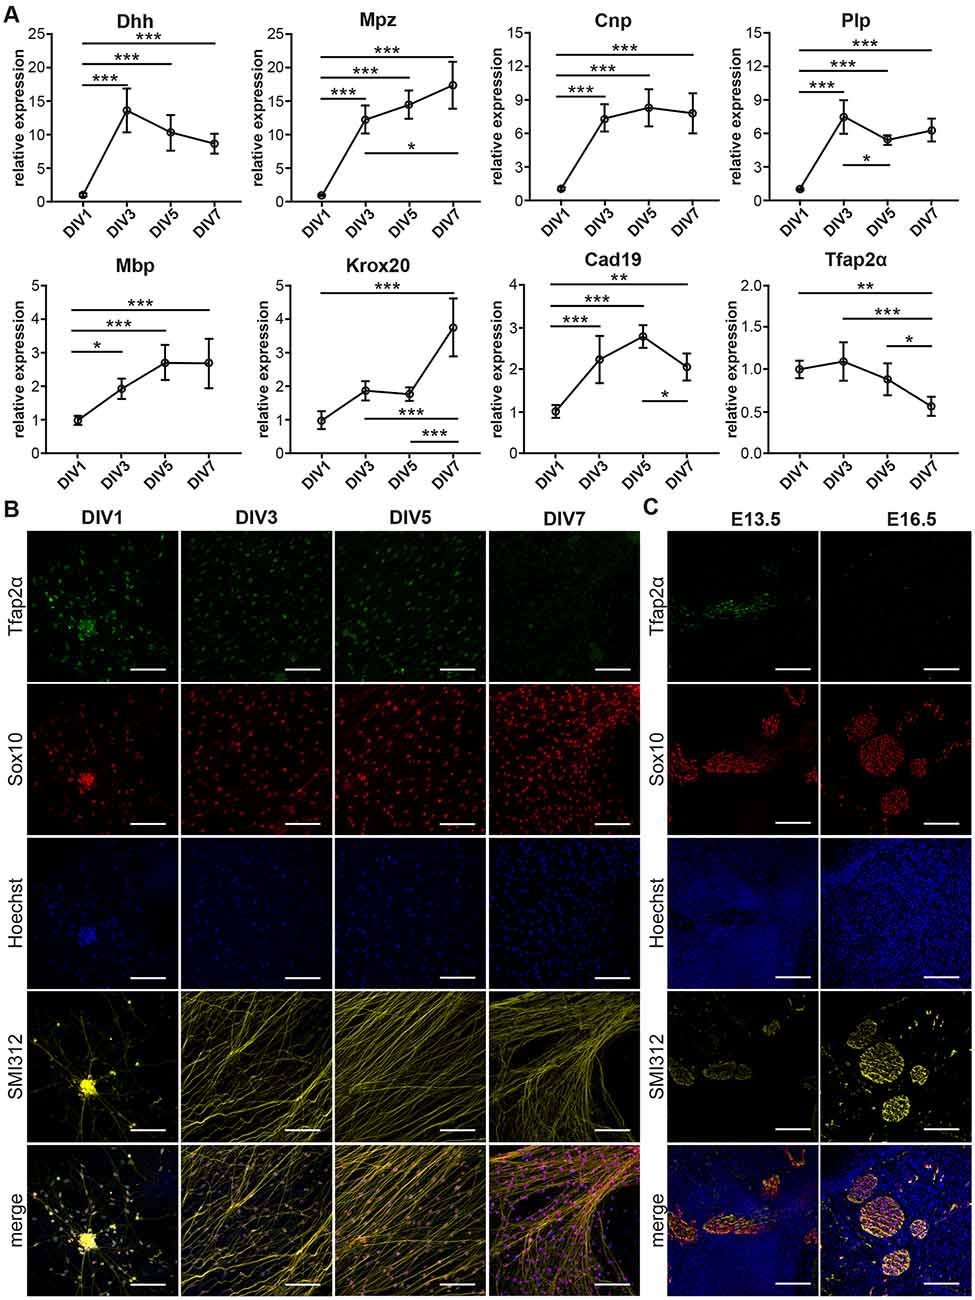
Figure 2. Transition of Schwann Cell Precursors (SCP) to immature Schwann cells (iSC) in DRG/SC Cocultures. (A) mRNA expression profiles of Schwann cell lineage markers assessed through RTqPCR. Relative expression was calculated using DIV1 as the experimental calibrator. To assess the statistical difference in relative RNA quantities between groups, One-way ANOVA was performed. If statistical significance was observed between the means of the groups, Tukey’s post hoc was performed to compare all the groups with each other. The alpha value threshold was set at 5% and the P-values are represented as follows: *P < 0.05, **P < 0.01, ***P < 0.001. (B) Immunocytochemistry (ICC) performed on dissociated cultures between DIV1 and DIV7. SCP were identified using Tfap2α staining, Sox10 was used as a SC lineage marker, Neurons were identified using SMI312 staining, and Hoechst dye was used to stain all nuclei. Scale bar = 100 μm. (C) Immunohistochemistry (IHC) performed on hindlimb cross sections of E13.5 and E16.5 embryos. SCP were identified using Tfap2α staining, Sox10 was used as an SC lineage marker, neurons were identified using SMI312 staining, and Hoechst dye was used to stain all nuclei. Scale bar = 100 μm.
Dhh showed a stark 14-fold increase between DIV1 and DIV3. Although the profile seemed to project a downward trajectory after DIV3, the levels of Dhh did not vary significantly between DIV3 and DIV7. Mpz displayed an initial spike between DIV 1 and DIV3 by about 12 folds, which was similar to Dhh. However, the quantity of Mpz gradually increased and reached about 17 folds at DIV7. Cnp expression increased by about 7-folds between DIV1 and DIV3 and maintained a stable profile till DIV7. Plp showed an initial peak at DIV3 by about seven-folds, which was comparable to that of Cnp. However, Plp expression momentarily dropped at DIV5 and reached a plateau by DIV7. Mbp displayed a modest but statistically significant increase by two-folds between DIV1 and DIV3. However, the expression did not increase significantly beyond DIV3. Krox20 expression did not vary significantly between DIV1 to DIV5. However, at DIV7 we observed a sudden spike by about four-folds. Cad19 expression increased almost linearly between DIV1 and DIV5. However, between DIV5 and DIV7, we observe a drop in its expression level. Tfap2α maintains a flat profile from DIV1 and DIV3. It begins to decline after DIV3 and drops significantly to about 0.5 folds at DIV7.
Expression of Tfap2α Protein in Dissociated DRG/SC Cocultures
The downregulation of Tfap2α protein levels in SCP is essential for their transition into iSC in vivo (Stewart et al., 2001). Consequently, we assayed the expression of Tfap2α in dissociated cultures using ICC (Figure 2B). We observed the expression of the protein at DIV1, DIV3, and DIV5. However, at DIV7 we observed a huge reduction in Tfap2α immunoreactivity to background levels. This observation is also corroborated by the reduction in Tfap2α mRNA levels between DIV5 and DIV7 (Figure 2A). The reduction in Tfap2α immunofluorescence is also observed in vivo wherein SCP at E13.5 in sciatic nerve transverse sections express the protein whereas iSC at E16.5 do not (Figure 2C). These results collectively suggest that SCP in DRG/SC cocultures transition into iSC between DIV5 and DIV7.
iSC/mSC Transition in Dissociated DRG/SC Cocultures
We next sought to determine if iSC at DIV7 transition into pro-myelinating SC (pro-mSC) and myelinating SC (mSC) in cocultures upon the induction of myelination. In embryonic nerves, iSC differentiate into pro-mSC and mSC perinatally (E16.5 + around 4 days; Salzer, 2015; Fledrich et al., 2019). These stages of Schwann cell development are characterized by the expression of Oct6 (pro-mSC) and Krox20 (mSC) transcription factors (Topilko et al., 1994; Jaegle et al., 1996, 2003). However, myelination in vitro requires the addition of AA to cocultures to promote the formation of SC basal lamina and SC intrinsic epigenetic modifications which are prerequisites to promote further Schwann cell differentiation (Eldridge et al., 1987, 1989; Bacallao and Monje, 2015; Huff et al., 2020).
We treated cocultures at DIV7 with AA and assayed Oct6 (Figure 3A) and Krox20 (Figure 3B) immunoreactivity after 4 days of treatment. We observed the presence of Oct6+ and Krox20+ Schwann cells located on top of the axons once the differentiation process is stimulated by AA addition. These results show that SC at DIV7 differentiate into pro-mSC and mSC after AA supplementation which is comparable to the perinatal iSC/mSC transition in vivo.
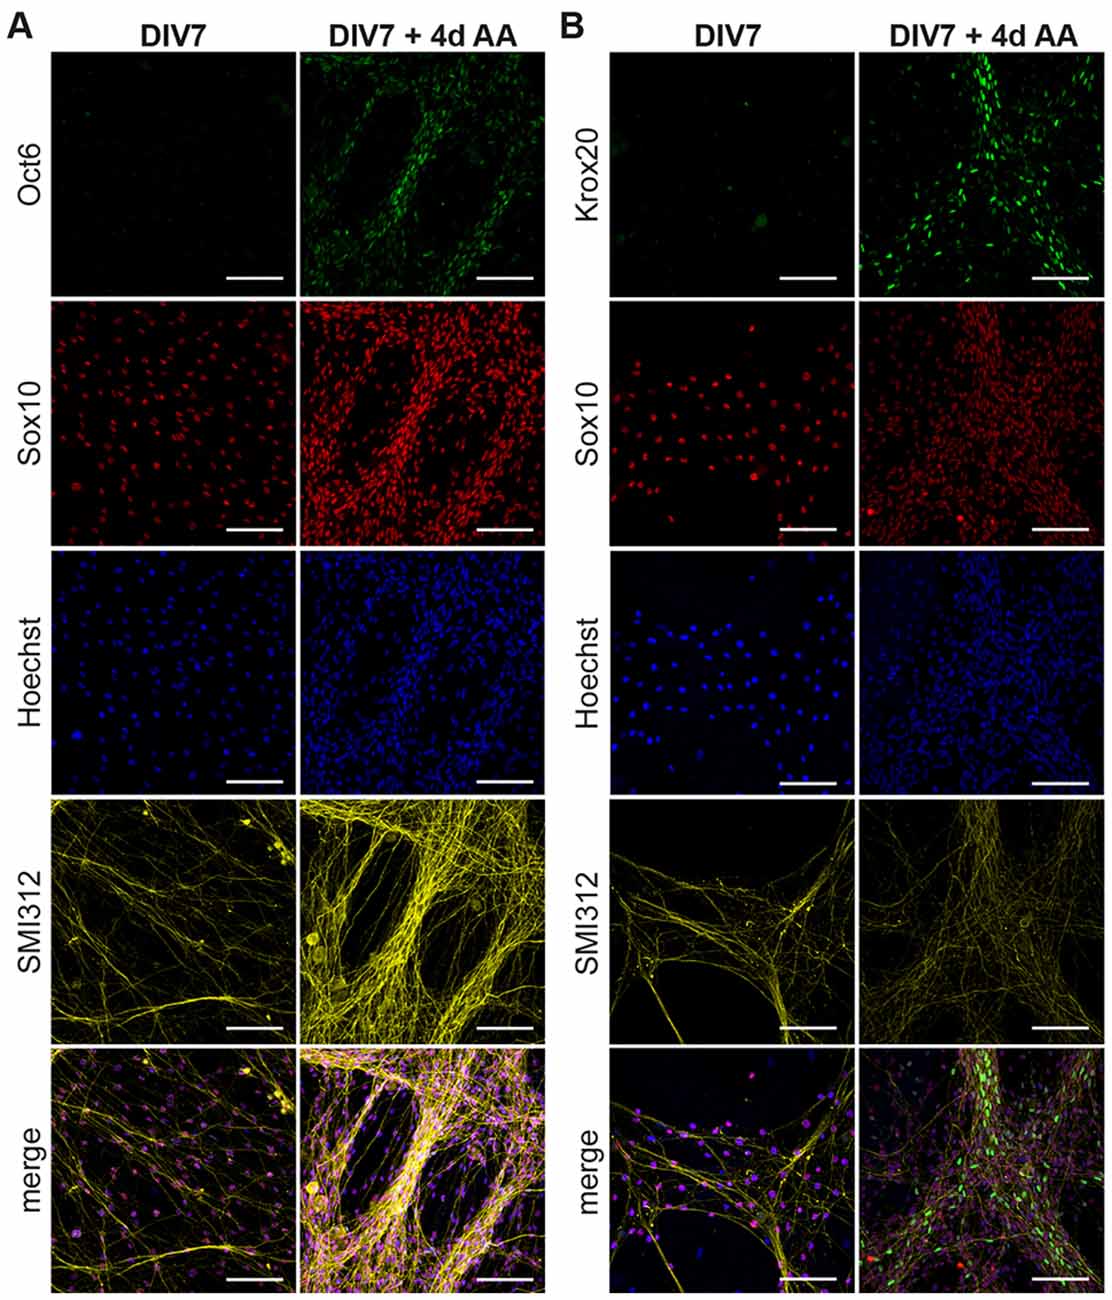
Figure 3. Transition of immature SC to myelinating SC in DRG/SC cocultures. Cocultures at DIV7 were treated with Ascorbic Acid (AA) for a period of 4 days. ICC was performed to assess the presence of Oct6+ (A) and Krox20+ (B) Schwann cells. Sox10 was used as an SC lineage marker, SMI312 was used to stain neurons and Hoechst dye was used to stain all nuclei. Scale bar = 100 μm.
Myelinating Potential of Coculture Derived SC Monocultures
SC monocultures are established from enzymatic digestion of neonatal mouse sciatic nerves in a plethora of recent studies because the preparation technique is less cumbersome. Neonatal nerves contain underdeveloped connective tissues and unmyelinated fibers and can be easily digested to render copious amounts of primary SC (Monje, 2020). Myelination can be induced in these cells by the addition of cAMP in substantially large concentrations (Arthur-Farraj et al., 2011; Bacallao and Monje, 2015). We, therefore, wanted to investigate if primary SC monocultures established from DIV7 cocultures are comparable to cultures established from neonates. We isolated SC from DIV7 cocultures using immunopanning and expanded them in culture for 48 h (Proliferation) following which these cells were treated with cAMP for another 48 h (Differentiation) according to prescribed protocols employing neonatal SC cultures (Arthur-Farraj et al., 2011). We assessed for the presence of pro-mSC and mSC using Oct6 and Krox20 mRNA and protein expression using DIV7 cells as experimental controls (Figure 4).
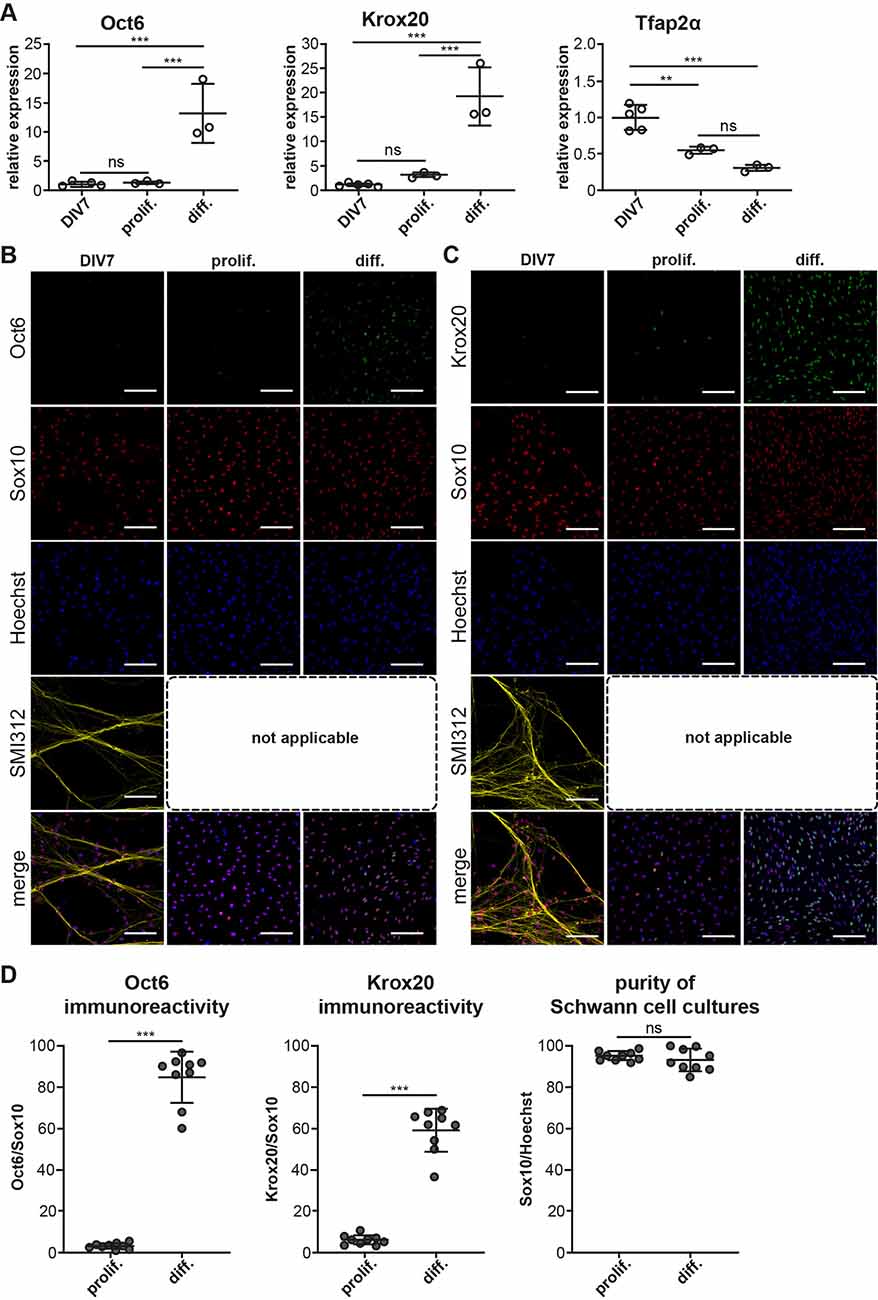
Figure 4. Myelinating potential of coculture derived SC monocultures. SC monocultures were established from DIV7 DRG/SC cocultures using immunopanning and were differentiated using cAMP. (A) Relative mRNA of Oct6, Krox20, and Tfap2α assessed across DIV7, SC monocultures in Proliferation (Prolif.), and in Differentiation (Diff.). DIV7 was used as the experimental control. To assess the statistical difference in relative RNA quantities between groups, One-way ANOVA was performed. If statistical significance was observed between the means of the groups, Tukey’s post hoc was performed to compare all the groups with each other. The alpha value threshold was set at 5% and the P-values are represented as follows: **P < 0.01, ***P < 0.001, ns = Not Significant. (B) ICC performed on dissociated cultures at DIV7 as well as in SC monocultures in proliferation and in differentiation. Pro-mSC (pro-myelinating SC) were identified using Oct6 staining, Sox10 was used as a SC lineage marker, neurons were identified using SMI312 staining, and Hoechst dye was used to stain all nuclei. SMI312 is not applicable in SC monocultures due to the absence of axons. Scale bar = 100 mm. (C) ICC performed on dissociated cultures at DIV7 as well as in SC monocultures in proliferation and in differentiation. mSC (myelinating Schwann cells) were identified using Krox20 staining, Sox10 was used as a SC lineage marker, neurons were identified using SMI312 staining, and Hoechst dye was used to stain all nuclei. SMI312 is not applicable in SC monocultures due to the absence of axons. Scale bar = 100 mm. (D) Quantification of Sox10, Oct6, and Krox20 immunoreactivity. The purity of SC cultures was assessed by calculating the total number of Sox10+ cells in culture. Oct6 and Krox20 immunoreactivity was quantified as the ratio of the total number of Oct6+ and Krox20+ cells to Sox10+ cells and it is expressed as a percentage. To assess statistical differences, a non-parametric Mann-Whitney test was performed. The alpha value threshold was set at 5% and the P-values are represented as follows: ***P < 0.001, ns = Not Significant.
mRNA expression levels of Oct6 and Krox20 do not vary much between DIV7 dissociated DRG/SC coculture and SC monocultures in proliferation medium but we noticed a stark increase in Oct6 mRNA levels by about 12 folds and Krox20 mRNA by about 18 folds when SC monocultures were treated with cAMP to induce differentiation (Figure 4A). This increased mRNA levels also corresponded with an increase in Oct6 and Krox20 immunoreactivity (Figures 4B,C, quantified in Figure 4D) where we observed about 80% of Sox10+ SC also stained positive for Oct6 and about 60% of SC stained positive for Krox20 on an average. Very similar results are also observed in SC monocultures derived from neonatal sciatic nerves (Arthur-Farraj et al., 2011).
Furthermore, we also inspected the mRNA and protein levels of the SCP marker Tfap2α. Interestingly, Tfap2α mRNA levels are further downregulated by about 0.5 folds between DIV7 dissociated DRG/SC coculture and Proliferative SC monocultures (Figure 4A). Besides, we could not detect any Tfap2α+ cells in all the three conditions (Supplementary Figure 2). These results suggest that SC monocultures established from DIV7 cocultures are comparable to primary cultures established from neonatal sciatic nerves with regard to the change in SC phenotype upon cAMP addition. Furthermore, we also observed that these monocultures do not express the SCP marker Tfap2α at the protein level. Taken together, these results provide further evidence that DIV7 SC are phenotypically different from SCP that arise in DRG/SC cocultures between DIV1 and DIV5 and they are rather similar to neonatal SC in culture.
Discussion
The objective of this study was to determine the SCP/iSC/mSC transition in DRG/SC cocultures using the expression profiles of Schwann cell developmental genes (Dhh, Mpz, Cnp, Plp, Mbp, Krox20, Cad19, Tfap2α). We first determined the expression profiles of these genes between DIV1 and DIV7. In addition to the mRNA data, we used Tfap2α ICC as a confirmatory experiment to distinguish between SCP and iSC in the coculture model. Furthermore, we induced myelination by the addition of AA at DIV7 to verify that the iSC transition into pro-mSC ad mSC in vitro. Additionally, we also compared the myelinating potential of SC monocultures established from DIV7 cocultures to that of monocultures established from neonatal nerves. A detailed schematic of our experimental approach is detailed in Figure 5A.
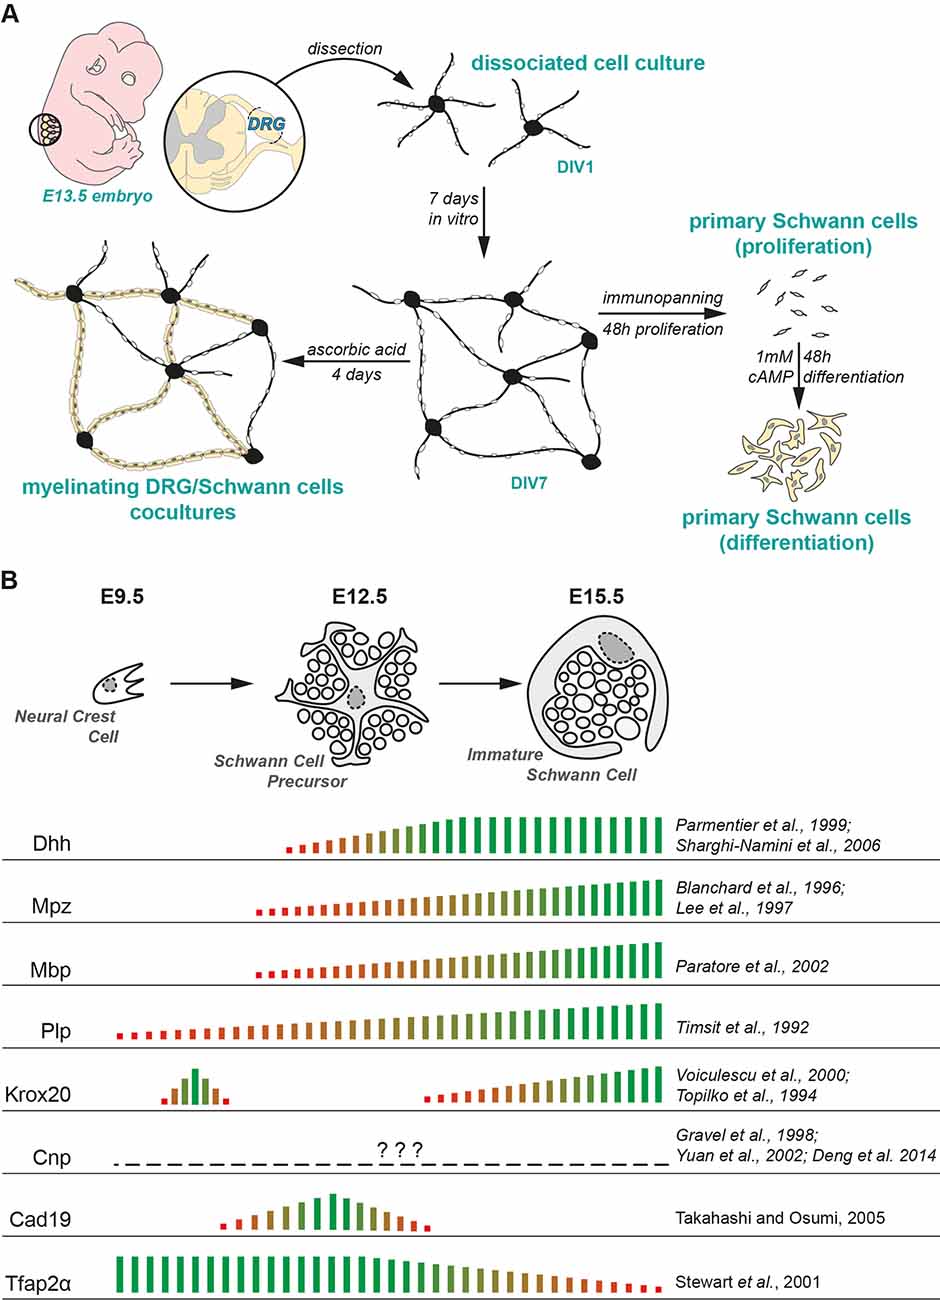
Figure 5. Experimental paradigm and literature review. (A) Experimental design used in the study. (B) Current consensus on the mRNA expression of SC lineage markers in embryonic peripheral nerves presented along with the corresponding literature. The empirical quantification presented herein has been extrapolated from microarray studies performed on murine embryonic nerves (Buchstaller et al., 2004; D’Antonio et al., 2006).
The SCP/iSC Transition
The expression profiles of SC lineage genes have been previously documented in gene profiling studies on murine embryonic nerves (Buchstaller et al., 2004; D’Antonio et al., 2006). Seminal reviews on Schwann cell developmental markers and other gene-specific expression profiling studies have been published in the last couple of decades and they give us a holistic understanding of the SC developmental transitions in embryonic and postnatal peripheral nerves (Jessen et al., 1994; Jessen and Mirsky, 2005; Woodhoo and Sommer, 2008; Monk et al., 2015). A summary of the current consensus on the expression profiles of these genes in vivo along with the relevant literature is presented in Figure 5B.
When comparing our mRNA expression data to these profiles, we find that our data seem to largely comply and concur with the order of molecular events observed in embryonic spinal nerves. For instance, the expression of Dhh, Mpz, Mbp and Plp is upregulated in SCP at around E12.5 in mice (Jessen and Mirsky, 2005; Woodhoo and Sommer, 2008). In DRG cultures, Dhh, Mpz, Mbp, and Plp expression is increased at DIV3 (Figure 2A). These observations suggest that SC in coculture either increase their endogenous expression of these SCP markers or that they proliferate extensively between DIV1 and DIV3. We find that the latter is more plausible as SC in cocultures continue to proliferate from DIV1 all through DIV7 (Supplementary Figure 1 for Ki67 staining in cocultures). Moreover, it is worth noting that the cells have already attained the SCP state at the time of dissection (E13.5; Jacob, 2015).
Data on Cnp expression in SCP of embryonic nerves is inconclusive. We analyzed three separate studies that sought to trace Cnp expression in the PNS (Gravel et al., 1998; Yuan et al., 2002; Deng et al., 2014). One study demonstrated that Cnp is expressed in the satellite cells of DRGs at E14.5 and at the ventral roots at E17.5 but did not comment on its expression in SCPs (Deng et al., 2014). The other two studies dealt with post-natal time points. Nonetheless, our observations suggest that Cnp mRNA is upregulated in SCP from DIV3 in culture. This observation, however, needs to be verified in vivo.
Krox20 is expressed at two different time points during the development of the PNS (Topilko et al., 1994; Voiculescu et al., 2000; Coulpier et al., 2010). At around E10.5, it is first expressed in the boundary cap cells that are located at the dorsal and ventral roots. This is followed by its increased expression as SCP transition into iSC at around E15.5 in peripheral nerves. Indeed, it is one of the genes used in the study that can categorically distinguish between SCP and iSC at the mRNA expression level. In our study, Krox20 expression does not change significantly between DIV1 and DIV5. We then see a sudden spike in its expression between DIV5 and DIV7 suggesting that SCP transition to iSC in this time period (Figure 2A).
To test this hypothesis, we further looked at the expression profile of Tfap2α, which is expressed in NCC and SCP but not in iSC (Stewart et al., 2001; Figure 2A). The downregulation of this transcription factor is indeed required for SCP to transition into iSC in developing nerves (Stewart et al., 2001; Jacob, 2015). Consistent with this observation, Tfap2α levels drop by 50% between DIV5 and DIV7 thus providing further evidence of the SCP/iSC transition between DIV5 and DIV7. Furthermore, Tfap2α immunorecativity in dissociated DRG/SC cocultures starkly reduces at DIV7 (Figure 2B) congruent with its downregulated expression in iSC in vivo (Figure 2C). Finally, we also assayed the expression levels of Cad19, which is the only known gene that is uniquely expressed in SCP but neither in NCC nor in iSC (Jessen and Mirsky, 2005, 2019; Takahashi and Osumi, 2005). Cad19 expression in vitro was the highest around DIV3 and DIV5 but it reduced again at DIV7 reaching levels comparable to DIV3. It is to be noted that all these changes in mRNA expression occur despite the continuous proliferation of SC in this time period (Supplementary Material, Supplementary Figure 1) suggesting that cells indeed downregulate Cad19 and Tfap2α between DIV5 and DIV7.
Taken together, these results give a clear picture of Schwann cell developmental transitions in embryonic cocultures during which SCP proliferate and also presumably migrate on developing neurites between DIV1 and DIV5. At DIV5, SCP begin their transition into iSC and at DIV7 most of the cells present on neurites are iSC.
It is interesting to note that SCP monocultures established directly from E12.5 dissociated mouse peripheral nerves transition into iSC in cultures after 4 DIV (E12.5 + 4 DIV) which corresponds exactly to their timing in vivo (Dong et al., 1999). However, it takes up to 7 DIV to achieve this transition in DRG/SC cocultures. One plausible reason for this difference is the fact that SCP monocultures are expanded in the presence of a fixed concentration of Neuregulin to mimic the trophic support from axons that in turn drives their differentiation to iSC (Dong et al., 1995; Leimeroth et al., 2002). In cocultures, however, the media is not supplemented with Neuregulin and neurites have to first emanate from the dissociated soma and achieve significant growth during the first 72 h. Therefore, it is possible that optimal levels of axonal Neuregulin are not present in the coculture system until DIV5 thereby causing a delay in the SCP/iSC transition. This hypothesis can also be extended to other axo-glial signaling pathways such as Notch signaling which is also crucial for the SCP/iSC transition (Woodhoo et al., 2009). In effect, we think that the delay in the SCP/iSC transition in cocultures is largely driven by the fact that sufficient axonal extensions (and therefore axonal differentiation and axonal cues) are only achieved between DIV5 and DIV7. However, this hypothesis warrants further experimentation.
The iSC/mSC Transition
iSC in vivo give rise to promyelinating and myelinating SC perinatally which is about 4 days after iSC emante from SCP (Salzer, 2015; Fledrich et al., 2019). Therefore, we hypothesized that if the cells at DIV7 are indeed iSC, then they should transition into pro-mSC and mSC upon the addition of AA. We were able to observe Oct6+ and Krox20+ cells after 4 days of AA supplementation (Figure 3). However, Oct6 expression in vivo is only transient, and it promotes the differentiation of pro-mSC to mSC (Jaegle et al., 1996, 2003). In other words, perinatal SC in vivo sequentially express Oct6 and Krox20 but fully mature myelinating SC do not express Oct6 postnatally.
Our data show that both these cellular phenotypes are present after 4 days of AA supplementation suggesting that iSC/mSC transition is still ongoing at this timepoint. It is also equally possible that the cells that express Krox20 at DIV7 + 4 days AA expressed Oct6 before and they have already transitioned to mSC. Therefore, further experiments are required to assess the advent and the successive extinction of Oct6 expression in this coculture system. Nevertheless, our results clearly demonstrate that iSC at DIV7 transition into mSC as early as after 4 days of AA supplementation which is comparable to their transition in vivo.
As for SC monocultures, the phenotype of SC in culture; irrespective of the source, is highly peculiar as these cells express several makers of the Schwann cell lineage including those of SCP, iSC and the repair phenotype that arises post nerve injury (Monje, 2020). In our study, we wanted to determine the myelination potency of coculture-derived SC monocultures and compare that to SC monocultures established from neonatal nerves which largely comprise of iSC and pro-mSC (Monje, 2020; Figure 4). Our observations demonstrate firstly that SC monocultures derived from DIV7 cocultures are similar to cultures established from neonatal peripheral nerves in their potential to differentiate into mSC. Secondly, and more importantly, they show that DIV7 SC in monoculture are distinct from SCP that arise between DIV1 and DIV5 in cocultures as they lack Tfap2α immunoreactivity both in proliferative and in differentiative conditions (Supplementary Figure 2). However, we have not investigated any fine phenotypic differences between neonatal SC monocultures and coculture-derived SC monocultures as it falls beyond the ambit of the present study. Nevertheless, it is an important criterion that remains to be ascertained. That being said, it would also be equally interesting to isolate SCP from cocultures before DIV5 and compare them to SCP derived directly from embryonic nerves at E12.5 to ascertain phenotypic differences, if any.
In summation and as highlighted above, our study demonstrates for the first time that the SCP/iSC transition indeed occurs in embryonic DRG/SC cocultures between DIV5 and DIV7. The further differentiation of iSC to mSC can also be observed in this model as early as 4 days post AA supplementation. These observations serve as a powerful frame of reference to design, execute and comprehend coculture experiments using different Schwann cell mutants that aim to ascertain the role of specific genes or experimental conditions in Schwann cell development and myelination.
Data Availability Statement
The original contributions presented in the study are included in the article/Supplementary Material, further inquiries can be directed to the corresponding author/s.
Ethics Statement
The animal study was reviewed and approved by INSERM and Université de Paris (authorization APAFIS#7405-2016092216181520).
Author Contributions
Conceptualization: VS, JG, and CM. Formal analysis: VS. Experiments: VS, TEJ, RB, and CF. Methodology: VS, TEJ, and JG. Validation: CM. Visualization: JG. Writing—original draft: VS. Writing—review and editing: All authors. All authors contributed to the article and approved the submitted version.
Funding
VS was funded by a PhD fellowship from the French Ministry of Research and Innovation and is currently funded by Université de Paris. RB was funded by a research fellowship from INSERM U1016, Institut Cochin, Paris and the National Council for Scientific Research Lebanon (CNRS-L). TEJ was funded by a Doctoral fellowship from Université de Paris and the National Council for Scientific Research Lebanon (CNRS-L). CF was funded by the IdEX Emergence Grant, Université de Paris, attributed to JG.
Conflict of Interest
The authors declare that the research was conducted in the absence of any commercial or financial relationships that could be construed as a potential conflict of interest.
Acknowledgments
The authors thank the Animal House Core Facility and the Cyto2BM Molecular Biology Platform of BioMedTech Facilities (INSERM US36/CNRS UMS2009) for the animals and research services pertaining to the generation of qPCR data. The authors also thank the SCM microscopy platform for the services pertaining to confocal imaging. The authors would also like to thank Prof. Dies Meijer, University of Edinburgh, for the Krox20 and Oct6 antibodies. We also thank Prof. Rhona Mirsky and Prof. Kristjan R. Jessen, University College London, for the critical reading of the preprint and for their inputs.
Footnotes
- ^ https://primer3plus.com/cgi-bin/dev/primer3plus.cgi
- ^ https://www.ensembl.org
- ^ https://imm.medicina.ulisboa.pt/group/exonmine/ack.html
Supplementary Material
The Supplementary Material for this article can be found online at: https://www.frontiersin.org/articles/10.3389/fncel.2021.590537/full#supplementary-material.
References
Andersen, C., Jensen, J., and Orntoft, T. (2004). Normalization of real–time quantitative reverse transcription–PCR data?: a model–based variance estimation approach to identify genes suited for normalization, applied to bladder and colon cancer data sets. Cancer Res. 64:5245. doi: 10.1158/0008-5472.CAN-04-0496
Arthur-Farraj, P., Wanek, K., Hantke, J., Davis, C. M., Jayakar, A., Parkinson, D. B., et al. (2011). Mouse schwann cells need both NRG1 and cyclic AMP to myelinate. Glia 59, 720–733. doi: 10.1002/glia.21144
Bacallao, K., and Monje, P. V. (2015). Requirement of cAMP signaling for schwann cell differentiation restricts the onset of myelination. PLoS One 10:e0116948. doi: 10.1371/journal.pone.0116948
Buchstaller, J., Sommer, L., Bodmer, M., Hoffmann, R., Suter, U., and Mantei, N. (2004). Efficient isolation and gene expression profiling of small numbers of neural crest stem cells and developing Schwann cells. J. Neurosci. 24, 2357–2365. doi: 10.1523/JNEUROSCI.4083-03.2004
Coulpier, F., Decker, L., Funalot, B., Vallat, J. M., Garcia-Bragado, F., Charnay, P., et al. (2010). CNS/PNS boundary transgression by central glia in the absence of Schwann cells or Krox20/Egr2 function. J. Neurosci. 30, 5958–5967. doi: 10.1002/jbmr.3847
D’Antonio, M., Michalovich, D., Paterson, M., Droggiti, A., Woodhoo, A., Mirsky, R., et al. (2006). Gene profiling and bioinformatic analysis of Schwann cell embryonic development and myelination. Glia 53, 501–515. doi: 10.1002/glia.20309
Deng, Y., Kim, B., He, X., Kim, S., Lu, C., Wang, H., et al. (2014). Direct visualization of membrane architecture of myelinating cells in transgenic mice expressing membrane-anchored EGFP. Genesis 52, 341–349. doi: 10.1002/dvg.22751
Dong, Z., Brennan, A., Liu, N., Yarden, Y., Lefkowitz, G., Mirsky, R., et al. (1995). Neu differentiation factor is a neuron-glia signal and regulates survival, proliferation and maturation of rat schwann cell precursors. Neuron 15, 585–596. doi: 10.1016/0896-6273(95)90147-7
Dong, Z., Sinanan, A., Parkinson, D., Parmantier, E., Mirsky, R., and Jessen, K. R. (1999). Schwann cell development in embryonic mouse nerves. J. Neurosci. Res. 56, 334–348. doi: 10.1002/(SICI)1097-4547(19990515)56:4<334::AID-JNR2>3.0.CO;2-#
Eldridge, C. F., Bartlett Bunge, M., and Bunge, R. P. (1989). Differentiation of axon-related Schwann cells in vitro: II. Control of myelin formation by basal lamina. J. Neurosci. 9, 625–638. doi: 10.1523/JNEUROSCI.09-02-00625.1989
Eldridge, C. F., Bunge, M. B., Bunge, R. P., and Wood, P. M. (1987). Differentiation of axon-related Schwann cells in vitro. I. Ascorbic acid regulates basal lamina assembly and myelin formation. J. Cell Biol. 105, 1023–1034. doi: 10.1083/jcb.105.2.1023
Fledrich, R., Kungl, T., Nave, K. A., and Stassart, R. M. (2019). Axo-glial interdependence in peripheral nerve development. Development 146:dev151704. doi: 10.1242/dev.151704
Ghislain, J., and Charnay, P. (2006). Control of myelination in Schwann cells: a Krox20 cis-regulatory element integrates Oct6, Brn2 and Sox10 activities. EMBO Rep. 7, 52–58. doi: 10.1038/sj.embor.7400573
Gravel, M., Di Polo, A., Valera, P. B., and Braun, P. E. (1998). Four-kilobase sequence of the mouse CNP gene directs spatial and temporal expression of lacZ in transgenic mice. J. Neurosci. Res. 53, 393–404. doi: 10.1002/(SICI)1097-4547(19980815)53:4<393::AID-JNR1>3.0.CO;2-1
Huff, T. C., Sant, D. W., Camarena, V., Van Booven, D., Andrade, N. S., Mustafi, S., et al. (2020). Vitamin C regulates Schwann cell myelination by promoting DNA demethylation of pro-myelinating genes. J. Neurochem. [Online ahead of print]. doi: 10.1111/jnc.15015
Jacob, C. (2015). Transcriptional control of neural crest specification into peripheral glia. Glia 63, 1883–1896. doi: 10.1002/glia.22816
Jaegle, M., Ghazvini, M., Mandemakers, W., Piirsoo, M., Driegen, S., Levavasseur, F., et al. (2003). The POU proteins Brn-2 and Oct-6 share important functions in Schwann cell development. Genes Dev. 17, 1380–1391. doi: 10.1101/gad.258203
Jaegle, M., Mandemakers, W., Broos, L., Zwart, R., Karis, A., Visser, P., et al. (1996). The POU factor Oct-6 and Schwann cell differentiation. Science 273, 507–510. doi: 10.1126/science.273.5274.507
Jessen, K. R., Brennan, A., Morgan, L., Mirsky, R., Kent, A., Hashimoto, Y., et al. (1994). The Schwann cell precursor and its fate: a study of cell death and differentiation during gliogenesis in rat embryonic nerves. Neuron 12, 509–527. doi: 10.1016/0896-6273(94)90209-7
Jessen, K. R., and Mirsky, R. (2005). The origin and development of glial cells in peripheral nerves. Nat. Rev. Neurosci. 6, 671–682. doi: 10.1038/nrn1746
Jessen, K. R., and Mirsky, R. (2019). Schwann cell precursors; multipotent glial cells in embryonic nerves. Front. Mol. Neurosci. 12:69. doi: 10.3389/fnmol.2019.00069
Kim, J., and Kim, H. A. (2018). Isolation and expansion of Schwann cells from transgenic mouse models. Methods Mol. Biol. 1739, 39–48. doi: 10.1007/978-1-4939-7649-2_3
Kim, H. A., and Maurel, P. (2009). “Primary schwann cell cultures,” in Protocols for Neural Cell Culture. Springer Protocols Handbooks, ed L. Doering (Switzerland: Humana Press), 253–268.
Leimeroth, R., Lobsiger, C., Lüssi, A., Taylor, V., Suter, U., and Sommer, L. (2002). Membrane-bound neuregulin1 type III actively promotes Schwann cell differentiation of multipotent progenitor cells. Dev. Biol. 246, 245–258. doi: 10.1006/dbio.2002.0670
Livak, K. J., and Schmittgen, T. D. (2001). Analysis of relative gene expression data using real-time quantitative PCR and the 2−ΔΔCT Method. Methods 25, 402–408. doi: 10.1006/meth.2001.1262
Lutz, A. B. (2014). Purification of Schwann cells from the neonatal and injured adult mouse peripheral nerve. Cold Spring Harb. Protoc. 2014, 1234–1236. doi: 10.1101/pdb.top073981
Mollet, I. G., Ben-Dov, C., Felício-Silva, D., Grosso, A. R., Eleutério, P., Alves, R., et al. (2010). Unconstrained mining of transcript data reveals increased alternative splicing complexity in the human transcriptome. Nucleic Acids Res. 38, 4740–4754. doi: 10.1093/nar/gkq197
Monje, P. V. (2020). Schwann cell cultures: biology, technology and therapeutics. Cells 9:1848. doi: 10.3390/cells9081848
Monk, K. R., Feltri, M. L., and Taveggia, C. (2015). New insights on schwann cell development. Glia 63, 1376–1393. doi: 10.1002/glia.22852
Päiväläinen, S., Nissinen, M., Honkanen, H., Lahti, O., Kangas, S. M., Peltonen, J., et al. (2008). Myelination in mouse dorsal root ganglion/Schwann cell cocultures. Mol. Cell. Neurosci. 37, 568–578. doi: 10.1016/j.mcn.2007.12.005
Ratner, N., Williams, J. P., Kordich, J. J., and Kim, H. A. (2005). Schwann cell preparation from single mouse embryos: analyses of neurofibromin function in Schwann cells. Methods Enzymol. 407, 22–33. doi: 10.1016/S0076-6879(05)07003-5
Salzer, J. L. (2015). Schwann cell myelination. Cold Spring Harb. Perspect. Biol. 7, 1–26. doi: 10.1101/cshperspect.a020529
Schmittgen, T. D., and Livak, K. J. (2008). Analyzing real-time PCR data by the comparative C(T) method. Nat. Protoc. 3, 1101–1108. doi: 10.1038/nprot.2008.73
Stewart, H. J., Brennan, A., Rahman, M., Zoidl, G., Mitchell, P. J., Jessen, K. R., et al. (2001). Developmental regulation and overexpression of the transcription factor AP-2, a potential regulator of the timing of Schwann cell generation. Eur. J. Neurosci. 14, 363–372. doi: 10.1046/j.0953-816x.2001.01650.x
Sundaram, V. K., Sampathkumar, N. K., Massaad, C., and Grenier, J. (2019). Optimal use of statistical methods to validate reference gene stability in longitudinal studies. PLoS One 14:e0219440. doi: 10.1371/journal.pone.0219440
Takahashi, M., and Osumi, N. (2005). Identification of a novel type II classical cadherin: rat cadherin19 is expressed in the cranial ganglia and Schwann cell precursors during development. Dev. Dyn. 232, 200–208. doi: 10.1002/dvdy.20209
Taveggia, C., and Bolino, A. (2018). DRG neuron/schwann cells myelinating cocultures. Methods Mol. Biol. 1791, 115–129. doi: 10.1007/978-1-4939-7862-5_9
Topilko, P., Schneider-Maunoury, S., Levi, G., Baron-Van Evercooren, A., Chennoufi, A. B. Y., Seitanidou, T., et al. (1994). Krox-20 controls myelination in the peripheral nervous system. Nature 371, 796–799. doi: 10.1038/371796a0
Voiculescu, O., Charnay, P., and Schneider?Maunoury, S. (2000). Expression pattern of a Krox-20/Cre knock?in allele in the developing hindbrain, bones and peripheral nervous system. Genesis 26, 123–126. doi: 10.1002/(sici)1526-968x(200002)26:2<123::aid-gene7>3.0.co;2-o
Woodhoo, A., Alonso, M. B. D., Droggiti, A., Turmaine, M., D’Antonio, M., Parkinson, D. B., et al. (2009). Notch controls embryonic Schwann cell differentiation, postnatal myelination and adult plasticity. Nat. Neurosci. 12, 839–847. doi: 10.1038/nn.2323
Woodhoo, A., and Sommer, L. (2008). Development of the schwann cell lineage: from the neural crest to the myelinated nerve. Glia 56, 1481–1490. doi: 10.1002/glia.20723
Keywords: Schwann cell development, dissociated DRG/SC cocultures, Schwann cell precursors, immature Schwann cells, myelinating Schwann cells
Citation: Sundaram VK, El Jalkh T, Barakat R, Fernandez CJI, Massaad C and Grenier J (2021) Retracing Schwann Cell Developmental Transitions in Embryonic Dissociated DRG/Schwann Cell Cocultures in Mice. Front. Cell. Neurosci. 15:590537. doi: 10.3389/fncel.2021.590537
Received: 01 August 2020; Accepted: 20 April 2021;
Published: 20 May 2021.
Edited by:
Arturo Ortega, Centro de Investigación y de Estudios Avanzados del Instituto Politécnico Nacional, MexicoReviewed by:
Klintsy Julieta Torres-Hernández, Instituto Nacional de Enfermedades Respiratorias-México (INER), MexicoSabine Wislet, University of Liège, Belgium
Copyright © 2021 Sundaram, El Jalkh, Barakat, Fernandez, Massaad and Grenier. This is an open-access article distributed under the terms of the Creative Commons Attribution License (CC BY). The use, distribution or reproduction in other forums is permitted, provided the original author(s) and the copyright owner(s) are credited and that the original publication in this journal is cited, in accordance with accepted academic practice. No use, distribution or reproduction is permitted which does not comply with these terms.
*Correspondence: Venkat Krishnan Sundaram, dmVua2F0a3Jpc2huYW4uc3VuZGFyYW1AdS1wYXJpcy5mcg==; Julien Grenier, anVsaWVuLmdyZW5pZXJAdS1wYXJpcy5mcg==
†ORCID: Venkat Krishnan Sundaram, orcid.org/0000-0001-6024-6959; Julien Grenier, orcid.org/0000-0002-1897-1329