 Yuki Kajita
 Hajime Mushiake
94% of researchers rate our articles as excellent or good
Learn more about the work of our research integrity team to safeguard the quality of each article we publish.
Find out more
ORIGINAL RESEARCH article
Front. Behav. Neurosci., 03 November 2021
Sec. Pathological Conditions
Volume 15 - 2021 | https://doi.org/10.3389/fnbeh.2021.750869
This article is part of the Research TopicNeural Oscillations in Physiology and Neuropsychiatric DisordersView all 10 articles
Gamma-aminobutyric acid (GABA), a major inhibitory transmitter in the central nervous system, is synthesized via either of two enzyme isoforms, GAD65 or GAD67. GAD65 is synthesized in the soma but functions at synaptic terminals in an activity-dependent manner, playing a distinct role in excitatory-inhibitory balance. However, the extent to which each GABAergic subtype expresses GAD65 in the resting state remains unclear. In this study, we compared GAD65 expression among six GABAergic subtypes: NPY+, nNOS+, PV+, SOM+, CR+, and CCK+. According to the results, the GABAergic subtypes were classified into two groups per region based on GAD65 expression levels: high-expression (NPY+ and nNOS+) and low-expression groups (PV+, SOM+, CR+, and CCK+) in the cerebral cortex and high-expression (NPY+, nNOS+, and CCK+) and low-expression groups (PV+, SOM+, and CR+) in the hippocampus. Moreover, these expression patterns revealed a distinct laminar distribution in the cerebral cortex and hippocampus. To investigate the extent of GAD65 transport from the soma to synaptic terminals, we examined GAD65 expression in colchicine-treated rats in which GAD65 was synthesized in the soma but not transported to terminals. We found a significant positive correlation in GAD65 expression across subtypes between colchicine-treated and control rats. In summary, each GABAergic subtype exhibits a distinct GAD65 expression pattern across layers of the cerebral cortex and hippocampus. In addition, the level of GAD65 expression in the soma can be used as a proxy for the amount of GAD65 in the cytoplasm. These findings suggest that exploration of the distinct profiles of GAD65 expression among GABAergic subtypes could clarify the roles that GABAergic subtypes play in maintaining the excitatory-inhibitory balance.
The inhibitory neurotransmitter gamma-aminobutyric acid (GABA) is widely distributed in the central nervous system and is synthesized from glutamate via two isoforms of glutamic acid decarboxylase (GAD): GAD67 and GAD65. These two isoforms are encoded by distinct genes but are co-expressed in most GABAergic interneurons (Erlander et al., 1991; Feldblum et al., 1993). The mRNA (Dicken et al., 2015) and protein (Rimvall et al., 1993) expression of GAD67 is closely related to GABA content, as GAD67 is responsible for basal and tonic GABA synthesis (Asada et al., 1997; Chattopadhyaya et al., 2007; Obata et al., 2008). On the other hand, GAD65 has a high affinity for the cofactor pyridoxal 5′-phosphate (Martin and Rimvall, 1993), and localizes strongly in axon terminals rather than in the soma (Esclapez et al., 1994). In addition, repeated electrical stimulation has been shown to increase GABA contents and its release (Bowdler et al., 1983) while increasing GAD65 expression (Jinno and Kosaka, 2009). These previous data suggest that GAD65 expression is closely related to activity-dependent and phasic GABA synthesis.
GAD67 and GAD65 expression are not evenly distributed within GABAergic neurons in various brain regions, including the cerebral cortex and hippocampus (Esclapez et al., 1994; Hendrickson et al., 1994; Houser and Esclapez, 1994). In particular, GAD65 expression in the soma is heterogeneous compared with that of GAD67 (Guo et al., 1997). Although the drivers of GAD65 expression remain unknown, this heterogeneous expression may depend on the diversity of GABAergic neuron properties. One previous study showed that GAD65 expression is lower in calcium-binding protein parvalbumin-positive (PV+) cells in the hippocampus (Fukuda et al., 1997), suggesting that GAD65 expression depends on the interneuron subtype. GABAergic neurons are classified into multiple subtypes in addition to PV+ cells based on chemical markers (Hendry et al., 1984; Gonchar and Burkhalter, 1997; Kubota and Kawaguchi, 1997; Jinno et al., 2001; Kawaguchi and Kondo, 2002; Gonchar et al., 2007). Elucidating the relationship between GABAergic subtypes and GAD65 expression would clarify the roles of GABAergic subtypes in activity-dependent and phasic inhibition under pathological conditions such as epileptic seizures and mental disorders.
To achieve this purpose, we compared GAD65 expression among several subtypes of neurons in the cerebral cortex and hippocampus under normal conditions. Although a variety of markers can be used to identify GABAergic subtypes, we followed the classification described in previous reports (Druga, 2009; Tricoire et al., 2010; Rudy et al., 2011; Tricoire and Vitalis, 2012; Perrenoud et al., 2013; Tremblay et al., 2016) and analyzed the following six subtypes: PV+ neurons, somatostatin-positive (SOM+) neurons, calretinin-positive (CR+) neurons, cholecystokinin-positive (CCK+) neurons, neuropeptide Y-positive (NPY+) neurons, and neuronal nitric oxide synthase-positive (nNOS+) neurons. This classification system was shared between the cerebral cortex and hippocampus. We also compared the laminar distribution of GAD65 expression by dividing the cerebral cortex and hippocampus into three layers: the superficial layer, pyramidal layer and deep layer. Additionally, to confirm that somatic expression reflects expression throughout the cytoplasm, we performed the same experiments using colchicine, which blocks axonal transport.
Briefly, each GABAergic subtype exhibited a distinct GAD65 expression pattern across the cerebral cortical and hippocampal layers. Additionally, GAD65 expression in the soma of different subtypes was significantly and positively correlated between colchicine-treated and control rats.
We used male 8–12 weeks old Long-Evans rats (Institute for Animal Reproduction, Kasumigaura, Ibaraki, Japan, http://www.iar.or.jp) weighing 300–500 g each. These rats were housed in groups in a temperature- and humidity-controlled room under a 12-h-light/12-h-dark cycle with food and water available ad libitum. Efforts were made to minimize the number of animals used, as well as their pain and discomfort. All animal treatments were approved by the Tohoku University Committee for Animal Research, Seiryo Campus (Sendai, Japan).
To block axonal transport, colchicine (Sigma-Aldrich, Tokyo, Japan) dissolved in saline (100 μg/10 μl) was stereotactically injected 5 μl of solution into the bilateral lateral ventricle of the brain. Control group was injected equal (5 μl) volume of saline into the bilateral lateral ventricle of the brain. The surgery was performed under inhalation anesthesia with isoflurane (1–3%, Pfizer, Tokyo, Japan). 2 days later, the brains were processed for immunohistochemical investigation, as described below.
Under deep nembutal anesthesia (Somnopentyl, 250 mg/kg body weight, intraperitoneally, Kyoritsu Seiyaku Co., Ltd., Tokyo Japan), the rats were transcardially perfused with saline containing 2 IU/mL heparin and then with 4% paraformaldehyde in 0.1M phosphate buffer (pH 7.4). The brains were removed and post-fixed in formaldehyde solution for 24 h at 4°C. Then, the brains were immersed in 30% sucrose solution in phosphate-buffered saline (PBS) for at least 24 h, and coronal sections (30 μm thick) were cut using a cryostat (Leica CM1950, Leica Microsystems, Nussloch, Germany).
The sections were washed in PBS for 10 min. After blocking with 3% bovine serum albumin in PBS for 1 h, the sections were incubated with primary antibodies overnight at 4°C and washed with PBS. The following antibodies were used in this study: mouse monoclonal anti-GAD65 antibody (1:300, BD Biosciences, San Jose, CA, United States), rabbit polyclonal anti-parvalbumin antibody (1:500, Abcam, Cambridge, United Kingdom), rabbit polyclonal anti-somatostatin antibody (1:500; Peninsula Lab, San Carlos, CA, United States), rabbit polyclonal anti-calretinin antibody (1:500, Proteintech group, Inc., Chicago, IL, United States), rabbit polyclonal anti-cholecystokinin antibody (1:100, Cloud-Clone Corp, Carlsbad, CA, United States), rabbit polyclonal anti-neuropeptide Y antibody (1:100, Proteintech group, Inc.), rabbit polyclonal anti-neuronal nitric oxide synthase antibody (1:800, Merck-Millipore, Temecula, CA, United States) and rabbit polyclonal anti-vesicular GABA transporter (VGAT) antibody (1:500, Gene Tex, Los Angeles, CA, United States). After washing three times with PBS, the brain sections were incubated with an appropriate species-specific secondary antibody for 1 h−Alexa Fluor 488-conjugated goat anti-mouse immunoglobin (Ig) G (1:200, Abcam) or Alexa Fluor 647-conjugated goat anti-rabbit IgG (1:200, Merck-Millipore)−and then with 4′,6-diamidino-2-phenylindole dihydrochloride (DAPI) solution (1:500, Dojindo, Kamimashiki, Japan). After three washes with PBS, the sections were mounted using Fluoromount (Diagnostic BioSystems, Pleasanton, CA, United States).
We observed samples under a confocal microscope (Zeiss LSM 800, Carl Zeiss, Jena, Germany) with a 20 × (NA 0.80) or 63 × (NA 1.4) objective lens (LSM 800, Carl Zeiss). Images were captured using a charge-coupled device camera (Axio-Cam MRm, Carl Zeiss), transferred to a computer, and analyzed using ZEN software (Carl Zeiss).
In the cerebral cortex, we examined the primary motor area, primary somatosensory area and posterior parietal association area. Since we could not reliably divide these cortical areas, we did not analyze the differences among these cerebral cortical areas. For the same reason, we also divided the cortex into three layers (Layer II, III, and IV are not distinguished) the superficial (II–IV), pyramidal (V), and deep (VI) layers (Figure 1A: upper inset; Figure 1B). Layer I was not included in the superficial layer in this study, as this layer contains very few cells of GABAergic subtypes other than CR+ and nNOS+ neurons (Kubota et al., 2011).
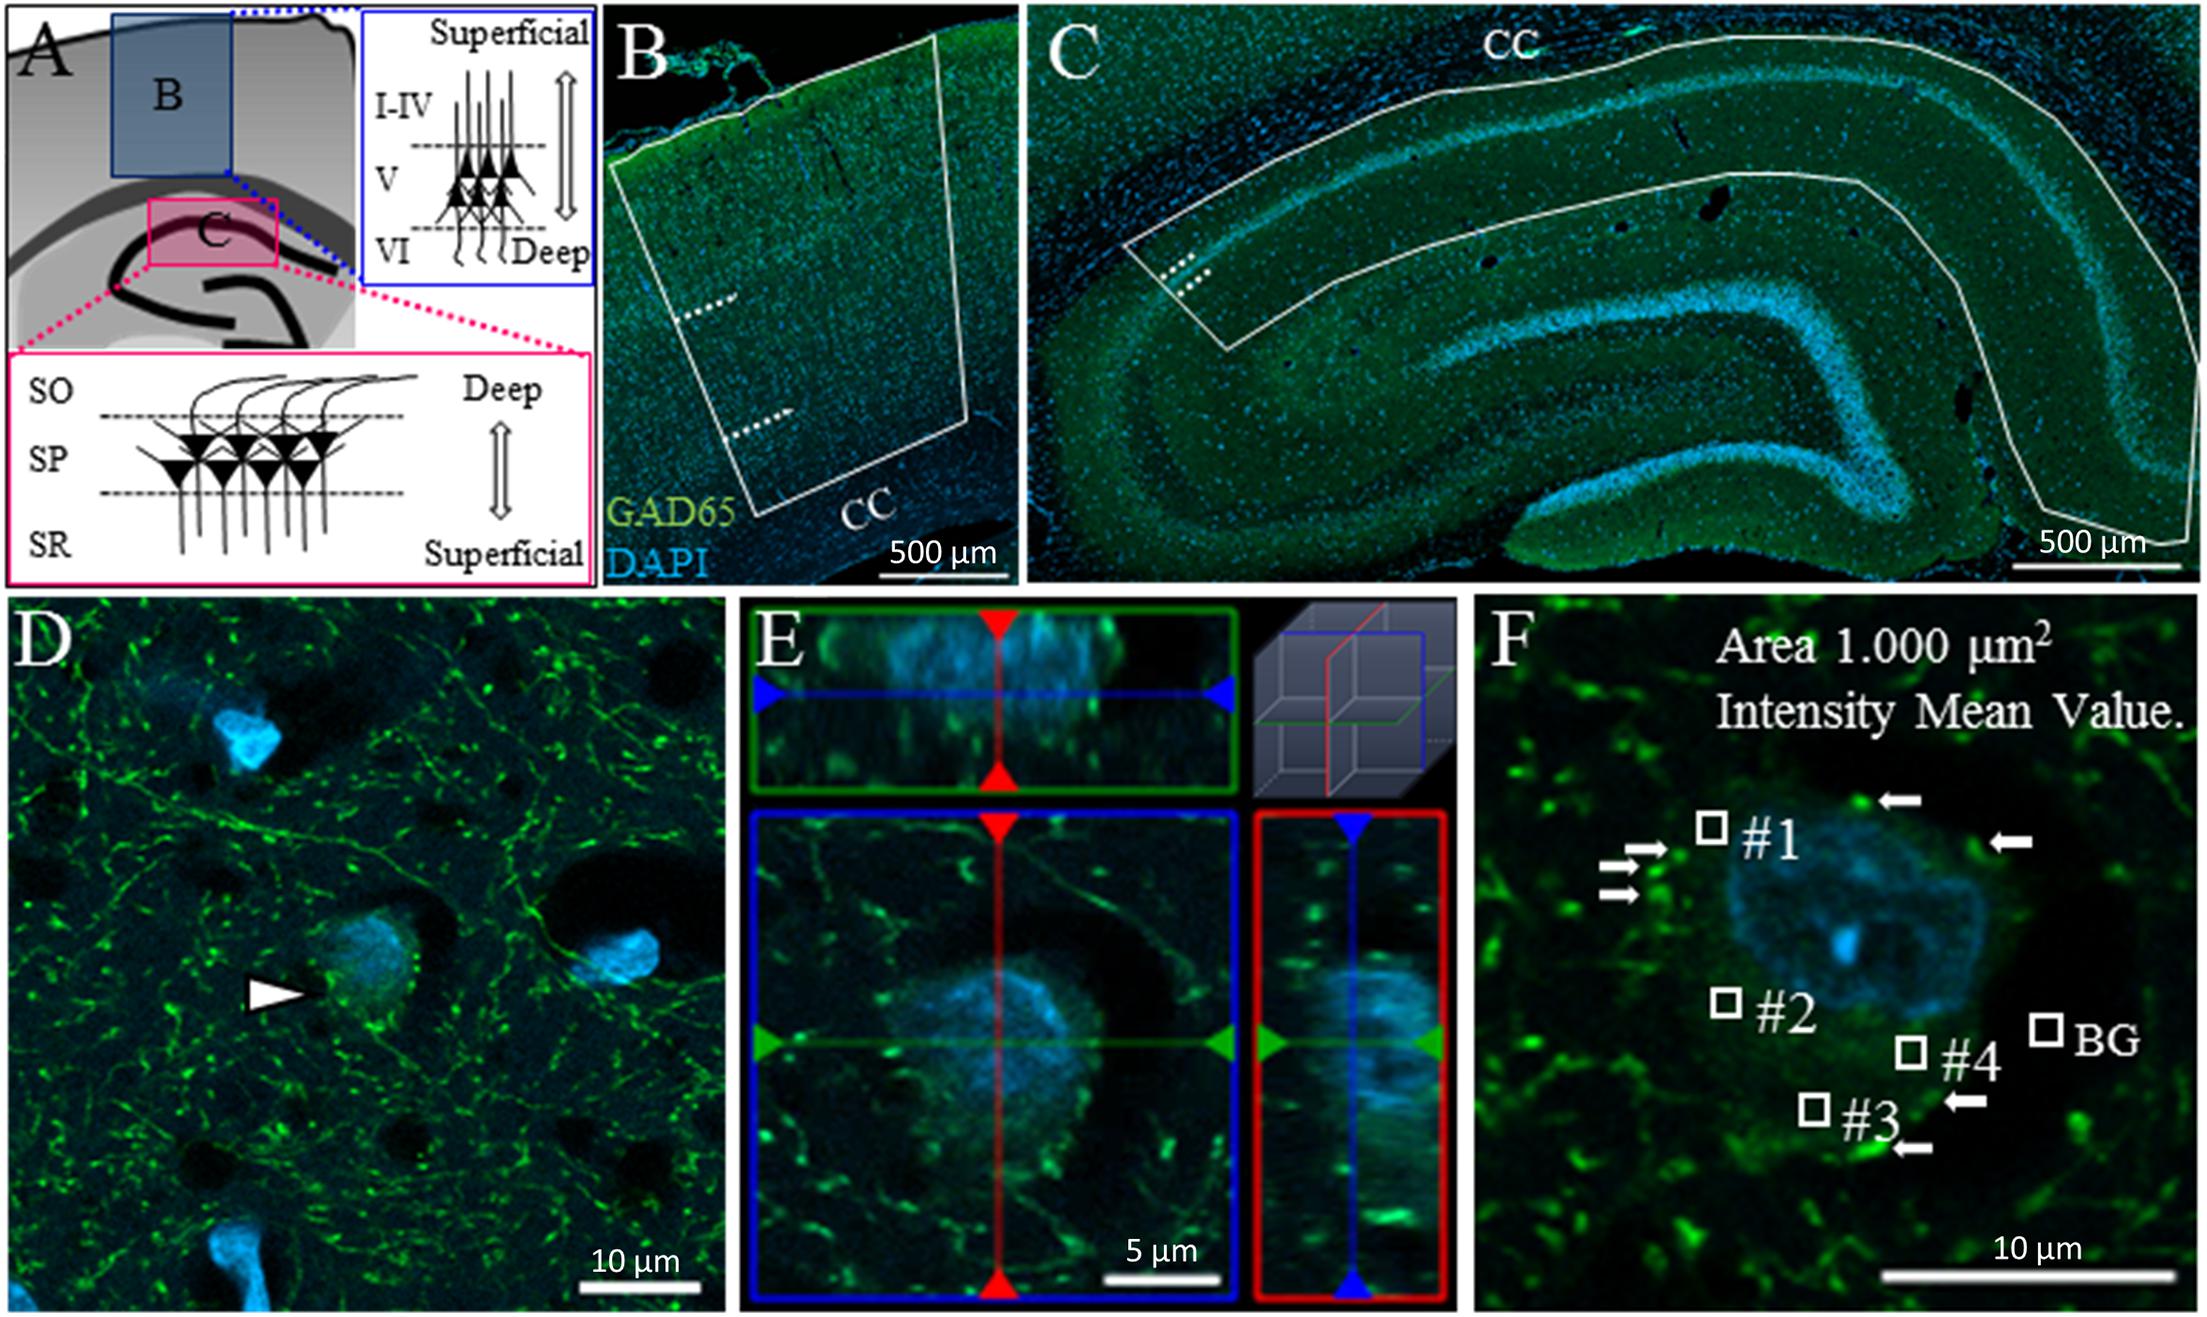
Figure 1. Measuring GAD65 staining intensity in somata in the cerebral cortex and hippocampus. Schematic drawing of a coronal section of an adult rat brain showing the cerebral cortex (A: upper inset B) and hippocampus (A: lower inset C). The cerebral cortex and hippocampus were each divided into three layers. Solid lines and dashed lines indicate the region of interest and the boundaries between layers, respectively, in the cerebral cortex (B) and hippocampus (C). The area of GAD65 expression in the soma was surrounded by synaptic buttons in the 2D (D: arrowhead) and 3D images (E: ortho-image from the x, y, and z planes). The level of GAD65 expression was calculated by subtracting the background (BG) intensity from the average intensity of four squares (F). CC, corpus callosum.
In the hippocampus, we examined the CA1 region in the dorsal hippocampus. The hippocampal CA1 region was divided into three layers: the superficial [stratum radiatum (SR)], pyramidal [stratum pyramidale (SP)], and deep [stratum oriens (SO)] layers (Figure 1A: lower inset; Figure 1C).
We measured the intensity of GAD65 expression in somata but not in synaptic buttons. In two-dimensional (2D) images, distinguishing GAD65 expression in the soma from that in synaptic buttons is technically difficult. Figure 1D shows an example of a GAD65-positive (GAD65+: green) cell in the hippocampus (arrowhead). The nucleolus was stained with DAPI (blue). GAD65 expression was observed in the soma and perisomatic region. Such perisomatic staining shows synaptic buttons (axon terminals) as somatic inputs because GAD65 is localized to axon terminals but not to dendrites (Kanaani et al., 2002).
To distinguish the GAD65 staining in somata from that in axon terminals, we followed the criteria proposed by Jinno and Kosaka (2009). According to their criteria, we captured serial stacks of optical sections at 1-μm intervals using confocal microscopy with a z-stack system, as cell bodies (>2 μm) appear in multiple adjacent sections, whereas buttons (<2 μm) do not appear in more than two optical sections. To validate these criteria for GAD65 staining, we reconstructed the GAD65+ cell in a three-dimensional (3D) image (Figure 1E) and then confirmed that these criteria can be used to successfully distinguish between GAD65 expression in the soma and that in synaptic buttons. The reconstruction of 3D images has been described previously (Kajita et al., 2017).
To measure GAD65 intensity in the soma, we randomly set four squares within each soma, avoiding the nucleus and buttons (arrows), and measured the average intensity within those squares (0, no signal; 255, maximum level; Figure 1F). The average intensity over the four squares was used as the datapoint for GAD65 intensity after the subtraction of background signals. To avoid measuring out-of-focus cells, we selected only cells with clear DAPI staining. To measure GAD65 intensity in the synaptic buttons, we selected the 50 synaptic buttons from VGAT staining, and the average intensity was used as the data point after the subtraction of background signals. The density of VGAT was measured in unit area (/100 μm2). The average density of 25 unit areas was used as the datapoint for VGAT density per brain. Data were collected in Excel (Microsoft, Redmond, WA, United States) for further analysis. All data were calculated with the truncation of numbers beyond the third or fourth decimal place.
We used IBM SPSS Statistics for Windows software (version 21.0 [released 2012], IBM Corp., Armonk, NY, United States) for statistical analysis and performed Welch’s t-test, Mann–Whitney U Test, two-way analysis of variance (ANOVA) followed by Bonferroni’s post hoc tests, and Pearson’s correlation test. Values are presented as the mean ± standard error of the mean (SEM). Groups were compared using thresholds for significance of 0.05 and 0.01.
We immunostained for GAD65 in the cerebral cortex; a typical image captured via confocal microscopy is shown in Figure 2A (GAD65: green; DAPI: blue). GAD65 expression was detected throughout the imaged region, except in the corpus callosum. All six GABAergic subtypes were detected across layers II–VI. On the other hand, only CR+ and nNOS+ neurons were detected in layer I. We present representative high-magnification images of the six GABAergic subtypes in the superficial (II–IV) layer in Figures 2B–G, which show triple signals of GAD65 immunofluorescence (green), the GABAergic subtype (magenta), and DAPI staining (blue).
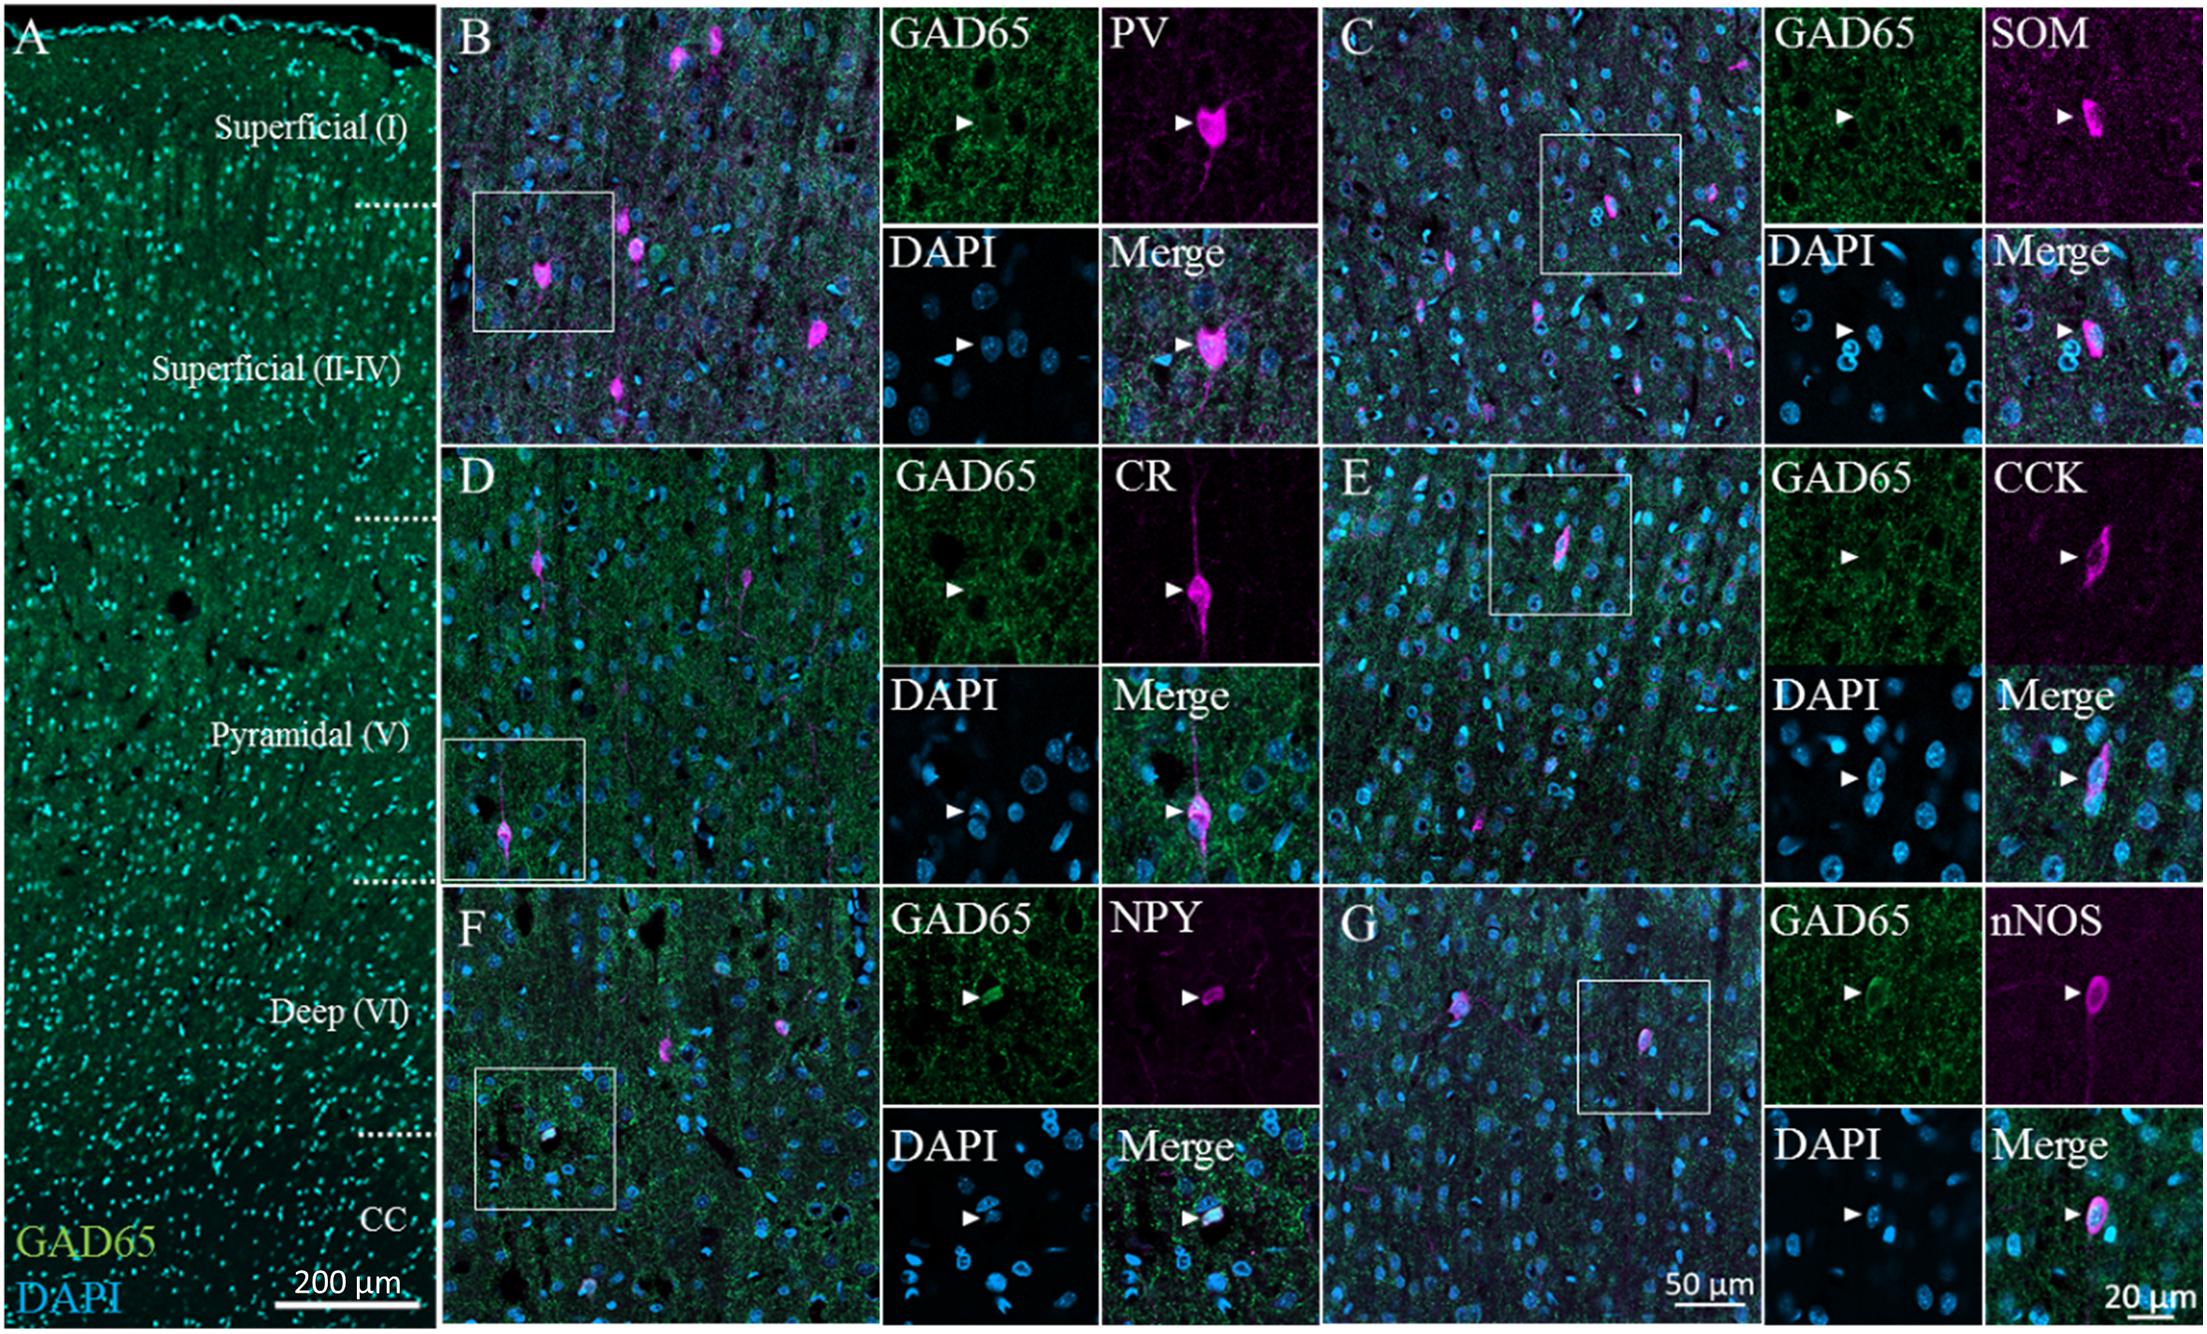
Figure 2. GAD65 expression in each GABAergic subtype in the cerebral cortex. Double immunofluorescence image of GAD65 (green) and DAPI (blue) signals (A). Triple immunofluorescence images showing GAD65 expression (green); positive signals for PV, SOM, CR, CCK, NPY, or nNOS (magenta); and DAPI staining (blue) in the superficial (II–IV) layer (B–G). White squares indicate the regions enlarged in the panels on the right, and arrowheads indicate somata.
We plotted GAD65 intensity among the six subtypes present in those three layers in Figure 3. Further details are provided in Table 1.
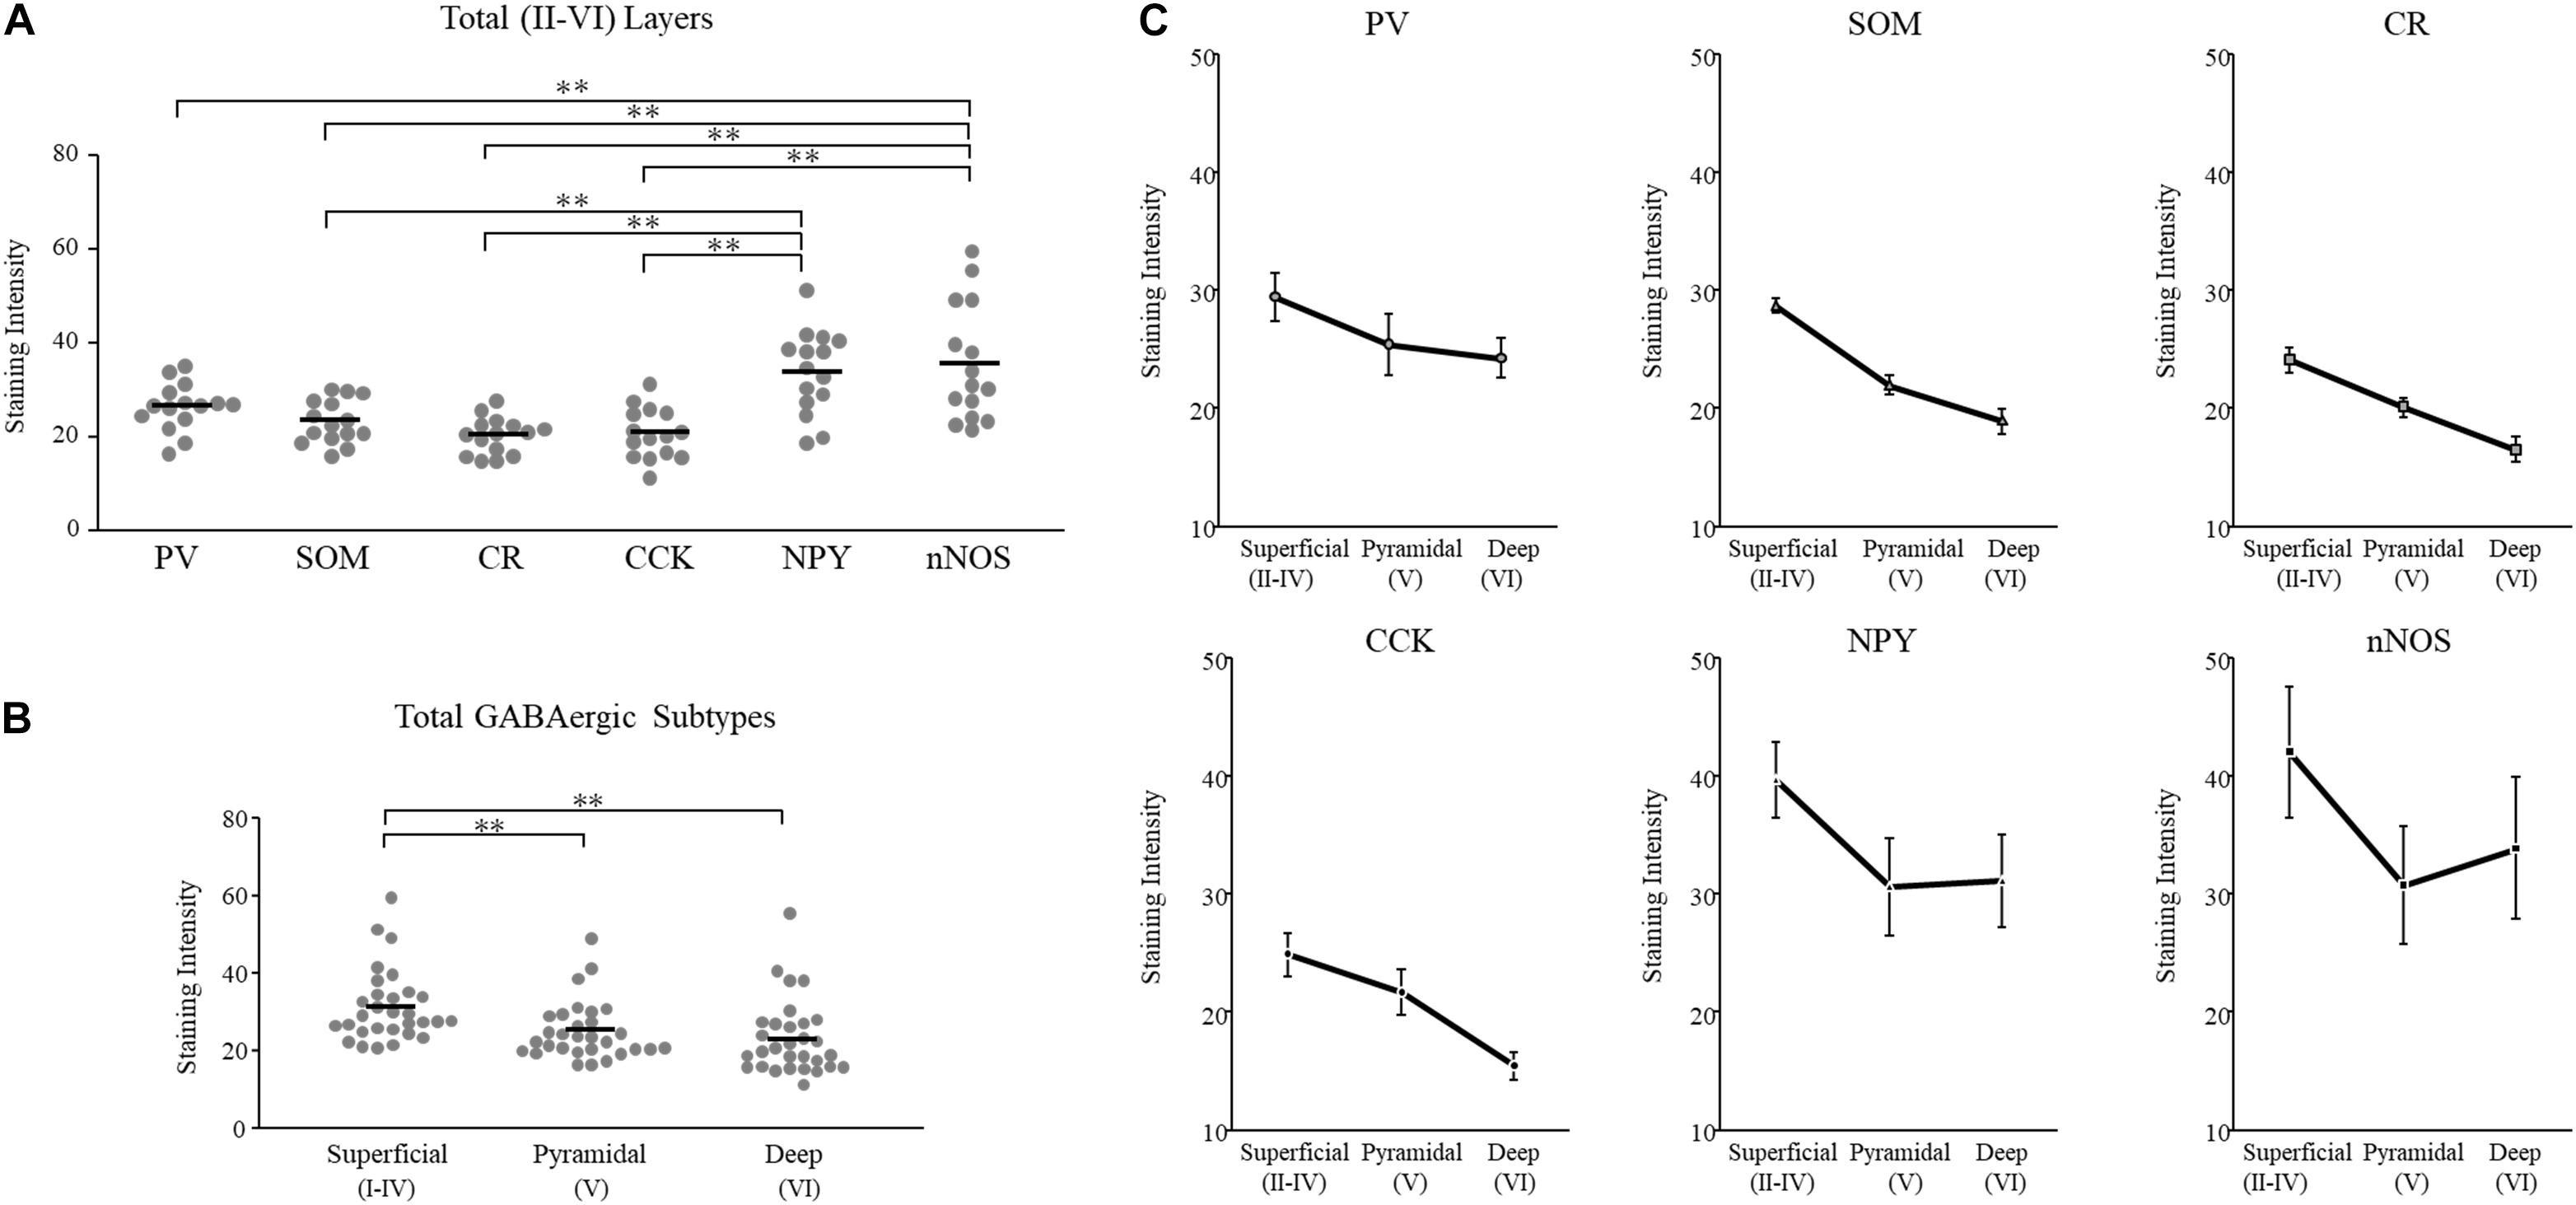
Figure 3. GAD65 expression in each GABAergic subtype across layers of the cerebral cortex (n = 5 brains). The average intensity of GAD65 immimostaining among six GABAergic subtypes (A). The average intensity of GAD65 immunostaining among the superficial (II–IV), pyramidal (V), and deep (VI) layers (B). The average intensity of GAD65 immunostaining across layers of the cerebral cortex among six GABAergic subtypes (C). Error bars indicate SEM. Two-way ANOVA followed by Bonferroni’s tests was used to compare the expression level. ∗∗p < 0.01.
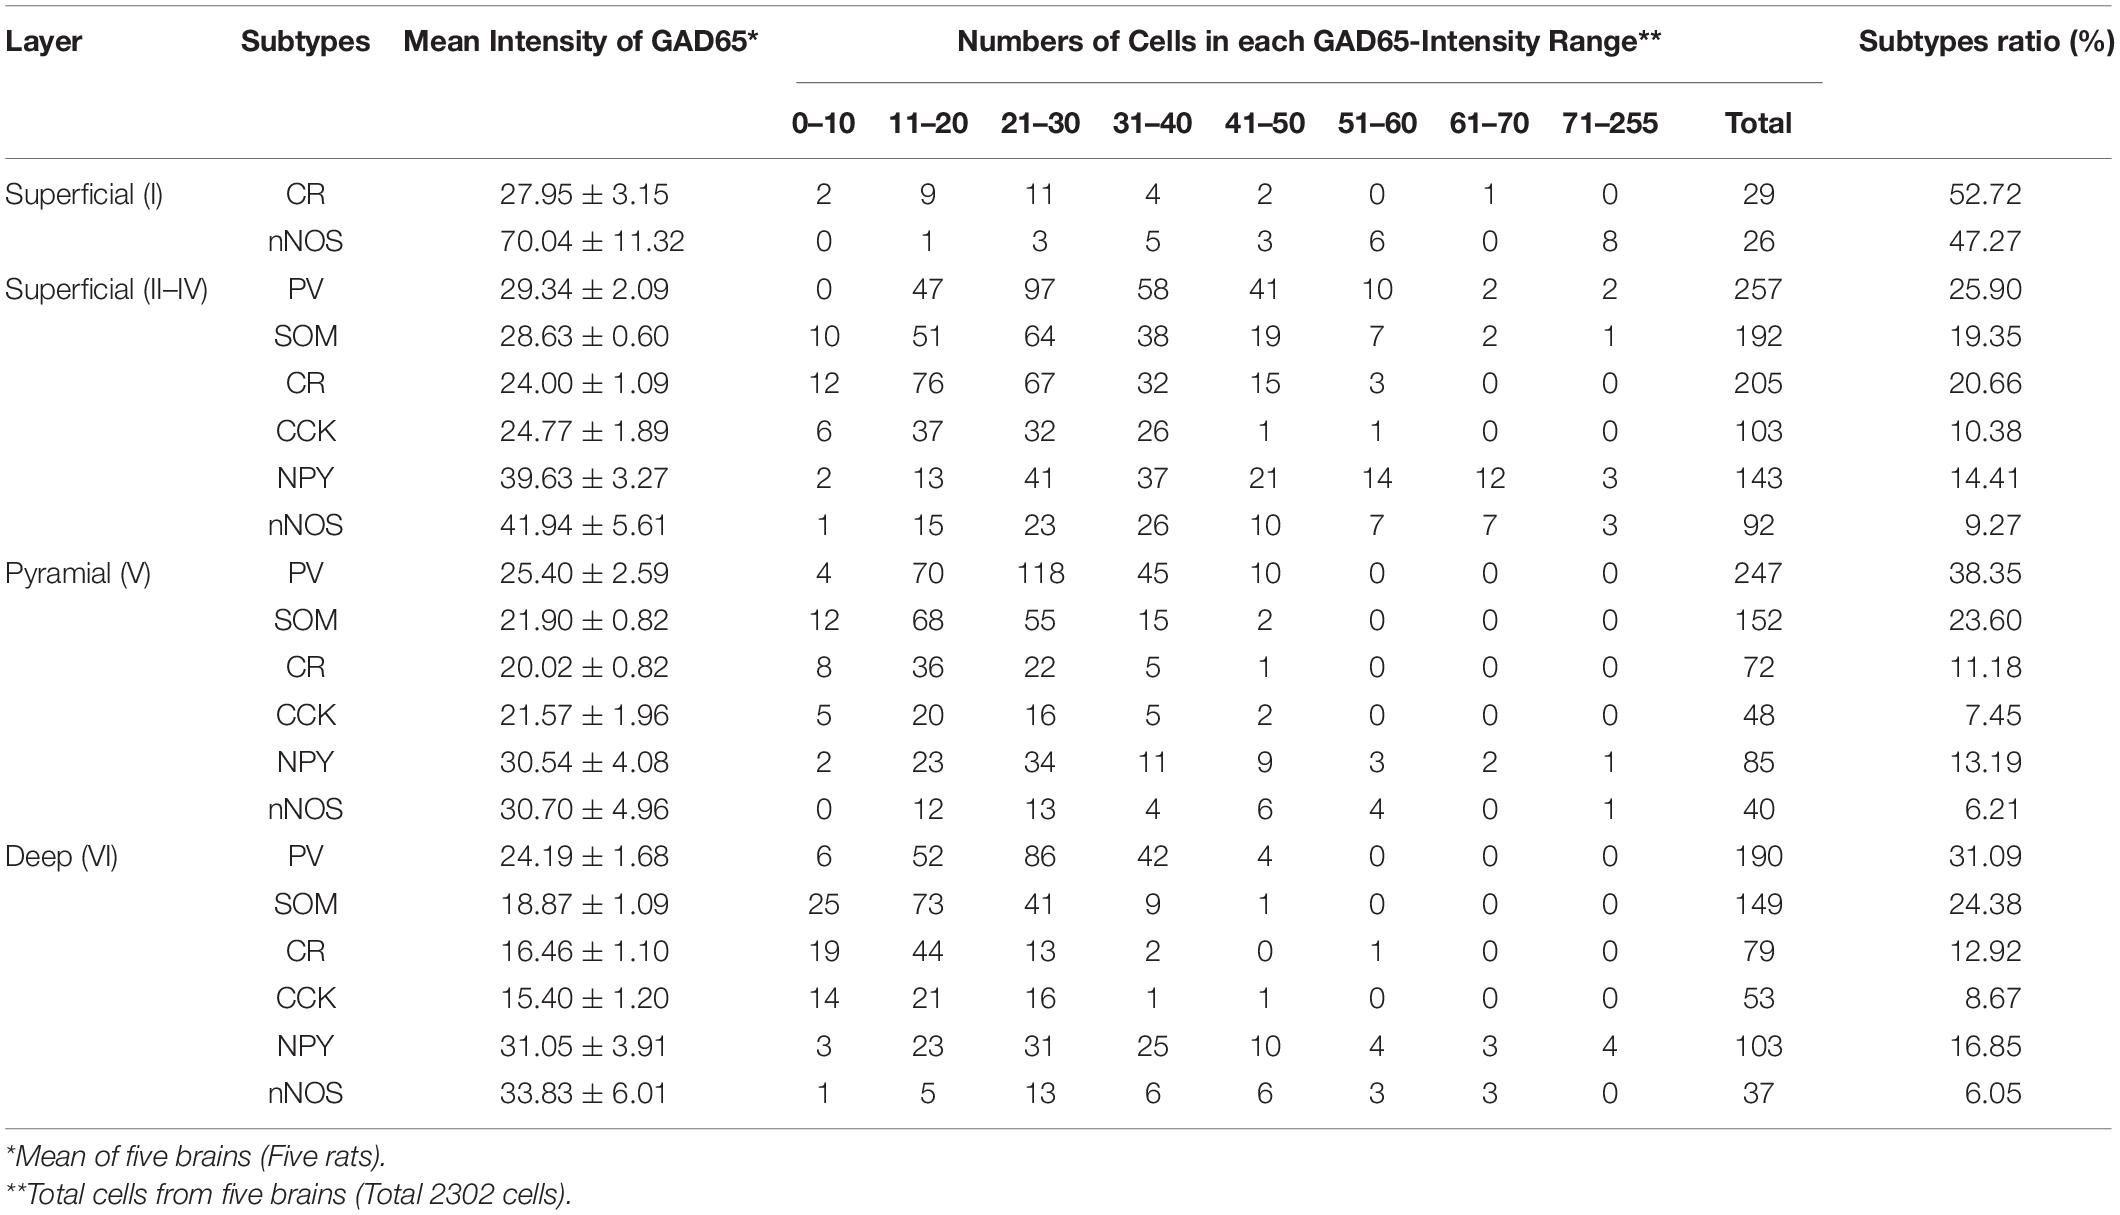
Table 1. GAD65 Expression in Cerebral Cortical Layers Based on GAD65 Staining Intensity.
To examine subtype- and layer-related specificity, we statistically analyzed the GAD65 staining intensity using two-way ANOVA (subtype × layer). The statistical analysis showed significant main effects due to the subtype and layer type (subtypes: p = 0.000; layers: p = 0.000), but their interaction was not significant.
To compare the GAD65 staining intensity among the six subtypes, we performed multiple comparison analysis using Bonferroni’s post hoc method. The GAD65 staining intensity was significantly higher in NPY+ and nNOS+ neurons than in other subtypes (NPY+ vs. SOM+, p = 0.001; vs. CR+, p = 0.000; vs. CCK+, p = 0.000), (nNOS+ vs. PV+, p = 0.006; vs. SOM+, p = 0.000; vs. CR+, p = 0.000; vs. CCK+, p = 0.000; Figure 3A). The difference between NPY+ and PV+ neurons was not quite significant. In the superficial (I) layer, Welch’s t-test revealed that the GAD65 staining intensity was significantly higher in nNOS+ neurons than in CR+ neurons (p = 0.018).
Based on these statistical analysis, we classified GABAergic subtypes into two groups: high GAD65 (NPY+ and nNOS+) and low GAD65 (PV+, SOM+, CR+, and CCK+) neurons in the cerebral cortex.
To compare the GAD65 staining intensity among layers of the cerebral cortex, we performed multiple comparison analysis using Bonferroni’s post hoc method. The GAD65 staining intensity was significantly higher in the superficial (II–IV) layer than in the pyramidal (V; p = 0.002) and deep (VI; p = 0.000) layers (Figure 3B).
Based on these results, GAD65 expression is higher in the superficial layer than in other layers of the cerebral cortex. The GAD65 staining intensity among layers in each subtype was shown in Figure 3C. In the cerebral cortex there was no significant interaction (subtype × layer). We did not perform statistical analysis among the six subtypes in each three layer, or among three layers in each six subtype.
Next, we immunostained for GAD65 in the CA1 region of the hippocampus; a typical image from confocal microscopy can be seen in Figure 4A (GAD65: green; DAPI: blue). GAD65 expression was detected across the entire region excluding the corpus callosum. We detected all six GABAergic subtypes, and high-magnification examples of each subtype as observed in the superficial (SR) layer can be found in Figures 4B–G, which show triple signals of GAD65 immunofluorescence (green), the GABAergic subtype (magenta), and DAPI staining (blue).
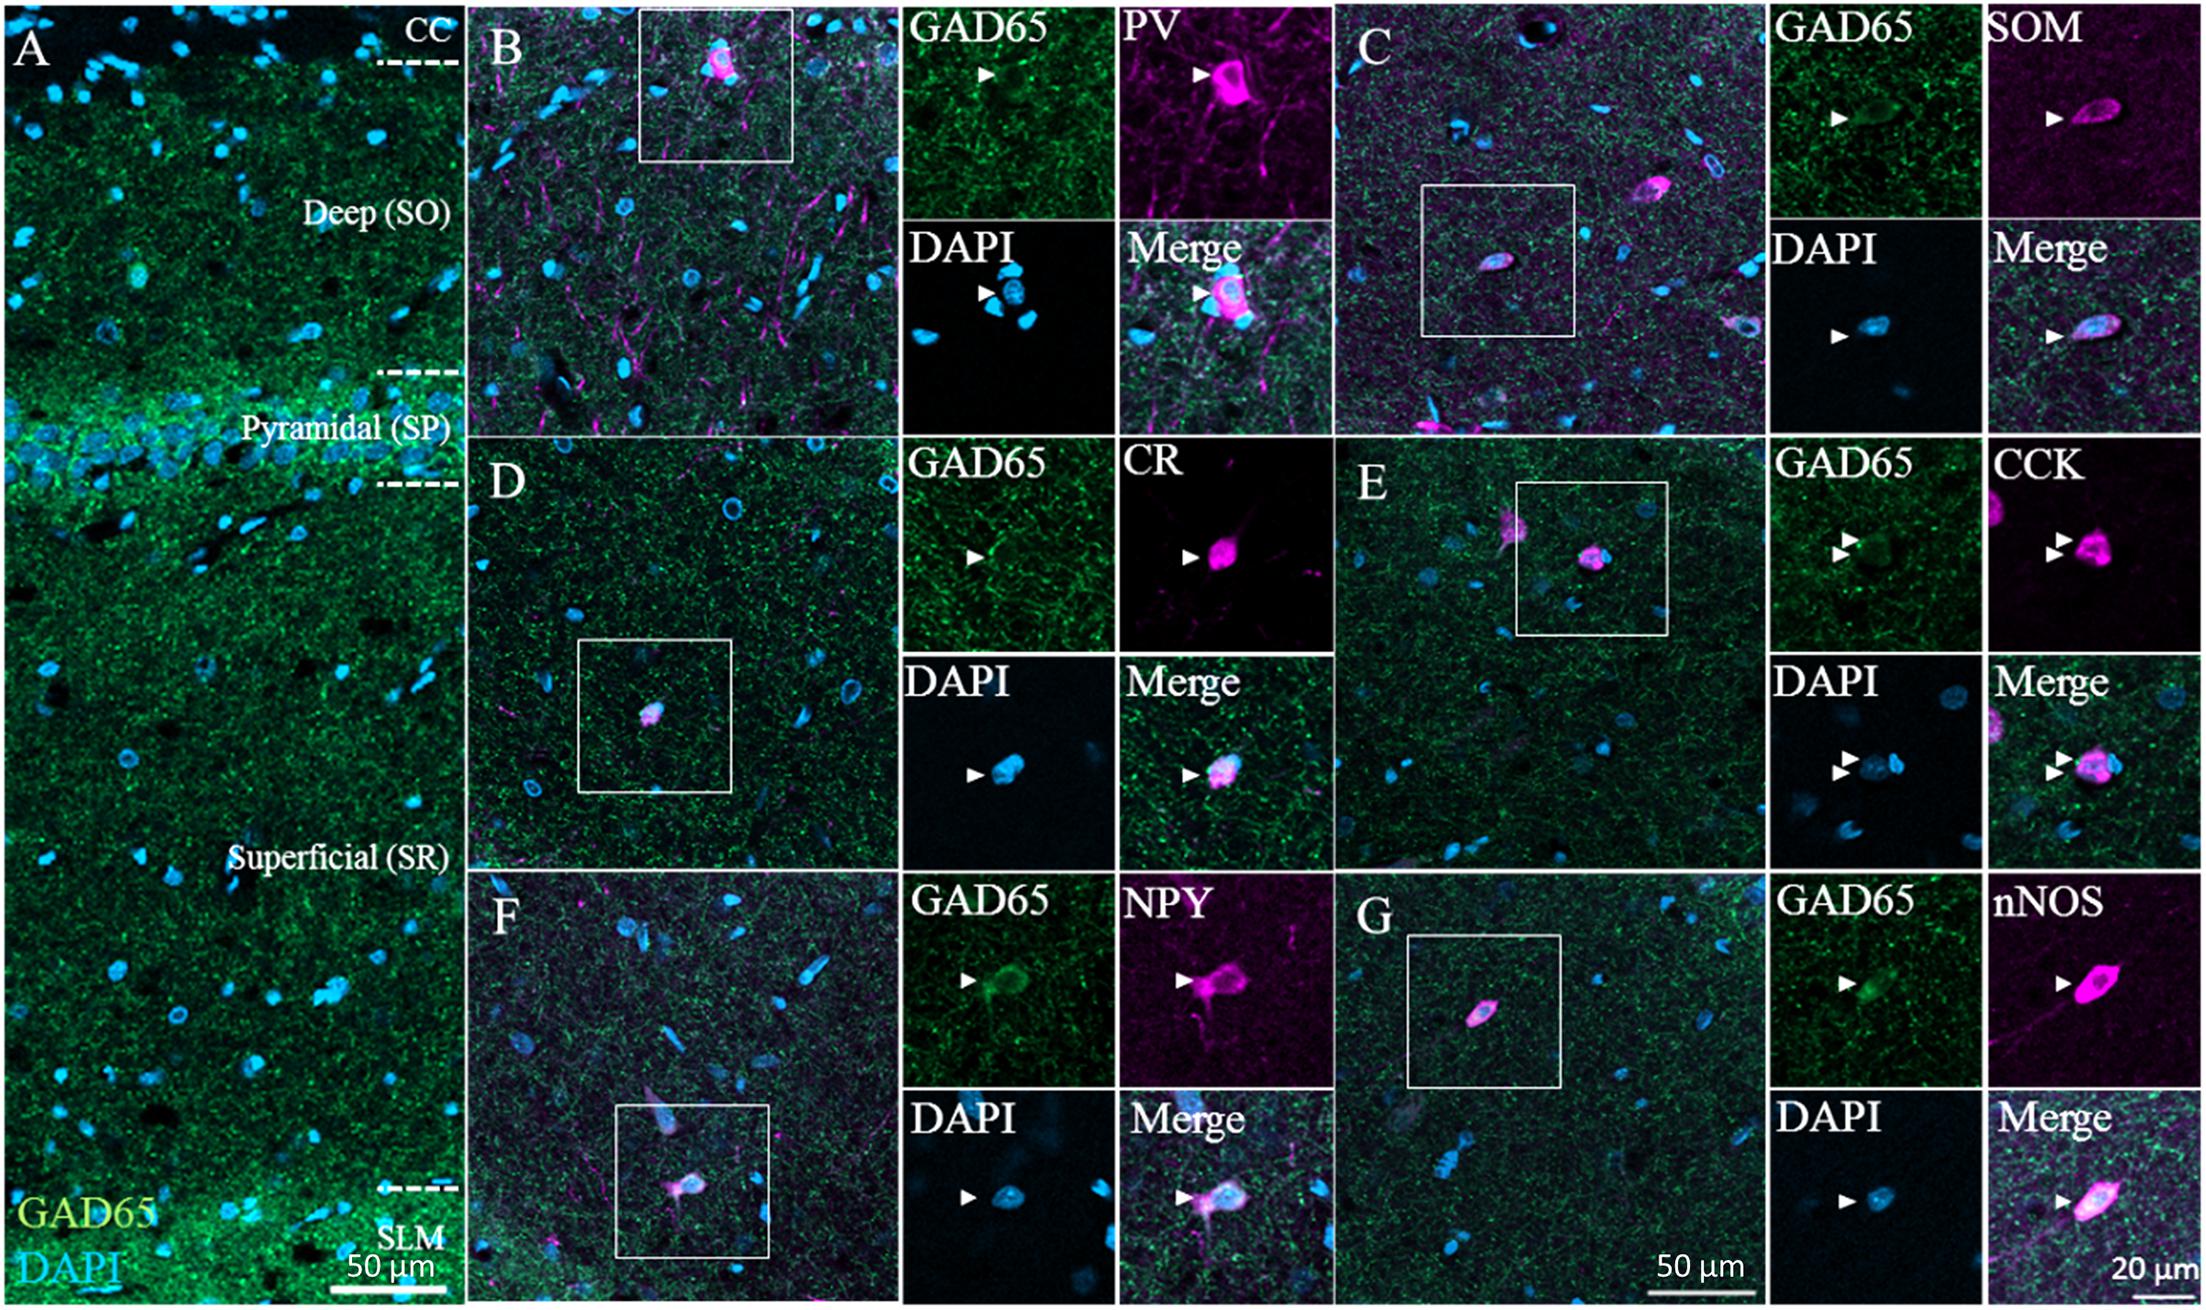
Figure 4. GAD65 expression in each GABAergic subtype in the hippocampus. Double immunofluorescence image showing GAD65 (green) and DAPI (blue) signals (A). Triple immunofluorescence images showing GAD65 expression (green); positive signals for PV, SOM, CR, CCK, NPY, or nNOS (magenta); and DAPI staining (blue) in the superficial (SR) layer (B–G). White squares indicate the regions enlarged in the panels on the right, and arrowheads indicate somata. CC, corpus callosum; SO, stratum oriens; SP, stratum pyramidale; SR, stratum radiatum; and SLM, stratum lacunosum-moleculare.
We plotted the GAD65 staining intensity among the six subtypes and three layers in Figure 5. Further details are provided in Table 2.
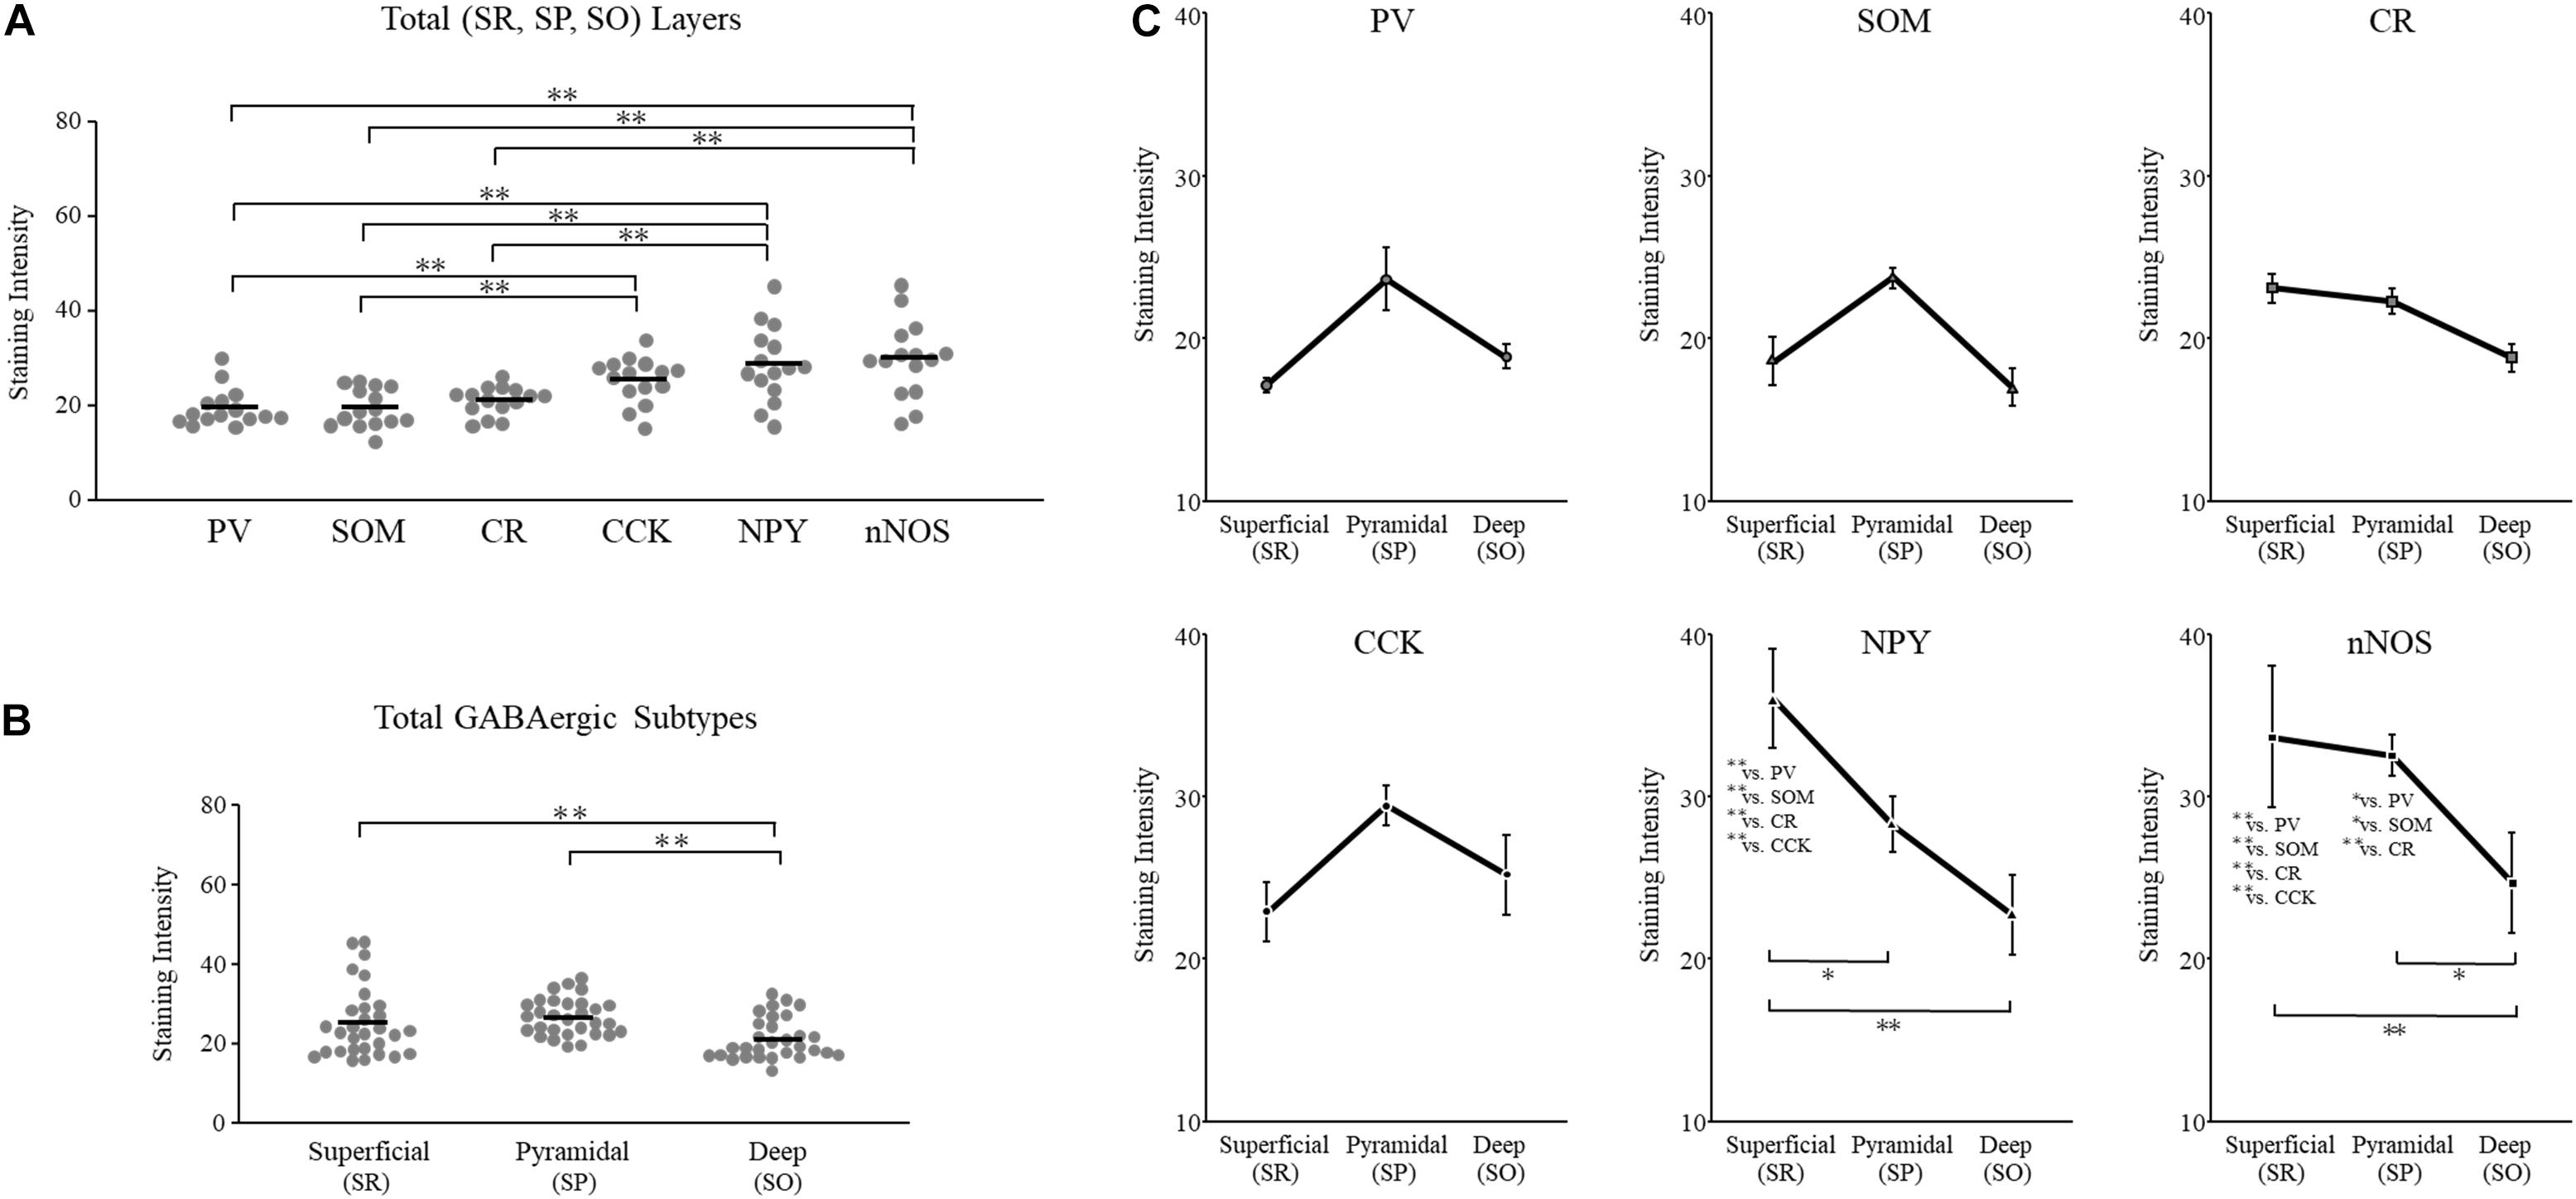
Figure 5. GAD65 expression in each GABAergic subtype across layers of the hippocampus (n = 5 brains). The average intensity of GAD65 immunostaining among six GABAergic subtypes (A). The average intensity of GAD65 immunostaining among the superficial (SR), pyramidal (SP), and deep (SO) layers (B). The average intensity of GAD65 immunostaining across layers of the cerebral cortex among six GABAergic subtypes (C). SO, stratum oriens; SP, stratum pyramidale; and SR, stratum radiatum. Error bars indicate SEM. Two-way ANOVA followed by Bonferroni’s tests was used to compare the expression level. ∗p < 0.05. ∗∗p < 0.01.
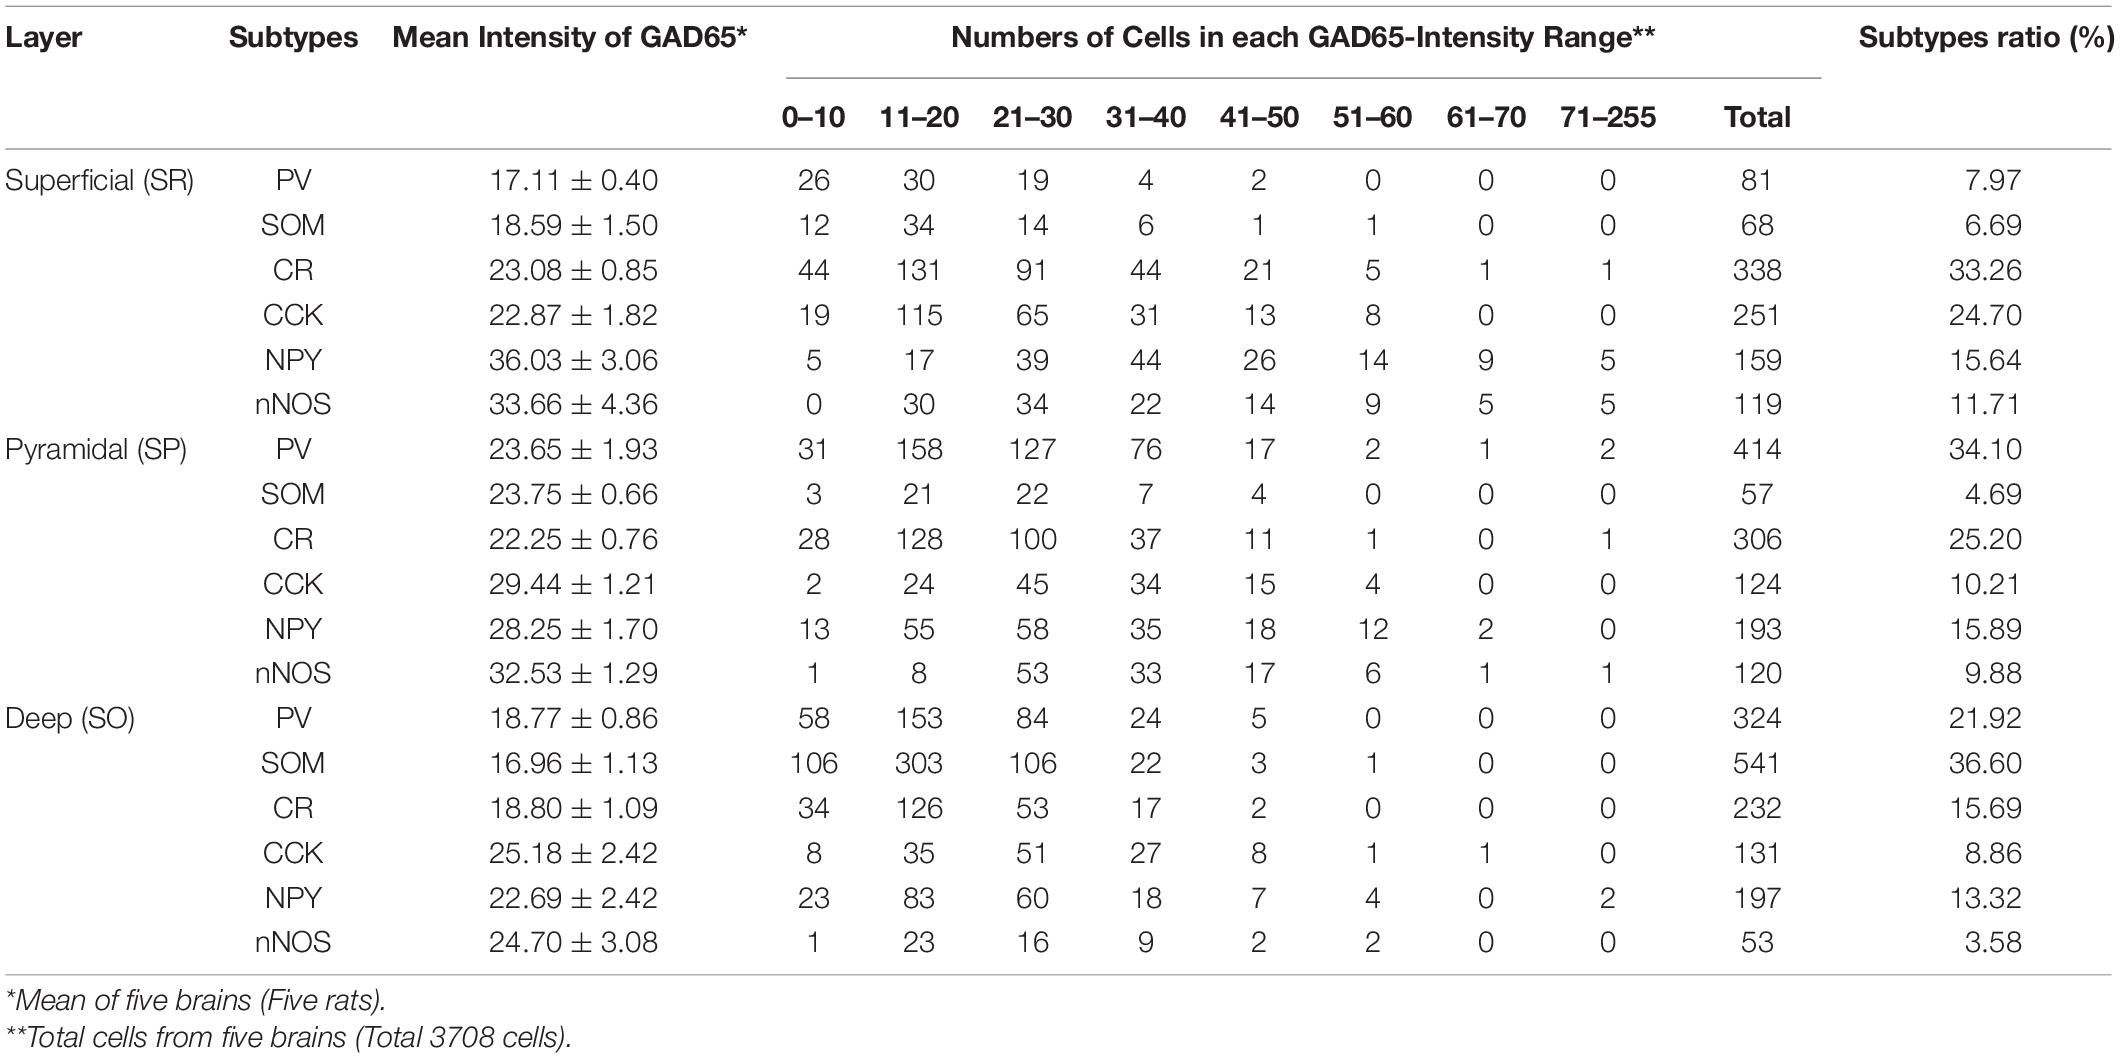
Table 2. GAD65 Expression in Hippocampal Layers Based on GAD65 Staining Intensity.
To examine subtype- and layer-related specificity, we statistically analyzed the GAD65 staining intensity using two-way ANOVA (subtype × layer). The statistical analysis indicated significant main effects due to the subtype and layer type (subtypes: p = 0.000; layers: p = 0.000). The interaction was also significant (subtype × layer: p = 0.002).
To compare the GAD65 staining intensity among the six subtypes, we performed multiple comparison analysis using Bonferroni’s post hoc method. The GAD65 staining intensity was significantly higher in NPY+, nNOS+, and CCK+ neurons than in other subtypes (NPY+ vs. PV+, p = 0.000; vs. SOM+, p = 0.000; vs. CR+, p = 0.000; nNOS+ vs. PV+, p = 0.000; vs. SOM+, p = 0.000; vs. CR+, p = 0.000; CCK+ vs. PV+, p = 0.006; vs. SOM+, p = 0.005; Figure 5A). No significant difference was found between CCK+ and CR+ neurons.
However, these main effects were qualified by a significant interaction between subtype and layer type. Therefore, we compared the GAD65 staining intensity among the six subtypes for each layer using Bonferroni’s post hoc tests. In the superficial (SR) layer, the GAD65 staining intensity was significantly higher in NPY+ (NPY+ vs. PV+, p = 0.000; vs. SOM+, p = 0.000; vs. CR+, p = 0.000; vs. CCK+, p = 0.000) and nNOS+ neurons (nNOS+ vs. PV+, p = 0.000; vs. SOM+, p = 0.000; vs. CR+, p = 0.005; vs. CCK+, p = 0.004; Figure 5C). In the pyramidal (SP) layer, the GAD65 staining intensity was significantly higher in nNOS+ neurons than in all other subtypes (nNOS+ vs. PV+, p = 0.033; vs. SOM+, p = 0.037; vs. CR+, p = 0.007). By contrast, in the deep (SO) layer, no significant differences were found.
Based on these statistical analysis, we classified GABAergic subtypes into two groups: high GAD65 (NPY+, nNOS+, and CCK+) and low GAD65 (PV+, SOM+, and CR+) neurons in the hippocampus. In contrast to the cerebral cortex, these high expression levels are indicative of layer specificity. GAD65 expression in the superficial layer (SR) was higher in NPY+ and nNOS+ neurons, and GAD65 expression in the pyramidal layer (SP) was higher in nNOS+ neurons than in other subtypes. In the deep layer (SO), GAD65 expression tended to be high in CCK+ neurons, but no significant differences were noted.
To compare the GAD65 staining intensity among hippocampal layers, we performed multiple comparison analysis using Bonferroni’s post hoc method. The GAD65 staining intensity was significantly higher in the superficial (SR) and pyramidal (SP) layers than in the deep (SO) layer (SR vs. SO, p = 0.002; SP vs. SO, p = 0.000; Figure 5B).
As described above, these main effects were qualified by a significant interaction between the subtype and layer type. Therefore, we compared the GAD65 staining intensity among layers for each subtype using Bonferroni’s post hoc tests. In NPY+ neurons, the GAD65 staining intensity was significantly higher in the superficial (SR) layer than in the other (SP and SO) layers (SR vs. SP, p = 0.021; SR vs. SO, p = 0.000; Figure 5C). In nNOS+ neurons, the GAD65 staining intensity was significantly higher in the superficial (SR) and pyramidal (SP) layers than in the deep (SO) layer (SR vs. SO, p = 0.006: SP vs. SO, p = 0.020). In PV+, SOM+, CR+, and CCK+ neurons, the GAD65 staining intensity was not significantly different across layers.
Based on these results, GAD65 expression was higher in the superficial (SR) and pyramidal (SP) layers than in the deep (SO) layer. However, this laminar distribution was subject to subtype specificity. In NPY+ neurons, GAD65 expression was high in the superficial (SR) layer. In nNOS+ neurons, GAD65 expression was high in the superficial (SR) and pyramidal (SP) layers. In PV+, SOM+, and CCK+ neurons, no significant differences were observed, but GAD65 expression tended to be high in the pyramidal (SP) layer.
We examined GAD65 expression in somata but not in axon terminals. Investigating GAD65 expression in axon terminals is difficult because the SOM, NPY, and nNOS proteins cannot be clearly detected in axon terminals under confocal microscopy. To detect GAD65 expression throughout the cytoplasm including in axon terminals, we injected colchicine, an inhibitor of microtubule polymerization, into the lateral ventricle to block axonal transport. At 2 days after colchicine injection, the GAD65 staining (green) intensity increased in somata in the cerebral cortex (Figures 6A-I, B-I, arrowhead) and hippocampus (Figures 6G-I, H-I, arrowhead). On the other hand, the intensity of GAD65 decreased in the neuropil region of the cerebral cortex (Figures 6A-II, B-II, arrows) and hippocampus (Figures 6G-II, H-II, arrows). Welch’s t-test showed the intensities of GAD65 clusters were significantly lower in colchicine-injected brains (Figure 6C, cerebral cortex: p = 0.001; Figure 6I, hippocampus: p = 0.000). In additions, the number of VGAT clusters (magenta) were not changed in colchicine-injected brains (Figure 6D, cerebral cortex; Figure 6J, hippocampus). VGAT is localized in inhibitory axon terminal (Chaudhry et al., 1998), suggesting that GAD65 was not transported to axon terminals and instead accumulated in somata. In these brains, we measured GAD65 expression in the six subtypes in the cerebral cortex (Figure 6E) and hippocampus (Figure 6K) and compared the results with control brains. In colchicine-injected brains, the intensities of GAD65 staining in somata were dramatically increased, but their distributions throughout the somata did not appear to show the major changes. Therefore, we determined that same quantitative method as control is applicable in them. GAD65 expression was compared using the mean value of the three layers in both colchicine-injected and control brains. Welch’s t-test showed the intensities of GAD65 in somata were significantly higher in colchicine-injected brains (Figure 6E, cerebral cortex: PV, p = 0.000; SOM, p = 0.004; CR, p = 0.026; CCK, p = 0.049; NPY, p = 0.000; and nNOS, p = 0.029; Figure 6K, hippocampus: PV, p = 0.001; CCK, p = 0.005; NPY, p = 0.003; and nNOS, p = 0.006). The data of CR did not show normal distribution, and was detected the significant difference using Mann–Whitney U Test (p = 0.008). There was no significant difference in SOM+ cells between colchicine-injected and control brains. Further details are provided in Table 3. Pearson’s test showed significant positive correlations in the expression profile between colchicine-injected and control brains (Figure 6F, cerebral cortex: r = 0.780, p = 0.003; Figure 6L, hippocampus: r = 0.889, p = 0.000).
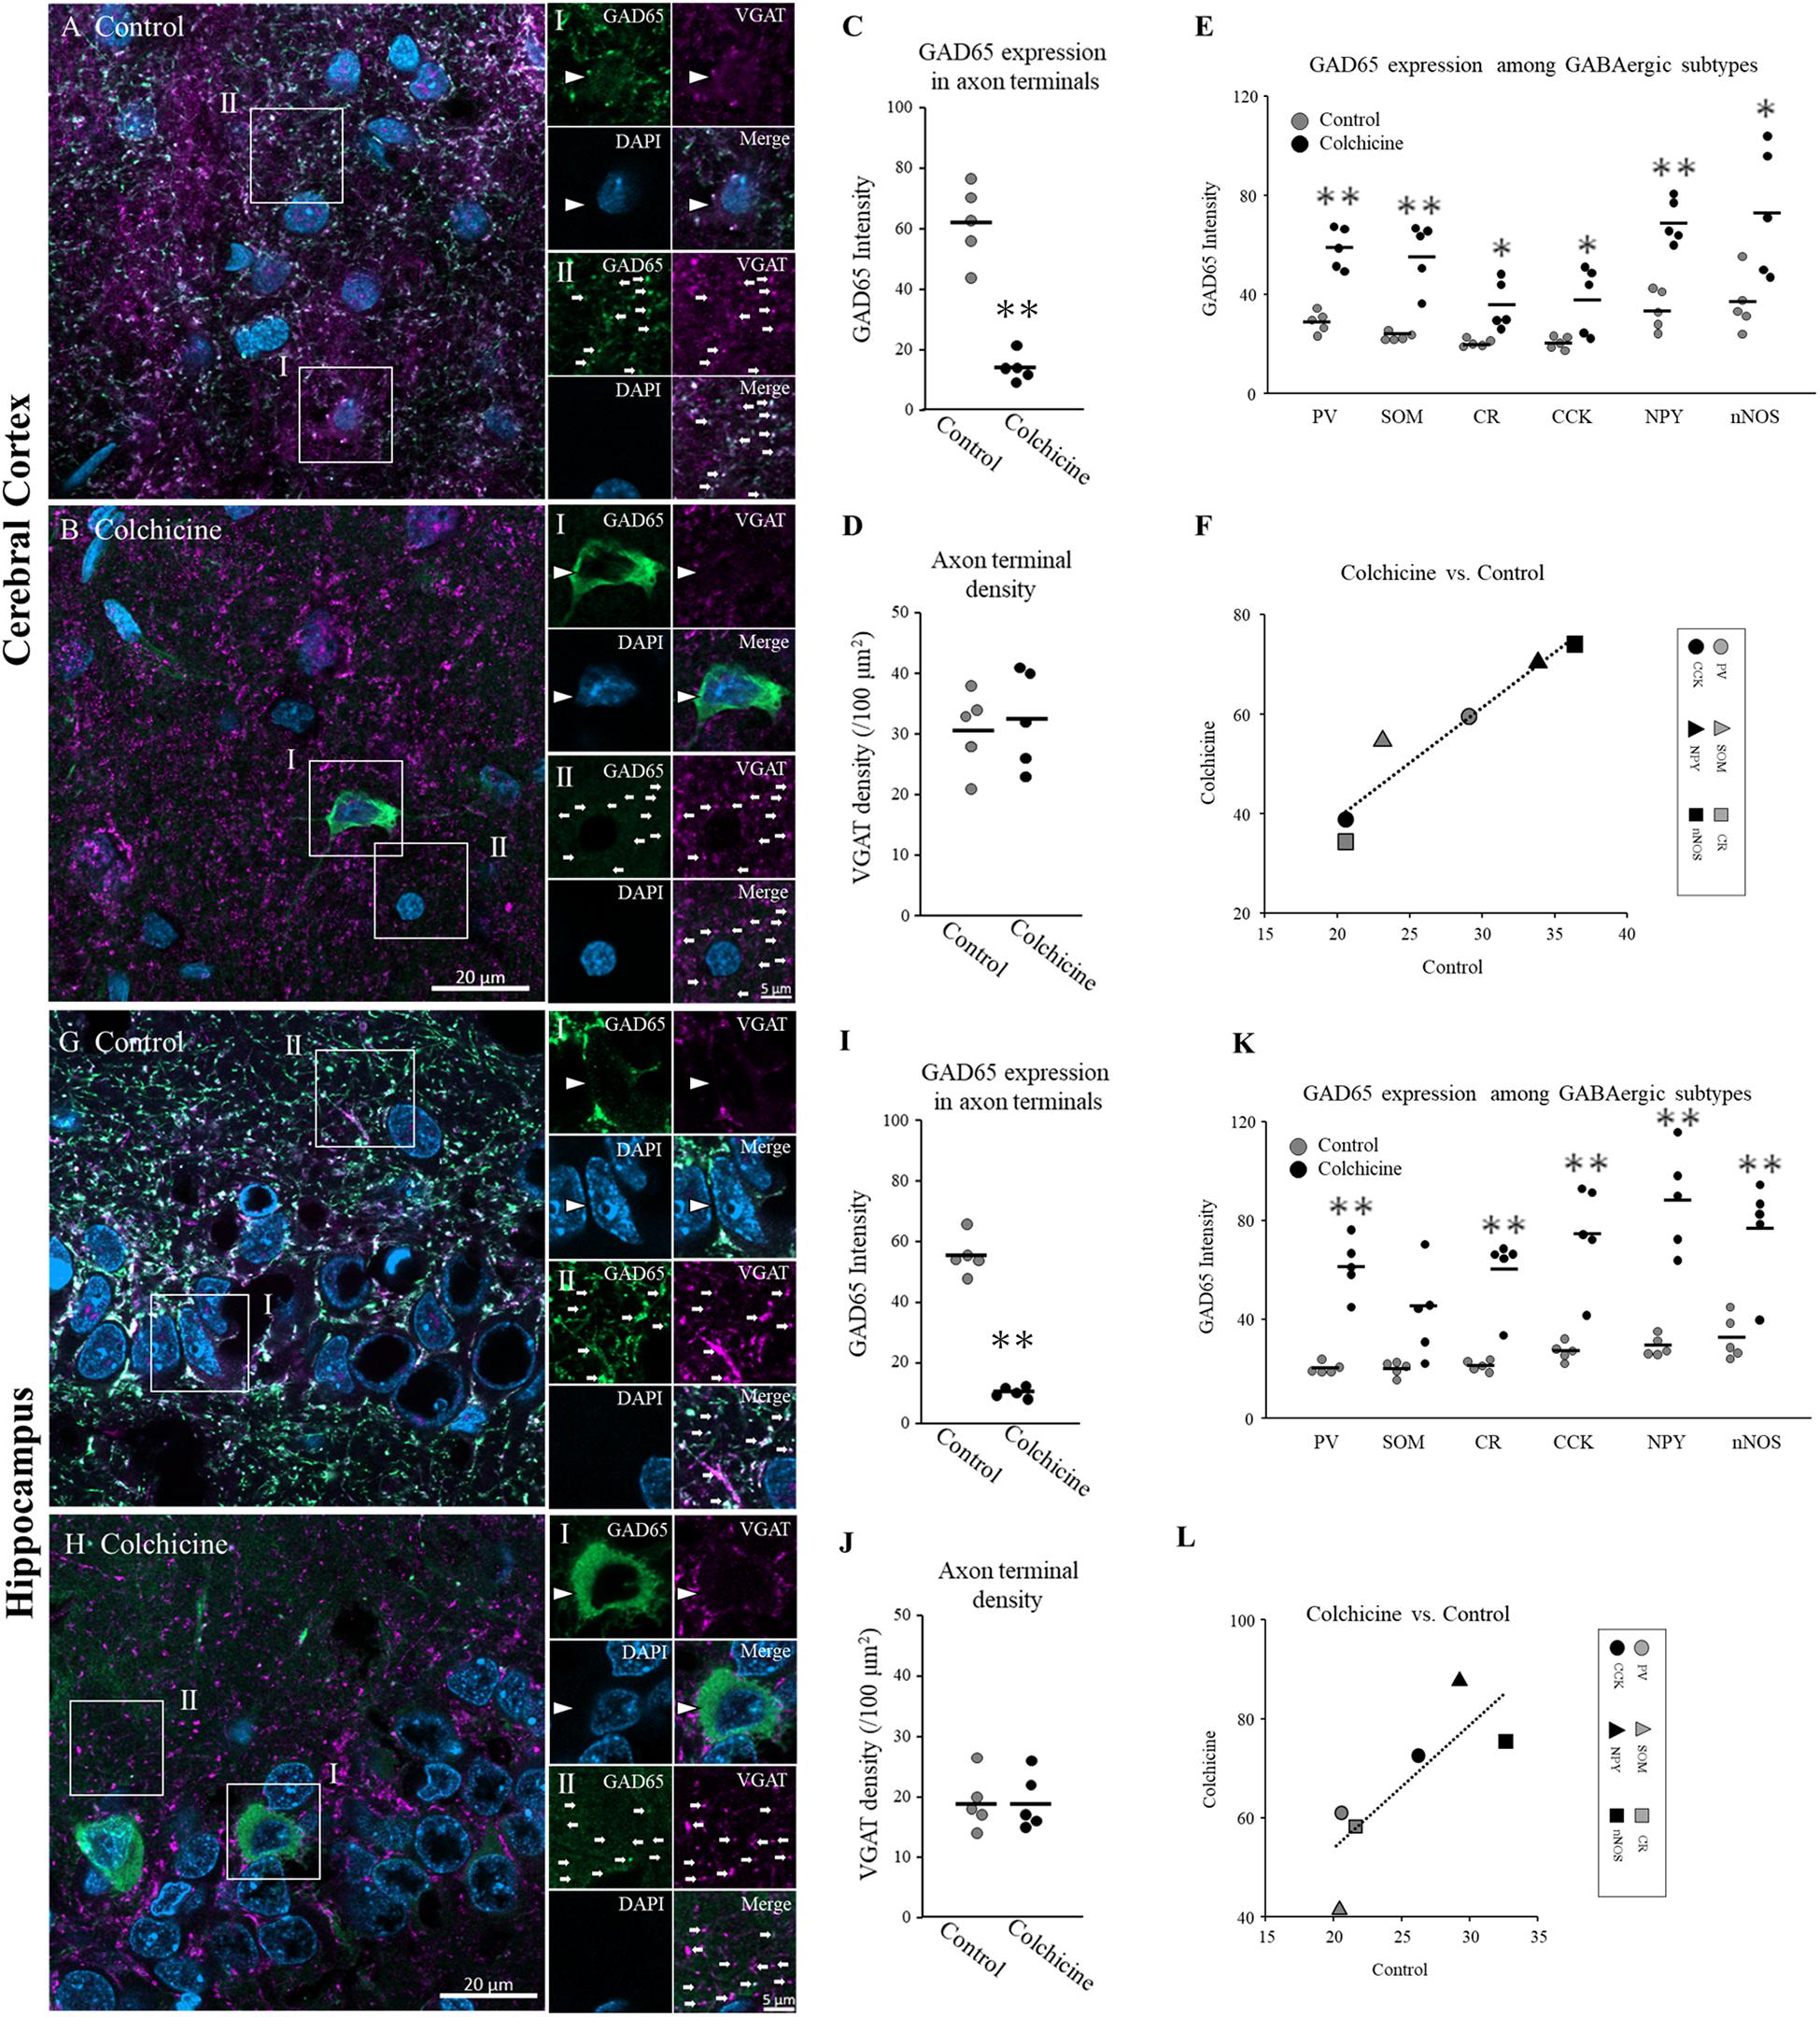
Figure 6. GAD65 expression in the cerebral cortex and hippocampus of colchicine-treated rats (n = 5 brains). Triple immunofluorescence image showing GAD65 (green), VGAT (magenta), and DAPI (blue) signals (cerebral cortex: A,B; hippocampus: G,H). White squares (I: soma; II: neuropil) indicate the regions enlarged in the panels on the right, and arrowheads and arrows indicate somata and axon terminals, respectively. The average GAD65 immunostaining intensity in axon terminals (neuropil) in cerebral cortical layers (C) and hippocampal layers (I). The density of VGAT immunostaining per unit area in cerebral cortical layers (D) and hippocampal layers (J). The average GAD65 immunostaining intensity in soma in cerebral cortical layers (E) and hippocampal layers (K) among six GABAergic subtypes. Correlations in GAD65 staining intensities in six GABAergic subtypes in the cerebral cortex (F) and hippocampus (L) between the colchicine-injected group and the control group. Black bars indicate the mean value of five brains (C–E,I–K). Error bars indicate SEM. Welch’s t-test revealed was used for (C,E,D,I,K,J). Mann–Whitney U Test was used for (K). Pearson’s correlation analysis was used for (F,L). ∗p < 0.05. ∗∗p < 0.01.
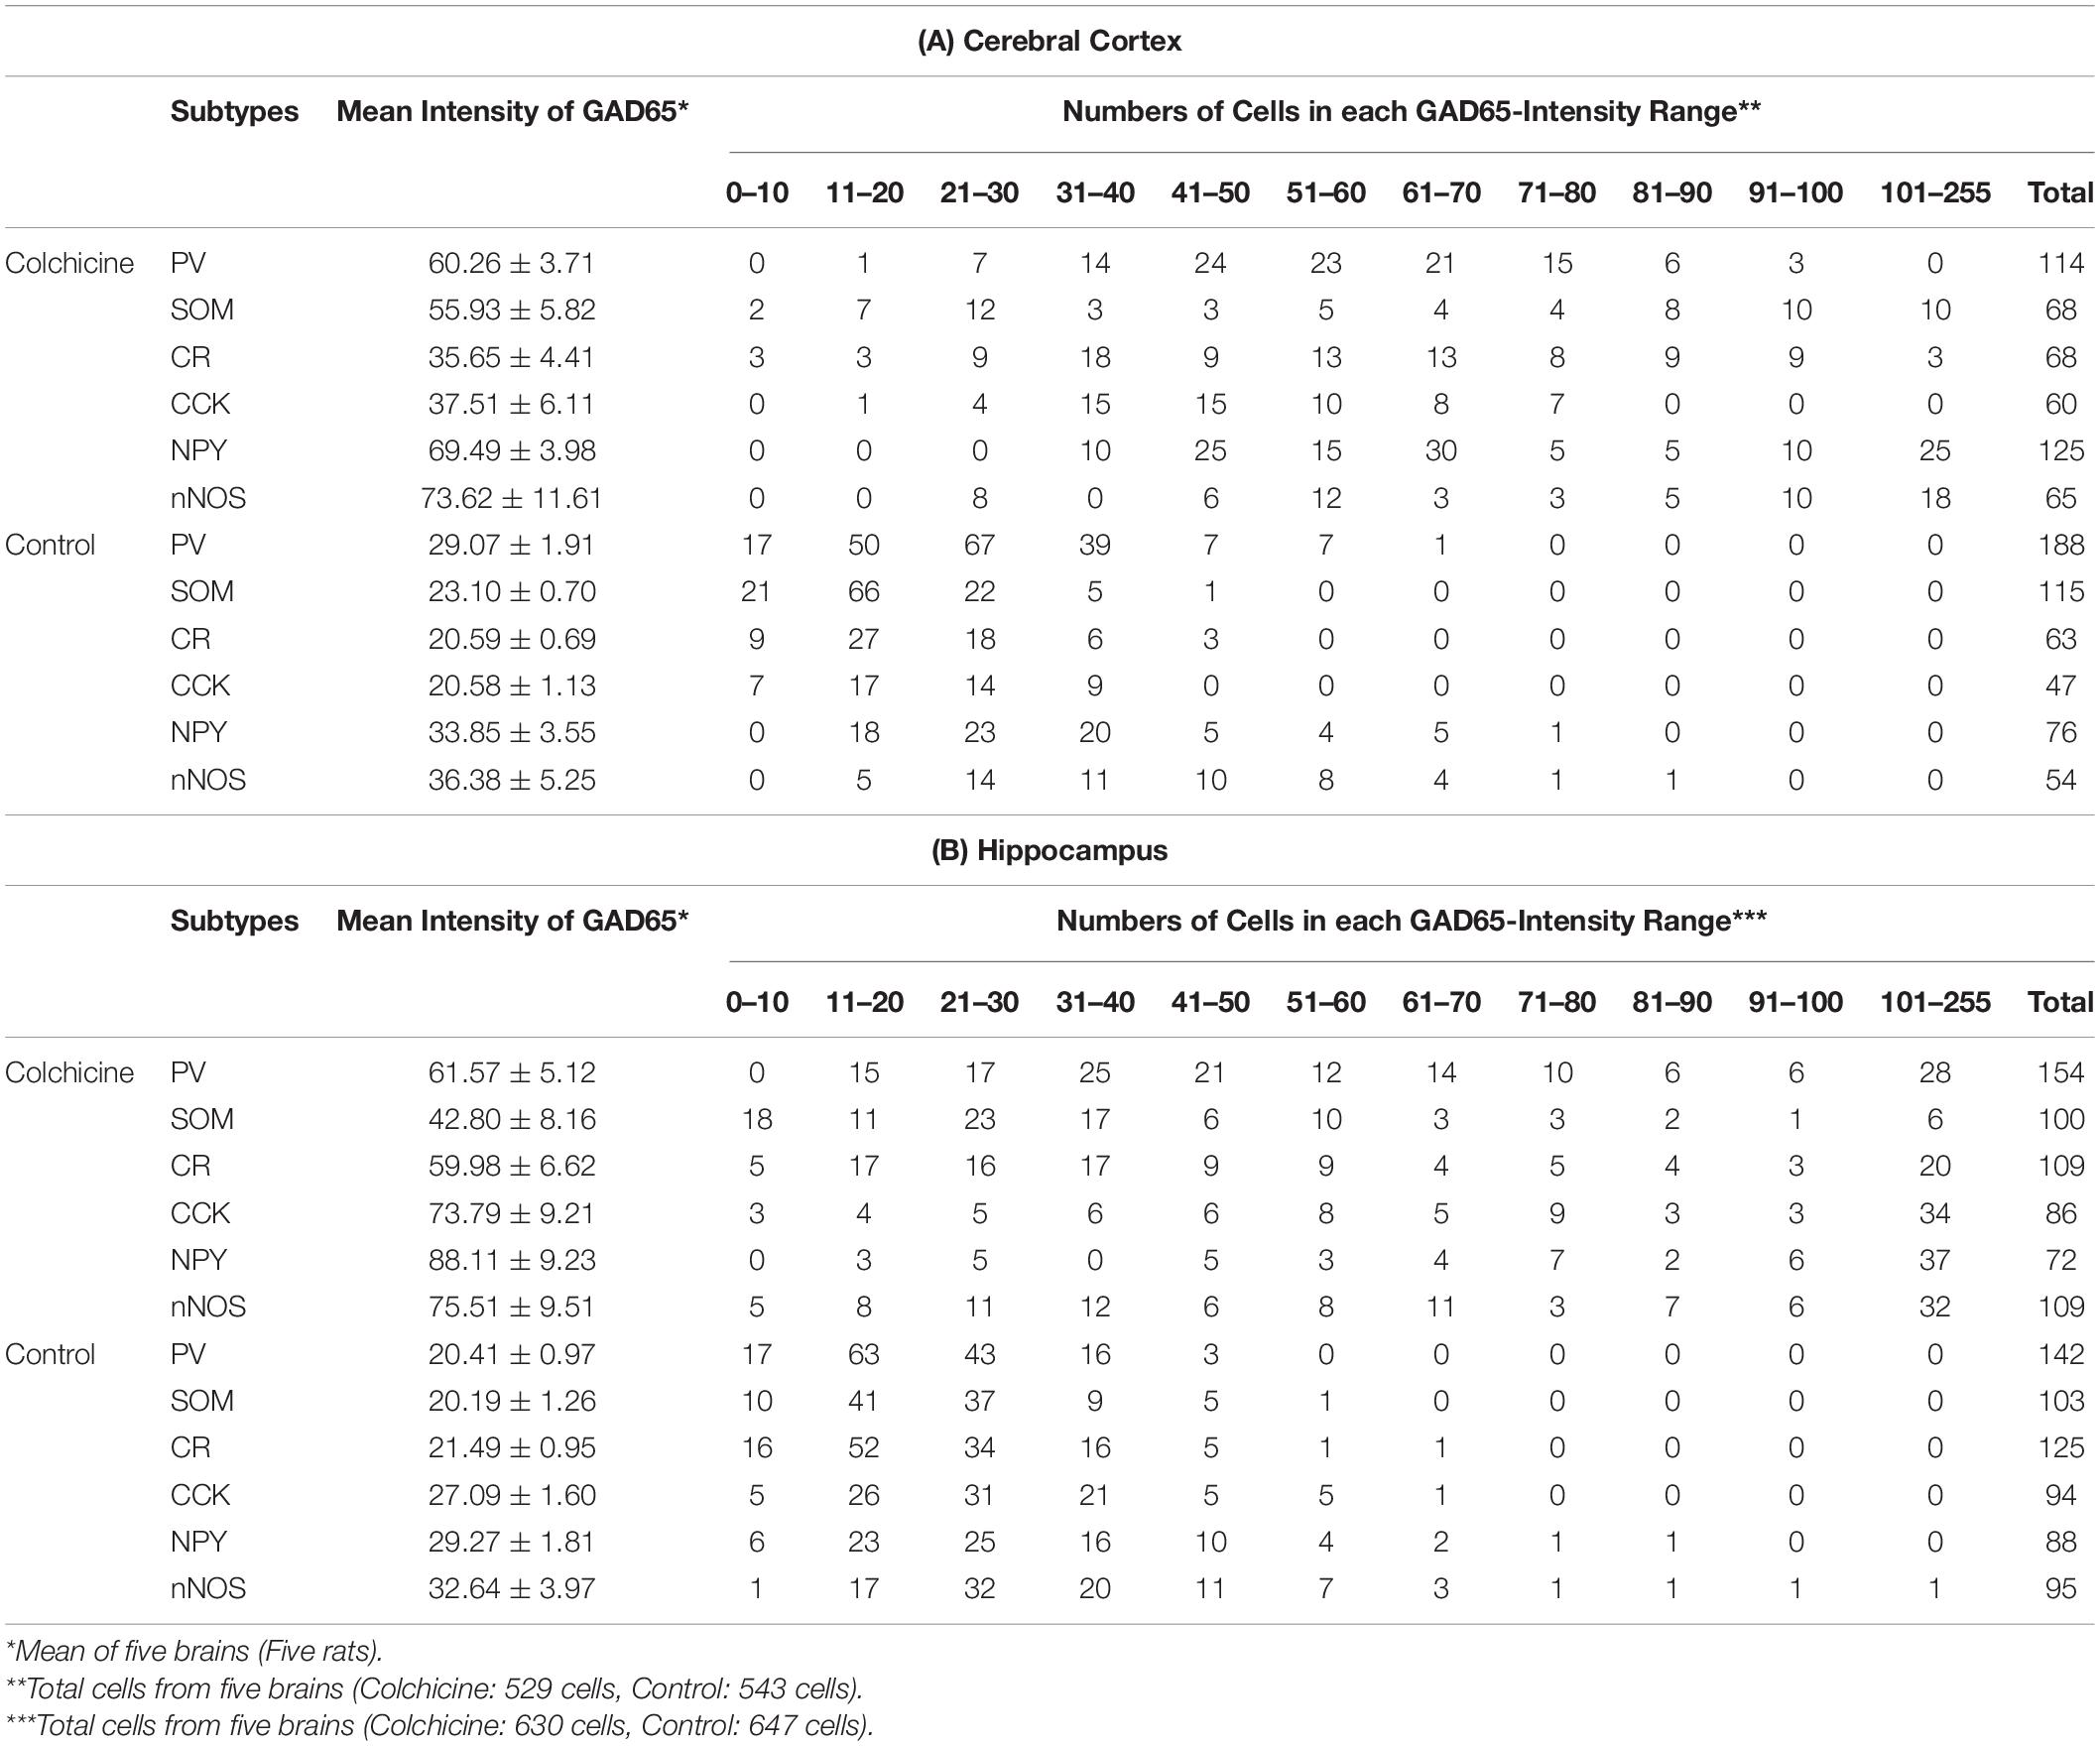
Table 3. GAD65 Expression in (A) Cerebral Cortical (B) Hippocampal layers based on GAD65 staining intensity in colchicine-injected rats.
Based on these results, GAD65 expression in the soma and cytoplasm exhibited similar tendencies across all GABAergic subtypes, and the level of GAD65 expression in the soma can be used as a proxy for the level of GAD65 expression in the cytoplasm for all GABAergic subtypes.
In this study, we compared GAD65 expression among six GABAergic subtypes and found that GABAergic subtypes fell into two classes for each brain region from statistical analysis: a high-expression group (NPY+ and nNOS+) and a low-expression group (PV+, SOM+, CR+, and CCK+) in the cerebral cortex, and a high-expression group (CCK+, NPY+, and nNOS+), and a low-expression group (PV+, SOM+, and CR+) in the hippocampus. There was a difference in the laminar distribution of GAD65 expression between the cortical and hippocampal layers.
Additionally, GAD65 expression across all GABAergic subtypes were significantly and positively correlated between control and colchicine-treated rats.
Our results revealed that nNOS+ and NPY+ neurons express GAD65 at particularly high levels, whereas some major subtypes (PV+/SOM+/CR+) express GAD65 at low levels in the cerebral cortex and hippocampus. This result is consistent with previous reports of PV+ neurons having lower GAD65 expression than non-PV neurons in the mouse hippocampus (Fukuda et al., 1997). Candidates of these non-PV neurons having high GAD65 may include the nNOS+ and NPY+ neurons based on our findings. There was another previous report comparing synaptic-GAD65 and GAD67 expression among PV+ basket neurons, PV+ chandelier neurons and Calbindin-positive (CB+) basket neurons in the monkey prefrontal cortex (Fish et al., 2011). They shows the higher synaptic expression of GAD65 in PV+ basket neurons than in PV+ chandelier neurons, and the same level of synaptic expression of GAD65 in PV+ basket neurons as in CB+ basket neurons. Because of different classification of GABAergic subtypes, it would be necessary to clarify distinct patterns of GAD65 expressions in synapse levels at multiple GABAergic subtype.
Neuropeptide Y is a neuromodulator with anti-seizure activity (Erickson et al., 1996; Baraban et al., 1997; Vezzani et al., 1999). Its anti-epileptic functions occur during the pre- and post-synaptic inhibition of excitatory neurons via Y1, Y2, and Y5 receptors (Baraban, 2004). NPY belongs to the G-protein-coupled inwardly rectifying potassium receptor family (Paredes et al., 2003). The functions of neuromodulator/GABA co-release remain unclear, but generally, GABA transmission contributes to fine-tuning of the synaptic effects of neuromodulators (Horvath et al., 2001; Yu et al., 2015; Tritsch et al., 2016). Many NPY+ neurons are excited by GABA in the hilus of the hippocampus (Fu and van den Pol, 2007), suggesting that NPY+ cells are activated by GABA, which results in the increased release of not only GABA but also the co-expressed inhibitory neuromodulator NPY. Based on these reports, we suggest that the neural inhibitory functions of NPY are regulated by GAD65-dependent GABA release in pathological situations.
The pharmacological functions of nitric oxide (NO) in epileptic seizures remain controversial, but NO has been considered to act as a mediator of neurotoxic effects in several reports (Dawson et al., 1991; Marangoz et al., 1994; Penix et al., 1994; Schuman and Madison, 1994). nNOS has the function of evoking the release of several neurotransmitters, including acetylcholine, catecholamines, neuroactive amino acids and GABA (Kahn et al., 1997a,b). NO-evoked neurotransmitter release is mediated by two distinct release systems, a Ca2+-dependent system and the reverse process of a Na+-dependent carrier-mediated transport system (Garthwaite, 1991; Kuriyama and Ohkuma, 1995). NO has effects of decreasing GABA transaminase activity and increasing GABA expression (Jayakumar et al., 1999; Vega Rasgado et al., 2018). The relationship between presynaptic NO release and GABA remains largely unknown, but as with NPY, NO, and GABA release may be related to the regulation of overexcited neurons in some pathological states. The high concentrations of GAD65 in nNOS+ and NPY+ neurons may be needed to support a rapid response to neuromodulators when necessary.
Additionally, SOM is an anti-epileptic neuropeptide in the hippocampus (Boehm and Betz, 1997; Schweitzer et al., 1998; Tallent and Siggins, 1999). GABA-mediated activation of NPY+ neurons may increase the release of SOM (Fu and van den Pol, 2007), as SOM/NPY co-expression has been observed in a subset of GABAergic neurons in the hippocampus (Köhler et al., 1987). However, GAD65 expression was not high in SOM+ neurons according to our results, indicating that the release of SOM is not associated with GAD65-dependent GABA release.
In the cerebral cortex, we found that GAD65 expression is higher in the superficial layer than in the other layers for all GABAergic subtypes. Pyramidal neurons project their dendrites into the superficial layer to receive amino-acid or monoamine signals from other parts of the cortex or extra-cortical regions. Inhibitory dendritic signals from local GABAergic neurons are essential for mediating these inputs and maintaining a normal neural state (Northoff and Mushiake, 2020). Therefore, high GAD65 expression in neurons in the superficial layer may play a crucial role in suppressing cortical over-excitation. This idea is consistent with a report stating that local GABAergic inhibition drives the elasticity of ictal progression and that cortical seizures occur in superficial layers prior to deep layers during lateral seizure spread (Wenzel et al., 2017). Additionally, GAD65 expression was found to be higher in the pyramidal layer of the visual cortex of 1-week-old cats (Mower and Guo, 2001), but higher expression was detected in the superficial layer in adults (Guo et al., 1997). This pattern change may reflect flexible regulation of GAD65 for maintaining a normal state during the growth of neural circuits.
In the hippocampus, we observed that GAD65 expression was higher in the superficial layer than in the deep layer only in nNOS+ and NPY+ neurons. Dendrites of hippocampal pyramidal neurons in the superficial layer receive glutamatergic Schaffer collateral inputs from the CA3 region. In the hippocampal CA1 region, GABAergic neurons expressing nNOS/NPY are known as Ivy cells (Price et al., 2005; Tricoire and Vitalis, 2012). Ivy cells provide widespread synaptic and extra-synaptic slow inhibition of the dendrites of CA1 pyramidal neurons (Fuentealba et al., 2008; Lapray et al., 2012). The number of Ivy cells was significantly reduced in the hippocampus of pilocarpine-induced epileptic rats. Interestingly, the number of PV+ neurons was not changed in this model (Orbán-Kis et al., 2015). These findings suggest that nNOS+ and NPY+ neurons in the superficial layer may play a critical role in suppressing ictal progression in the hippocampus. Same as nNOS+ and NPY+ neurons, in PV+, SOM+, CR+ and CCK+ neurons, they also showed the tendency of distinct GAD65 expression among layers. These results are consistent with a previous report stating that both PV+ and non-PV neurons exhibit distinct laminar distribution of GAD65 in the deep and pyramidal layer (Fukuda et al., 1997).
We noted that strong GAD65 fluorescence often accumulated in the perinuclear region. This localization may reflect GAD65 protein undergoing a hydrophobic posttranslational modification and becoming anchored to the cytosolic face of the Golgi membranes (Kanaani et al., 2008).
Based on this feature, we considered it inappropriate to compare GAD65 expression through measurement of its mean intensity inside a traced outline of the soma, as described in previous report (Jinno and Kosaka, 2009). GABAergic neurons have different soma size depending on subtypes (González-Albo et al., 2001). This affects the ratio of the Golgi membrane occupying the soma differs among GABAergic subtypes. To avoid this problem, we quantified GAD65 expression from the average intensity of four squares (details are provided in the section “Materials and Methods”); this method is considered less susceptible to the effects of soma size.
GAD65 localizes to both the soma and axon terminal, and thus, the amount of GAD65 in the soma does not necessarily reflect the total number of GAD65 molecules throughout the cytoplasm. As reported previously, there are two possible drivers of high GAD65 expression in the soma: a high synthesis rate or slow transport to the axon terminals (Esclapez et al., 1993). The inhibition of axonal transport by colchicine enhances GAD65 immunoreactivity in the soma (Wang et al., 2014). We found that GAD65 expression in the soma across neuronal subtypes was significantly and positively correlated between colchicine-treated and control brains, suggesting that GAD65 expression in the soma can be used as a proxy for the overall amount of GAD65 in the cytoplasm. It is important to consider the possibility that the colchicine injections might have caused abnormal effects on not only axonal transport but also protein synthesis or metabolism, as colchicine is neurotoxic (Sutula et al., 1983). Neural excitation caused by colchicine might affect the GAD65 expression, because temporal lobe epilepsy caused by pilocarpine is reported to increase GAD65 expression (Esclapez and Houser, 1999). In additions, GABAergic neurons may have differing colchicine sensitivities based on their morphologies and localization patterns. In this study, we injected colchicine into the lateral ventricle of the brain. Layers near the lateral ventricle might have thus been vulnerable to drug effects. In future research, synaptic protein levels can be detected directly using super-resolution fluorescence microscopy. Complementary data should be obtained through several methods.
High GAD65 expression in NOS+ and NPY+ neurons has important implications. As noted in the introduction, GAD65 is associated with activity-dependent GABA release, whereas GAD67 is associated with spontaneous GABA release (Tian et al., 1999; Jinno and Kosaka, 2009). Our findings suggest that nNOS+ and NPY+ neurons are closely associated with activity-dependent GABA release. Among GABAergic subtypes, PV+ neurons are considered a pivotal subtype based on previous studies using subtype-specific GAD67-knockout or -knockdown models (Kuki et al., 2015; Lazarus et al., 2015). However, no studies to date have examined the functions of GAD65 in nNOS+ and NPY+ neurons. In humans, electroconvulsive therapy increases the seizure threshold (Sackeim, 1999) and GABA expression in the brain (Sanacora et al., 2003). According to our findings, GAD65 expression may increase in nNOS+ and NPY+ neurons, resulting in increased GABA expression and a higher seizure threshold. This study demonstrates the baseline level of GAD65 expression at the resting state of various GABAergic subtypes. In the future, the relationships between GABAergic subtypes and pathological states should be studied, as GABAergic subtypes play distinct roles in excitatory-inhibitory balance under normal and pathological conditions, including epileptic seizures and mental disorders.
The raw data supporting the conclusions of this article will be made available by the authors, without undue reservation.
The animal study was reviewed and approved by the Institute for Animal Experimentation of Tohoku University (Permission number: 2019 IDOU-291-03).
YK and HM conceived and designed the experiments, wrote the manuscript, and contributed to the article and approved the submitted version. YK performed the experiments and analyzed the data. Both authors contributed to the article and approved the submitted version.
This work was supported by a JSPS KAKENHI grant (Numbers 20K16614 and 19H03337) and MEXT KAKENHI grant (Number JP16H06276: Platform of Advanced Animal Model Support).
The authors declare that the research was conducted in the absence of any commercial or financial relationships that could be construed as a potential conflict of interest.
All claims expressed in this article are solely those of the authors and do not necessarily represent those of their affiliated organizations, or those of the publisher, the editors and the reviewers. Any product that may be evaluated in this article, or claim that may be made by its manufacturer, is not guaranteed or endorsed by the publisher.
Asada, H., Kawamura, Y., Maruyama, K., Kume, H., Ding, R. G., Kanbara, N., et al. (1997). Cleft palate and decreased brain gamma-aminobutyric acid in mice lacking the 67-kDa isoform of glutamic acid decarboxylase. Proc. Natl. Acad. Sci. U.S.A. 94, 6496–6499. doi: 10.1073/pnas.94.12.6496
Baraban, S. C. (2004). Neuropeptide Y and epilepsy: recent progress, prospects and controversies. Neuropeptides 38, 261–265. doi: 10.1016/j.npep.2004.04.006
Baraban, S. C., Hollopeter, G., Erickson, J. C., Schwartzkroin, P. A., and Palmiter, R. D. (1997). Knock-out mice reveal a critical antiepileptic role for neuropeptide Y. J. Neurosci. 17, 8927–8936.
Boehm, S., and Betz, H. (1997). Somatostatin inhibits excitatory transmission at rat hippocampal synapses via presynaptic receptors. J. Neurosci. 17, 4066–4075.
Bowdler, J. M., Green, A. R., Minchin, M. C., and Nutt, D. J. (1983). Regional GABA concentration and [3H]-diazepam binding in rat brain following repeated electroconvulsive shock. J. Neural Transm. 56, 3–12. doi: 10.1007/BF01243369
Chattopadhyaya, B., Di Cristo, G., Wu, C. Z., Knott, G., Kuhlman, S., Fu, Y., et al. (2007). GAD67-mediated GABA synthesis and signaling regulate inhibitory synaptic innervation in the visual cortex. Neuron 54, 889–903. doi: 10.1016/j.neuron.2007.05.015
Chaudhry, F. A., Reimer, R. J., Bellocchio, E. E., Danbolt, N. C., Osen, K. K., Edwards, R. H., et al. (1998). The vesicular GABA transporter, VGAT, localizes to synaptic vesicles in sets of glycinergic as well as GABAergic neurons. J. Neurosci. 18, 9733–9750.
Dawson, V. L., Dawson, T. M., London, E. D., Bredt, D. S., and Snyder, S. H. (1991). Nitric oxide mediates glutamate neurotoxicity in primary cortical cultures. Proc. Natl. Acad. Sci. U.S.A. 88, 6368–6371. doi: 10.1073/pnas.88.14.6368
Dicken, M. S., Hughes, A. R., and Hentges, S. T. (2015). Gad1 mRNA as a reliable indicator of altered GABA release from orexigenic neurons in the hypothalamus. Eur. J. Neurosci. 42, 2644–2653. doi: 10.1111/ejn.13076
Erickson, J. C., Clegg, K. E., and Palmiter, R. D. (1996). Sensitivity to leptin and susceptibility to seizures of mice lacking neuropeptide Y. Nature 381, 415–421. doi: 10.1038/381415a0
Erlander, M. G., Tillakaratne, N. J., Feldblum, S., Patel, N., and Tobin, A. J. (1991). Two genes encode distinct glutamate decarboxylases. Neuron 7, 91–100. doi: 10.1016/0896-6273(91)90077-d
Esclapez, M., and Houser, C. R. (1999). Up-regulation of GAD65 and GAD67 in remaining hippocampal GABA neurons in a model of temporal lobe epilepsy. J. Comp. Neurol. 412, 488–505.
Esclapez, M., Tillakaratne, N. J., Kaufman, D. L., Tobin, A. J., and Houser, C. R. (1994). Comparative localization of two forms of glutamic acid decarboxylase and their mRNAs in rat brain supports the concept of functional differences between the forms. J. Neurosci. 14(3 Pt 2), 1834–1855.
Esclapez, M., Tillakaratne, N. J., Tobin, A. J., and Houser, C. R. (1993). Comparative localization of mRNAs encoding two forms of glutamic acid decarboxylase with nonradioactive in situ hybridization methods. J. Comp. Neurol. 331, 339–362. doi: 10.1002/cne.903310305
Feldblum, S., Erlander, M. G., and Tobin, A. J. (1993). Different distributions of GAD65 and GAD67 mRNAs suggest that the two glutamate decarboxylases play distinctive functional roles. J. Neurosci. Res. 34, 689–706. doi: 10.1002/jnr.490340612
Fish, K. N., Sweet, R. A., and Lewis, D. A. (2011). Differential distribution of proteins regulating GABA synthesis and reuptake in axon boutons of subpopulations of cortical interneurons. Cereb. Cortex 21, 2450–2460. doi: 10.1093/cercor/bhr007
Fu, L. Y., and van den Pol, A. N. (2007). GABA excitation in mouse hilar neuropeptide Y neurons. J. Physiol. 579(Pt 2), 445–464. doi: 10.1113/jphysiol.2002.019356
Fuentealba, P., Begum, R., Capogna, M., Jinno, S., Márton, L. F., Csicsvari, J., et al. (2008). Ivy cells: a population of nitric-oxide-producing, slow-spiking GABAergic neurons and their involvement in hippocampal network activity. Neuron 57, 917–929. doi: 10.1016/j.neuron.2008.01.034
Fukuda, T., Heizmann, C. W., and Kosaka, T. (1997). Quantitative analysis of GAD65 and GAD67 immunoreactivities in somata of GABAergic neurons in the mouse hippocampus proper (CA1 and CA3 regions), with special reference to parvalbumin-containing neurons. Brain Res. 764, 237–243. doi: 10.1016/s0006-8993(97)00683-5
Garthwaite, J. (1991). Glutamate, nitric oxide and cell-cell signalling in the nervous system. Trends Neurosci. 14, 60–67. doi: 10.1016/0166-2236(91)90022-m
Gonchar, Y., and Burkhalter, A. (1997). Three distinct families of GABAergic neurons in rat visual cortex. Cereb. Cortex 7, 347–358. doi: 10.1093/cercor/7.4.347
Gonchar, Y., Wang, Q., and Burkhalter, A. (2007). Multiple distinct subtypes of GABAergic neurons in mouse visual cortex identified by triple immunostaining. Front. Neuroanat. 1:3. doi: 10.3389/neuro.05.003.2007
González-Albo, M. C., Elston, G. N., and DeFelipe, J. (2001). The human temporal cortex: characterization of neurons expressing nitric oxide synthase, neuropeptides and calcium-binding proteins, and their glutamate receptor subunit profiles. Cereb. Cortex 11, 1170–1181. doi: 10.1093/cercor/11.12.1170
Guo, Y., Kaplan, I. V., Cooper, N. G., and Mower, G. D. (1997). Expression of two forms of glutamic acid decarboxylase (GAD67 and GAD65) during postnatal development of the cat visual cortex. Brain Res. Dev. Brain Res. 103, 127–141. doi: 10.1016/s0165-3806(97)81789-0
Hendrickson, A. E., Tillakaratne, N. J., Mehra, R. D., Esclapez, M., Erickson, A., Vician, L., et al. (1994). Differential localization of two glutamic acid decarboxylases (GAD65 and GAD67) in adult monkey visual cortex. J. Comp. Neurol. 343, 566–581. doi: 10.1002/cne.903430407
Hendry, S. H., Jones, E. G., DeFelipe, J., Schmechel, D., Brandon, C., and Emson, P. C. (1984). Neuropeptide-containing neurons of the cerebral cortex are also GABAergic. Proc. Natl. Acad. Sci. U.S.A. 81, 6526–6530. doi: 10.1073/pnas.81.20.6526
Horvath, T. L., Pu, S., Dube, M. G., Diano, S., and Kalra, S. P. (2001). A GABA-neuropeptide Y (NPY) interplay in LH release. Peptides 22, 473–481. doi: 10.1016/s0196-9781(01)00343-6
Houser, C. R., and Esclapez, M. (1994). Localization of mRNAs encoding two forms of glutamic acid decarboxylase in the rat hippocampal formation. Hippocampus 4, 530–545. doi: 10.1002/hipo.450040503
Jayakumar, A. R., Sujatha, R., Paul, V., Asokan, C., Govindasamy, S., and Jayakumar, R. (1999). Role of nitric oxide on GABA, glutamic acid, activities of GABA-T and GAD in rat brain cerebral cortex. Brain Res. 837, 229–235. doi: 10.1016/s0006-8993(99)01692-3
Jinno, S., Kinukawa, N., and Kosaka, T. (2001). Morphometric multivariate analysis of GABAergic neurons containing calretinin and neuronal nitric oxide synthase in the mouse hippocampus. Brain Res. 900, 195–204. doi: 10.1016/s0006-8993(01)02292-2
Jinno, S., and Kosaka, T. (2009). Neuronal circuit-dependent alterations in expression of two isoforms of glutamic acid decarboxylase in the hippocampus following electroconvulsive shock: a stereology-based study. Hippocampus 19, 1130–1141. doi: 10.1002/hipo.20576
Kahn, R. A., Panah, M., Kiffel, S., and Weinberger, J. (1997a). Modulation of ischemic excitatory neurotransmitter and gamma-aminobutyric acid release during global temporary cerebral ischemia by local nitric oxide synthase inhibition. Anesth. Analg. 84, 1004–1010. doi: 10.1097/00000539-199705000-00010
Kahn, R. A., Panah, M., and Weinberger, J. (1997b). Modulation of ischemic excitatory neurotransmitter and gamma-aminobutyric acid release during global temporary cerebral ischemia by selective neuronal nitric oxide synthase inhibition. Anesth. Analg. 84, 997–1003. doi: 10.1097/00000539-199705000-00009
Kajita, Y., Kojima, N., Koganezawa, N., Yamazaki, H., Sakimura, K., and Shirao, T. (2017). Drebrin E regulates neuroblast proliferation and chain migration in the adult brain. Eur. J. Neurosci. 46, 2214–2228. doi: 10.1111/ejn.13668
Kanaani, J., el-Husseini, A.-D., Aguilera-Moreno, A., Diacovo, J. M., Bredt, D. S., and Baekkeskov, S. (2002). A combination of three distinct trafficking signals mediates axonal targeting and presynaptic clustering of GAD65. J. Cell Biol. 158, 1229–1238. doi: 10.1083/jcb.200205053
Kanaani, J., Patterson, G., Schaufele, F., Lippincott-Schwartz, J., and Baekkeskov, S. (2008). A palmitoylation cycle dynamically regulates partitioning of the GABA-synthesizing enzyme GAD65 between ER-Golgi and post-Golgi membranes. J. Cell Sci. 121(Pt 4), 437–449. doi: 10.1242/jcs.011916
Kawaguchi, Y., and Kondo, S. (2002). Parvalbumin, somatostatin and cholecystokinin as chemical markers for specific GABAergic interneuron types in the rat frontal cortex. J. Neurocytol. 31, 277–287. doi: 10.1023/a:1024126110356
Köhler, C., Eriksson, L. G., Davies, S., and Chan-Palay, V. (1987). Co-localization of neuropeptide tyrosine and somatostatin immunoreactivity in neurons of individual subfields of the rat hippocampal region. Neurosci. Lett. 78, 1–6. doi: 10.1016/0304-3940(87)90551-9
Kubota, Y., and Kawaguchi, Y. (1997). Two distinct subgroups of cholecystokinin-immunoreactive cortical interneurons. Brain Res. 752, 175–183. doi: 10.1016/s0006-8993(96)01446-1
Kubota, Y., Shigematsu, N., Karube, F., Sekigawa, A., Kato, S., Yamaguchi, N., et al. (2011). Selective coexpression of multiple chemical markers defines discrete populations of neocortical GABAergic neurons. Cereb. Cortex 21, 1803–1817. doi: 10.1093/cercor/bhq252
Kuki, T., Fujihara, K., Miwa, H., Tamamaki, N., Yanagawa, Y., and Mushiake, H. (2015). Contribution of parvalbumin and somatostatin-expressing GABAergic neurons to slow oscillations and the balance in beta-gamma oscillations across cortical layers. Front. Neural Circ. 9:6. doi: 10.3389/fncir.2015.00006
Kuriyama, K., and Ohkuma, S. (1995). Role of nitric oxide in central synaptic transmission: effects on neurotransmitter release. Jpn. J. Pharmacol. 69, 1–8. doi: 10.1254/jjp.69.1
Lapray, D., Lasztoczi, B., Lagler, M., Viney, T. J., Katona, L., Valenti, O., et al. (2012). Behavior-dependent specialization of identified hippocampal interneurons. Nat. Neurosci. 15, 1265–1271. doi: 10.1038/nn.3176
Lazarus, M. S., Krishnan, K., and Huang, Z. J. (2015). GAD67 deficiency in parvalbumin interneurons produces deficits in inhibitory transmission and network disinhibition in mouse prefrontal cortex. Cereb. Cortex 25, 1290–1296. doi: 10.1093/cercor/bht322
Marangoz, C., Ayyildiz, M., and Aǧar, E. (1994). Evidence that sodium nitroprusside possesses anticonvulsant effects mediated through nitric oxide. Neuroreport 5, 2454–2456. doi: 10.1097/00001756-199412000-00012
Martin, D. L., and Rimvall, K. (1993). Regulation of gamma-aminobutyric acid synthesis in the brain. J. Neurochem. 60, 395–407. doi: 10.1111/j.1471-4159.1993.tb03165.x
Mower, G. D., and Guo, Y. (2001). Comparison of the expression of two forms of glutamic acid decarboxylase (GAD67 and GAD65) in the visual cortex of normal and dark-reared cats. Brain Res. Dev. Brain Res. 126, 65–74. doi: 10.1016/s0165-3806(00)00139-5
Northoff, G., and Mushiake, H. (2020). Why context matters? Divisive normalization and canonical microcircuits in psychiatric disorders. Neurosci. Res. 156, 130–140. doi: 10.1016/j.neures.2019.10.002
Obata, K., Hirono, M., Kume, N., Kawaguchi, Y., Itohara, S., and Yanagawa, Y. (2008). GABA and synaptic inhibition of mouse cerebellum lacking glutamate decarboxylase 67. Biochem. Biophys. Res. Commun. 370, 429–433. doi: 10.1016/j.bbrc.2008.03.110
Orbán-Kis, K., Szabadi, T., and Szilágyi, T. (2015). The loss of Ivy cells and the hippocampal input modulatory O-LM cells contribute to the emergence of hyperexcitability in the hippocampus. Rom. J. Morphol. Embryol. 56, 155–161.
Paredes, M. F., Greenwood, J., and Baraban, S. C. (2003). Neuropeptide Y modulates a G protein-coupled inwardly rectifying potassium current in the mouse hippocampus. Neurosci. Lett. 340, 9–12. doi: 10.1016/s0304-3940(03)00036-3
Penix, L. P., Davis, W., and Subramaniam, S. (1994). Inhibition of NO synthase increases the severity of kainic acid-induced seizures in rodents. Epilepsy Res. 18, 177–184. doi: 10.1016/0920-1211(94)90038-8
Perrenoud, Q., Rossier, J., Geoffroy, H., Vitalis, T., and Gallopin, T. (2013). Diversity of GABAergic interneurons in layer VIa and VIb of mouse barrel cortex. Cereb. Cortex 23, 423–441. doi: 10.1093/cercor/bhs032
Price, C. J., Cauli, B., Kovacs, E. R., Kulik, A., Lambolez, B., Shigemoto, R., et al. (2005). Neurogliaform neurons form a novel inhibitory network in the hippocampal CA1 area. J. Neurosci. 25, 6775–6786. doi: 10.1523/JNEUROSCI.1135-05.2005
Rimvall, K., Sheikh, S. N., and Martin, D. L. (1993). Effects of increased gamma-aminobutyric acid levels on GAD67 protein and mRNA levels in rat cerebral cortex. J. Neurochem. 60, 714–720. doi: 10.1111/j.1471-4159.1993.tb03206.x
Rudy, B., Fishell, G., Lee, S., and Hjerling-Leffler, J. (2011). Three groups of interneurons account for nearly 100% of neocortical GABAergic neurons. Dev. Neurobiol. 71, 45–61. doi: 10.1002/dneu.20853
Sackeim, H. A. (1999). The anticonvulsant hypothesis of the mechanisms of action of ECT: current status. J. ECT 15, 5–26.
Sanacora, G., Mason, G. F., Rothman, D. L., Hyder, F., Ciarcia, J. J., Ostroff, R. B., et al. (2003). Increased cortical GABA concentrations in depressed patients receiving ECT. Am. J. Psychiatry 160, 577–579. doi: 10.1176/appi.ajp.160.3.577
Schuman, E. M., and Madison, D. V. (1994). Nitric oxide and synaptic function. Annu. Rev. Neurosci. 17, 153–183. doi: 10.1146/annurev.ne.17.030194.001101
Schweitzer, P., Madamba, S. G., and Siggins, G. R. (1998). Somatostatin increases a voltage-insensitive K+ conductance in rat CA1 hippocampal neurons. J. Neurophysiol. 79, 1230–1238. doi: 10.1152/jn.1998.79.3.1230
Sutula, T., Goldschmidt, R., and Steward, O. (1983). Mechanisms of colchicine neurotoxicity in the dentate gyrus: dissociation of seizures and cell death. Exp. Neurol. 81, 683–693. doi: 10.1016/0014-4886(83)90335-7
Tallent, M. K., and Siggins, G. R. (1999). Somatostatin acts in CA1 and CA3 to reduce hippocampal epileptiform activity. J. Neurophysiol. 81, 1626–1635. doi: 10.1152/jn.1999.81.4.1626
Tian, N., Petersen, C., Kash, S., Baekkeskov, S., Copenhagen, D., and Nicoll, R. (1999). The role of the synthetic enzyme GAD65 in the control of neuronal gamma-aminobutyric acid release. Proc. Natl. Acad. Sci. U.S.A. 96, 12911–12916. doi: 10.1073/pnas.96.22.12911
Tremblay, R., Lee, S., and Rudy, B. (2016). GABAergic interneurons in the neocortex: from cellular properties to circuits. Neuron 91, 260–292. doi: 10.1016/j.neuron.2016.06.033
Tricoire, L., Pelkey, K. A., Daw, M. I., Sousa, V. H., Miyoshi, G., Jeffries, B., et al. (2010). Common origins of hippocampal Ivy and nitric oxide synthase expressing neurogliaform cells. J. Neurosci. 30, 2165–2176. doi: 10.1523/JNEUROSCI.5123-09.2010
Tricoire, L., and Vitalis, T. (2012). Neuronal nitric oxide synthase expressing neurons: a journey from birth to neuronal circuits. Front. Neural Circ. 6:82. doi: 10.3389/fncir.2012.00082
Tritsch, N. X., Granger, A. J., and Sabatini, B. L. (2016). Mechanisms and functions of GABA co-release. Nat. Rev. Neurosci. 17, 139–145. doi: 10.1038/nrn.2015.21
Vega Rasgado, L. A., Reyes, G. C., and Vega Díaz, F. (2018). Role of nitric oxide synthase on brain GABA transaminase activity and GABA levels. Acta Pharm. 68, 349–359. doi: 10.2478/acph-2018-0022
Vezzani, A., Sperk, G., and Colmers, W. F. (1999). Neuropeptide Y: emerging evidence for a functional role in seizure modulation. Trends Neurosci. 22, 25–30. doi: 10.1016/s0166-2236(98)01284-3
Wang, X., Gao, F., Zhu, J., Guo, E., Song, X., Wang, S., et al. (2014). Immunofluorescently labeling glutamic acid decarboxylase 65 coupled with confocal imaging for identifying GABAergic somata in the rat dentate gyrus-A comparison with labeling glutamic acid decarboxylase 67. J. Chem. Neuroanat. 6, 51–63. doi: 10.1016/j.jchemneu.2014.07.002
Wenzel, M., Hamm, J. P., Peterka, D. S., and Yuste, R. (2017). Reliable and elastic propagation of cortical seizures in vivo. Cell Rep. 19, 2681–2693. doi: 10.1016/j.celrep.2017.05.090
Keywords: cerebral cortex, GABAergic subtype, GAD65, hippocampus, rat
Citation: Kajita Y and Mushiake H (2021) Heterogeneous GAD65 Expression in Subtypes of GABAergic Neurons Across Layers of the Cerebral Cortex and Hippocampus. Front. Behav. Neurosci. 15:750869. doi: 10.3389/fnbeh.2021.750869
Received: 31 July 2021; Accepted: 16 September 2021;
Published: 03 November 2021.
Edited by:
Shozo Tobimatsu, Kyushu University, JapanReviewed by:
Hideo Hagihara, Fujita Health University, JapanCopyright © 2021 Kajita and Mushiake. This is an open-access article distributed under the terms of the Creative Commons Attribution License (CC BY). The use, distribution or reproduction in other forums is permitted, provided the original author(s) and the copyright owner(s) are credited and that the original publication in this journal is cited, in accordance with accepted academic practice. No use, distribution or reproduction is permitted which does not comply with these terms.
*Correspondence: Hajime Mushiake, aG11c2hpYWtAbWVkLnRvaG9rdS5hYy5qcA==
Disclaimer: All claims expressed in this article are solely those of the authors and do not necessarily represent those of their affiliated organizations, or those of the publisher, the editors and the reviewers. Any product that may be evaluated in this article or claim that may be made by its manufacturer is not guaranteed or endorsed by the publisher.
Research integrity at Frontiers
Learn more about the work of our research integrity team to safeguard the quality of each article we publish.