 Kenji Miyazawa
 Yun Liu
 Hojjat Bazzazi
- Moderna Therapeutics, Cambridge, MA, United States
Physiologically based pharmacokinetic models have gained significant recognition as effective mathematical models that enable deeper mechanistic investigation of drug delivery and tissue disposition. Here we describe the development of a platform PBPK-quantitative systems pharmacology (QSP) model to study tissue delivery of lipid nanoparticle (LNP) based mRNA therapeutics. The model is calibrated to published data in the context of Crigler-Najjar syndrome. Sensitivity analyses were performed to explore factors that influence protein expression and pharmacodynamic response following LNP-mRNA liver disposition. The most sensitive determinants of protein exposures were mRNA stability, translation, and cellular uptake rate, while the liver influx rate of lipid nanoparticle did not appreciably impact protein expression. Indeed, protein expression level may be tuned by modulation of mRNA degradation rate. However, simulations predicted that when the intrinsic half-life of the translated protein falls below a certain threshold, lowering mRNA degradation rate may not rescue protein exposure, a design feature that should be considered in optimal design of mRNA therapeutics. Additionally, interplay of LNP degradation rate and mRNA escape rate from endosomes was found to be crucial in modulation of protein expression. Simulations predicted that at a given LNP degradation rate, protein exposure varied linearly with mRNA escape rate. We further extended the model by incorporating LNP recycling to identify conditions necessary for observing a second peak in mRNA pharmacokinetics (PK). Simulations predict that with a fast recycling and slow tissue re-uptake rates, a robust second peak is observed in the plasma mRNA concentration curve. The amplitude and timing of the second peak could be tuned with recycling and re-uptake rates. Modeling results indicate that within the context of non-secreted mRNA mediated enzyme replacement therapy, recycling may depress or improve protein exposure depending on the re-uptake rate of the recycled LNP. The model is subsequently used to generate virtual animal cohorts to investigate optimal dosing and schedule of the compound. Virtual instances of the model were then employed to identify design principles that potentially reduce dosing frequency while maintaining efficacy. This study demonstrates the potential applications of coupled PBPK-QSP model for LNP based mRNA therapeutics as a translational platform.
Introduction
mRNA based vaccines have been highly effective against SARS COVID-19 and were instrumental in helping curtail the COVID-19 pandemic and save millions of lives (Polack et al., 2020; Baden et al., 2021; Watson et al., 2022). The enormous success of mRNA vaccines has provided strong impetus to accelerate development of mRNA-based therapies in disease areas beyond infectious diseases including rare metabolic (Berraondo et al., 2019), autoimmune diseases (Krienke et al., 2021) and oncology (Miao et al., 2021). A key challenge in extending the application of mRNA platform to other disease areas and realizing the full potential of this therapy is quantitative understanding and optimization of mRNA and encoded protein PK at the site of action and other tissues in the body (Rohner et al., 2022). In recent years, efficient mRNA targeting and exposure have been achieved by enclosing the mRNA of interest in LNPs with differing physicochemical properties (Hou et al., 2021), and have been applied in many therapeutic applications. In the case of enzyme replacement therapies, the downstream mRNA-translated protein is intracellular (Vavilis et al., 2023). For other applications, the expressed protein is secreted, such as the mRNA-encoded monoclonal antibodies used in infectious diseases (Mu et al., 2022), or mRNA-encoded T-cell engagers in oncology (Stadler et al., 2017). While much progress has been made around LNP-mediated mRNA therapies, optimizing this platform requires precise quantitative understanding of the PK of mRNA and encoded protein.
The rapid evolution of mRNA technology and potential applications beyond vaccines necessitate quantitative modeling to optimize dosing level, schedule, and therapeutic index (Selvaggio et al., 2021; Attarwala et al., 2023). To that end, quantitative systems pharmacology modeling has served as an effective tool to accelerate pharmaceutical drug development through building of systems level mechanistic mathematical models (Van Der Graaf and Benson, 2011). Unlike traditional PK/PD modeling, QSP models are designed to incorporate mechanistic drug-body interactions, enabling the extrapolation of key treatment steps and identification of critical optimization factors (Knight-Schrijver et al., 2016; Musante et al., 2017). QSP models also contribute to applications in translational medicine including but not limited to identification of novel targets and biomarkers, guiding of preclinical study design, and evaluation of potential biomarkers (Gadkar et al., 2016).
Similarly, PBPK models have been used extensively to mechanistically interrogate biodistribution and PK of biologics (Garg and Balthasar, 2007; Shah and Betts, 2012), small molecules (Kilford et al., 2022), and nanoparticles for efficacy and safety applications (Aborig et al., 2019; Kutumova et al., 2022; Kumar et al., 2023). These models explicitly include physiological and anatomical features of the body and reduce the number of non-physiological parameters that need to be estimated when scaling to human from preclinical species. The complexity of LNP-mRNA based therapeutics including LNP-mediated tissue entry, cellular uptake, LNP and mRNA degradation, mRNA escape, and translation, renders PBPK modeling a requirement for deeper understanding of these processes.
In this study, we developed a general platform minimal PBPK-QSP model for enzyme replacement therapy, using Crigler-Najjar (CN) syndrome as the context for model simulations. CN syndrome type 1 is a rare inborn error characterized by the absence of the protein uridine glucuronotransferase (UGT) (Bosmas et al., 1994). This protein catalyzes the conversion of the toxic metabolite, bilirubin, from an indirect form into a direct form with a higher clearance rate, accelerating its elimination (Wang et al., 2006). UGT deficiency leads to bilirubin accumulation, placing patients at high risk of bilirubin-induced neurological deficits, including speech impairment, ataxia, and even death if left untreated (Roger et al., 1995; Jansen, 1999; Wennberg, 2000). The current QSP model of CN syndrome, developed by Apgar et al. (2018), includes the administration of hUGT1A1-modified RNA, which encodes for the UGT1A1 enzyme, as a treatment for CN syndrome. The model captures experimental measurements and makes projections for efficacious dosing regimen in human patients. Here we describe a substantially more detailed PBPK model of LNP mediated mRNA disposition and integrate it with downstream protein exposure and PD activity. Our model tracks not only the transport and distribution of total mRNA treatment but also describes the generation of mRNA translated UGT protein and its catalytic effect on accumulated bilirubin from a systems pharmacology perspective. The model also incorporates the recycling mechanism of mRNA loaded LNP to explore the impact of redistribution on PK dynamics. This model allows for in silico investigation of conditions necessary for generation of a second peak in mRNA PK as observed experimentally (Goel et al., 2020; Abdelhady et al., 2023). Simulations also show implications of the recycling on protein production within the context of a non-secreted intracellular enzyme such as UGT. A detailed parameter sensitivity analysis was then conducted to identify significant parameters that may be modulated during mRNA design for enhancing protein expression and PD response. Virtual animal cohorts were then created to demonstrate utility of the model in clinical trial simulation. Simulations identified key design principles of LNP-mRNA that could be tuned to improve the treatment efficacy, offering potential strategies for enhancing protein expression durability with lower dosing frequency. Overall, the platform allows for integration of preclinical PK, PD, and tissue biodistribution data to project mRNA and protein exposures.
Methods
Model structure
The schematic of the PBPK model is shown in Figure 1. This model is comprised of seven major compartments: venous and arterial blood, lung, portal organs, liver, lymph nodes, and other tissues. The portal organs include the small and large intestine, spleen, and pancreas. Other organs encompass the heart, muscles, skin, adipose tissue, bone, brain, kidney, thymus, among others. For the simulations, LNP encapsulated mRNAs (LNP-mRNAs) are assumed to be administered into the venous compartment, from where they can circulate across the compartments through plasma/lymphatic flow or be taken up by cells at different tissue locations. The model was constructed for rat, and volumes of each compartment, volumetric blood and lymphatic flows are taken from the literature (Shah and Betts, 2012; Kumar et al., 2023).
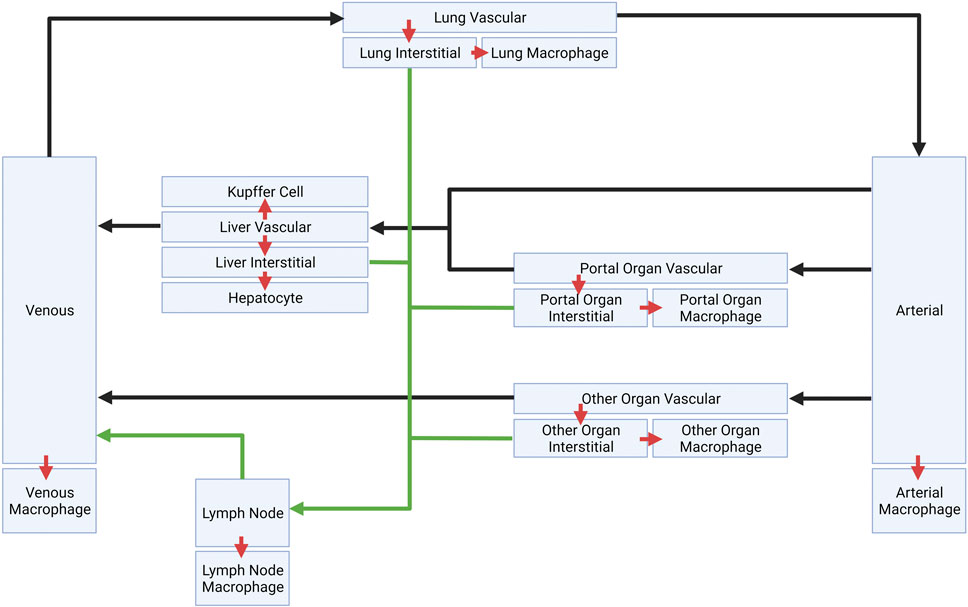
FIGURE 1. Schematic of platform minimal PBPK model. Plasma flows are indicated by black arrows. Lymphatic flows are indicated by green arrows. Inter-compartment transports are indicated by red arrows.
Model sub-compartment
Each compartment is further divided into several sub-compartments. Any non-liver organ compartment consists of a vascular space, an interstitial space, and phagocytic cells that take up LNP-mRNAs. Liver includes a Kupffer cell compartment that uptakes LNP-mRNAs from the vascular space. There is also a hepatocyte sub-compartment that is taking up LNP-mRNAs from interstitial space. The blood compartments also have phagocytic cells (macrophage) that phagocytose LNP-mRNAs. Schematic of liver sub-compartments can be found in Figure 2, while schematics for other compartments can be found in the supplementary material (Supplementary Figure S1).
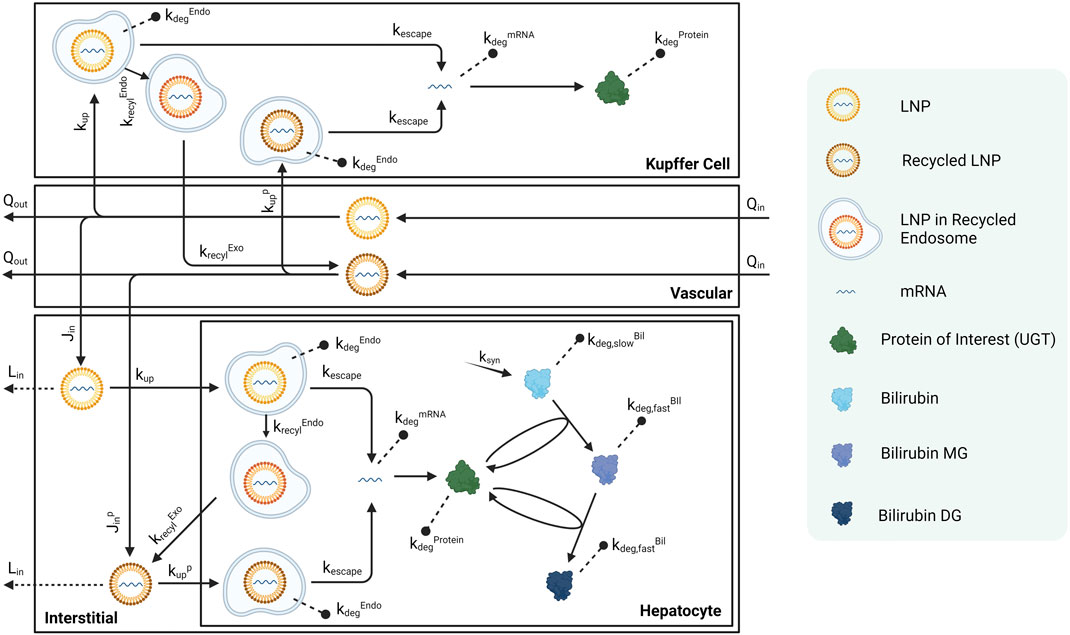
FIGURE 2. Schematic of sub-compartments for liver compartment. Schematics for other tissues can be found in the Supplementary Material.
LNP-mRNAs travel across different compartments through the vascular space, driven by the volumetric flow rates
Published Crigler-Najjar syndrome (CN) data in rats were used to calibrate this platform model (Apgar et al., 2018). As shown in Figure 2, bilirubin is generated in hepatocytes at a rate of
Body weight scaling
The model is scaled with body weights to generate parameter values for species of different weights (adult vs. juvenile rats as in Figure 3). The baseline values of all physiologically relevant parameters were retrieved from data for a 280-g rat (Shah and Betts, 2012). Therefore, the volume of each organ compartment was adjusted based on the fraction of the BW to 280 g:
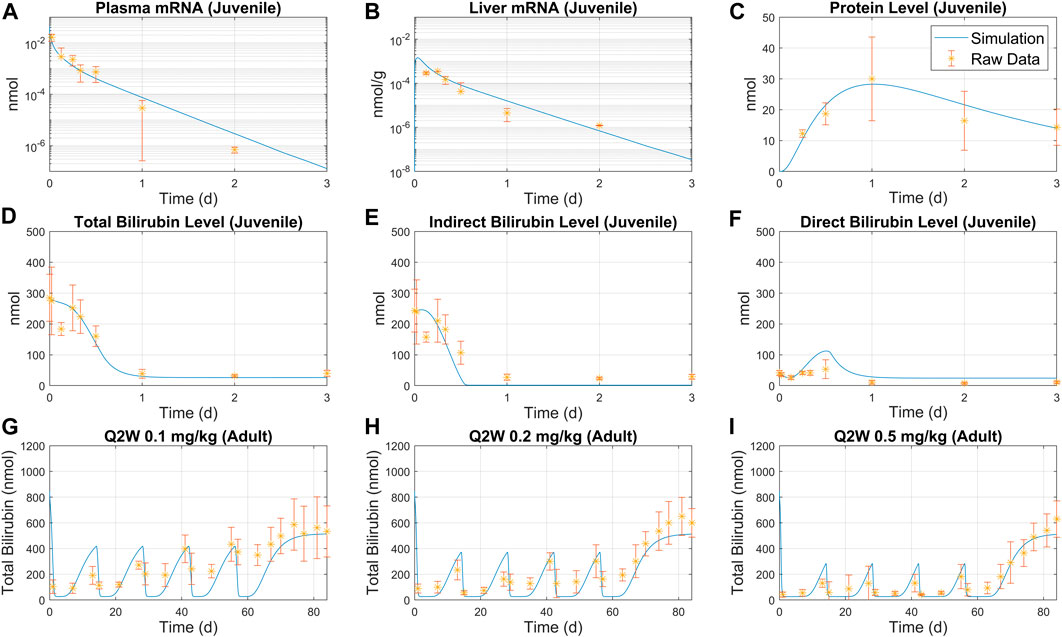
FIGURE 3. Overlay of model simulation and bilirubinemia data for juvenile and adult rats. Juvenile rat data for plasma mRNA (A), liver mRNA (B), UGT protein level (C) were used to calibrate the model. Predicted total bilirubin level (D), indirect bilirubin level (E) and direct bilirubin level (F) are compared to raw data. Simulation predictions are compared with adult rat treatment data under Q2W schedule with three different doses: (G) 0.1 mg/kg, (H) 0.2 mg/kg, and (I) 0.5 mg/kg. Average weight was set to 84 g for juvenile rats, and 139 g for adult rats.
Volumetric flow (
Initial indirect/direct bilirubin level
Experimental data used to calibrate the model suggest that 15% of total bilirubin is direct bilirubin (the catalyzed, fast-degrading form) under pre-treatment disease baseline conditions. Therefore, for all the simulations, 15% of the total bilirubin initial conditions are assumed to be in direct form, while the remaining 85% are assumed to be indirect bilirubin.
Model equations and analysis
In this section, we present examples of model equations included in this study. Model is implemented in Matlab SimBiology (Mathworks Inc. 2022). All the analysis including sensitivity analysis and parameter fitting were performed in Matlab. Model equations, reactions, and parameters are given in the supplementary excel file associated with this manuscript.
Equation 1 describes the rate of change in the amount of total mRNA encapsulated in LNP. The first term represents the cellular uptake, which is proportional to the volume of macrophages in the venous compartment,
Equation 2 describes the rate of change for LNP-mRNA amount in hepatocytes. The first term represents the uptake of LNP-mRNA in hepatocytes. The second term represents the escape of mRNA from endosomal LNP. The third term shows the endosomal degradation, and the last term represent the endosomal recycling.
Equation 3 describes the rate of change for escaped free mRNA amount in hepatocytes. The first term represents the escape of mRNA from LNP within endosomes. The second term represents the natural degradation of mRNA.
Equation (Berraondo et al., 2019) characterizes the rate of change for hepatocyte UGT protein amount. The first two terms depict the translation from mRNA and innate protein degradation, respectively. The second and third lines represent the catalytic reactions that involve UGT.
Model calibration
Model is calibrated to bilirubin rat data published in Apgar et al. (Apgar et al., 2018). Kinetic parameters were estimated by fitting the model to the data in MATLAB SimBiology. Specifically, total amount of mRNA, whether in free form or encapsulated in LNP, was fitted to juvenile rat liver mRNA data to estimate
Model validation
The model is parameterized with bilirubinemia juvenile rat data following a bolus 0.3 mg/kg treatment for 3 days, as shown in Figure 3A–C. Model simulations using estimated parameters successfully predicted the pharmacokinetic (PK) and pharmacodynamic (PD) data as shown Figure 3D–I. A good match was observed between indirect/direct bilirubin data and model simulations as demonstrated by Figure 3D–F. The model was then used to simulate total bilirubin for Q2W and Q4W schedules and exhibited reasonable consistency with the observed data as shown in Figure 3G–I and Supplementary Figure S4, S5A, B. Furthermore, model simulations captured total mRNA in plasma and liver (Supplementary Figure S3A, B) and total bilirubin and protein (Supplementary Figure S3C, D) following single bolus treatment.
Results
Parameter sensitivity analysis
A local sensitivity analysis was conducted to assess the impact of parameters in the model. LNP design could impact six parameters in the model and these parameters were selected for sensitivity analysis:
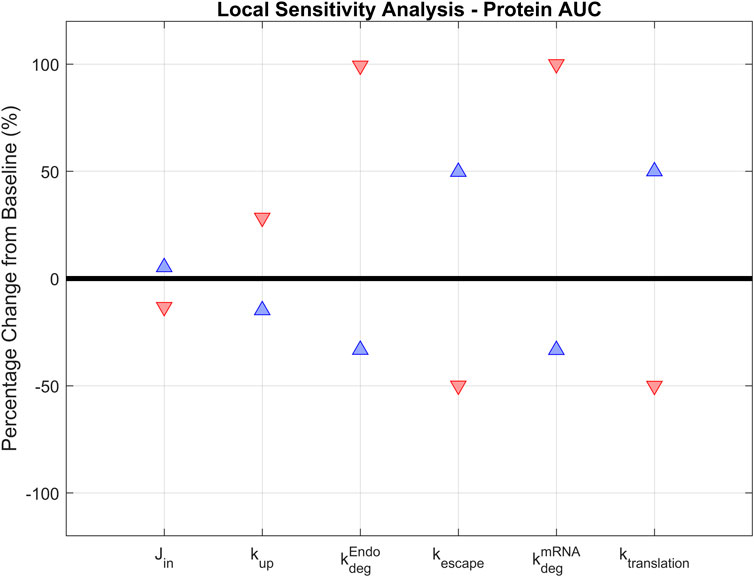
FIGURE 4. Local sensitivity analysis. Parameters that are essential for treatment design (
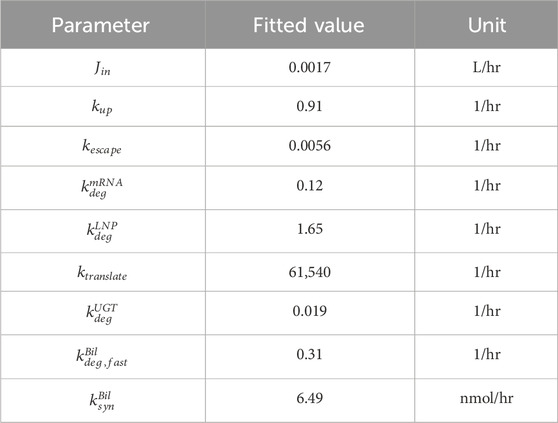
TABLE 1. Summary of fitted model parameters.
The model is most positively sensitive to the endosomal and mRNA degradation rates (100% increase for both), followed by the mRNA translation and escape rates (around 50% increase). It is moderately sensitive to the cellular uptake rate, but not sensitive to the transport rate from vascular into interstitial space. A similar trend is observed in negative sensitivities: The model is sensitive to translation rate, mRNA escape rate, and LNP and mRNA degradation rates. It is insensitive to uptake or tissue transport rates (Table 2). This initial sensitivity analysis provides insights into the parameters that are more important to consider when optimizing treatment design to achieve better efficacy. The analysis suggests that the stability of LNP and mRNA plays significant role in enhancing protein expression. We also performed a global sensitivity analysis using the partial rank correlation coefficient (PRCC) method to further explore the strength and direction of the relationship between crucial parameters and model output in the presence of the recycling mechanism (Marino et al., 2008). Rankings of negatively/positively correlated parameters to hepatocyte protein/mRNA AUCs are presented in the supplementary material (Supplementary Figure S6). We observed several parameters highly correlated to hepatocyte protein AUC, such as protein translation rate, mRNA escape rate, protein stability, and mRNA degradation rate. Further, global sensitivity analysis identified a more prominent role for tissue influx rate (Jin, Supplementary Figure S6B) compared to local sensitivity analysis. On the other hand, hepatocyte mRNA AUC is strongly correlated with cellular uptake rate, endosomal degradation rate, tissue transport and recycling rate (Supplementary Figure S6C, D).
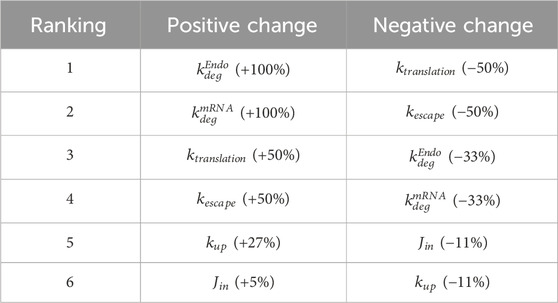
TABLE 2. Ranking of sensitivity.
Interplay of mRNA and protein degradation in LNP-mRNA therapy
Next, we examined how protein expression is affected by mRNA and protein stability. The degradation rates of mRNA and protein were simultaneously varied from 0.2 to 5 folds, and the resulting hepatocyte protein AUCs were plotted (Figure 5A). Recycling mechanism is turned off for this simulation. The protein AUC increased as either of the degradation rates were reduced. The highest AUC was observed under the lowest mRNA and protein degradation rates. Conversely, the lowest AUC was observed under the highest degradation rates for both mRNA and protein. Protein production time-courses at five pairs of mRNA and protein degradation rates were also plotted (Figure 5B).
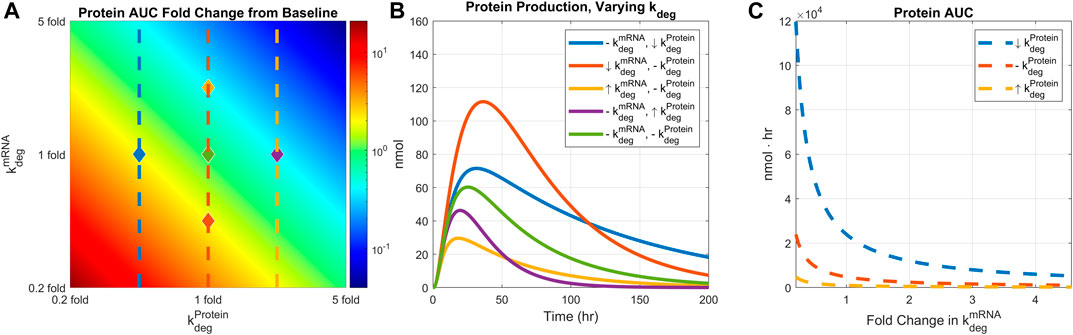
FIGURE 5. Comparing the effect of mRNA degradation and protein degradation rates on protein expression. mRNA degradation rate and protein degradation rates are varied by 0.2 to 5-fold simultaneously. (A) AUC 2D colormap. (B) Protein production time-courses under different levels of mRNA and protein degradation rates. Baseline simulation is plotted in light green color. Down-arrow indicates 0.4-fold change in the rate, up-arrow indicates 2.5-fold change in the rate, and the dashed line indicates baseline value. Each line is marked in the heatmap with diamonds with corresponding line colors and rate values. (C) AUC values under different mRNA degradation rates and fixed protein degradation. Each protein degradation rate is shown in the heatmap with matching line colors and styles. Dose is fixed to 0.5 mg/kg, body weight is fixed to 139 g, and recycling is turned off.
In addition, protein AUCs are plotted under a fixed protein degradation rate while varying the mRNA degradation rate (Figure 5C). For a given level of protein degradation rate, one can manipulate the final protein AUC by adjusting the mRNA degradation rate. However, such an effect reaches saturation beyond a certain level of mRNA degradation, implying a threshold of mRNA stability beyond which protein exposure is not impacted by underlying mRNA dynamics. Model simulations also imply that mRNA stability has bigger impact on protein with lower degradation rate (Figure 5C, dashed blue line) than a protein with higher degradation rate (Figure 5C, dashed yellow line).
Interplay of endosomal degradation and rate of mRNA escape
We next examined how the interplay of endosomal LNP degradation and mRNA escape rates would affect protein expression. Both the endosomal degradation and mRNA escape rates were varied by 0.2 to 5-fold simultaneously, and the resulting protein AUCs were plotted (Figure 6A). Recycling mechanisms are turned off in this simulation. Total protein expression decreases as the endosomal degradation rate increases or the mRNA escape rate decreases. The highest protein expression is observed under the lowest endosomal degradation and fastest mRNA escape conditions as expected. Five pairs of endosomal degradation and escape rates were selected to plot the protein production time-courses (Figure 6B).
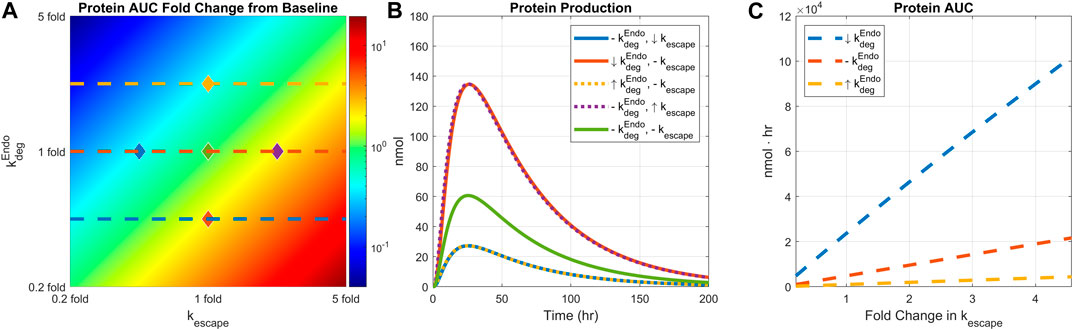
FIGURE 6. Comparing the effect of endosomal degradation and mRNA escape rates on protein expression. Endosomal LNP degradation and mRNA escape rates are varied by 0.2 to 5-fold simultaneously. (A) The heatmap of AUC change from baseline. (B) Protein production time-courses under different level of endosomal degradation and mRNA escape rate. Baseline simulation is plotted in light green color. Down arrow indicates 0.4-fold change in the rate, up arrow indicates 2.5-fold change in the rate, and the dashed line indicates baseline value. Each line is marked in the heatmap with diamond dots with corresponding line colors and rate values. (C) AUC under varied mRNA escape rate and three fixed endosomal degradation rates. Each degradation rate is shown in the heatmap with matching line colors and styles. Dose is fixed to 0.5 mg/kg, weight is fixed to 139 g, and recycling is turned off.
Model simulations predict linear relationship between protein AUC and mRNA escape rate as shown in Figure 6C. The slopes of the lines are modulated by endosomal degradation rates implying potential tuning of protein exposure with mRNA escape rate.
Effect of recycling on LNP-mRNA pharmacokinetics: The interplay of recycling and uptake rates
Parameters related to LNP recycling mechanisms were varied to investigate conditions for observing a robust second peak in plasma PK of mRNA. The two critical parameters are as follows:
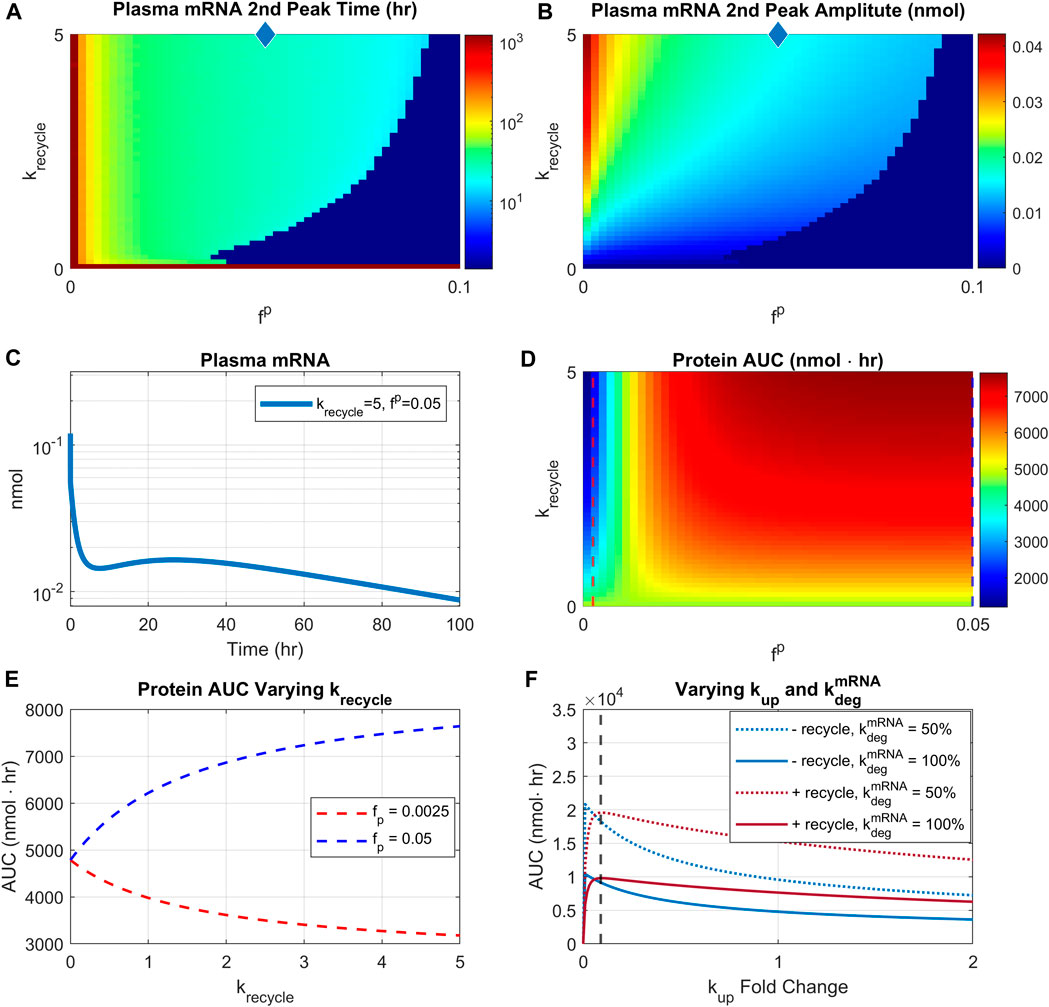
FIGURE 7. Effect of recycling rate and re-uptake of recycled LNP. Recycling rate is varied from 0 to 5/hr, and scaling factor
We then investigated the impact of recycling parameters on protein AUC (Figure 7D). There are two distinct regions with different profiles. For very small reuptake rates (<0.0025), protein AUC is reduced by increasing rates of recycling (Figure 7D, blue region). However, for sufficiently high reuptake rates (>0.01), increasing recycling rate would increase the protein AUC (Figure 7D, red region). Moreover, for sufficiently high recycling rate (>1/hr), increasing reuptake rate would increase protein AUC. The different relationship profiles between protein AUC and recycling are more clearly demonstrated by Figure 7E. The plot shows that with
Predicting efficacious dose and schedule with virtual populations
A virtual population study was conducted to investigate efficacious dose and schedule. A cohort of N = 100 virtual animals was created by varying the following parameters:
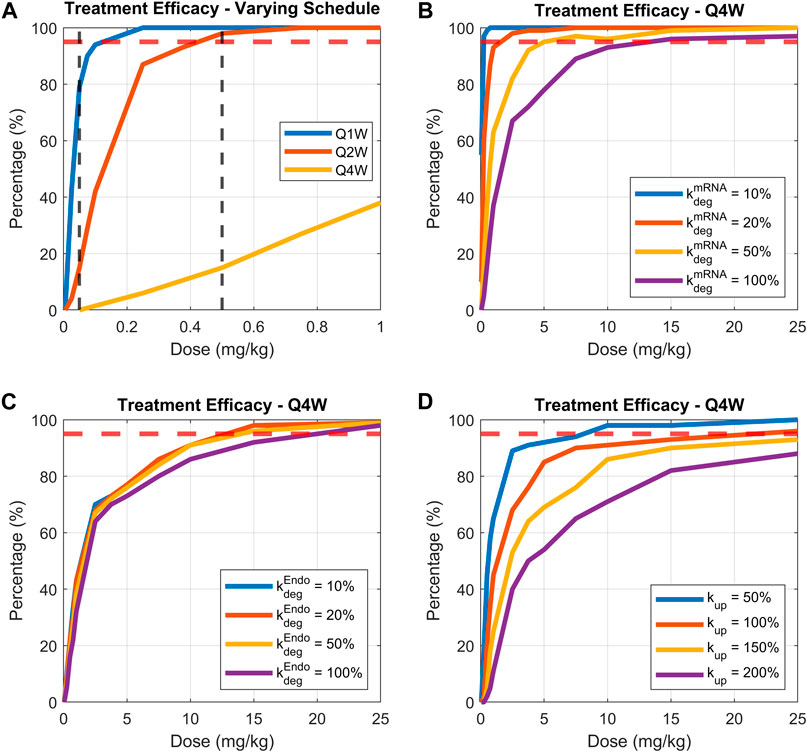
FIGURE 8. Comparing treatment efficacy under range of doses, dosing schedules, or parameters related to LNP-mRNA design. Treatment efficacy is defined as percentage of animals maintaining bilirubin levels lower than 100 nmol for more than 80% of treatment time. (A) Dose response curves for dosing schedules of weekly, bi-weekly, and monthly, (B) varying mRNA degradation rate while fixing the dosing schedule to be monthly, (C) varying endosomal LNP degradation rate while fixing the dosing schedule to be monthly, (D) varying uptake rate of LNP by phagocytic cells while fixing dosing schedule to be monthly. 95% threshold is indicated by the dashed red line.
Three groups of virtual animals are compared: those receiving a weekly dose, bi-weekly dose, and monthly dose (Figure 8A). The model predicts a low inflection point for the cohort receiving weekly treatment administration (∼0.1 mg/kg). Reducing dosing frequency (from weekly to monthly) increased the dose required to reach efficacy threshold. Indeed, the required dose for efficacy increases to around 0.4 and 17 mg/kg for bi-weekly and monthly dosing schedules, respectively (Figure 8A- solid red and yellow lines). Dosage of 0.05 and 0.5 mg/kg (vertical dashed black lines in Figure 8A) were selected to illustrate the examples of virtual patients’ bilirubin level time-courses, as shown in the (Supplementary Figure S8).
Identifying design features of mRNA therapies for enhanced efficacy with virtual patient simulations
The model was then used to identify mRNA design features that would recover efficacy under a monthly dosing schedule. We focused on three parameters: mRNA degradation rate, endosomal LNP degradation rate, and the cellular uptake rate of LNP. The first two parameters (mRNA and LNP degradation rates) were varied by 10%, 20%, 50% and 100%, and the cellular uptake rate was varied by 50%, 100%, 150% and 200%. The treatment efficacy under a range of doses is plotted in Figures 8B–D.
Model simulations demonstrate that under a monthly treatment schedule, reducing mRNA degradation rate would significantly enhance efficacy (lower dose required for 95% of patients having lower than 100 nmol bilirubin). Indeed, a 5-fold increase in mRNA stability (Figure 8B solid red line) would reduce the efficacious dose from 17 mg/kg to ∼1.5 mg/kg, demonstrating powerful impact of mRNA degradation rate on efficacious dosing regimen. Interestingly, modulating endosomal LNP degradation rate does not improve treatment efficacy (Figure 8C). On the other hand, reducing cellular uptake rate of LNP may enhance treatment efficacy. As shown in Figure 8D, as the uptake rate is reduced to 50% of base-value, the dose required for efficacy is reduced to 8 mg/kg. Overall, the greatest impact on efficacy in a virtual animal cohort is by modulation of mRNA degradation rate as in Figure 8B.
Discussion
In this study, we constructed a PBPK-QSP model and showed its potential to serve as a platform model within the context of enzyme replacement therapy. In the case of mRNA-loaded LNP-based therapy for CN syndrome, our model successfully captured the pharmacokinetics of mRNA, synthesized protein and downstream reduction in bilirubin level under different dosing regimens.
Local sensitivity analysis revealed that parameters most significantly impacting protein exposure are mRNA and LNP degradation rates, mRNA escape rate from endosomes, and mRNA translation rate. The analyses suggest that the stability of mRNA and LNP are the most important factors for enhancing encoded protein expression and exposure. This finding is consistent with experimental results indicating that PEG-lipids on LNP surface are crucial for particle stability and circulation half-life (Hald Albertsen et al., 2022) and modification in LNP surface properties can significantly modulate downstream protein expression. Indeed, protein expression can be different by as much as 50-fold depending on the LNP surface characteristics (Arteta et al., 2018). Simulations predicted a highly nonlinear dependence of liver AUC of encoded protein with mRNA degradation rate, providing basis for the use of QSP modeling to optimize mRNA stability early in development to achieve optimal levels of protein exposure. The highly sensitive dependence of protein exposure to the mRNA escape rate is also consistent with experimental data suggesting that escape rate is the limiting step in protein expression (Arteta et al., 2018) and underscores the importance of examining the pKa value of the LNP, that is related to the protonation of the LNP within the endosome (Patel et al., 2021). Although less sensitive, it was also suggested that protein exposure may be influenced by the cellular uptake rate of LNP which may be modified by particle size. Previous mathematical models predict that time required for receptor mediated endocytosis of nanoparticles may be dependent on LNP size (Gao et al., 2005; Zhang et al., 2015). Experimental work also indicates that the biodistribution of mRNA loaded LNPs is affected not only by the delivery route but also by particle sizes, with smaller LNPs resulting in more accumulation in the liver or spleen, and larger LNPs remaining and accumulating at the injection site (Di et al., 2022). Another study suggests that the uptake rate of nanoparticles may depend linearly on the radius of the cell, highlighting the need to optimize LNP uptake rates for delivery to cells of different sizes (Khetan et al., 2019).
We next attempted to identify mechanisms contributing to potential second peak in mRNA PK and its implication for PD response. LNP redistribution and recycling have been observed in LNP based therapies (Goel et al., 2020; Abdelhady et al., 2023) and the model provided a platform to study this effect in silico given the absence of mechanistic empirical data. Simulations indicated that this second peak is formed under fast recycling rates and slow re-uptake rates. This implies that in order to observe a visible second peak in plasma mRNA, LNP must be recycled on the timescale of minutes with slow rate of re-uptake (1%–5% of base value). Simulations identified two different profiles for the relationship between protein AUC and recycling rate. Under a slow re-uptake rate (<0.0025 of base uptake rate), protein exposure decreases as the recycling rate increases. This observation is consistent with experimental data where siRNA delivery was shown to be greatly reduced as a result of exocytosis of the internalized siRNA from the late endosomes (Sahay et al., 2013). For sufficiently high re-uptake rates (>0.01 of base uptake rate), simulations predict a monotonically increasing relationships between protein exposure and recycling rate. To our knowledge, there is currently no experimental data to test this prediction.
In the context of liver enzyme replacement therapy, the existence of LNP recycling is predicted to lead to either upregulation or reduction of protein exposure so that any perturbations in LNP recycling would be expected to significantly modulate downstream PD response. Another finding that may be significant for design of LNP-mRNA is prediction of bimodal response between protein AUC and cellular uptake rate. Indeed, for cellular uptake rates above a threshold, the relationship between protein AUC and uptake rate is monotonically decreasing. Further, the bimodal relationship can be modulated by mRNA degradation and recycling rates, highlighting the need to consider complex interaction between mRNA stability and cellular uptake rate in LNP-mRNA design. Previous data have shown less potency for LNP systems that contain rapidly dissociating PEG-lipids (Chen et al., 2016). Together with the hypothesis that LNP properties are modified during the recycling process (Maugeri et al., 2019), we would expect a complex interplay between LNP uptake, recycling, and downstream protein expression. The model described here serves as a platform to investigate different hypothesis related to the interaction between LNP properties and the impact of LNP uptake, recycling, and re-distribution on downstream protein exposure.
A powerful application of QSP modeling is the ability to generate virtual populations and perform trial simulations in silico (Cheng et al., 2022). We examined how treatment efficacy would change for the same virtual animal cohort under different dosing regimens. As expected, increasing dosing interval increased the dose required for efficacy highlighting critical role of dosing frequency in modulation of efficacy and the rapid loss of efficacy with reduced dosing frequency. This result was an impetus to further investigate whether efficacious dose can be substantially lowered by adjusting parameters relevant to the design of LNP-mRNA. Accordingly, mRNA degradation rate and LNP uptake rate could significantly lower efficacious dose level for monthly dosing. The impact is particularly strong for mRNA degradation indicating that perturbations in mRNA stability would profoundly impact efficacious dose. Intriguingly, manipulating the endosomal degradation rate of LNP did not significantly alter treatment efficacy. This result was puzzling since our initial sensitivity study revealed a high model sensitivity to endosomal degradation rate. To understand this effect, we performed sensitivity analysis by including LNP recycling mechanism and discovered that in the presence of recycling and redistribution of LNP, the model sensitivity towards endosomal degradation decreases significantly (see Supplementary Figure S9). This result highlights the need for more detailed experimental investigation of the mechanisms underlying LNP recycling and exocytosis as potential pathways for tuning downstream protein exposure and PD response.
Another intriguing observation that emerged from our study pertains to potential improvement of efficacious response achieved through reduction of cellular LNP uptake. Model simulations suggest that as the rate of cellular uptake is reduced from baseline, the treatment response in animal cohorts is enhanced. This result is explained by Figure 7F, demonstrating that increasing uptake rate above a threshold level would in fact reduce protein AUC due to simultaneous contribution of LNP and mRNA degradation rates and cellular uptake rate at the level of escaped mRNA that is subsequently translated to protein. We indeed observed enhanced mRNA accumulation due to a higher uptake rate, which would result in lower protein production due to LNP and mRNA degradation, as shown in Supplementary Figure S10. These results highlight the complex nature of interaction between different mechanisms contributing to encoded protein expression and emphasize the need to apply mechanistic model-based approaches very early in the process of mRNA design to help optimize LNP and mRNA properties for achieving optimal efficacy and therapeutic index.
Our model has several limitations. The current model does not include the transport of macrophages between tissue compartments, and therefore, does not portray the transport of LNP-mRNA with cellular transport. The model assumes linear rate of uptake by the endothelial and phagocytic cells and therefore does not account for potential target mediated disposition of LNPs that may manifest as nonlinear PK profile. The focus of the model has been on intravenous administration of LNPs. To simulate other routes of administration such as subcutaneous or intramuscular, additional skin and muscle sub-compartments need to be included in the model. Another important aspect of LNP dynamics that is not included is the impact of innate immune response on the PK/PD properties of LNP-mRNA therapeutics (Muslimov et al., 2023).
Despite its limitations, our model establishes a general PBPK-QSP platform to investigate LNP-mRNA biodistribution and downstream protein exposure and PD. Current model successfully captures the experimental PK/PD data and provides an initial evaluation of critical parameters for treatment optimization. The platform model can be applied to other disease areas related to enzyme replacement therapy (An et al., 2017; An et al., 2019; Attarwala et al., 2023). Another strength of the model presented here is that it explicitly tracks drug deposition and protein expression in Kupffer cells, which have been shown to be one of the major sites of LNP accumulation and gene expression following LNP-mediated mRNA delivery (Witzigmann et al., 2020).
In all, this work introduced a platform PBPK-QSP model for mechanistic investigation of LNP-mRNA mediated protein replacement therapy. While the current model is applied within the context of Crigler-Najjar syndrome, it is designed to serve as a platform that can be adapted to be broadly applied across rare diseases.
Data availability statement
The original contributions presented in the study are included in the article/Supplementary Material, further inquiries can be directed to the corresponding author.
Author contributions
KM: Conceptualization, Data curation, Formal Analysis, Investigation, Methodology, Software, Validation, Writing–original draft, Writing–review and editing. YL: Conceptualization, Data curation, Investigation, Methodology, Writing–review and editing. HB: Conceptualization, Data curation, Formal Analysis, Investigation, Methodology, Project administration, Resources, Software, Supervision, Writing–original draft, Writing–review and editing.
Funding
The author(s) declare financial support was received for the research, authorship, and/or publication of this article. The authors declare that this study received funding from Moderna Therapeutics. The funder was not involved in the study design, collection, analysis, interpretation of data, the writing of this article, or the decision to submit it for publication.
Conflict of interest
Authors KM,YL, HB were employed by Moderna Therapeutics.
Publisher’s note
All claims expressed in this article are solely those of the authors and do not necessarily represent those of their affiliated organizations, or those of the publisher, the editors and the reviewers. Any product that may be evaluated in this article, or claim that may be made by its manufacturer, is not guaranteed or endorsed by the publisher.
Supplementary material
The Supplementary Material for this article can be found online at: https://www.frontiersin.org/articles/10.3389/fnano.2024.1330406/full#supplementary-material
References
Abdelhady, A. M., Phillips, J. A., Xu, Y., and Stroh, M. (2023). Clinical pharmacology and translational considerations in the development of CRISPR-based therapies. Clin. Pharmacol. Ther. 114, 591–603. doi:10.1002/cpt.3000
Aborig, M., Malik, P. R. V., Nambiar, S., Chelle, P., Darko, J., Mutsaers, A., et al. (2019). Biodistribution and physiologically-based pharmacokinetic modeling of gold nanoparticles in mice with interspecies extrapolation. Pharmaceutics 11 (4), 179. doi:10.3390/pharmaceutics11040179
An, D., Frassetto, A., Jacquinet, E., Eybye, M., Milano, J., DeAntonis, C., et al. (2019). Long-term efficacy and safety of mRNA therapy in two murine models of methylmalonic acidemia. EBioMedicine 45, 519–528. doi:10.1016/j.ebiom.2019.07.003
An, D., Schneller, J. L., Frassetto, A., Liang, S., Zhu, X., Park, J. S., et al. (2017). Systemic messenger RNA therapy as a treatment for methylmalonic acidemia. Cell Rep. 21 (12), 3548–3558. doi:10.1016/j.celrep.2017.11.081
Apgar, J. F., Tang, J. P., Singh, P., Balasubramanian, N., Burke, J., Hodges, M. R., et al. (2018). Quantitative systems pharmacology model of hUGT1A1-modRNA encoding for the UGT1A1 enzyme to treat crigler-najjar syndrome type 1. CPT Pharmacometrics Syst. Pharmacol. 7 (6), 404–412. doi:10.1002/psp4.12301
Arteta, M. Y., Kjellman, T., Bartesaghi, S., Wallin, S., Wu, X., Kvist, A. J., et al. (2018). Successful reprogramming of cellular protein production through mRNA delivered by functionalized lipid nanoparticles. Proc. Natl. Acad. Sci. U. S. A. 115 (15), E3351–E3360. doi:10.1073/pnas.1720542115
Attarwala, H., Lumley, M., Liang, M., Ivaturi, V., and Senn, J. (2023). Translational pharmacokinetic/pharmacodynamic model for mRNA-3927, an investigational therapeutic for the treatment of propionic acidemia. Nucleic Acid. Ther. 33 (2), 141–147. doi:10.1089/nat.2022.0036
Baden, L. R., El Sahly, H. M., Essink, B., Kotloff, K., Frey, S., Novak, R., et al. (2021). Efficacy and safety of the mRNA-1273 SARS-CoV-2 vaccine. N. Engl. J. Med. 384 (5), 403–416. doi:10.1056/nejmoa2035389
Berraondo, P., Martini, P. G. V., Avila, M. A., and Fontanellas, A. (2019). Messenger RNA therapy for rare genetic metabolic diseases. Gut 68 (7), 1323–1330. doi:10.1136/gutjnl-2019-318269
Bosmas, P. J., Seppen, J., Goldhoorn, B., Bakker, C., Elferink, RPJO, Chowdhury, J. R., et al. (1994). Bilirubin UDP-glucuronosyltransferase 1 is the only relevant bilirubin glucuronidating isoform in man. J. Biol. Chem. 269, 17960–17964. doi:10.1016/s0021-9258(17)32403-1
Chen, S., Tam, Y. Y. C., Lin, P. J. C., Sung, M. M. H., Tam, Y. K., and Cullis, P. R. (2016). Influence of particle size on the in vivo potency of lipid nanoparticle formulations of siRNA. J. Control. Release 235, 236–244. doi:10.1016/j.jconrel.2016.05.059
Cheng, Y., Straube, R., Alnaif, A. E., Huang, L., Leil, T. A., and Schmidt, B. J. (2022). Virtual populations for quantitative systems pharmacology models. Methods Mol. Biol. 2486, 129–179. doi:10.1007/978-1-0716-2265-0_8
Di, J., Du, Z., Wu, K., Jin, S., Wang, X., Li, T., et al. (2022). Biodistribution and non-linear gene expression of mRNA LNPs affected by delivery route and particle size. Pharm. Res. 39 (1), 105–114. doi:10.1007/s11095-022-03166-5
Gadkar, K., Kirouac, D., Parrott, N., and Ramanujan, S. (2016). Quantitative systems pharmacology: a promising approach for translational pharmacology. Drug Discov. Today Technol. 21–22, 57–65. doi:10.1016/j.ddtec.2016.11.001
Gao, H., Shi, W., and Freund, L. B. (2005). Mechanics of receptor-mediated endocytosis. Available from https://www.pnas.org.
Garg, A., and Balthasar, J. P. (2007). Physiologically-based pharmacokinetic (PBPK) model to predict IgG tissue kinetics in wild-type and FcRn-knockout mice. J. Pharmacokinet. Pharmacodyn. 34 (5), 687–709. doi:10.1007/s10928-007-9065-1
Goel, V., Zhang, X., Robbie, G. J., Gosselin, N. H., Jomphe, C., and Marier, J. F. (2020). Population pharmacokinetic-pharmacodynamic model of serum transthyretin following patisiran administration. Nucleic Acid. Ther. 30 (3), 143–152. doi:10.1089/nat.2019.0841
Hald Albertsen, C., Kulkarni, J. A., Witzigmann, D., Lind, M., Petersson, K., and Simonsen, J. B. (2022). The role of lipid components in lipid nanoparticles for vaccines and gene therapy. Adv. Drug Deliv. Rev. 188, 114416. doi:10.1016/j.addr.2022.114416
Hou, X., Zaks, T., Langer, R., and Dong, Y. (2021). Lipid nanoparticles for mRNA delivery. Nat. Rev. Mater. 6 (12), 1078–1094. doi:10.1038/s41578-021-00358-0
Jansen, P. L. M. (1999). Diagnosis and management of Crigler-Najjar syndrome. Eur. J. Pediatr. 158 (2), S089–S094. doi:10.1007/pl00014330
Khetan, J., Shahinuzzaman, M., Barua, S., and Barua, D. (2019). Quantitative analysis of the correlation between cell size and cellular uptake of particles. Biophys. J. 116 (2), 347–359. doi:10.1016/j.bpj.2018.11.3134
Kilford, P. J., Chen, K. F., Crewe, K., Gardner, I., Hatley, O., Ke, A. B., et al. (2022). Prediction of CYP-mediated DDIs involving inhibition: approaches to address the requirements for system qualification of the Simcyp Simulator. CPT Pharmacometrics Syst. Pharmacol. 11 (7), 822–832. doi:10.1002/psp4.12794
Knight-Schrijver, V. R., Chelliah, V., Cucurull-Sanchez, L., and Le Novère, N. (2016). The promises of quantitative systems pharmacology modelling for drug development. Comput. Struct. Biotechnol. J. 14, 363–370. doi:10.1016/j.csbj.2016.09.002
Krienke, C., Kolb, L., Diken, E., Streuber, M., Kirchhoff, S., Bukur, T., et al. (2021). A noninflammatory mRNA vaccine for treatment of experimental autoimmune encephalomyelitis. Science 371 (6525), 145–153. doi:10.1126/science.aay3638
Kumar, M., Kulkarni, P., Liu, S., Chemuturi, N., and Shah, D. K. (2023). Nanoparticle biodistribution coefficients: a quantitative approach for understanding the tissue distribution of nanoparticles. Adv. Drug Deliv. Rev. 194, 114708. doi:10.1016/j.addr.2023.114708
Kutumova, E. O., Akberdin, I. R., Kiselev, I. N., Sharipov, R. N., Egorova, V. S., Syrocheva, A. O., et al. (2022). Physiologically based pharmacokinetic modeling of nanoparticle biodistribution: a review of existing models, simulation software, and data analysis tools. Int. J. Mol. Sci. 23, 12560. doi:10.3390/ijms232012560
Marino, S., Hogue, I. B., Ray, C. J., and Kirschner, D. E. (2008). A methodology for performing global uncertainty and sensitivity analysis in systems biology. J. Theor. Biol. 254, 178–196. doi:10.1016/j.jtbi.2008.04.011
Maugeri, M., Nawaz, M., Papadimitriou, A., Angerfors, A., Camponeschi, A., Na, M., et al. (2019). Linkage between endosomal escape of LNP-mRNA and loading into EVs for transport to other cells. Nat. Commun. 10 (1), 4333. doi:10.1038/s41467-019-12275-6
Miao, L., Zhang, Y., and Huang, L. (2021). mRNA vaccine for cancer immunotherapy. Mol. Cancer 20, 41. doi:10.1186/s12943-021-01335-5
Mu, Z., Wiehe, K., Saunders, K. O., Henderson, R., Cain, D. W., Parks, R., et al. (2022). mRNA-encoded HIV-1 Env trimer ferritin nanoparticles induce monoclonal antibodies that neutralize heterologous HIV-1 isolates in mice. Cell Rep. 38 (11), 110514. doi:10.1016/j.celrep.2022.110514
Musante, C. J., Ramanujan, S., Schmidt, B. J., Ghobrial, O. G., Lu, J., and Heatherington, A. C. (2017). Quantitative systems pharmacology: a case for disease models. Clin. Pharmacol. Ther. 101 (1), 24–27. doi:10.1002/cpt.528
Muslimov, A., Tereshchenko, V., Shevyrev, D., Rogova, A., Lepik, K., Reshetnikov, V., et al. (2023). The dual role of the innate immune system in the effectiveness of mRNA therapeutics. Int. J. Mol. Sci. 24, 14820. doi:10.3390/ijms241914820
Patel, P., Ibrahim, N. M., and Cheng, K. (2021). The importance of apparent pKa in the development of nanoparticles encapsulating siRNA and mRNA. Trends Pharmacol. Sci. 42 (6), 448–460. doi:10.1016/j.tips.2021.03.002
Polack, F. P., Thomas, S. J., Kitchin, N., Absalon, J., Gurtman, A., Lockhart, S., et al. (2020). Safety and efficacy of the BNT162b2 mRNA covid-19 vaccine. N. Engl. J. Med. 383 (27), 2603–2615. doi:10.1056/nejmoa2034577
Roger, C., Koziel, V., Vert, P., and Nehlig, A. (1995). Mapping of the consequences of bilirubin exposure in the immature rat: local cerebral metabolic rates for glucose during moderate and severe hyperbilirubinemia. Early Hum. Dev. 43, 133–144. doi:10.1016/0378-3782(95)01668-6
Rohner, E., Yang, R., Foo, K. S., Goedel, A., and Chien, K. R. (2022). Unlocking the promise of mRNA therapeutics. Nat. Biotechnol. 40 (11), 1586–1600. doi:10.1038/s41587-022-01491-z
Sahay, G., Querbes, W., Alabi, C., Eltoukhy, A., Sarkar, S., Zurenko, C., et al. (2013). Efficiency of siRNA delivery by lipid nanoparticles is limited by endocytic recycling. Nat. Biotechnol. 31 (7), 653–658. doi:10.1038/nbt.2614
Selvaggio, G., Leonardelli, L., Lofano, G., Fresnay, S., Parolo, S., Medini, D., et al. (2021). A quantitative systems pharmacology approach to support mRNA vaccine development and optimization. CPT Pharmacometrics Syst. Pharmacol. 10 (12), 1448–1451. doi:10.1002/psp4.12721
Shah, D. K., and Betts, A. M. (2012). Towards a platform PBPK model to characterize the plasma and tissue disposition of monoclonal antibodies in preclinical species and human. J. Pharmacokinet. Pharmacodyn. 39 (1), 67–86. doi:10.1007/s10928-011-9232-2
Stadler, C. R., Bähr-Mahmud, H., Celik, L., Hebich, B., Roth, A. S., Roth, R. P., et al. (2017). Elimination of large tumors in mice by mRNA-encoded bispecific antibodies. Nat. Med. 23 (7), 815–817. doi:10.1038/nm.4356
Van Der Graaf, P. H., and Benson, N. (2011). Systems pharmacology: bridging systems biology and Pharmacokinetics- Pharmacodynamics (PKPD) in drug discovery and development. Pharm. Res. 28, 1460–1464. doi:10.1007/s11095-011-0467-9
Vavilis, T., Stamoula, E., Ainatzoglou, A., Sachinidis, A., Lamprinou, M., Dardalas, I., et al. (2023). mRNA in the context of protein replacement therapy. Pharmaceutics 5, 166. doi:10.3390/pharmaceutics15010166
Wang, X., Chowdhury, J. R., and Chowdhury, N. R. (2006). Bilirubin metabolism: applied physiology. Curr. Paediatr. 16 (1), 70–74. doi:10.1016/j.cupe.2005.10.002
Watson, O. J., Barnsley, G., Toor, J., Hogan, A. B., Winskill, P., and Ghani, A. C. (2022). Global impact of the first year of COVID-19 vaccination: a mathematical modelling study. Lancet Infect. Dis. 22 (9), 1293–1302. doi:10.1016/s1473-3099(22)00320-6
Wennberg, R. P. (2000). The blood-brain barrier and bilirubin encephalopathy. Cell. Mol. Neurobiol. 20, 97–109. doi:10.1023/a:1006900111744
Witzigmann, D., Kulkarni, J. A., Leung, J., Chen, S., Cullis, P. R., and van der Meel, R. (2020). Lipid nanoparticle technology for therapeutic gene regulation in the liver. Adv. Drug Deliv. Rev. 159, 344–363. doi:10.1016/j.addr.2020.06.026
Keywords: QSP, minimal PBPK, Crigler-Najjar, mRNA, LNP
Citation: Miyazawa K, Liu Y and Bazzazi H (2024) Development of a minimal PBPK-QSP modeling platform for LNP-mRNA based therapeutics to study tissue disposition and protein expression dynamics. Front. Nanotechnol. 6:1330406. doi: 10.3389/fnano.2024.1330406
Received: 30 October 2023; Accepted: 03 January 2024;
Published: 31 January 2024.
Edited by:
Fengqian Chen, Cellphire Therapeutics Inc., United StatesReviewed by:
Ning Duan, The University of Tennessee, United StatesQisheng Xin, CRISPR Therapeutics, Inc., United States
Copyright © 2024 Miyazawa, Liu and Bazzazi. This is an open-access article distributed under the terms of the Creative Commons Attribution License (CC BY). The use, distribution or reproduction in other forums is permitted, provided the original author(s) and the copyright owner(s) are credited and that the original publication in this journal is cited, in accordance with accepted academic practice. No use, distribution or reproduction is permitted which does not comply with these terms.
*Correspondence: Hojjat Bazzazi, aGJhenphemlAZ21haWwuY29t