 Jihua Chen1*
 Jong Keum1
 Yangyang Wang1
 Hanyu Wang1Bradley Lokitz1
 Guang Yang2Yue Yuan1
 Rajeev Kumar1Rigoberto Advincula1,3
- 1Center for Nanophase Materials Science, Oak Ridge National Laboratory, Oak Ridge, TN, United States
- 2Chemical Sciences Division, Oak Ridge National Laboratory, Oak Ridge, TN, United States
- 3Department of Chemical and Biomolecular Engineering, University of Tennessee, Knoxville, United States
Renewable energy is increasingly relying on optimized electrolytes and interfaces. In this work, Tween 20 and sodium chloride are selected as a model system to reveal the effects of surfactants on salt crystallization in the context of ionic conductivity and interface optimization. At a varied crystallization speed and mix ratio, it is demonstrated that the resultant solution-grown ionic crystalline complexes can achieve a highly tunable ion transport with a controllable crystalline interface. X-ray diffraction results rule out the possibility of polymorphism in the NaCl/Tween 20 systems, which further supports the importance of an optimized crystalline network for optimizing permittivity or ionic conductivity. Raman mapping and machine learning techniques are used to perform semantic segmentation on highly heterogeneous NaCl/Tween 20 complexes. Furthermore, FTIR measurements demonstrate that inter- and intra-molecular interactions play critical roles in the formation of these crystals. This work lays a foundation toward future optimization of such complex ion systems for a specific salt or crystallization modifier in energy storage or ion transport applications.
1 Introduction
Polymer-, protein-, and surfactant-mediated crystallizations are kinetic processes driving the formation of natural wonder materials such as pearls, bones, teeth, and shells (Bar-Cohen, 2012). Polymer-, protein-, and surfactant-mediated crystallizations lead to wonder materials provides precious and rare ways of accessing high-performance materials that are otherwise unable to obtain. In the past, polymer- and additive-assisted crystallization of molecular crystals was reported for enhanced charge transport in organic electronic and ionic devices, such as organic thin-film transistors, organic solar cells, and solid polymer electrolytes. (He et al., 2011; Chen et al., 2013; He et al., 2013; Gu et al., 2014; Bi et al., 2015; Sun et al., 2015; He et al., 2020; Chen et al., 2021). Systematic studies were performed to further reveal the crystallization-mediated effect of the polymer template, including their molecular weight, chain architecture, hydrophobicity, the effect of intermolecular interactions, and the impact of nanoparticle additives (He et al., 2011; Chen et al., 2013; He et al., 2013; He et al., 2020; Chen et al., 2021).
Salt and ionic crystals have an intimate relationship with life on our planet and far-reaching impacts on modern science and industries, not to mention their critical role in life-supporting organs and neural systems. The effects of additives and surfactants on salt crystallization have been studied previously (Qazi et al., 2017), but their relevance to interfacial ion transport is still largely unexplored. Renewable energy is more and more relying on optimized electrolytes and interfaces, while promising applications of water-in-salt and polymer-in-salt electrolytes are playing increasingly important roles (Suo et al., 2015; Gao et al., 2021).
A non-ionic surfactant was chosen in this work to simplify the involved ion species in our study, although we did not find any previous work in the literature on controlling conductivities of solid salt complexes or solid electrolytes via surfactant templating. In the past, main strategies for salt complex formation (Bi et al., 2015; Sun et al., 2015) involve melt processing, hot press, and slurry deposition, with little control on the solution crystallization process. Previous reports on guided crystallization of organic crystals indicate that nucleation agents or additive types (polymer, small molecules, nanoparticle, or surfactant), additive structure, and the processing factors, such as nucleation and crystallization speeds (slow and fast) and mix ratios, have their profound influences on the formation of resultant crystal complexes, and to the best of our knowledge, this is the first to apply these principles to ionic crystals and complexes (He et al., 2011; Chen et al., 2013; He et al., 2013; He et al., 2020; Chen et al., 2021).
To demonstrate the systematic impact of surfactants on salt crystallization in the context of interfacial optimization and conductivity, sodium chloride and Tween 20 are used herein as a model system for ionic conductivity and microstructural study. We show that the resultant solution-grown ionic crystalline complexes can attain a highly tunable electrical performance with a programmable crystalline interface at a variety of crystallization speeds and mixing ratios of the salt to the surfactant (4:1 to 20:1). X-ray diffraction, Raman mapping, and FTIR spectra show that intra- and intermolecular interactions play important roles in the formation of heterogeneous crystalline and amorphous regions. With this approach, the low-frequency, room-temperature permittivity can be increased up to 1,480, while conductivity can be varied by at least three orders of magnitude.
2 Results and discussion
Tween 20, or polysorbate 20, is a common non-ionic surfactant used in industries, which is less lipophilic than Tween 80 because of a difference in the fatty acid side group (Figure 1) (Qazi et al., 2017). Sodium chloride is the most abundant salt and has attracted wide interest of the scientific communities in recent years (Qazi et al., 2017). A list of ionic crystalline complexes studied in this work is provided in Table 1. Sample short names marked their compositions and crystallization modes. For example, Sample 7f corresponds to a NaCl/Tween 20 ratio of 7:1 by weight in the original mixture before crystallization, while the symbol “f” stands for “fast” crystallization at 50°C without a beaker cover. For Sample 7s, the symbol “s” refers to “slow” crystallization process at 25°C without a beaker cover. For Sample 7us, the short name “us” refers to “ultraslow” crystallization at 25°C with a beaker cover to control the evaporation rate. “Fast” crystallization at 50°C takes a few hours. “Slow” crystallization at 25°C takes overnight, while “ultraslow” crystallization takes 2 weeks. The resultant films were baked at the same temperature with the cover removed for 6 h to remove the residual water.
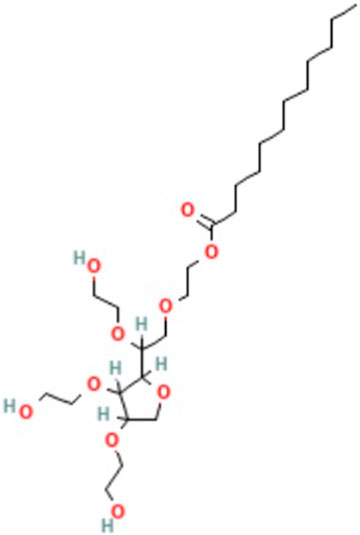
FIGURE 1. Molecular structure of Tween 20 or polysorbate 20 that is used herein as a non-ionic surfactant (National Center for Biotechnology Information, 2023).

TABLE 1. List of ionic crystalline complexes studied in this work.
2.1 Permittivity and conductivity
The complex permittivity
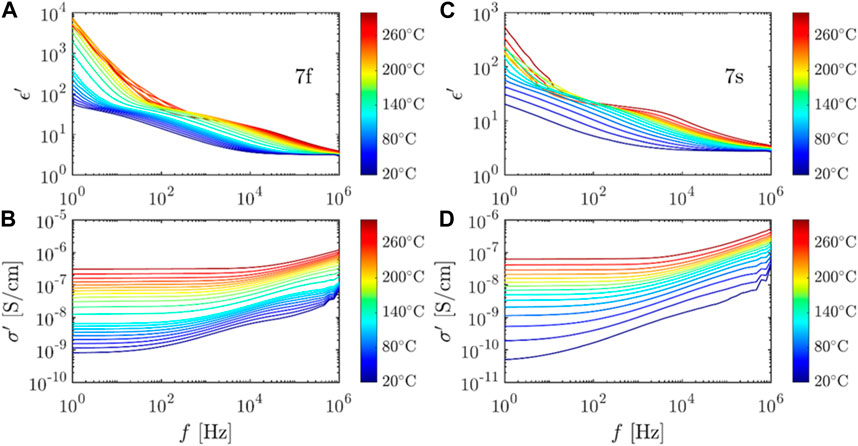
FIGURE 2. Representative dielectric and conductivity spectra of the NaCl/Tween 20 samples. (A,B) Sample 7f. (C,D) Sample 7s.
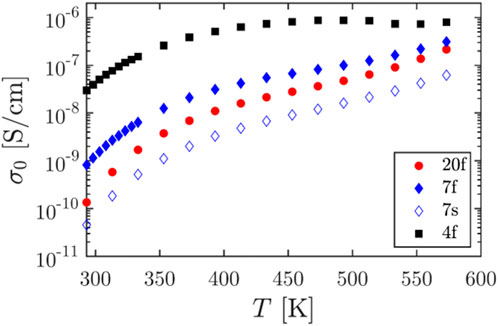
FIGURE 3. Effect of composition on the NaCl/Tween 20 systems. From Samples 20f and 7f to 4f, the content of Tween 20 increases.
2.2 Optical images
Figure 4 shows the optical images of Tween 20/NaCl Samples 4f, 7f, and 7s. Samples 7f and 4f seem to have a much finer grain structure compared to the slowly crystallized Sample 7f. The higher surfactant content in 4f does appear to facilitate larger grains in general compared to 7f. In addition, slowly crystallized samples have a gel appearance compared to the solid appearance of their fast crystallized counterpart. Additional optical micrographs are available in Supplementary Figure S4. Although these were performed on thin-film samples adapted for a comparison under an optical microscope, a trend of larger salt crystal grains with less surfactant concentration was observed as the NaCl/Tween 20 samples transitioning from 4s and 7s to 20s.
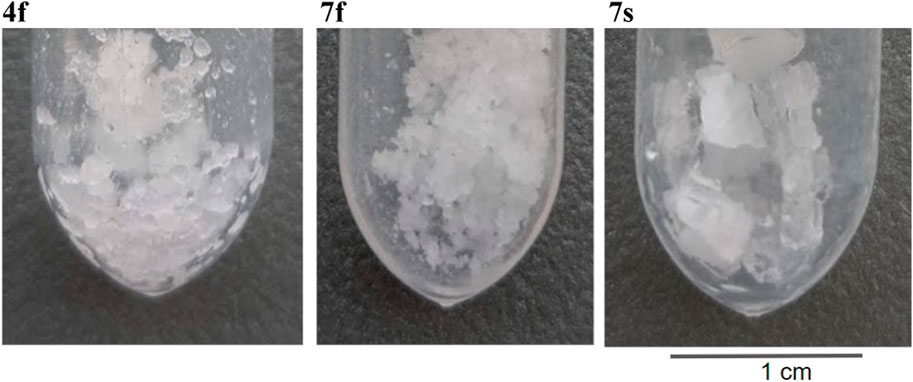
FIGURE 4. Optical images of Tween/NaCl Samples 4f, 7f, and 7s.
2.3 Raman mapping
Raman mapping was used to obtain the chemical and structural distribution of NaCl, Tween, and water. Figure 5 (top) shows an optical micrograph of the crystalline part of the 20:1 sample (Sample 20f). The Raman spectra of three randomly selected spots exhibit three featured bands—NaCl transverse optical (TO) and longitudinal optical (LO) mode centered at 339 cm−1, the Tween C-H stretching mode centered at 2878 cm−1, and the residual water OH stretching at 3417 cm−1. Typical Raman mapping based on single-peak intensity is shown in Figure 6. It provides the initial information that NaCl, Tween, and H2O have heterogeneous distributions across the scanned area. While Raman mapping based on the single-peak intensity can exhibit the chemical distribution of a given species, it fails to reflect the relative distribution of multiple components and may result in capturing important spectra features of the object (Yang et al., 2021a).
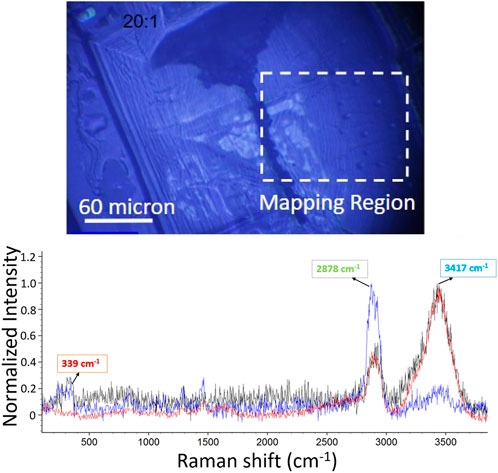
FIGURE 5. Raman spectra of normalized Sample 20f on randomly selected spots. White dash frame marks indicate that Raman mapping was implemented.
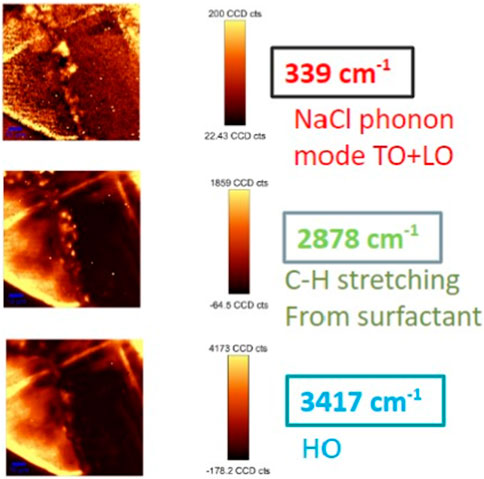
FIGURE 6. Single Raman peak intensity distribution for Sample 20f, using the three characteristic regions in Figure 5. (Top: 339 cm−1 for NaCl phonon mode TO + LO; middle: 2878 cm−1 for C-H stretching from the surfactant; bottom: 3417 cm−1 for HO).
We further resort to K-means clustering analysis to distill the information out of the 14,400 spectra in each mapping frame (100 × 100 μm2). Our team has demonstrated in several previous studies that structural heterogeneity can be unveiled by the K-means clustering analysis on the Raman mapping of the object (Burdette-Trofimov et al., 2020; Yang et al., 2021b; Yang et al., 2021c).
In brief, this method is used to group the total number (denoted as n) of Raman spectra (x1,x2,x3 … xn) within the Raman mapping into K sets (K ≤ n) to minimize the sum of squares within-cluster, defined by the objective function, J, as follows:
where ci is the mean of points (or centroid). It serves as the cluster spectrum in the K set, Si. The value of the centroid is updated iteratively, and
Consequently, the total number of n spectra can be categorized into several clusters with similarities. The centroid spectrum of each cluster can then represent the characteristic features of all spectra in that category with different color codes (see Figure 7). Figure 7 shows the clustered Raman mapping with the corresponding centroid spectra shown in Figure 7 (right). The K-clustering map provides direct proof of the heterogeneous distribution of the NaCl, Tween, and H2O. For example, Cluster cyan has the most intensive peak at 3,417 cm−1 among all other clusters, indicating that H2O preferably distributes in the cyan color-coded region, whereas in the red region, NaCl outweighs other components as the 339 cm−1 peak dominates.
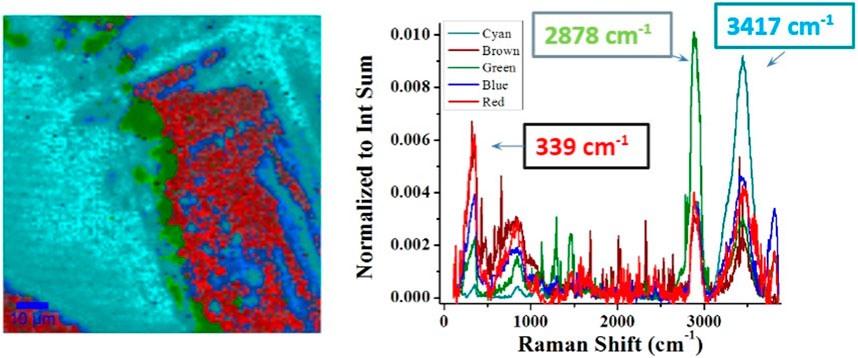
FIGURE 7. Raman mapping with semantic segmentation for Sample 20f. Each color stands for a group of spectra with the same similarity. The Tween/NaCl crystal is highly heterogeneous. Outer HO is shown in cyan, interlayer surfactant is shown in green, and middle NaCl is shown in red.
Very interestingly, the Tween surfactant distributes preferably in the cyan region (H2O-rich) and the red region (NaCl-rich). It may indicate that when NaCl crystallization initializes, part of the surfactant is repelled from the center of the crystalline phase and deposited on the outer layer of that crystal center. The fact that the Tween surfactant layer distributes preferably on one side of the crystalline center indicates that the diffusion of the surfactant during NaCl crystallization is non-isotropic. Note that the outermost layer is water-rich but NaCl has poor water content, which may indicate that the NaCl–H2O forms a new structure on that outer layer that is different from the NaCl crystalline phase formed in the middle. As such, Raman mapping distilled by the unsupervised learning algorithms reveals the heterogeneous distribution of the NaCl–H2O surfactant components.
2.4 X-ray diffraction
The X-ray diffraction results of Tween 20/NaCl (Samples 4f, 7f, 7s, and 20f) and pure NaCl (red) show no evidence for polymorphism of salts or significant changes in the NaCl crystal structures (Figure 8). The indexing of reflections is based on a previous report (Crystallography Open Database, 2023). The corresponding lattice parameters are a = b = c = 5.62 Å, α = β = γ = 90°, and cell volume V = 177.5 Å3, with a space group assignment of Fm-3m (Crystallography Open Database, 2023). It is noted that Raman studies provide insights on both crystalline and amorphous phases, while X-ray diffractions mainly reveal the crystalline regions of the salt crystals due to the dominance of NaCl reflections.
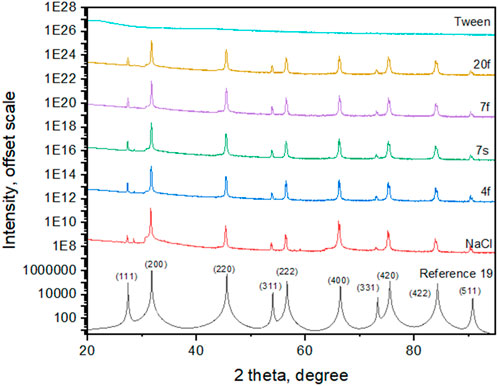
FIGURE 8. X-ray diffraction results of NaCl/Tween 20 (Samples 4f, 7f, 7s, and 20f) and pure NaCl (red, top line). There is essentially little evidence for polymorphism of salts. The indexing is based on Reference 19.
2.5 FTIR spectra
For Tween 20, there are a number of reported FTIR peaks, and we divide them into three regions (Ortiz-Tafoya and Tecante, 2018). FTIR spectra of NaCl/Tween 20 are shown in Figure 9 as a function of Tween content (12.5%wt for Sample 7f, 20%wt for Sample 4f, and 100% for pure Tween). In general, a higher Tween 20 composition corresponds to a higher FTIR signal in the three identified regions, although the peak intensity ratios are different.
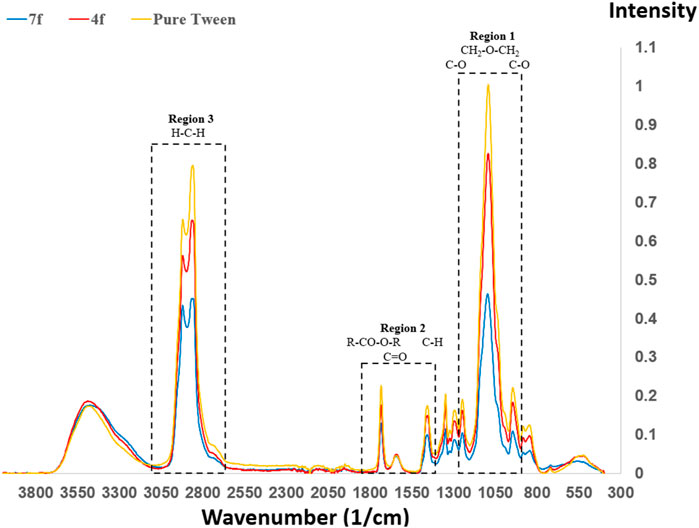
FIGURE 9. FTIR of NaCl/Tween 20 as a function of Tween 20 content (12.5%wt for Sample 7f, 20%wt for Sample 4f, and 100% for pure Tween). The largest peak for Tween 20 is observed at 1095 cm−1, which corresponds to CH2-O-CH2 stretch vibrations.
Region 1 is at approximately 1,100 cm−1, which corresponds to the stretch vibration of -CH2-O-CH2- at 1,095 cm−1, as well as C-O stretching vibrations at 1,100 and 1,038 cm−1. The peaks at 1,095 cm−1 represent the strongest in Figure 9. Region 2 is close to 1,500 cm−1, which corresponds to 1,412 cm−1 (methyl symmetric bend vibration), 1,640 cm−1 (carbonyl stretching), and 1,734 cm−1 (carbonyl from R-CO-O-R). Region 3 is in the proximity of 3,000 cm−1, and this consists of 2,920 and 2,860 cm−1 for asymmetric/symmetric methylene stretching, respectively, as well as 3,476 cm−1 for hydrogen-bonded O-H stretching.
In Figure 10, the FTIR spectra of NaCl/Tween 20 (7:1) are shown as a function of the crystallization mode, with the crystallization duration in the following sequence: Sample 7f < 7s < 7us. In Region 3, as the crystallization slows down, the hydrogen-bonding peaks increase dramatically, while the methylene peaks decrease. In Regions 1 and 2, the C-O-C/C-O and carbonyl peaks in general show decreasing Tween 20 methylene stretching.
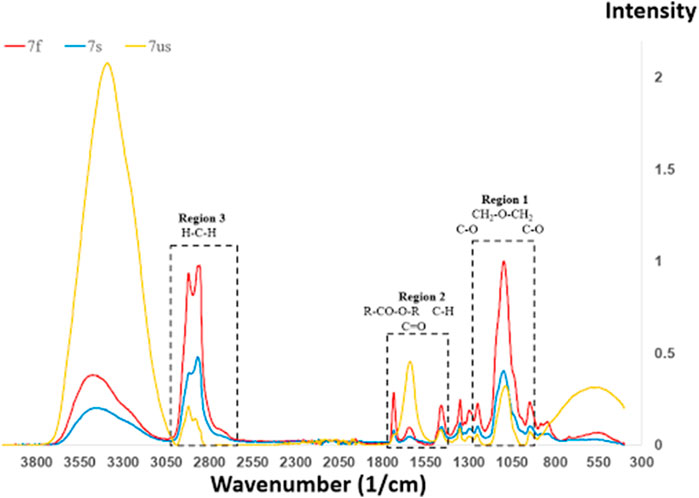
FIGURE 10. FTIR spectra of NaCl/Tween 20 (7:1) as a function of crystallization mode. Crystallization duration: Sample 7f < 7s < 7us. Hydrogen-bonded OH stretching is observed the leftmost peak. Methylene stretching is observed between 2,600 and 3,000 cm−1. Carbonyl groups from R-COO-R and carbonyl stretching are observed at 1,734 and 1,640 cm−1, respectively.
2.6 Proposed mechanism
Combining the results of different characterization methods, a possible crystal network resulting from controlled crystallization is shown in Figure 11. Raman mapping suggested that the surfactant-rich region is in between the hydrate shell and salt core. X-ray diffraction did not suggest a significant NaCl crystal structure change. The crystal network complexes resulting from the slow crystallization are expected to have stronger hydrogen bonding, which can decrease permittivity and conductivity of the system (Figures 2; 3). Upon mix ratio change, the low-frequency, room-temperature permittivity can be increased up to 1,480 at room temperature, while the corresponding conductivity can be varied by at least three orders of magnitude. This showcases the unique structures and properties of the NaCl/Tween 20, solution-grown structures achieved by the controlled crystallization methods. Salt-surfactant complexes were most studied for morphological manipulation previously (Qazi et al., 2017), except a work on conductivity of surfactant-based ion systems in solution (Ololo and Chon, 2018). We did not find any previous studies on examining the electrical properties of surfactant-based ion complexes in the solid state. Typical solid-state electrolytes struggle to reach a required room-temperature conductivities of 10−3 S/Cm, and with solid polymer-based electrolytes, some 3–5 orders of magnitude gap still need to be filled in for a feasible operation in practical applications (Bi et al., 2015; Sun et al., 2015).
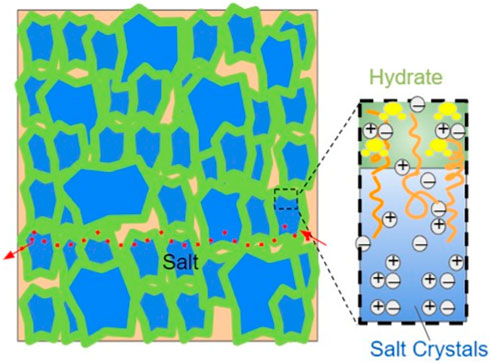
FIGURE 11. A tunable crystal complex of Tween 20/NaCl is attributed to the observed conductivity and dielectric improvements shown in this work. From the outer to inner crystal seed center, there are H2O-rich, surfactant-rich, and NaCl-rich regions, respectively. The surfactant-rich domain is in between the H2O-rich domain and the pure crystal of NaCl. The scheme is not drawn to scale for the illustration purpose. The orange curves depict the surfactants. The water molecules in hydrate are shown in yellow. The red arrows and dots show a possible path for ion transport.
The surfactant-mediated crystallization leads to domains that have salt crystals (Domain I) and salt hydrate regions (Domain II), with surfactant molecules energetically favored to stay as a bridging component in between (Domain III). These three domains are highly tunable, depending on starting composition and crystallization speed, as demonstrated with FTIR and dielectric spectroscopy results. The proportion of Domain III is directly impacted by the change in the mixing ratio, providing channels for the ion transport path. The distribution of Domain I is affected by both the mixing ratio and crystallization mode, offering stability for the system but being less useful for tuning electrical performance. Sizes of Domain II can be largely tuned by crystallization speed and evaporation rate, contributing to permittivity and conductivity. Overall, the permittivity and conductivity of the resultant solution-grown structures can be varied by at least 2–4 orders of magnitude at room temperature and low frequency via the changes in crystal dimension and size distribution of the three domains. A balance can be maintained between desirable electrical properties and the stability provided by the crystal network mechanically and electrochemically. We believe that these new insights into the proposed crystallization control open up new opportunities and potentially important venues for interfacial optimization of energy storage systems (such as “water-in-salt,” “polymer-in-salt,” and other relevant approaches) (Suo et al., 2015; Gao et al., 2021). Water in Domain II may be replaced with any other suitable solvent, and table salt used in this work may be substituted with other high-performance salts with polymorphism.
Due to the strength of their intermolecular attractive forces, the melting point of sodium halide compounds decreases in the following order: NaF > NaCl > NaBr > NaI. NaI, NaBr, and NaCl are known to be much more soluble in water than NaF, which is used to treat drinking water. With 100 g of water at 20°C, the solubility of sodium halides are reported to be 177 g for NaI, 91.2 g for NaBr, 35.9 g for NaCl, and only 4.1 g for NaF (Libretexts Chemistry, 2023). When a sodium halide solution is saturated with excess solute, its dissolution rate will be equal to its rate of crystallization. Under this condition, the strong attractive ions in a NaF solution can contribute to a slower crystallization speed. Addition theoretical work confirms that crystal-solution coexistence is extremely sensitive to the short-range interionic potentials (Ursenbach and Patey, 1991).
For salt-based electrolyte systems, if the electrolyte fabrication process follows a solution-, slurry-, or dispersion-type procedure, the method described in this work can be applied directly. Otherwise, the effects discussed here may be also applied in a solvent (or mixed solvents) annealing manner.
3 Summary
In this study, controlled crystallization of Tween 20 and sodium chloride are used to study the effects of surfactant composition and crystallization speed on the conductivity and transport of the resultant solution-grown structures. X-ray diffractions of slowly crystallized salts correspond to the almost identical NaCl crystal structures with and without the non-ionic surfactant Tween 20. Raman mapping reveals different regions of highly heterogeneous NaCl/Tween 20 crystalline and amorphous domains. FTIR spectra demonstrate that hydrogen bonding, methylene stretching, and CH2-O-CH2 stretch vibrations play critical roles in the formation of these crystals, while dielectric spectroscopy suggests a highly tunable electrical performance upon tuning of crystalline networks. This work lays a foundation toward future optimization of such complex systems for a specific salt or crystallization modifier in energy applications.
4 Experimental
4.1 Materials
Calculated amounts of Tween 20 (Florida Laboratories, Inc.) and sodium chloride (reagent-grade, Aldon Corporation, NY) are mixed to give the target composition of 1/20, 1/7, and 1/4 by weight. The blend is then dissolved in the five-stage filtered water to yield a total solid content of 1%wt for controlled solution crystallization.
4.2 Controlled crystallization
A typical crystallization process is performed as follows: 0.5 ml of Tween/NaCl solution was placed in a vial. A preheated hot plate was used to control crystallization temperature. A beaker with or without the cover was used to control the evaporation rate of the water. “Fast” crystallization was performed at 50°C without a beaker cover for a few hours. “Slow” crystallization was performed at 25°C overnight without a beaker cover. “Ultraslow” crystallization was performed at 25°C with a beaker cover for 2 weeks. The resultant film was baked for 6 h at the same temperature without the cover to remove the residual water. A glass Petri dish cover was typically used as a cover to slow down evaporation, yet allowing slow crystallization to proceed with limited evaporation. The repeatability was tested, and the protocol was adopted from a previously published work on controlled crystallization of organic semiconductors (He et al., 2011; Chen et al., 2013; He et al., 2013; He et al., 2020; Chen et al., 2021).
4.3 Raman mapping
All Raman maps were collected on a confocal Raman spectrometer (WITec, GmbH 532 nm, objective = ×20, a grating with 600 grooves/mm, numerical aperture (N.A.) = 0.42, and local power <500 μW). The laser spot diameter was estimated to be 1 μm. The scan region was set at 100 × 100 μm2, with a step size of 1,000 nm/pixel. The integration time was 3 s for each point. All Raman mappings were analyzed using WITec Project Plus software and the K-means clustering algorithm integrated into the scikit-learn platform with a similar method reported previously (Burdette-Trofimov et al., 2020; Yang et al., 2021a; Yang et al., 2021b; Yang et al., 2021c).
4.4 X-ray diffraction
X-ray diffraction studies were performed using a PANalytical X’Pert Pro X-ray powder diffractometer (45 kV and 40 mA), with an X’Celerator solid-state detector. Cu Kα radiation (λ = 1.5406 Å) was used for the measurements.
4.5 FTIR spectroscopy
Fourier-transform infrared (FTIR) spectroscopy experiments were performed on a Bruker VERTEX 70 with a diamond attenuated total reflection (ATR) window in the range of 4000–500 cm−1. The peak resolution was set to 4 cm−1, and each spectrum was scanned 64 times.
4.6 Dielectric spectroscopy
Broadband dielectric spectroscopy measurements of the NaCl/Tween 20 samples were performed in the temperature range of 20°C–300°C on a Novocontrol Concept 40 system with an Alpha analyzer and ZGS interface. Frequency-dependent complex permittivity was determined in the frequency range of 1 Hz–10 MHz. The temperature was controlled using the Quatro Cryosystem. In each experiment, the sample was first heated to the highest temperature, and the frequency-sweep measurements were taken at the target temperatures upon cooling.
4.7 Optical microscopy
To observe the crystal morphology, 5 μL of the sample was dropped on a glass slide, and the solvent was evaporated under room temperature before subjected to an optical microscope (Model BX53, Olympus, Japan) equipped with a digital camera (ORCA-Flash 4.0, Hamamatsu, NJ, United States). Images were taken at ×4, ×10, and ×20 magnifications and analyzed using HCImage software (Hamamatsu, NJ, United States).
Data availability statement
The original contributions presented in the study are included in the article/Supplementary Material; further inquiries can be directed to the corresponding author.
Author contributions
JC: writing–original draft and writing–review and editing. JK: writing–review and editing. YW: writing–original draft and writing–review and editing. HW: writing–review and editing. BL: writing–review and editing. GY: writing–original draft and writing–review and editing. RK: writing–review and editing. RA: writing–review and editing.
Funding
The author(s) declare that financial support was received for the research, authorship, and/or publication of this article. This work was supported by the Center for Nanophase Materials Sciences (CNMS) at Oak Ridge National Laboratory, a US Department of Energy (DOE) Office of Science User Facility.
Acknowledgments
This work was supported by the Center for Nanophase Materials Sciences (CNMS), a US Department of Energy, and Office of Science User Facility at Oak Ridge National Laboratory. GY was supported by Dr. Imre Gyuk, Energy Storage Program, Office of Electricity, Department of Energy. JC appreciated discussions with Jan Michael Y. Carrillo on MD simulations.
Licenses and Permissions
This manuscript has been authored by UT-Battelle, LLC, under Contract No. DEAC05-00OR22725 with the U.S. Department of Energy. The United States Government and the publisher, by accepting the article for publication, acknowledges that the United States Government retains a nonexclusive, paid-up, irrevocable, worldwide license to publish or reproduce the published form of this manuscript, or allow others to do so, for United States Government purposes.
Conflict of interest
All authors are employees of Oak Ridge National Laboratory, managed by UT-Battelle LLC, an M&O contractor for the U.S. Department of Energy.
Publisher’s note
All claims expressed in this article are solely those of the authors and do not necessarily represent those of their affiliated organizations, or those of the publisher, the editors, and the reviewers. Any product that may be evaluated in this article, or claim that may be made by its manufacturer, is not guaranteed or endorsed by the publisher.
Supplementary material
The Supplementary Material for this article can be found online at: https://www.frontiersin.org/articles/10.3389/fnano.2023.1293801/full#supplementary-material
References
Bar-Cohen, Y. (2012). Biomimetics: nature-based innovation. Florida, United States: CRC Press, 512–788. B/W Illustrations ISBN 9781439834763 Published September 21, 2011 by.
Bi, S., Sun, C. N., Zawodzinski, T. A., Ren, F., Keum, J. K., Ahn, S. K., et al. (2015). Reciprocated suppression of polymer crystallization toward improved solid polymer electrolytes: higher ion conductivity and tunable mechanical properties. J. Polym. Sci. Part B Polym. Phys. 53 (20), 1450–1457. doi:10.1002/polb.23793
Bordi, F., Cametti, C., and Colby, R. H. (2004). Dielectric spectroscopy and conductivity of polyelectrolyte solutions. J. Phys. Condens. Matter 16, R1423–R1463. doi:10.1088/0953-8984/16/49/r01
Burdette-Trofimov, M. K., Armstrong, B. L., Nelson Weker, J., Rogers, A. M., Yang, G., Self, E. C., et al. (2020). Direct measure of electrode spatial heterogeneity: influence of processing conditions on anode architecture and performance. ACS Appl. Mater. Interfaces 12 (50), 55954–55970. doi:10.1021/acsami.0c17019
Chen, J., Das, S., Shao, M., Li, G., Lian, H., Qin, J., et al. (2021). Phase segregation mechanisms of small molecule-polymer blends unraveled by varying polymer chain architecture. SmartMat 2 (3), 367–377. doi:10.1002/smm2.1036
Chen, J., Shao, M., Xiao, K., He, Z., Li, D., Lokitz, B. S., et al. (2013). Conjugated polymer-mediated polymorphism of a high performance, small-molecule organic semiconductor with tuned intermolecular interactions, enhanced long-range order, and charge transport. Chem. Mater. 25 (21), 4378–4386. doi:10.1021/cm403039y
Crystallography Open Database (2023). Information card for entry 1000041. Available at: http://www.crystallography.net/cod/1000041.html (accessed on October 25, 2023).
Gao, H., Grundish, N. S., Zhao, Y., Zhou, A., and JohnGoodenough, B. (2021). Formation of stable interphase of polymer-in-salt electrolyte in all-solid-state lithium batteries. Energy Mater. Adv. 2021, 1–10. doi:10.34133/2020/1932952
Gu, Y., Wang, C., Liu, F., Chen, J., Oe Dyck, , Duscher, G., et al. (2014). Guided crystallization of P3HT in ternary blend solar cell based on P3HT: PCPDTBT: PCBM. Energy & Environ. Sci. 7 (11), 3782–3790. doi:10.1039/c4ee02004a
He, Z., Li, D., Hensley, D. K., Rondinone, A. J., and Chen, J. (2013). Switching phase separation mode by varying the hydrophobicity of polymer additives in solution-processed semiconducting small-molecule/polymer blends. Appl. Phys. Lett. 103 (11), 167_1. doi:10.1063/1.4820588
He, Z., Xiao, K., Durant, W., Hensley, D. K., Anthony, J. E., Hong, K., et al. (2011). Enhanced performance consistency in nanoparticle/TIPS pentacene-based organic thin film transistors. Adv. Funct. Mater. 21 (19), 3617–3623. doi:10.1002/adfm.201002656
He, Z., Zhang, Z., Bi, S., and Chen, J. (2020). Effect of polymer molecular weight on morphology and charge transport of small-molecularorganic semiconductors. Electron. Mater. Lett. 16 (5), 441–450. doi:10.1007/s13391-020-00227-y
Libretexts Chemistry (2023). Chem libretexts. Available at: https://chem.libretexts.org/ (accessed on October 25, 2023).
National Center for Biotechnology Information (2023). PubChem compound summary for, polysorbate 20. PubChem. Available at: https://pubchem.ncbi.nlm.nih.gov/compound/Polysorbate-20 (Accessed September 5, 2023). Bethesda, MD, USA.
Ololo, J. E., and Chon, Bo H. (2018). Static adsorption of dodecyl alkyl sulfate onto kaolinite: an experimental investigation for enhanced oil recovery purposes. Int. J. Appl. Eng. Res. 13 (19), 14438–14446.
Ortiz-Tafoya, M. C., and Tecante, A. (2018). Physicochemical characterization of sodium stearoyl lactylate (SSL), polyoxyethylene sorbitan monolaurate (Tween 20) and κ-carrageenan. Alberto Tecante; Data Brief 19, 642–650. ISSN 2352-3409. doi:10.1016/j.dib.2018.05.064
Qazi, M. J., Liefferink, R. W., Schlegel, S. J., Backus, E. H. G., Bonn, D., and Shahidzadeh, N. (2017). Influence of surfactants on sodium chloride crystallization in confinement. Langmuir 33 (17), 4260–4268. doi:10.1021/acs.langmuir.7b00244
Sun, C.-N., Zawodzinski, T. A., Tenhaeff, W. E., Ren, F., Jong Kahk, K., Sheng, B., et al. (2015). Nanostructure enhanced ionic transport in fullerene reinforced solid polymer electrolytes. Phys. Chem. Chem. Phys. 17 (12), 8266–8275. doi:10.1039/c4cp05583g
Suo, L., Borodin, O., Gao, T., Olguin, M., Ho, J., Fan, X., et al. (2015). Water-in-salt electrolyte enables high-voltage aqueous lithium-ion chemistries. Science 350 (6263), 938–943. doi:10.1126/science.aab1595
Ursenbach, C. P., and Patey, G. N. (1991). The crystallization of alkali halides from aqueous solution: an application of density-functional theory. J. Chem. Phys. 95, 485–493. doi:10.1063/1.461449
Yang, G., Lehmann, M. L., Zhao, S., Li, B., Ge, S., Cao, P.-F., et al. (2021b). Anomalously high elastic modulus of a poly (ethylene oxide)-based composite electrolyte. Energy Storage Mater. 35 (2021), 431–442. doi:10.1016/j.ensm.2020.11.031
Yang, G., Li, X., Cheng, Y., Wang, M., Dong, Ma, Sokolov, A. P., et al. (2021a). Distilling nanoscale heterogeneity of amorphous silicon using tip-enhanced Raman spectroscopy (TERS) via multiresolution manifold learning. Nat. Commun. 12.1, 578. doi:10.1038/s41467-020-20691-2
Keywords: ion, surfactant, conductivity, permittivity, machine learning and AI, crystallization, salt
Citation: Chen J, Keum J, Wang Y, Wang H, Lokitz B, Yang G, Yuan Y, Kumar R and Advincula R (2023) Interface-enhanced conductivities in surfactant-mediated, solution-grown ionic crystalline complexes. Front. Nanotechnol. 5:1293801. doi: 10.3389/fnano.2023.1293801
Received: 13 September 2023; Accepted: 06 November 2023;
Published: 22 November 2023.
Edited by:
Senthil Kumar Sakkarapalayam Murugesan, Central Electrochemical Research Institute (CSIR), IndiaReviewed by:
Subramanyam Sarma Loka, Yogi Vemana University, IndiaArun Prakash Periasamy, University of Surrey, United Kingdom
Copyright © 2023 Chen, Keum, Wang, Wang, Lokitz, Yang, Yuan, Kumar and Advincula. This is an open-access article distributed under the terms of the Creative Commons Attribution License (CC BY). The use, distribution or reproduction in other forums is permitted, provided the original author(s) and the copyright owner(s) are credited and that the original publication in this journal is cited, in accordance with accepted academic practice. No use, distribution or reproduction is permitted which does not comply with these terms.
*Correspondence: Jihua Chen, amlodWFjQGdtYWlsLmNvbQ==