 Scott D. Hopkins
 Estela Blaisten-Barojas
95% of researchers rate our articles as excellent or good
Learn more about the work of our research integrity team to safeguard the quality of each article we publish.
Find out more
ORIGINAL RESEARCH article
Front. Nanotechnol. , 16 October 2023
Sec. Computational Nanotechnology
Volume 5 - 2023 | https://doi.org/10.3389/fnano.2023.1292259
This article is part of the Research Topic Women in Nanotechnology, voIume I View all 10 articles
Polymers exhibiting thermoresponsive behavior above a lower critical solution temperature (LCST) undergo a coil-to-globule phase transition that has many biomedical applications, including biosensing, the control of release devices, and gene or drug delivery systems. In addition, there has been sustained scientific interest in these polymers for their use in industrial applications, including water treatment and desalination. Since the coil-to-globule phase transition is greatly affected by the hydrophilic/hydrophobic balance of the polymer-solvent interactions, the LCST of a particular thermoresponsive polymer depends on the solvent environment and can be tuned through the modification of solution parameters such as co-solvent molar concentrations. While there have been numerous experimental and computational studies focused on the properties of these polymers in aqueous solutions, study of their behavior in more viscous solvents has been limited. In this article, the thermoresponsive behavior of poly (N-isopropylacrylamide) (PNIPAM) and poly (N,N-diethylacrylamide) (PDEA) has been evaluated when in solution with water, the highly viscous liquid glycerol, and both 50:50 and 90:10 glycerol:water mixtures. The adopted methodology includes molecular dynamics techniques and a modified OPLS all-atom force field, which is particularly challenging when the monomers of the targeted polymers have side-chains consisting of a hydrophobic isopropyl group and a hydrophilic amide group along the carbon backbone chain. Hence, our approach entailed simulations at the microsecond scale. The structural and energetic properties of the polymers were characterized, including radius of gyration, solvent accessible surface area, polymer-solvent hydrogen bonding, and interaction energies. Our predictions indicate that these polymers sustain a coil-to-globule phase transition in glycerol solvents at significantly higher LCSTs when compared to the LCST in less viscous aqueous solutions. These predictions highlight valuable insights that will prove advantageous for industrial and nano-scale applications requiring polymer phase behavior with elevated LCST well above ambient temperature.
As part of a large family of thermoresponsive polymers, poly (N-isopropylacrylamide) (PNIPAM) and poly-(N,N-diethylacrylamide) (PDEA) exhibit a coil-to-globule phase transition above a lower critical solution temperature (LCST). The LCST of a particular polymer depends on the local solvent environment and can be tuned through solution parameters such as co-solvent molar concentrations or pH. There has been large scientific interest in these polymers regarding biomedical applications (Doberenz et al., 2020). In particular, PNIPAM and PDEA in water solutions have an experimental LCST of approximately 305 K, which is relatively close to body temperature and ideal for potential drug delivery systems (Idziak et al., 1999). As a result, numerous experimental and computational studies have been performed focusing on the properties of these polymers in aqueous solutions, including co-solvents of various salts, alcohols, and urea (Du et al., 2010; Pang and Cui, 2013; Kang et al., 2016; Micciulla et al., 2016; Dalgicdir and van der Vegt, 2019; Pérez-Ramirez et al., 2019; Bharadwaj et al., 2022; Concilio et al., 2022). In general, the addition of co-solvents has been shown to decrease the LCST of PNIPAM when compared to the LCST in a pure water system. There have also been a limited number of studies examining more viscous solvents or their mixture with water, such as experiments on the effect that various concentrations of either glycerol, erythritol, or xylitol mixed with water had on the LCST of PNIPAM (Narang and Venkatesu, 2018; Rosi et al., 2022). In the case of glycerol, it was shown that in aqueous solutions with up to 0.75 M of glycerol, the LCST of PNIPAM decreased from 305 K to 303 K (Narang and Venkatesu, 2018). However, such mixed solvent environments differ significantly from that of pure glycerol. Indeed, at 300 K the viscosity of pure glycerol is almost one thousand times higher than the viscosity of pure water (Gregory, 1963). There are recent experimental trends for employing high glycerol content solutions of 90:10 with polymers in micro channel experiments leading to biosensors novel architectures (Qin and Arratia, 2017).
In this research we predict the influence of high glycerol content in mixed aqueous solutions on the LCST of PNIPAM and PDEA 30-monomer oligomers. Indeed, the effect of glycerol dominated aqueous solutions on the LCST of PNIPAM and PDEA oligomers has yet to be unraveled. Currently, no experiments or simulations exist in the literature on the LCST of either polymer in pure glycerol or in high glycerol concentration of its mixed solutions with water. In a nutshell, the overall thermal behavior exhibited by these polymers in pure glycerol is unknown. In this article we report our Molecular Dynamics (MD) simulations of both oligomers in pure glycerol, in mixed glycerol:water solutions with relative concentration by mass of 90:10, 50:50, and in pure water. We do verify that for PNIPAM in pure water or in the 50:50 glycerol:water, the LCST remains in the range of 300–305 K and predict that PDEA in these solvents displays a similar LCST. Moreover, we predict the LCST of the PNIPAM and PDEA oligomers in pure glycerol and in the 90:10 glycerol:water mixture to be in the range of 380–390 K and 370–380 K, respectively.
This article is organized as follows. Section 2, Models and Methods, provides a description of how the various polymers in solution of pure and mixed liquids are built at the atomic scale providing extensive details on the all-atom MD large-scale simulation methodology. Section 3, Results and Discussion, provides analyses probing the fate that the PNIPAM and PDEA oligomers undergo when mixed in pure glycerol, 90:10 and 50:50 glycerol:water mixed liquids and in pure water at different temperatures until the LCST transition takes place and the oligomers at lower temperature in the coil structure collapse into the globule structure. The analytics is achieved following the oligomer radius of gyration, moments of inertia, interaction energy with the solvent, solvent accessible surface area (SASA), and an embedded structural approach through principal component analysis over the 280–400 K range of temperatures. An inspection into the hydrogen bonds formed between the oligomers and their liquid environments is also included. The Conclusions, Section 4, summarizes the observations and provides a critical discussion on the structural changes that the oligomers undergo when transitioning across the LCST. Quantitative details are provided in the Supplementary Material.
The chemical structure of the PNIPAM (C6H11NO) and PDEA (C10H15NO2) monomers is provided in Figure 1. For the generation of a polymer chain with 30 monomers, a three-dimensional model of each polymer monomer was constructed using the chemical editor Avogadro (Hanwell et al., 2012). Meanwhile, the oligomers desired syndiotactic tacticity with alternating orientation of the side groups along the backbone chain, were created using a custom-built Python script. These polymeric chains have molecular weight less than 10 ku. Hence, we termed them oligomers (Litvinova, 2000). Specifically, the oligomers studied in this work are 30-PNIPAM (572 atoms, 3,396.819 u) and 30-PDEA (662 atoms, 3,817.629 u).
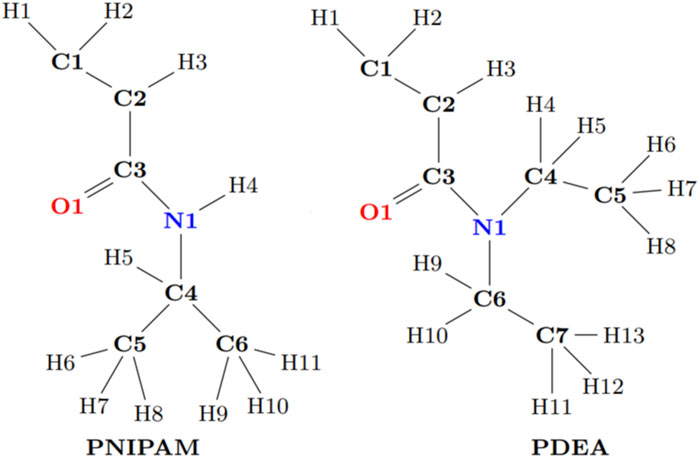
FIGURE 1. Chemical structure of the PNIPAM and the PDEA monomers.
Concerning the modeling employed for all molecular systems, the all-atom OPLS-AA/M force field was used (Jorgensen et al., 1996; Robertson et al., 2015). As is described in previous work, custom atomic charges for the two oligomers were calculated within the restrained electrostatic potential (RESP) approach (Bayly et al., 1993; Frisch et al., 2013; Hopkins et al., 2020). In these oligomers the partial atomic charges of the head, middle, and tail monomers are redistributed to maintain the sp3 hybridization of the backbone carbon atoms. The latter was achieved using the utilities Antechamber and prepgen included in AmberTools 20 (Case et al., 2020). Our obtained atomic partial charges are reported in Supplementary Table S1 of the SM. The SPC/E force field was employed for water (Berendsen et al., 1987).
MD simulations were performed using GROMACS 20.4 (Lindahl et al., 2020). The required topology files containing parameters and oligomer geometry were generated with the aid of the tppmktop utility Erg Research Group: Laboratory of Theoretical (Erg Research Group, 2015). A similar process was used for establishing the topology file of the glycerol (C3H8O3) liquid. The simulation strategy is an adaptation of our more general MD modeling process for macromolecular systems (Andrews and Blaisten-Barojas, 2022).
Since glycerol and water have similar polarity and form an homogeneous solution when mixed in all proportions, our simulations were initialized by placing the fully elongated oligomer inside a dodecahedral computational box and filling the box with randomly placed molecules of the surrounding liquid. For the systems with pure liquids, 2,383 glycerol molecules or 10,980 water molecules were added to the computational box. For the two mixed liquids systems, relative concentration by mass of glycerol:water to reach 50:50 and 90:10 required addition of 1,110:5,651 and 2,350:1,326 glycerol:water molecules to the computational box, respectively. Each system was initially minimized, followed by a series of NVT- and NPT-MD simulations to reach equilibration. A collection of temperatures was evaluated between 280 and 400 K, and the equilibration of the systems at each temperature was achieved though NPT-MD simulations over 40 ns, followed by NVT-MD simulations exceeding 1.0μs. While fully restraining the oligomer conformation, the system was equilibrated at 1.0 atm for all the temperatures using the Nosé-Hoover thermostat and the Parrinello-Rahman pressure coupling (Parrinello and Rahman, 1981; Nosé and Klein, 1983; Nosé, 1984; Hoover, 1985). In all cases, a 1.0 fs time step, periodic boundary conditions, and a 1.2 nm cutoff for the electrostatic and van der Waals interactions were used. The long-range electrostatic interactions were accounted for with the smooth particle-mesh Ewald method (PME) with a Fourier spacing of 0.12 nm (Essmann et al., 1995). For all bonded hydrogens, the linear constraint solver LINCS was applied (Hess et al., 1997). To ensure proper statistics of the oligomers fate, all production simulations were carried out for 1.0 μs. Reported values were averaged over the last 200 ns of each NPT MD run along which instantaneous configurations were saved every 20 ps yielding trajectory files with 10,000 time points. Supplementary Table S2 of the SM gives a summary on the relative concentration by mass of the oligomers in the various liquids and the equilibrated density of each system at two temperatures (below and above the LCST).
The data analyses employed several utilities embedded in the GROMACS package (Lindahl et al., 2020). The sasa utility enabled the computation of the oligomers SASA (Eisenhaber et al., 1995). The hbond utility was used for calculating the hydrogen bonds with donor-acceptor cutoff angle of 30°and cutoff distance of 0.35 nm. The interaction energy between the oligomer and the solvent, Eint, was determined via the rerun command that separates atoms according to groups and analyzes the Lennard-Jones and electrostatic energies between the oligomer atoms and the solvent molecules atoms via the following difference of potential energies:
where Etotal is the potential energy of the full system containing the oligomer plus the liquid environment, Esolvent is the total potential energy of the pure or mixed liquids, and Eoligomer is the potential energy of either the 30-PNIPAM, or the 30-PDEA.
Once the MD trajectories for each oligomer in its liquid environment was calculated, the covar and anaeig utilities were employed for performing a principal component analysis (PCA) (Jolliffe and Cadima, 2016). For each oligomer, the recorded instantaneous coordinates of its structure along the MD trajectory were first aligned to an arbitrary equilibrated configuration with the goal of eliminating the overall translation and rotation (Amadei et al., 1993). Next, a matrix C (nt, 3N) was built containing 3N columns of mass-weighted coordinates of the N backbone atoms and nt rows with their instantaneous time values along the MD trajectory that were saved to file. The 30-PNIPAM and 30-PDEA oligomers have NC = 60 carbon atoms in their backbones that give rise to 57 contiguous dihedral angles ϕ, ψ, where ϕ links C atoms of two contiguous monomers while ψ involves the C atoms of three contiguous monomers. The matrix was regularized by subtracting to each column its mean and dividing by the corresponding standard deviation. The covariance matrix was created, its eigenvalues and eigenvectors determined, followed by projection of the regularized original vectors onto the two most important principal components containing the largest portion of the coordinates variance. Additionally, a similar analysis, termed dPCA, was performed creating the covariance matrix of the oligomer backbone ϕ, ψ cosines and sines collected over the MD trajectory (Mu et al., 2005).
As a validation of the force field for pure glycerol, the NPT-MD equilibrated density as a function of temperature was compared to the experimental density (Gregory, 1963; Egorov et al., 2013). Supplementary Figure S1 of the SM depicts the excellent agreement of the MD density results with the experimental density. Altogether, eight systems were simulated in which one 30-PNIPAM or 30-PDEA was immersed in each of the four liquid environments considered: pure glycerol, 50:50 and 90:50 glycerol:water mixtures, and pure water. Each of these eight systems were MD simulated at a set of five temperatures between 280 and 350 K in the water and 50:50 systems, and between 330 and 400 K in the glycerol and 90:10 system. Hence, our results encompass over 40 μs of MD simulation, along which various properties of the oligomers were calculated. Of importance for this study is the analysis of the change in oligomer structure as a function of temperature and as a function of the liquid environment in which they are present.
A polymer coil is a flexible structure that undergoes continuous bending and twisting with an overall spatially elongated look, while under certain conditions the polymer structure may collapse into a globule structure that is not rigid, but is significantly more compact than the coil. Linear polymers tend to acquire the extended coil conformation when solvated in the residing liquid, while they collapse into a globular cluster if they do not solvate. In the latter case, most often, increasing the temperature of the mixture enhances the miscibility and the polymers extend into coils. In contrast to this general behavior, thermoreactive polymers solvate below their LCST, displaying elongated coil structures, and collapse into globular structures above their LCST, ending their miscibility with the liquid environment.
The oligomer radius of gyration Rg is a polymer structural property that permits a clear characterization of the size and compactness acquired by the polymer chain when acquiring the coil and the globule structures. Coil structural conformations are associated to a large Rg. Above the LCST, thermoresponsive polymers collapse into a globule-like structure with a significantly lower Rg. Hence the Rg as a function of time was calculated during the NVT-MD production runs for each temperature considered. The LCST of each system was determined by bracketing the Rg value between its high value at a lower temperature and its low value at the next higher temperature. Our reported values pertain to mass weighted, Rg, such that for an oligomer with No atoms at positions ri, center of mass position rcm, and masses mi is given by
We determined that the LCST of 30-PNIPAM and 30-PDEA in water was in the range 292–300 K. This aligns with other computational studies and provides confidence in the developed polymer force field (Longhi et al., 2004; Kang et al., 2016; Moghadam and Larson, 2017; de Oliveira et al., 2018; Palivec et al., 2018; Dalgicdir and van der Vegt, 2019). Unexpectedly, the LCST of 30-PNIPAM in the 50:50, 90:10 glycerol:water mixtures, and in pure glycerol are predicted to occur within 312–320 K, 362–370 K, and 372–380 K, significantly higher than the phase transition in pure water. Additionally, the LCST of 30-PDEA in the mixed 50:50, 90:10, and pure glycerol systems are predicted to occur within 332–340 K, 362–370 K, and 372–380 K. These predictions have not been reported in the literature. Similarly, for 30-PDEA in pure glycerol, the LCST is predicted within 382–390 K while in water the transition occurs at the same temperature than for PNIPAM. Figure 2 illustrates the dramatic coil collapse of both oligomers in all four liquid environments when the temperature changes from below to above their LCST.
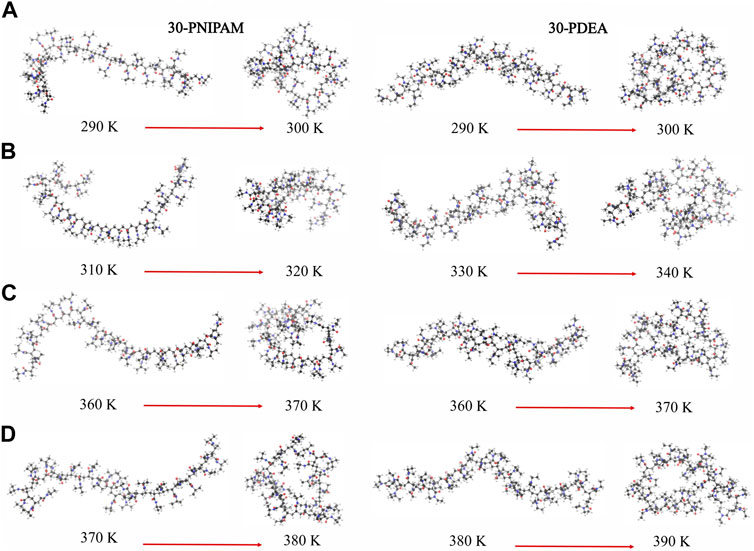
FIGURE 2. Instantaneous coil and globule configurations of 30-PNIPAM and 30-PDEA at temperatures below and above their LCST in (A) water (B) 50:50 and (C) 90:10 glycerol:water mixtures, and (D) glycerol. The atom color scheme is: carbon = gray, oxygen = red, hydrogen = white.
Hence, below the LCST both 30-PINPAM and 30-PDEA display the coil conformation as expected for thermoreactive polymers, and above the LCST the oligomers acquire the globule conformations. The MD simulations gave rise to abundant data that enabled relevant structural and energetic analyses on the polymers coil and globule phases. Compounding the LCST results, a phase diagram can be estimated as depicted in Figure 3, where the dashed lines joining the calculated points are a guide to the eye. Supplementary Figures S2, S3 of the SM show profiles of the Rg as a function of time along the NVT-MD trajectory for both oligomers in the vicinity of the LCST. Table 1 reports the Rg averages and standard deviations.
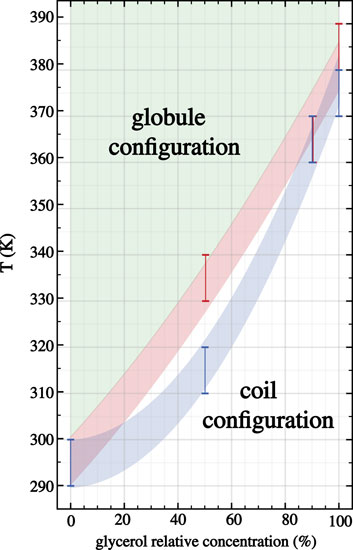
FIGURE 3. Phase diagram for 30-PNIPAM and 30-PDEA in glycerol:water mixed liquid environments as a function of the glycerol proportional concentration. The blue (PNIPAM) and orange (PDEA) shaded areas guide the eye identifying the predicted LCST regions where the transition occurs at different glycerol proportions in the liquid. Above these temperature regions (depicted green) the oligomers acquire the globule structures, while below them (depicted white) the oligomers are in the extended coil structure.
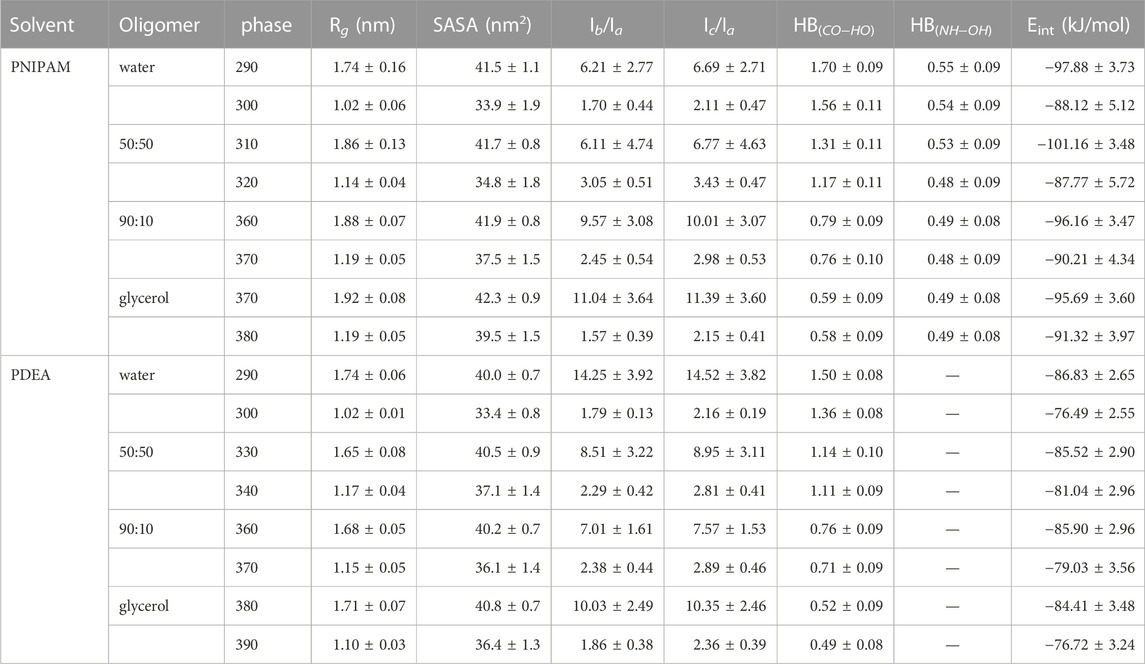
TABLE 1. MD simulation summary. Values correspond to averages over the last 200 ns of the equilibrated 1.0 μs trajectory. Interaction energies and hydrogen bonds (HB) are per monomer.
As summarized in Table 1, above the LCST temperature both 30-PNIPAM and 30-PDEA displayed an Rg depleted by 40%–50% from the coil phase, evidencing the existence of the phase transition in water and in glycerol solutions. Notably, in glycerol the globule Rg of 1.19 nm was approximately 16% higher than the 1.02 nm Rg in water. The oligomer more swollen structure in glycerol than in water is possibly due to the larger size of the glycerol molecules that hinder the compactness of the polymer chain while forming the globule phase. From a different perspective, the moments of inertia along the principal axis of the oligomers, Ia, Ib, Ic were also analyzed. The ratios Ib/Ia and Ic/Ia in the coil phase are approximately 5–6 times higher than those in the globule phase, emphasizing the appearance of the compact globule conformation above the LCST transition temperature, as reported in Table 1. The time profile of these properties is provided in Supplementary Figures S2, S3 of the SM.
Water, glycerol and their mixtures are liquids that form hydrogen bonds. The number of hydrogen bonds per monomer (HB) for each oligomer and in each liquid was calculated along the MD simulations, revealing that in water and glycerol HBs were formed between the oligomer monomers and the solvent, as well as between intra-oligomer monomers. For 30-PNIPAM and 30-PDEA, HBs occurred between the oligomer carbonyl oxygen and the solvent hydroxyl hydrogen, denoted as HBCO−HO. For 30-PNIPAM, HBs also occurred between the oligomer amine hydrogen and the solvent hydroxyl oxygen, denoted as HBNH−OH. Table 1 lists these values and Supplementary Figures S2, S3 of the SM display their time behavior. A small number of monomer-monomer HBs were also present between the carbonyl oxygen and amine hydrogen. While the frequency of oligomer-solvent HBs decreased slightly above the LCST, the frequency of the intra-oligomer monomer-monomer HB increased slightly. Based on these observations, the number of HBs is not a distinctive characteristic for identifying the behavior of the oligomers either below and above the LCST in neither one of the four liquid environments studied in this work.
Another interesting property is Eint, the interaction energy per monomer between the oligomer and its liquid environment. Mean values of Eint are listed in Table 1 while their time profiles are provided in Supplementary Figures S2, S3 of the SM. For 30-PNIPAM and 30-PDEA in water the Eint increased approximately 10 kJ/mol when the system transitioned from below and above the LCST. This energy increase indicates a less favorable system state above the LCST due to the decrease in the oligomer solubility. In contrast, for both oligomers in pure glycerol, the Eint increased only 4 kJ/mol for 30-PNIPAM, and 7 kJ/mol for 30-PDEA, indicating a less prominent effect due to the solvent in the coil-to-globule structure transition of the two oligomers. In fact, the 50:50 and 90:10 glycerol:water mixtures display a progressive loss of solvent energy influence as the amount of glycerol becomes more dominant, indicating that the oligomer globule structure is less tightly bound the more glycerol is in the solution. Figure 4 contains a scatter plot showing the correlation between Rg and Eint occurring in all four studied liquid media for both oligomers, where the red color identifies a high number of occurrences along the 200 ns MD trajectory while blue indicates a small number. This plot gives a clear visual representation of the interaction energetics occurring in the four studied system for each oligomer.
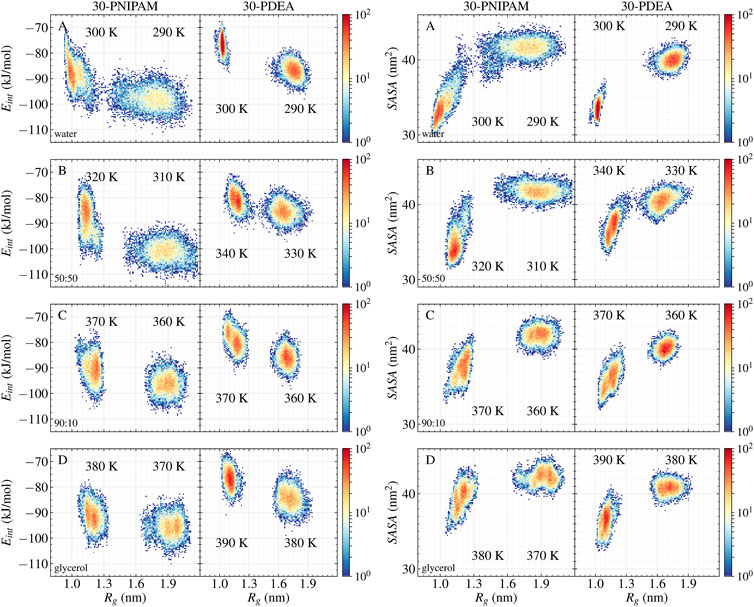
FIGURE 4. 30-PNIPAM and 30-PDEA correlation plots between Rg and Eint per monomer (left), and between Rg and SASA (right) in (A) water (B) 50:50 (C) 90:10 glycerol:water mixtures, and (D) glycerol systems. For each temperature 200 ns of NPT MD trajectory times were spanned, with 10,000 instantaneous structures saved to file. Red and blue identify plot regions with large and small number of trajectory points.
Supplementing the energetics of oligomer-solvent interactions, the SASA of the oligomers was determined along the MD trajectories, resulting in a visible characterization of the coil-to-globule transition. Table 1 lists the SASA mean values and standard deviations while Supplementary Figures S2, S3 of the SM provide the time evolution along the MD trajectory. For each oligomer in the coil phase, the SASA fluctuated between 39 and 45 nm2 both in water and in glycerol solvents; whereas in the globule phase, the SASA fluctuations of 34 and 45 nm2 in glycerol were comparatively larger than the 30 and 38 nm2 fluctuations observed water, indicating of the spatial hindrance imposed by the size of glycerol molecules. By correlating the SASA with the Rg of the MD simulations, the coil and globule phases were well identified, as Figure 4 illustrates.
Two different principal component analyses were performed, yielding additional insight into which oligomer structures along the MD trajectories were coil or globular. One PCA analysis involved the pre-aligned oligomer backbone mass-weighted Cartesian coordinates as input features. This PCA was done at the two temperatures bracketing the LCST for each oligomer in each liquid system. The resulting PC1 and PC2 accounted for approximately 63% of the total variance in the analyses of the 30-PNIPAM and 30-PDEA. The input features of each oligomer along the MD trajectory are projected on these prominent principal components and their time profile is given in Supplementary Figures S4, S5 of the SM. The second PCA analysis (dPCA) involved the oligomer backbone dihedral angles (ϕ, ψ) along the trajectory. Again, the dPCA was performed with data from MD trajectories at the two temperatures bracketing the LCST for each oligomer in each liquid system. A similar total variance percentage was obtained in the dPCA analysis as in the previous case when only the dPC1 and dPC2 were considered. A projection of the original regularized data onto each of these two prominent principal components was achieved. Supplementary Figures S4, S5 of the SM provide the dPC1 and dPC2 time evolution along the MD trajectory. Meanwhile, the scatter plot of the projected original data onto dPC1 and dPC2 is shown in Figure 5 illustrating both, the 30-PNIPAM and 30-PDEA. Noticeable, the density of trajectory points in these scatter plots is not uniform. Indeed, the point density is associated to a probability distribution
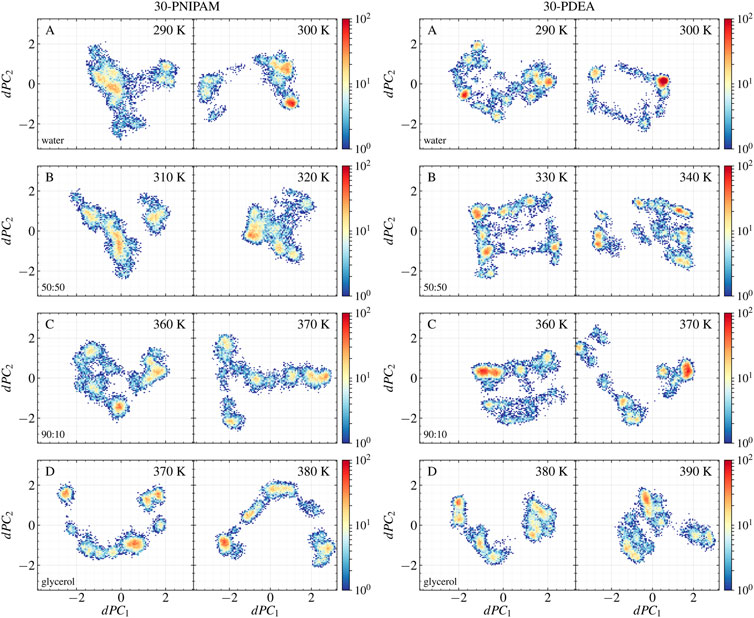
FIGURE 5. Scatter plots of the 30-PNIPAM and 30-PDEA dihedral angles data along the MD trajectories projected onto the dPC1 and dPC2 for the (A) water, (B) 50:50, (C) 90:10 glycerol:water mixtures, and (D) glycerol systems below the LCST (left) and above he LCST. (right) for each oligomer.
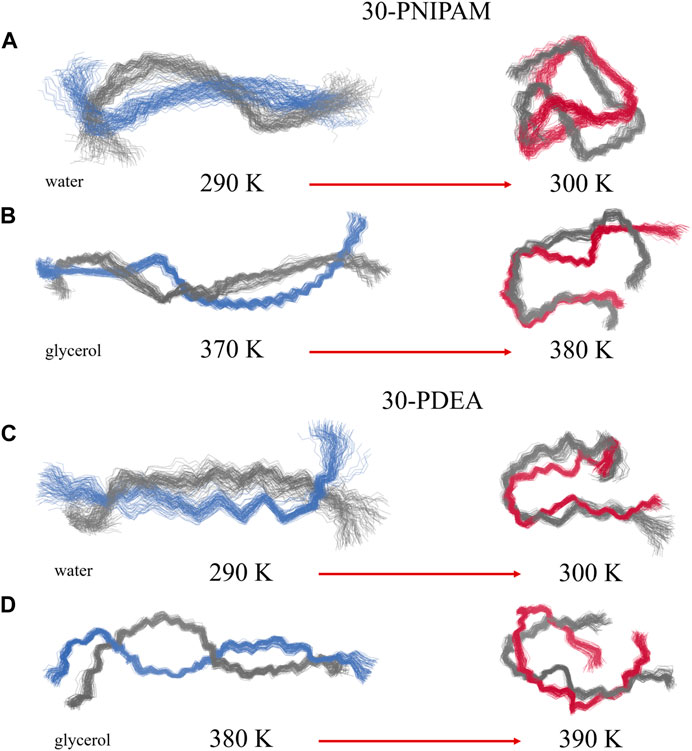
FIGURE 6. Collection of wireframe depiction of the 30-PNIPAM and the 30-PDEA backbones in water (A, C) and in glycerol (B, D) corresponding to the dPCA embedding of Figures 5A,D. Grey and blue/red wires identify the oligomers structure corresponding to two regions of high
This article describes a high-performance modeling and simulation approach that evidences the power of microsecond-long Molecular Dynamics simulations for identifying the structural characteristics of two polymers undergoing the LCST phase transition in four different liquid environments. Based on our extensive simulations, the research outcomes predict that 30-PNIPAM and 30-PDEA syndiotactic oligomers display the coil-to-globule transition when mixed with pure glycerol or with the 90:10 glycerol:water mixture with predicted LCST temperatures in the range 360–390 K. As a validation of these predictions, additional simulations for these two oligomers in liquids with a higher content of water, were performed for mixed glycerol:water 50:50 and pure water systems. Our outcomes predict significantly lower LCSTs in the range 290–340 K depending on the oligomer and the glycerol content of the liquid environments.
In a nutshell, our four predictions for the 30-PNIPAM LCST are 370–380 K in pure glycerol, 360–370 K in mixed 90:10 glycerol:water, 310–320 K in mixed 50:50, and 290–300 K in pure water. Hence, while the result of this oligomer in water is in excellent agreement with the existing experimental and computational literature, our predictions for the LCST as the glycerol content by mass increases allowed us to describe a predicted phase diagram for the LCST transition as reported in Figure 3. Currently, there are no experimental observations of this transition for PNIPAM in pure glycerol or glycerol:water solutions with high glycerol content. Simultaneously, our four predictions for the 30-PDEA LCST are 380–390 K in pure glycerol, 360–370 K in mixed 90:10 glycerol:water, 330–340 K in mixed 50:50 glycerol:water, and 290–300 K in pure water. The transition temperature for this oligomer is about 10 K higher than for 30-PNIPAM in equal liquid environments, which is cast into the predicted phase diagram illustrated in Figure 3. To be noted explicitly, currently, there are no experimental observations of PDEA LCST structural transition in glycerol, water or any mixture of these liquids.
Pertaining to our predicted higher than ambient and in the range of boiling water LCSTs, it is worth pointing out that at those temperatures the viscosity of glycerol of about 0.014 N/m2 is only a small fraction of its value of 0.510 N/m2 at 304 K. Hence, this steep decrease in the glycerol viscosity most likely enables the coil-to-globule structural collapse of polymers in glycerol yielding a LCST around the predicted 370–380 K or 380–390 K rage depending upon the oligomer. Since the predicted LCST of PNIPAM and PDEA in glycerol are above the boiling point of water, glycerol is a candidate solvent for industrial applications where polymer phase change behavior at higher than ambient temperatures would be advantageous.
The original contributions presented in the study are included in the article/Supplementary Material, further inquiries can be directed to the corresponding author.
SH: Data curation, Formal Analysis, Methodology, Software, Validation, Visualization, Writing–original draft. EB-B: Investigation, Methodology, Validation, Conceptualization, Funding acquisition, Project administration, Resources, Supervision, Writing–review and editing.
The author(s) declare financial support was received for the research, authorship, and/or publication of this article. Funding for this work was provided by the Center for Simulation and Modeling and the Department of Computational and Data Sciences of George Mason University.
All simulations were performed on the high performance computing clusters of the Office of Research Computing at George Mason University.
The authors declare that the research was conducted in the absence of any commercial or financial relationships that could be construed as a potential conflict of interest.
All claims expressed in this article are solely those of the authors and do not necessarily represent those of their affiliated organizations, or those of the publisher, the editors and the reviewers. Any product that may be evaluated in this article, or claim that may be made by its manufacturer, is not guaranteed or endorsed by the publisher.
The Supplementary Material for this article can be found online at: https://www.frontiersin.org/articles/10.3389/fnano.2023.1292259/full#supplementary-material
Amadei, A., Linssen, A. B. M., and Berendsen, H. J. C. (1993). Essential dynamics of proteins. Proteins Struct. Funct. 17, 412–425. doi:10.1002/prot.340170408
Andrews, J., and Blaisten-Barojas, E. (2022). “Workflow for investigating thermodynamic, structural and energy properties of condensed polymer systems,” in Advances in parallel and distributed processing and applications. Editor H. R. Arabnia (Switzerland: Springer Nature), 1033–1039.
Bayly, C. I., Cieplak, P., Cornell, W., and Kollman, P. A. (1993). A well-behaved electrostatic potential based method using charge restraints for deriving atomic charges: the RESP model. J. Phys. Chem. 97, 10269–10280. doi:10.1021/j100142a004
Berendsen, H., Grigera, J. R., and Straatsma, T. P. (1987). The missing term in effective pair potentials. J. Phys. Chem. 91, 6269–6271. doi:10.1021/j100308a038
Bharadwaj, S., Niebuur, B.-J., Nothdurft, K., Richtering, W., van der Vegt, N. F. A., and Papadakis, C. M. (2022). Cononsolvency of thermoresponsive polymers: where we are now and where we are going. Soft Matter 18, 2884–2909. doi:10.1039/D2SM00146B
Case, D., Cheatham, I., Darden, T., Gohlke, H., Luo, R., Merz, K., et al. (2020). AmberTools 20 - molecular dynamics simulation. Available at: https://mybiosoftware.com/ambertools-molecular-dynamics-simulation.html (Accessed August 30, 2023).
Concilio, M., Beyer, V. P., and Becer, C. R. (2022). Thermoresponsive polymers in non-aqueous solutions. Polym. Chem. 13, 6423–6474. doi:10.1039/D2PY01147F
Dalgicdir, C., and van der Vegt, N. F. A. (2019). Improved temperature behavior of PNIPAM in water with a modified OPLS model. J. Phys. Chem. B 123, 3875–3883. doi:10.1021/acs.jpcb.9b01644
de Oliveira, T. E., Marques, C. M., and Netz, P. A. (2018). Molecular dynamics study of the LCST transition in aqueous poly(N-n-propylacrylamide). Phys. Chem. Chem. Phys. 20, 10100–10107. doi:10.1039/c8cp00481a
Doberenz, F., Zeng, K., Willems, C., Zhang, K., and Groth, T. (2020). Thermoresponsive polymers and their biomedical application in tissue engineering - a review. J. Mater. Chem. B 8, 607–628. doi:10.1039/C9TB02052G
Du, H., Wickramasinghe, R., and Qian, X. (2010). Effects of salt on the lower critical solution temperature of poly (N-isopropylacrylamide). J. Phys. Chem. B 114, 16594–16604. doi:10.1021/jp105652c
Egorov, G. I., Makarov, D. M., and Kolker, A. M. (2013). Volume properties of liquid mixture of water + glycerol over the temperature range from 278.15 to 348.15 K at atmospheric pressure. Thermochim. Acta 570, 16–26. doi:10.1016/j.tca.2013.07.012
Eisenhaber, F., Lijnzaad, P., Argos, P., Sander, C., and Scharf, M. (1995). The double cubic lattice method: efficient approaches to numerical integration of surface area and volume and to dot surface contouring of molecular assemblies. J. Comput. Chem. 16, 273–284. doi:10.1002/jcc.540160303
Erg Research Group (2015). Laboratory of theoretical biophysics. TPPMKTOP Available at: https://erg.biophys.msu.ru/tpp/ (Accessed August 30, 2023).
Essmann, U., Perera, L., Berkowitz, M., Darden, T., Lee, H., and Pedersen, L. (1995). A smooth particle mesh Ewald method. J. Chem. Phys. 103, 8577–8593. doi:10.1063/1.470117
Frisch, M., Trucks, G. W., Schlegel, H. B., Scuseria, G. E., Robb, M. A., Cheeseman, J. R., et al. (2013). Gaussian 09, revision D.01. Wallingford CT, USA: Gaussian Inc.
Gregory, S. R. (1963). Physical Properties of Glycerine and its solutions (glycerine producers’ association). Available at: https://books.google.com/books?id=XpeaGQAACAAJ (Accessed August 30, 2023).
Hanwell, M. D., Curtis, D. E., Lonie, D. C., Vandermeersch, T., Zurek, E., and Hutchison, G. R. (2012). Avogadro: an advanced semantic chemical editor, visualization, and analysis platform. J. Cheminf. 4, 17. doi:10.1186/1758-2946-4-17
Hess, B., Bekker, H., and Fraaije, J. (1997). LINCS: a linear constraint solver for molecular simulations. J. Comp. Chem. 18, 1463–1472. doi:10.1002/(sici)1096-987x(199709)18:12<1463:aid-jcc4>3.0.co;2-h
Hoover, W. (1985). Canonical dynamics: equilibrium phase-space distributions. Phys. Rev. A 31, 1695–1697. doi:10.1103/physreva.31.1695
Hopkins, S., Gogovi, G., Weisel, E., Handler, R., and Blaisten-Barojas, E. (2020). Polyacrylamide in glycerol solutions from an atomistic perspective of the energetics, structure, and dynamics. AIP Adv. 10, 085911. doi:10.1063/5.0020850
Idziak, I., Avoce, D., Lessard, D., Gravel, D., and Zhu, X. X. (1999). Thermosensitivity of aqueous solutions of poly(N,N-diethylacrylamide). Macromolecules 32, 1260–1263. doi:10.1021/ma981171f
Jolliffe, I. T., and Cadima, J. (2016). Principal component analysis: a review and recent developments. Philos. Trans. A Math. Phys. Eng. Sci. 374, 20150202. doi:10.1098/rsta.2015.0202
Jorgensen, W. L., Maxwell, D. S., and Tirado-Rives, J. (1996). Development and testing of the OPLS all-atom force field on conformational energetics and properties of organic liquids. J. Am. Chem. Soc. 118, 11225–11236. doi:10.1021/ja9621760
Kang, Y., Joo, H., and Kim, J. S. (2016). Collapse-swelling transitions of a thermoresponsive, single poly(N-isopropylacrylamide) chain in water. J. Phys. Chem. B 120, 13184–13192. doi:10.1021/acs.jpcb.6b09165
Lindahl, E., Abraham, M., Hess, B., and van der Spoel, D. (2020). GROMACS 2020 documentation and source code. Available at: https://doi.org/10.5281/zenodo.3562512 (Accessed August 30, 2023).
Litvinova, L. S. (2000). “Synthetic polymers: thin layer (planar) chromatography,” in Encyclopedia of separation science. Editor I. D. Wilson (Netherlands: Academic Press), 4348–4354.
Longhi, G., Lebon, F., Abbate, S., and Fornili, S. L. (2004). Molecular dynamics simulation of a model oligomer for poly(N-isopropylamide) in water. Chem. Phys. Lett. 386, 123–127. doi:10.1016/j.cplett.2004.01.045
Micciulla, S., Michalowsky, J., Schroer, M. A., Holm, C., Klitzing, R. V., and Smiatek, J. (2016). Concentration dependent effects of urea binding to poly(N-isopropylacrylamide) brushes: a combined experimental and numerical study. Phys. Chem. Chem. Phys. 18, 5324–5335. doi:10.1039/c5cp07544k
Moghadam, S., and Larson, R. G. (2017). Assessing the efficacy of poly(N-isopropylacrylamide) for drug delivery applications using molecular dynamics simulations. Mol. Pharm. 14, 478–491. doi:10.1021/acs.molpharmaceut.6b00942
Mu, Y., Nguyen, P. H., and Stock, G. (2005). Energy landscape of a small peptide revealed by dihedral angle principal component analysis. Proteins Struct. Funct. 58, 45–52. doi:10.1002/prot.20310
Narang, P., and Venkatesu, P. (2018). Unravelling the role of polyols with increasing carbon chain length and OH groups on the phase transition behavior of PNIPAM. New J. Chem. 42, 13708–13717. doi:10.1039/C8NJ02510J
Nosé, S. (1984). A molecular dynamics method for simulations in the canonical ensemble. Mol. Phys. 52, 255–268. doi:10.1080/00268978400101201
Nosé, S., and Klein, M. (1983). Constant pressure molecular dynamics for molecular systems. Mol. Phys. 50, 1055–1076. doi:10.1080/00268978300102851
Palivec, V., Zadrazil, D., and Heyda, J. (2018). All-atom REMD simulation of poly-N-isopropylacrylamide thermodynamics in water: a model with a distinct 2-state behavior. arXiv:1806.05592v1 [physics.chem-ph]. Available at: https://arxiv.org/abs/1806.05592 (Accessed June 14, 2018).
Pang, X., and Cui, S. (2013). Single-chain mechanics of poly(N,N-diethylacrylamide) and poly(N-isopropylacrylamide): comparative study reveals the effect of hydrogen bond donors. Langmuir 29, 12176–12182. doi:10.1021/la403132e
Parrinello, M., and Rahman, A. (1981). Polymorphic transitions in single crystals: a new molecular dynamics method. J. Appl. Phys. 52, 7182–7190. doi:10.1063/1.328693
Pérez-Ramirez, H. A., Haro-Pérez, C., and Odriozola, G. (2019). Effect of temperature on the cononsolvency of poly(N-isopropylacrylamide) (PNIPAM) in aqueous 1-propanol. ACS Appl. Polym. Mater. 1, 2961–2972. doi:10.1021/acsapm.9b00665
Qin, B., and Arratia, P. E. (2017). Characterizing elastic turbulence in channel flows at low Reynolds number. Phys. Rev. Fluids 2, 083302. doi:10.1103/physrevfluids.2.083302
Robertson, M. J., Tirado-Rives, J., and Jorgensen, W. L. (2015). Improved peptide and protein torsional energetics with the opls-aa force field. J. Chem. Theory Comput. 11, 3499–3509. doi:10.1021/acs.jctc.5b00356
Keywords: thermoresponsive polymer, PNIPAM, PDEA, lower critical solution temperature (LCST), molecular dynamics, glycerol, coil-to-globule transition
Citation: Hopkins SD and Blaisten-Barojas E (2023) Molecular dynamics simulations evidence the thermoresponsive behavior of PNIPAM and PDEA in glycerol solutions. Front. Nanotechnol. 5:1292259. doi: 10.3389/fnano.2023.1292259
Received: 11 September 2023; Accepted: 03 October 2023;
Published: 16 October 2023.
Edited by:
Tomaz Urbic, University of Ljubljana, SloveniaReviewed by:
Animesh Pan, University of Rhode Island, United StatesCopyright © 2023 Hopkins and Blaisten-Barojas. This is an open-access article distributed under the terms of the Creative Commons Attribution License (CC BY). The use, distribution or reproduction in other forums is permitted, provided the original author(s) and the copyright owner(s) are credited and that the original publication in this journal is cited, in accordance with accepted academic practice. No use, distribution or reproduction is permitted which does not comply with these terms.
*Correspondence: Estela Blaisten-Barojas, YmxhaXN0ZW5AZ211LmVkdQ==
Disclaimer: All claims expressed in this article are solely those of the authors and do not necessarily represent those of their affiliated organizations, or those of the publisher, the editors and the reviewers. Any product that may be evaluated in this article or claim that may be made by its manufacturer is not guaranteed or endorsed by the publisher.
Research integrity at Frontiers
Learn more about the work of our research integrity team to safeguard the quality of each article we publish.