 Yijun Ge
 Timothy S. Fisher
95% of researchers rate our articles as excellent or good
Learn more about the work of our research integrity team to safeguard the quality of each article we publish.
Find out more
ORIGINAL RESEARCH article
Front. Nanotechnol. , 17 October 2022
Sec. Nanophotonics
Volume 4 - 2022 | https://doi.org/10.3389/fnano.2022.999292
This article is part of the Research Topic Global Excellence in Nanotechnology: United States View all 4 articles
Electronic and optical properties of single-layer and bilayer armchair graphene nanoribbons are investigated using a first-principles method. Increased nanoribbon width reduces the band gap and causes a red shift in photon absorption energy. The 3n + 2 family of nanoribbons has the smallest band gaps and lowest onset photon absorption energy among the three families considered due to high π-conjugation indicated by exciton wavefunctions. We also compare the bilayer α and β alignments of armchair graphene nanoribbons with their single-layer counterparts. The extra layer of graphene reduces the band gap and onset photon absorption energy, and the difference between the α alignment and the single-layer configuration is more significant than that of the β alignment and the single layer. Our calculations indicate that the optical properties of graphene nanoribbons depend on the details of atomic structures, including nanoribbon width, edge alignment and number of layers. These characteristics are expected to be important in the design of optoelectronic devices.
Electronic and optical properties of graphene nanoribbons depend on their particular atomic structures, and are tunable by varying widths and edge structures. Tunable bandgap and high mobility make graphene nanoribbons excellent candidates for a wide variety of optoelectronic applications. This work presents a modeling framework for calculating the electro-optical behavior of a variety of graphene nanoribbons with related predictions and explanations of simulated spectral behavior.
Photodetectors made from graphene nanoribbon-based devices exhibit ultra-high bandwidth and broadband light detection (Xia et al., 2009; Yu et al., 2016; Yu et al., 2020), and their photoresponsivity can be enhanced by the photo-gating effect (Ogawa et al., 2019) and introducing electron trapping centers to inhibit carrier recombination (Zhang et al., 2013). Graphene nanoribbons have also been used in engineering photovoltaic devices. Xie et al. (Xie et al., 2012) reported a photoconversion efficiency of 1.47% by increasing the doping level in Schottky solar cells based on junctions between graphene nanoribbons and multiple silicon nanowires, suggesting that graphene-based devices are promising solar cell materials due to their higher efficiency and easier production than devices based on silicon nanowires or silicon nanoribbons. Yang et al. (Yang et al., 2010) used graphene as 2D bridges in nanocrystalline electrodes of dye-sensitized solar cells and observed a 39% increase in photoconversion efficiency due to faster electron transport and lower recombination caused by the introduction of graphene.
In the field of photocatalysis, graphene-semiconductor composites have received attention in recent years as clean energy conversion is gaining interests among researchers. Chemically bonded P25-graphene nanocomposite photocatalyst was reported to increase the reaction rate significantly in the photodegradation process of methylene blue when compared with bare P25 and P25-CNTs photocatalysts (Zhang et al., 2010). Li et al. (Li et al., 2011) reported highly efficient H2 production from water with CdS-cluster-decorated graphene nanosheet photocatalyst under visible light illumination. The high efficiency of H2 production was attributed to graphene nanosheets that help collect and transport electrons generated by photoexcitation in the CdS clusters and therefore suppress the recombination of electron-hole pairs.
To better design graphene nanoribbon-based optoelectronics, an in-depth understanding of their electronic and optical properties is required. The recent development of bottom-up synthesis of structurally well-defined graphene and graphene nanoribbons (Narita et al., 2014; Alghfeli and Fisher, 2022) has advanced experimental investigations of optoelectronic properties of graphene nanoribbons. Experiments using different spectroscopy methods, including optical imaging and absorption spectroscopy, reflectance difference spectroscopy and energy- and angle-resolved two-photon photoemission spectroscopy (Denk et al., 2014; Bronner et al., 2016; Zhao et al., 2020), have shown that the optical response of armchair graphene nanoribbons is dominated by excitons, i.e. strongly correlated electron-hole pairs. The importance of excitonic effects in the optical response of graphene nanoribbons is also confirmed by theoretical studies incorporating many-body effects (Yang et al., 2007a; Prezzi et al., 2008).
Previous studies have focused on single-layer graphene nanoribbons, such that the optical properties of bilayer graphene nanoribbons are not well understood. A prior study (Wright et al., 2009) suggested that the interplay of nanoribbon chirality and inter-ribbon coupling can enhance terahertz and far infrared optical response in bilayer graphene nanoribbons with a 1D massless Dirac fermion energy dispersion near the Γ point. The effects of π-stacking were investigated in another study (De Corato et al., 2014) and found to widen the optical absorption range in bilayer graphene nanoflakes with homogeneous stacking and heterogeneous stacking.
Semiempirical models including tight-binding approximations (Wright et al., 2009; Ho et al., 2010; Huang et al., 2019) have been used commonly in previous calculations of optical properties. In this work, we use first-principles methods (Ge and Fisher, 2020) to assess the electronic and optical properties of single-layer graphene nanoribbons and bilayer graphene nanoribbons with α and β alignments. We also compare the optical properties of graphene nanoribbons from three different nanoribbon families.
Ground-state electronic properties are obtained by solving the mean-field Kohn–Sham equations with mean-field density functional theory (DFT) (Kohn and Sham, 1965; Ho et al., 2010):
where Vion is the external potential associated with the nuclei, VH is the Hartree potential, Vxc is the exchange-correlation potential that handles the anti-symmetric nature of electron wave functions and electron correlations, and
The Dyson equation is solved to compute quasi-particle eigenvalues and wave functions within the GW approximation:
where
Optical properties and excited states are calculated by solving the Bethe-Salpeter equation (BSE) (Salpeter and Bethe, 1951):
where
The absorption spectra is proportional to the imaginary part of the macroscopic dielectric function. Within the independent-particle approximation, which neglects the interaction between the quasi-electron and quasi-hole, the imaginary part of the dielectric function is:
while with electron-hole interactions, it simplifies to:
where
where k is the extinction index:
Mean-field ground-state electronic structure was calculated using the Quantum Espresso package (Giannozzi et al., 2009). Full potentials were replaced by norm-conserving pseudopotentials with a 110 Ry cutoff to reduce the oscillation of wave functions and therefore the number of plane waves near the core. Exchange-correlation potentials were accounted for within the local density approximation (LDA) (Perdew and Wang, 1992). The atomic structures were fully relaxed using a 1 × 1 × 30 k-grid until the energy error between two consecutive self-consistent calculations was smaller than 10–12 Ry.
GW calculations were conducted using the BerkeleyGW (Deslippe et al., 2012) package. The dielectric matrix and self-energy
Optical response was obtained by solving the Bethe-Salpeter equation (BSE) on a dense k-grid, but the computation of the interaction kernel (the second term in Eq. 3) is very expensive. Therefore an interpolation technique was used to obtain converged results of the absorption spectra with feasible computational cost. The interaction kernel and quasi-particle electron energy were first computed on a coarse k-grid (1 × 1 × 30). By expanding the fine k-grid (1 × 1 × 60) wave functions in terms of the coarse k-grid wave functions, both the quasi-particle energy and kernel matrix elements were interpolated onto the fine k-grid. After constructing the effective Hamiltonian, Eq. 3 was then diagonalized to obtain the excitation energy and the exciton amplitude.
In this work, N-AGNR denotes the armchair graphene nanoribbon with N dimer lines along the width direction. The edges of the armchair graphene nanoribbons are passivated with hydrogen atoms. Figure 1 shows a schematic of the graphene nanoribbon with armchair edges and 5 dimer lines along the width (5-AGNR). The blue box illustrates a unit cell used in DFT simulations. A 15 Å vacuum was placed in both the width and out-of-plane directions to avoid interactions between repeated images.
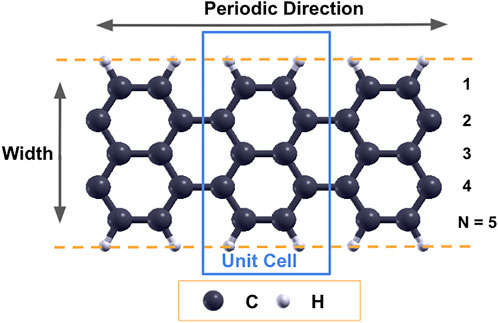
FIGURE 1. Schematic of a 5-AGNR. Dashed lines represent the edges of graphene nanoribbons, and the blue rectangle represents the unit cell used in simulations.
Three families of armchair graphene nanoribbons were investigated in current work: 3n, 3n + 1 and 3n + 2 where n is an integer number. Figure 2 shows the band gaps of armchair graphene nanoribbons with widths of 6 Å to 16 Å calculated within the DFT-LDA and the GW approximations, qualitatively agreeing with literature (Son et al., 2006; Yang et al., 2007b). While the GW approximation increases the band gaps for all three families considered, the inclusion of many-body interactions has a more significant effect on 3n and 3n + 1 families. As width increases, the band gaps decrease and the difference between DFT-LDA and GW calculations also decreases. The band gap eventually goes to zero as width goes to infinity. For a fixed n number, e.g., when n = 2, the band gap of the 3n + 2 family (8-AGNR, middle points on the red curves) is the smallest, and that of the 3n + 1 family (7-AGNR, left-most points on the magenta curves) is the largest.
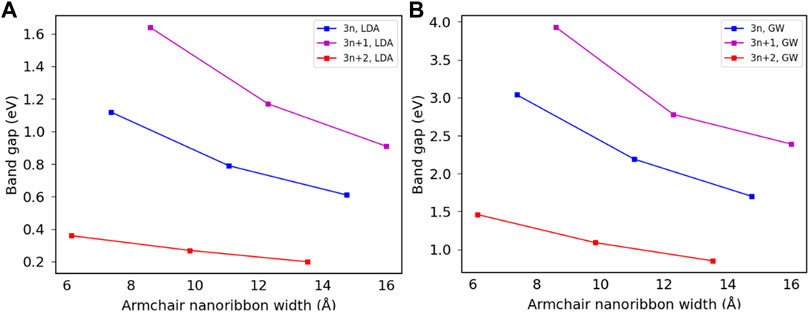
FIGURE 2. Comparison of band gaps of armchair graphene nanoribbons calculated from DFT-LDA and GW approximations. (A) LDA bandgaps. (B) GW bandgaps.
Figure 3 contains a comparison of band structures along the high symmetry Γ − X line calculated from DFT and GW approches for 7-AGNR, 8-AGNR and 9-AGNR. The shapes of the band structures obtained within the DFT approximation and GW approximation are similar, but GW approximation enlarges the band gaps for all families, most significantly for 7-AGNR.
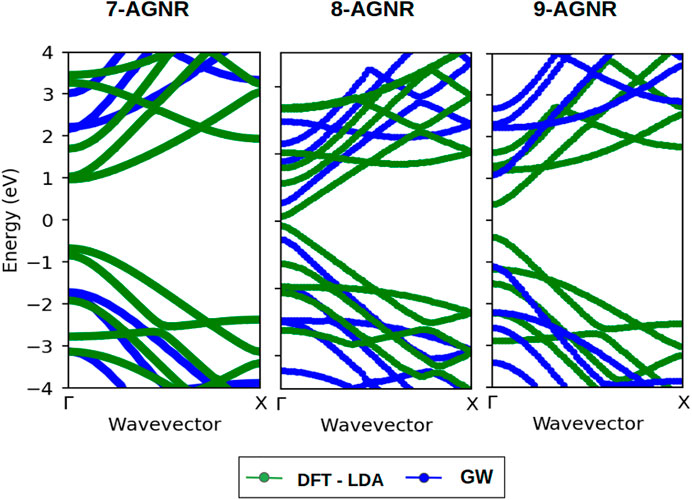
FIGURE 3. Band structures of 7-AGNR (3n + 1), 8-AGNR (3n + 2) and 9-AGNR (3n). Green and blue lines represent band structures calculated within the LDA and the GW approximations, respectively.
Figure 4 shows the imaginary and the real parts of the dielectric function of armchair single layer graphene nanoribbons from three families: the 3n + 1 family (Figures 4A,B), the 3n family (Figures 4C,D) and the 3n + 2 family (Figures 4E,F). Increasing width causes the ϵ1 and ϵ2 peaks to shift to lower photon energies. For a fixed n number, the 3n + 2 family has the smallest incident energies for the peaks in the dielectric functions, and the 3n + 1 family has the largest incident energies for the peaks, consistent with the band gaps observed in Figure 2.
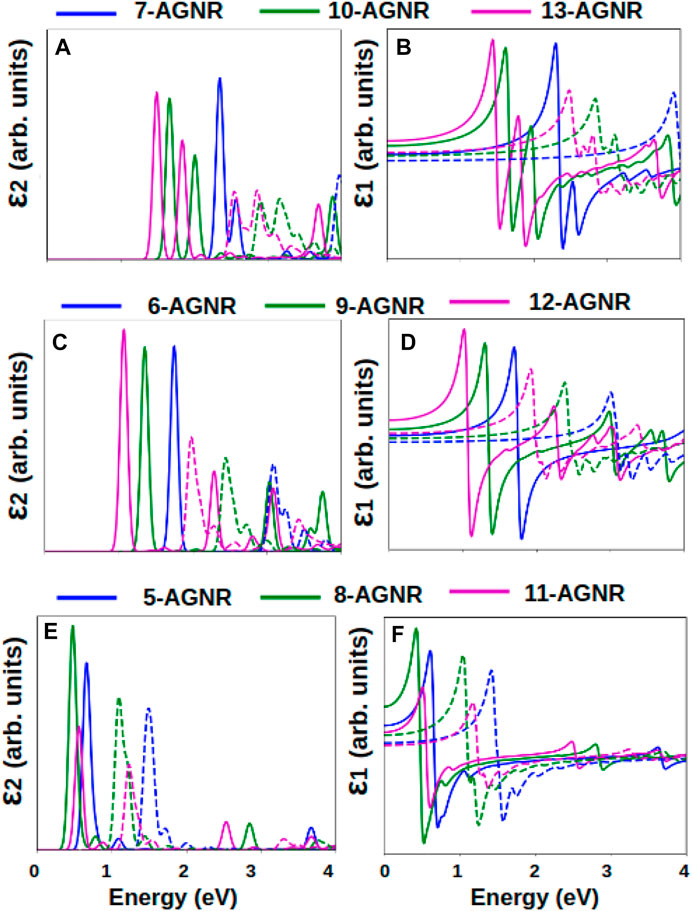
FIGURE 4. Imaginary and real parts of the dielectric function of armchair graphene nanoribbons calculated within the GW-BSE and GW-RPA approximations. Imaginary and real parts of the dielectric function for (A,B) 3n + 1 family, (C,D) 3n family and (E,F) 3n + 2 family. Solid lines represent absorption spectra from GW + BSE calculations; dashed lines represent absorption spectra from GW + RPA calculations.
In the energy range of 0–4 eV, the most dominant peak in the optical absorption spectra (the imaginary part of the dielectric function ϵ2) is E1,1 for the 3n and 3n + 2 families. For the 3n + 1 family, two prominent absorption peaks exist within the energy range of interest: E1,1 and E2,2. E1,1 represents an excitation from the highest valence band to the lowest conduction band, and E2,2 represents an excitation from the second highest valence band to the second lowest conduction band. The inclusion of electron-hole interactions in the calculation of the dielectric function significantly shifts the peaks to the low energy range. The 3n + 1 family experiences the largest effect of electron-hole interactions while the 3n + 2 family experiences the smallest effect, displaying a trend similar to the band gaps and the incident energies.
Figure 5 shows the relationship between absorption peaks in the absorption spectra and the corresponding vertical interband transitions in the quasi-particle band structure for 7-AGNR, a representative of the 3n + 1 family. The energy of the electron-hole quasi-particle is smaller than an unbound electron-hole pair due to the interaction between the electron and the hole that is essentially the Coulomb force; therefore the incident absorption energy required in the optical absorption spectra is smaller than the electronic band gap. In Figure 5, the E1,1 exciton forms at an incident photon energy of 2.35 eV while the electronic band gap is 3.93 eV. The difference between the electronic band gap and the optical band gap, also known as the exciton binding energy, is listed in Table 1. Eb,1 is the binding energy corresponding to the E1,1 excitation, and Eb,2 is the binding energy corresponding to the E2,2 excitation.
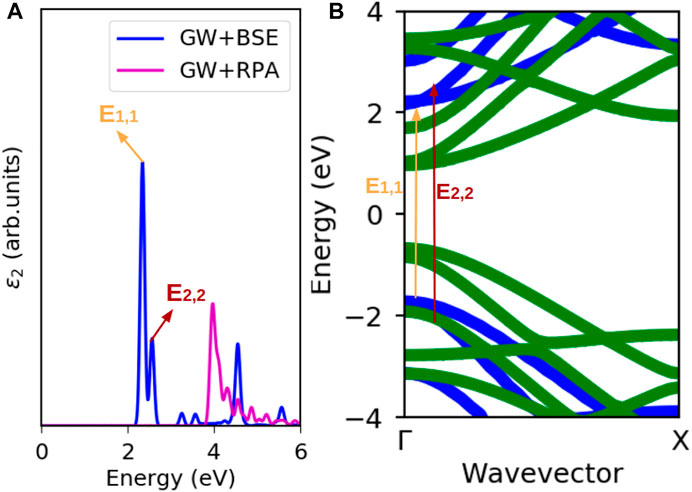
FIGURE 5. Excitations in a 7-AGNR. (A) Absorption spectra of 7-AGNR. (B) GW band structure of 7-AGNR. E1,1 is the excitation from highest valence band to lowest conduction band and E2,2 is the excitation from second highest valence band to second lowest conduction band.
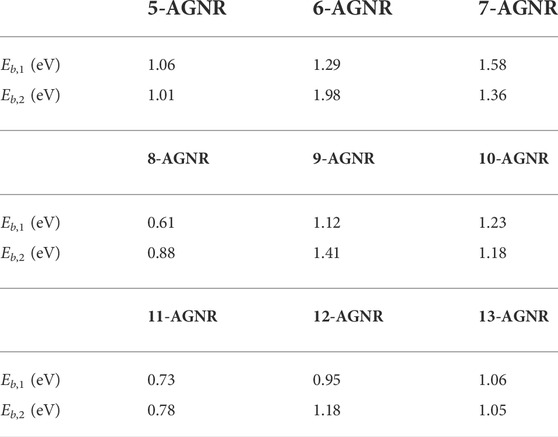
TABLE 1. Exciton binding energy.
The E1,1 exciton wavefunctions in the 3n + 1 (7-AGNR), 3n + 2 (8-AGNR) and 3n (9-AGNR) families are shown in Figure 6 with blue dots denoting positions of holes. The exciton wavefunctions are Wannier-like and extend fully in the width direction. The exciton wavefunction for the 3n + 2 family is the most delocalized. Because it has the most π-conjugation, the band gap (Figure 2), onset energy in the absorption spectra (Figure 4) and the binding energy (Table 1) of the 3n + 2 family armchair graphene nanoribbons are the smallest. We note that this result is also consistent with Clar’s aromatic sextet rule (Clar, 1972), which represents the delocalization of pi electrons due to the resonance of complementary, hexagonal carbon configurations with alternating single and double bonds. Wassmann et al. (Wassmann et al., 2010) compared Clar’s rule for graphene nanoribbons to DFT simulations and showed that the 3n + 2 family exhibits consistently high pi delocalization.
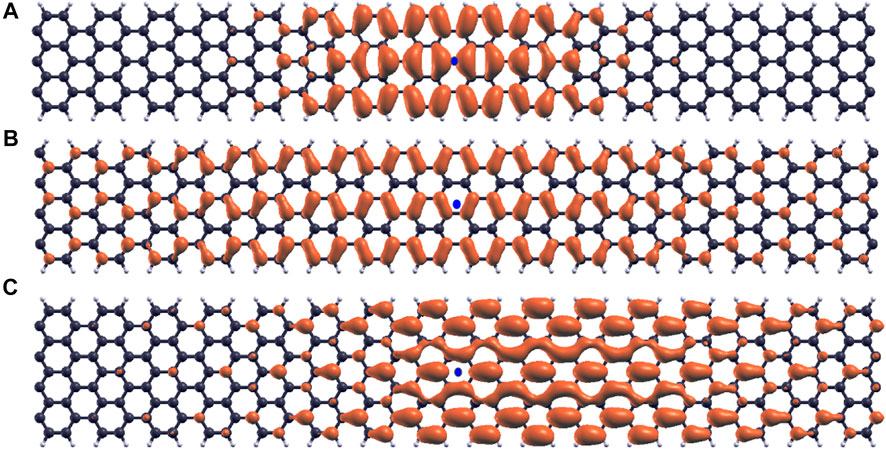
FIGURE 6. Exciton wavefunctions. (A) E1,1 exciton wavefunctions for 7-AGNR. (B) E1,1 exciton wavefunctions for 8-AGNR. (C) E1,1 exciton wavefunctions for 9-AGNR.
Figure 7 shows the absorptivity of single-layer armchair graphene nanoribbons along the ribbon axis for the 3n, 3n + 1 and 3n + 2 families. Increasing nanoribbon width causes a red shift in incident photon energies, and this shift is most significant for the 3n family. The absorptivity spectrum exhibits a similar shape as the imaginary part of the dielectric function in Figure 4.
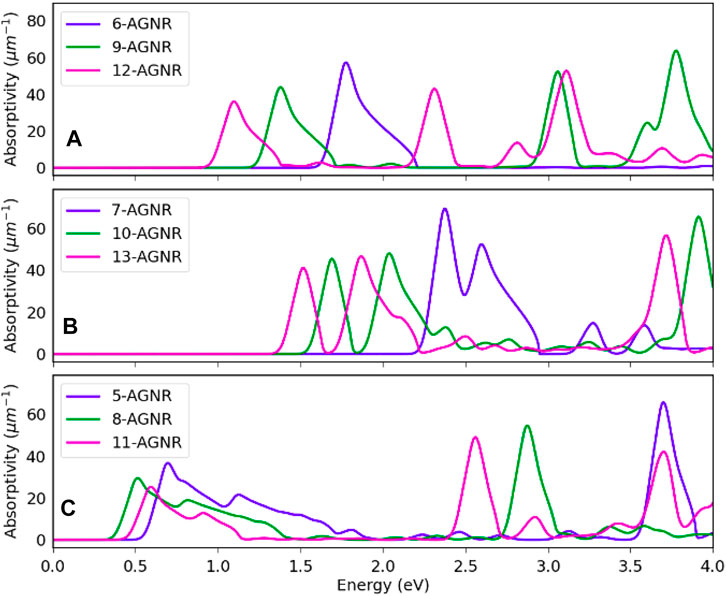
FIGURE 7. Absorptivity of single layer armchair graphene nanoribbons. (A) Absorptivity of the 3n family nanoribbons. (B) Absorptivity of the 3n + 1 family nanoribbons. (C) Absorptivity of the 3n + 2 family nanoribbons.
We consider two different alignments of Bernal stacked bilayer graphene: the α alignment and the β alignment as shown in Figure 8. In the α alignment, one layer of graphene nanoribbon is shifted along the ribbon axis (periodic direction) with the edges aligned to the other layer while in the β alignment one layer of graphene nanoribbon is shifted along both the ribbon axis and the width direction. LDA predicts that the interlayer distances in the α and β alignments of 5-AGNR are 3.36 Å and 3.30 Å, respectively, matching experimental values of the interlayer distance in graphene nanoribbons (Enoki et al., 2007). Both the α and β alignments are stable structures with a ground-state energy difference less than 0.01 Ry between the two alignments.
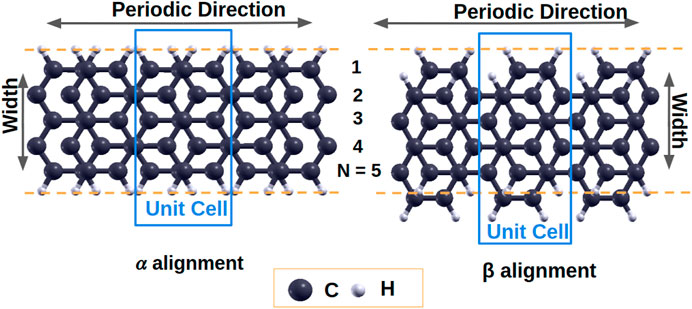
FIGURE 8. Bilayer armchair graphene nanoribbons α and β alignments.
We have calcuated the electronic structures of bilayer 5-AGNR, 6-AGNR and 7-AGNR ribbons for both the α and β alignments within the GW approximation. Figure 9 provides a comparison of band gaps of single-layer and bilayer graphene nanoribbons. Single-layer armchair graphene nanoribbons have the largest band gaps compared to the bilayer conterparts, and the bilayer α alignment nanoribbons have the smallest band gaps for all three families. The difference in band gaps for the bilayer α and β alignments decreases with width, and the difference becomes negligible as the width goes into infinity because the nanoribbons in both alignments become Bernal-stacked bilayer graphene.
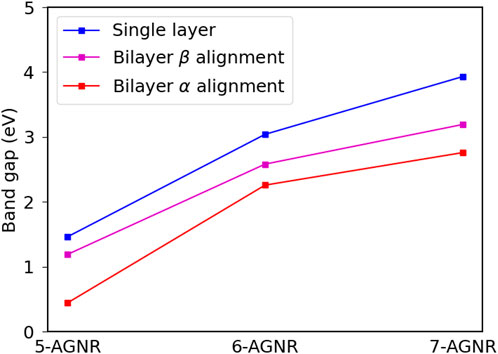
FIGURE 9. Comparison of band gaps of single layer, bilayer α and bilayer β armchair graphene nanoribbons.
The dielectric functions with the GW + BSE approximation for the single-layer, bilayer α alignment, and bilayer β alignment configurations are shown in Figure 10. For all three families considered, the single-layer armchair graphene nanoribbons have the highest onset absorption energy. Adding an extra layer of graphene nanoribbon shifts the absorption peaks to lower photon energies.
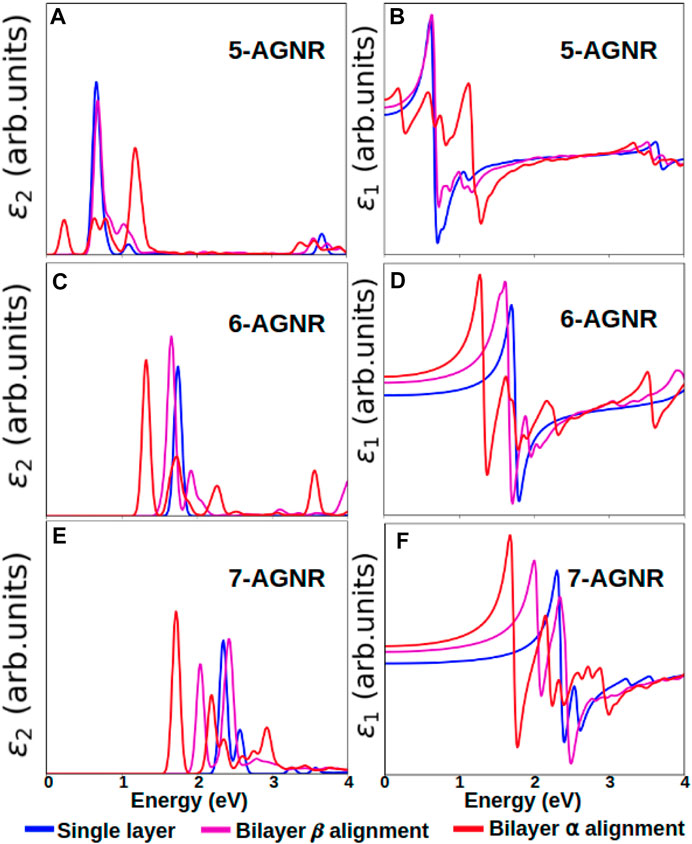
FIGURE 10. Comparison of the imaginary and the real parts of dielectric functions of single layer, bilayer α alignment and bilayer β alignment armchair graphene nanoribbons. Imaginary and real part of the dielectric function for (A,B) 5-AGNR, (C,D) 6-AGNR and (E,F) 7-AGNR. Blue lines denote single layer nanoribbons, magenta lines denote bilayer β alignment nanoribbons, and red lines denote bilayer α alignment nanoribbons.
Not only do the energy peaks shift to lower energies, the shapes of absorption curves also differ from those of single-layer graphene nanoribbons. More oscillations and peaks occur in the dielectric functions of bilayer graphene nanoribbons. Bilayer α alignment nanoribbons have lower onset absorption energies than β alignment nanoribbons. The difference in dielectric functions between α alignment and β alignment nanoribbons is larger for 5-AGNR (Figures 10A,B) than for 6-AGNR (Figure 10C,D) and 7-AGNR (Figures 10E,F), agreeing with the trend of band gaps shown in Figure 9. For the 5-AGNR, the onset energy of the bilayer β alignment is closer to the onset energy of the single-layer configuration instead of the α alignment, as shown in Figures 10A,B.
The calculated absorptivities of the single-layer, the bilayer α and the bilayer β armchair graphene nanoribbons (Figure 11) display similar trends to the band gaps and dielectric functions predicted in Figure 9 and Figure 10. The bilayer α alignment has the lowest photon incident energy, while the single-layer configuration has the highest. The trend observed in the single layer armchair graphene nanoribbons that the 3n + 2 family nanoribbons have the lowest band gaps and onset absorption energies while the 3n + 1 family nanoribbons have the highest band gaps and onset absorption energies is preserved in bilayer graphene nanoribbons and is not affected by the number of layers or two alignments between layers.
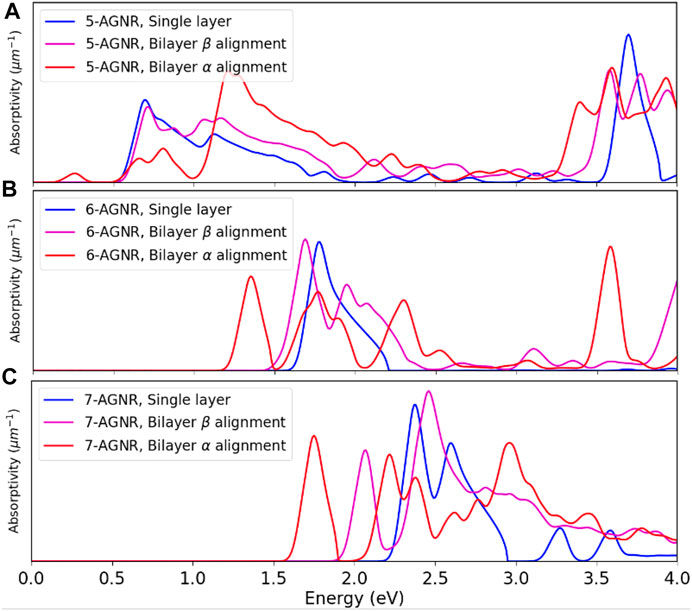
FIGURE 11. Comparison of absorptivities of single layer, bilayer α and bilayer β armchair graphene nanoribbons. (A) Absorptivities of 5-AGNR. (B) Absorptivities of 6-AGNR. (C) Absorptivities of 7-AGNR.
The E1,1 exciton wavefunctions for the single-layer, bilayer α alignment and bilayer β alignment 7-AGNR are shown in Figure 12. The exciton wavefunction in the single-layer configuration is the most localized, and the electrons are distributed around atoms near the hole region, as shown in Figure 12A. The exciton wavefuntion in the bilayer α alignment 7-AGNR extends the most along the ribbon axis as shown in Figure 12B, resulting in the smallest band gaps and onset photon energies compared with the single-layer configuration and bilayer β alignment.
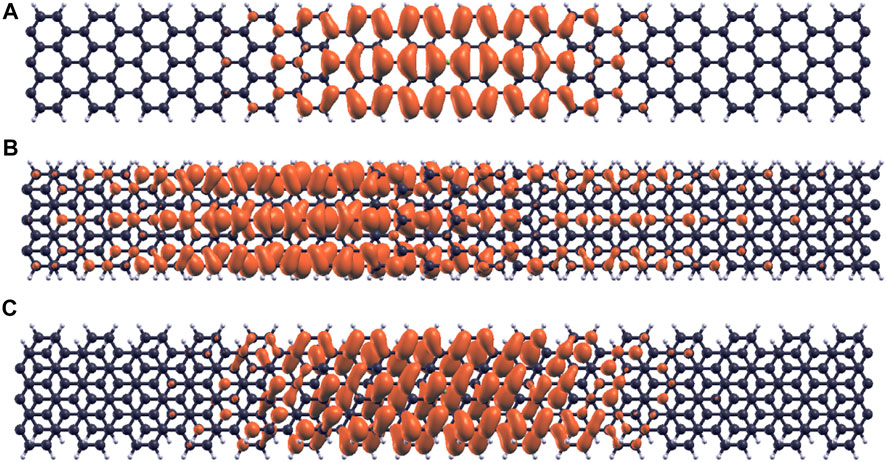
FIGURE 12. Comparison of E1,1 exciton wavefunctions in single layer, bilayer α and bilayer β 7-AGNR. (A) E1,1 exciton wavefunction in single layer 7-AGNR. (B) E1,1 exciton wavefunction in bilayer α 7-AGNR. (C) E1,1 exciton wavefunction in bilayer β 7-AGNR.
This work reports optical response methods and calculations for single-layer armchair graphene nanoribbons of different widths from three families: the 3n, 3n + 1 and 3n + 2 families. Increasing the width of nanoribbons from any family decreases band gaps and causes a redshift in the dielectric functions and the absorptivity spectra. A comparison of exciton wavefunctions in the representatives (7-AGNR, 8-AGNR and 9-AGNR) of graphene nanoribbons from three families has shown that the 3n + 2 family exhibits the most delocalized electron distributions with fixed hole positions, and the most π-conjugation results in the smallest band gaps and lowest onset photon absorption energies among the three families.
We have also compared the optical response of single-layer armchair graphene nanoribbons to bilayer armchair graphene nanoribbons of α and β alignments. Band gaps and onset photon absorption energies are reduced in the bilayer configuration, and the reduction is more significant for the α alignment nanoribbons. The difference between the α and β alignment becomes smaller as nanoribbon width increases.
The optical response of graphene nanoribbons depends significantly on the details of the nanoribbons structures. By varying the width, number of layers and the edge alignment, the absorption spectra could be tuned, making graphene nanoribbon an excellent candidate for engineering optoelectronic devices with tunable properties. Graphene nanoribbons are supported by substrates in experiments, and experience screening effects from the substrates (Qiu et al., 2017; Trolle et al., 2017). Future work should focus on corrections of electron self-energies to account for such screening effects.
The raw data that supports the findings of this study are available from the corresponding authors upon reasonable request.
YG and TF contributed to conception and design of the study. YG performed the computational simulations and related analyses, including generation of data visualations. TF provided resources and supervision for the work. YG wrote the first draft of the manuscript, and TF edited subsequent drafts of the manuscript. All authors read and contributed to manuscript revisions, and approved the submitted version.
This work used the Extreme Science and Engineering Discovery Environment (XSEDE), which is supported by National Science Foundation grant number ACI-1548562 and computational and storage services associated with the Hoffman2 Shared Cluster provided by UCLA Institute for Digital Research and Education’s Research Technology Group.
The authors thank Professors Yongjie Hu, Jaime Marian, and Jayathi Murthy of UCLA’s Samueli School of Engineering and Applied Science for providing valuable guidance as members of YG’s doctoral dissertation committee.
TF is co-founder of a company (SolGrapH Inc.) that is involved with solar-thermal material synthesis.
The remaining author declares that the research was conducted in the absence of any commercial or financial relationships that could be construed as a potential conflict of interest.
All claims expressed in this article are solely those of the authors and do not necessarily represent those of their affiliated organizations, or those of the publisher, the editors and the reviewers. Any product that may be evaluated in this article, or claim that may be made by its manufacturer, is not guaranteed or endorsed by the publisher.
Alghfeli, A., and Fisher, T. S. (2022). High-quality AB bilayer graphene films by direct solar-thermal chemical vapor deposition. ChemRxiv. Cambridge Open Engage preprint. doi:10.26434/chemrxiv-2022-grc1b
Bronner, C., Gerbert, D., Broska, A., and Tegeder, P. (2016). Excitonic states in narrow armchair graphene nanoribbons on gold surfaces. J. Phys. Chem. C 120, 26168–26172. doi:10.1021/acs.jpcc.6b10834
De Corato, M., Cocchi, C., Prezzi, D., Caldas, M. J., Molinari, E., and Ruini, A. (2014). Optical properties of bilayer graphene nanoflakes. J. Phys. Chem. C 118, 23219–23225. doi:10.1021/jp504222m
Denk, R., Hohage, M., Zeppenfeld, P., Cai, J., Pignedoli, C. A., Söde, H., et al. (2014). Exciton-dominated optical response of ultra-narrow graphene nanoribbons. Nat. Commun. 5, 4253–4257. doi:10.1038/ncomms5253
Deslippe, J., Samsonidze, G., Strubbe, D. A., Jain, M., Cohen, M. L., and Louie, S. G. (2012). Berkeleygw: A massively parallel computer package for the calculation of the quasiparticle and optical properties of materials and nanostructures. Comput. Phys. Commun. 183, 1269–1289. doi:10.1016/j.cpc.2011.12.006
Enoki, T., Kobayashi, Y., and Fukui, K. I. (2007). Electronic structures of graphene edges and nanographene. Int. Rev. Phys. Chem. 26, 609–645. doi:10.1080/01442350701611991
Ge, Y., and Fisher, T. S. (2020). Photoconductivity calculations of bilayer graphene from first principles and deformation-potential approach. Phys. Rev. B 101, 235429. doi:10.1103/physrevb.101.235429
Giannozzi, P., Baroni, S., Bonini, N., Calandra, M., Car, R., Cavazzoni, C., et al. (2009). Quantum espresso: A modular and open-source software project for quantum simulations of materials. J. Phys. Condens. Matter 21, 395502. doi:10.1088/0953-8984/21/39/395502
Ho, Y., Wu, J., Chiu, Y., Wang, J., and Lin, M. F. (2010). Electronic and optical properties of monolayer and bilayer graphene. Phil. Trans. R. Soc. A 368, 5445–5458. doi:10.1098/rsta.2010.0209
Hohenberg, P., and Kohn, W. (1964). Inhomogeneous electron gas. Phys. Rev. 136, B864–B871. doi:10.1103/physrev.136.b864
Huang, B. L., Chuu, C. P., and Lin, M. F. (2019). Asymmetry-enriched electronic and optical properties of bilayer graphene. Sci. Rep. 9, 859–912. doi:10.1038/s41598-018-37058-9
Kohn, W., and Sham, L. J. (1965). Self-consistent equations including exchange and correlation effects. Phys. Rev. 140, A1133–A1138. doi:10.1103/physrev.140.a1133
Li, Q., Guo, B., Yu, J., Ran, J., Zhang, B., Yan, H., et al. (2011). Highly efficient visible-light-driven photocatalytic hydrogen production of cds-cluster-decorated graphene nanosheets. J. Am. Chem. Soc. 133, 10878–10884. doi:10.1021/ja202545410884
Narita, A., Feng, X., Hernandez, Y., Jensen, S. A., Bonn, M., Yang, H., et al. (2014). Synthesis of structurally well-defined and liquid-phase-processable graphene nanoribbons. Nat. Chem. 6, 126–132. doi:10.1038/nchem.1819
Ogawa, S., Shimatani, M., Fukushima, S., Okuda, S., Kanai, Y., Ono, T., et al. (2019). Broadband photoresponse of graphene photodetector from visible to long-wavelength infrared wavelengths. Opt. Eng. 58, 057106.
Perdew, J. P., and Wang, Y. (1992). Accurate and simple analytic representation of the electron-gas correlation energy. Phys. Rev. B 45, 13244–13249. doi:10.1103/physrevb.45.13244
Prezzi, D., Varsano, D., Ruini, A., Marini, A., and Molinari, E. (2008). Optical properties of graphene nanoribbons: The role of many-body effects. Phys. Rev. B 77, 041404. doi:10.1103/physrevb.77.041404
Qiu, D. Y., da Jornada, F. H., and Louie, S. G. (2017). Environmental screening effects in 2d materials: Renormalization of the bandgap, electronic structure, and optical spectra of few-layer black phosphorus. Nano Lett. 17, 4706–4712. doi:10.1021/acs.nanolett.7b01365
Salpeter, E. E., and Bethe, H. A. (1951). A relativistic equation for bound-state problems. Phys. Rev. 84, 1232–1242. doi:10.1103/physrev.84.1232
Son, Y. W., Cohen, M. L., and Louie, S. G. (2006). Energy gaps in graphene nanoribbons. Phys. Rev. Lett. 97, 216803. doi:10.1103/physrevlett.97.216803
Trolle, M. L., Pedersen, T. G., and Véniard, V. (2017). Model dielectric function for 2d semiconductors including substrate screening. Sci. Rep. 7, 39844–39849. doi:10.1038/srep39844
Wassmann, T., Seitsonen, A. P., Saitta, A. M., Lazzeri, M., and Mauri, F. (2010). Clar’s theory, ?-electron distribution, and geometry of graphene nanoribbons. J. Am. Chem. Soc. 132, 3440–3451. doi:10.1021/ja909234y
Wright, A., Cao, J., and Zhang, C. (2009). Enhanced optical conductivity of bilayer graphene nanoribbons in the terahertz regime. Phys. Rev. Lett. 103, 207401. doi:10.1103/physrevlett.103.207401
Xia, F., Mueller, T., Lin, Ym, Valdes-Garcia, A., and Avouris, P. (2009). Ultrafast graphene photodetector. Nat. Nanotechnol. 4, 839–843.
Xie, C., Jie, J., Nie, B., Yan, T., Li, Q., Lv, P., et al. (2012). Schottky solar cells based on graphene nanoribbon/multiple silicon nanowires junctions. Appl. Phys. Lett. 100, 193103. doi:10.1063/1.4711205
Yang, L., Cohen, M. L., and Louie, S. G. (2007). Excitonic effects in the optical spectra of graphene nanoribbons. Nano Lett. 7, 3112–3115. doi:10.1021/nl0716404
Yang, L., Park, C. H., Son, Y. W., Cohen, M. L., and Louie, S. G. (2007). Quasiparticle energies and band gaps in graphene nanoribbons. Phys. Rev. Lett. 99, 186801. doi:10.1103/physrevlett.99.186801
Yang, N., Zhai, J., Wang, D., Chen, Y., and Jiang, L. (2010). Two-dimensional graphene bridges enhanced photoinduced charge transport in dye-sensitized solar cells. ACS Nano 4, 887–894. doi:10.1021/nn901660v
Yu, J., Zhong, J., Kuang, X., Zeng, C., Cao, L., Liu, Y., et al. (2020). Dynamic control of high-range photoresponsivity in a graphene nanoribbon photodetector. Nanoscale Res. Lett. 15, 124–129. doi:10.1186/s11671-020-03352-7
Yu, X., Dong, Z., Yang, J. K., and Wang, Q. J. (2016). Room-temperature mid-infrared photodetector in all-carbon graphene nanoribbon-c 60 hybrid nanostructure. Optica 3, 979–984.
Zhang, H., Lv, X., Li, Y., Wang, Y., and Li, J. (2010). P25-graphene composite as a high performance photocatalyst. ACS Nano 4, 380–386. doi:10.1021/nn901221k
Zhang, Y., Liu, T., Meng, B., Li, X., Liang, G., Hu, X., et al. (2013). Broadband high photoresponse from pure monolayer graphene photodetector. Nat. Commun. 4, 1811–11. doi:10.1038/ncomms2830
Keywords: graphene nanoribbons, density functional theory, photodetection, optical response, Bethe–salpeter equation
Citation: Ge Y and Fisher TS (2022) First-principles calculations of the optical response of single-layer and bilayer armchair graphene nanoribbons. Front. Nanotechnol. 4:999292. doi: 10.3389/fnano.2022.999292
Received: 20 July 2022; Accepted: 22 August 2022;
Published: 17 October 2022.
Edited by:
Muhammad Fahad Ehsan, Northeastern University, United StatesReviewed by:
Marcin Maździarz, Polish Academy of Sciences, PolandCopyright © 2022 Ge and Fisher. This is an open-access article distributed under the terms of the Creative Commons Attribution License (CC BY). The use, distribution or reproduction in other forums is permitted, provided the original author(s) and the copyright owner(s) are credited and that the original publication in this journal is cited, in accordance with accepted academic practice. No use, distribution or reproduction is permitted which does not comply with these terms.
*Correspondence: Timothy S. Fisher, dHNmaXNoZXJAdWNsYS5lZHU=
Disclaimer: All claims expressed in this article are solely those of the authors and do not necessarily represent those of their affiliated organizations, or those of the publisher, the editors and the reviewers. Any product that may be evaluated in this article or claim that may be made by its manufacturer is not guaranteed or endorsed by the publisher.
Research integrity at Frontiers
Learn more about the work of our research integrity team to safeguard the quality of each article we publish.