 Sashikanta Prusty
 Srikanta Patnaik1
95% of researchers rate our articles as excellent or good
Learn more about the work of our research integrity team to safeguard the quality of each article we publish.
Find out more
ORIGINAL RESEARCH article
Front. Nanotechnol. , 19 August 2022
Sec. Biomedical Nanotechnology
Volume 4 - 2022 | https://doi.org/10.3389/fnano.2022.972421
This article is part of the Research Topic Advances in Nanotechnology for Bioimaging and Medical Imaging Applications View all 4 articles
Cancer is the unregulated development of abnormal cells in the human body system. Cervical cancer, also known as cervix cancer, develops on the cervix’s surface. This causes an overabundance of cells to build up, eventually forming a lump or tumour. As a result, early detection is essential to determine what effective treatment we can take to overcome it. Therefore, the novel Machine Learning (ML) techniques come to a place that predicts cervical cancer before it becomes too serious. Furthermore, four common diagnosis testing namely, Hinselmann, Schiller, Cytology, and Biopsy have been compared and predicted with four common ML models, namely Support Vector Machine (SVM), Random Forest (RF), K-Nearest Neighbors (K-NNs), and Extreme Gradient Boosting (XGB). Additionally, to enhance the better performance of ML models, the Stratified k-fold cross-validation (SKCV) method has been implemented over here. The findings of the experiments demonstrate that utilizing an RF classifier for analyzing the cervical cancer risk, could be a good alternative for assisting clinical specialists in classifying this disease in advance.
Cervical cancer is the world’s second-deadliest malignancy, after breast cancer that often affects all women over the age of 30. A lengthy infection with particular strains of the Human Papillomavirus (HPV) causes this disease. HPV is generally transmitted sexually and is responsible for the majority of cervical cancer cases these days (Ghanaat et al., 2021; Thomsen et al., 2021; Xing et al., 2021). There are over 100 distinct HPV strains. Cervical cancer is caused by only a few varieties. HPV-16 and HPV-18 are the two most frequent kinds that cause cancer. However, infection with the high-risk HPV type 16 causes a maximum probability of cancer. The virus that infects cystitis is the same one that causes genital warts. Additionally, this virus is transmitted from one person to another during sexual intercourse so quickly these days. Many women with cervical cancer are unaware they have the disease until it is advanced since symptoms usually do not appear until the disease is advanced. When symptoms do occur, they are frequently misdiagnosed as common diseases such as menstrual cycles and urinary tract infections (UTIs).
Furthermore, this cancer can be successfully treated if detected early. Although, the recent advancement of using the Pap smear test in healthcare firms helps in diagnosing cervical cancer more effectively these days (Basak et al., 2021; Chitra and Kumar, 2021). This can be taken place by doctors, collecting a sample of cells from the surface of the cervix in women. These cells are then sent to a lab for precancerous or cancerous alterations to be screened. However, the recent survey in countries like America, and Thailand have found that screening might be able to detect and treat abnormalities in cells before they grow into cancer, and can often avoid it (Antinyan et al., 2021; Ploysawang et al., 2021). Although, the abnormal growth in the cervix area goes through four stages to form cancer, which might be diagnosed by doctors as per the concern. The stage indicates whether or not cancer has spread and, if so, then concerning physicians can assist the patient in determining the best therapy to overcome it. Treatments like surgery, radiation therapy, chemotherapy, and targeted therapy are the four most common these days. Figure 1, shows the normal and abnormal views for cervix histogram images as follows:
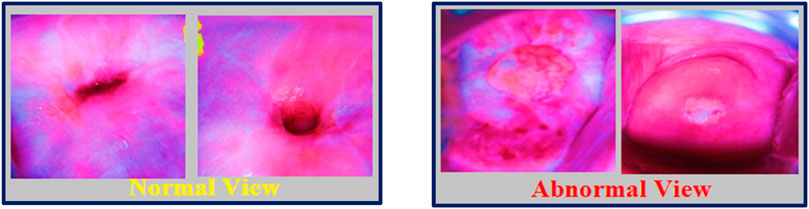
FIGURE 1. Normal and Abnormal view of cervix histogram images.
However, healthcare data has a substantial number of imbalances in the target class distribution: more negative samples than positive ones. Additionally, as there are huge chances of having such types of negative samples, a technique called Stratified K-Fold Cross-Validation (SKCV) has been proposed here, to ensure that relative class frequencies are effectively sustained in each train and validation fold when using stratified sampling rather than random sampling. It is mostly used for classification problems. This method uses stratified sampling, which divides the cervical cancer data set (collected from the Kaggle repository) into k groups, or folds, of nearly similar size. The use of randomized subsets of data in cross-validation, also known as k-fold cross-validation, is a strong way to test the success rate of models used for classification in healthcare organizations (Marcot and Hanea, 2021). Furthermore, CV is a resampling technique used to evaluate ML models on a limited sample of data or unknown data that would help to make predictions on data that was not used during training.
The rest of the paper is laid out as follows. Section 2, includes the literature survey that has been carried out during this research work. Section 3, explains the background study for our research. Section 4, provides the concept, applies it to four different types of ML classifiers, and gives a comprehensive examination of four different diagnosis testing procedures, demonstrating that SKCV is effective. Section 5, discuss the critical analysis of our result, and finally Section 6, concludes with research work for the future.
Although cervical cancer screening rates in the United States are typically high, there are discrepancies in screening and surveillance among particular groups. Difficulty dealing with the healthcare system, as well as financial and logistical difficulties, all seem to be bend barriers to screening. To enhance screening rates for all under-screened groups, solutions to these impediments are required (Fuzzell et al., 2021). According to Canadian Community Health Survey (CCHS) for evaluating the various health habits among Canadians, including the use of cancer screening tests, to determine whether there are any inequalities among the different communities in Canada (Government of Canada, 2020). The majority of women over the age of 65 in the United Kingdom have never received a human papillomavirus test (HPV). Approximately 5,000 of these 6.5 million women will die of cervical cancer in the next 35 years, based on current patterns (Peto et al., 2004). These days in many countries, including the United Kingdom, HPV testing for cervical cancer screening has been considered the primary screening for healthcare firms. A country like Australia has set the upper age limit to 74 for all women in case of cervical cancer screening and Denmark, offered HPV tests to all women born before 1948 (Australian_Government, 2020). In England, however, where half of all cervical cancer fatalities now occur in women aged 65 and up, screening is still halted at that age (Andersen et al., 2019). A study was conducted in Riau Province, Indonesia, to investigate the prevalence of oncogenic HPV in cervical cancer patients as well as the clinical manifestations of HPV in cervical cancer patients. The results revealed that 86 of 110 women (78.1%) tested positive for HPV, with HPV 16 being the most common genotype (38.2 percent) (Gilham et al., 2021). Between 2015 and 2017, individual data from a countrywide cervical cancer screening program in rural China were collected. The researchers looked at 1,160,981 women aged 35 to 64 who received either cytology alone or high-risk HPV testing plus cytology or genotyping triage (Savira et al., 2022). Regardless of age, income, or country of residence, women found HPV self-sampling to be extremely acceptable. Individual customer choices for the self-sampling device, technique, and setting can greatly assist the development of new and extended HPV screening initiatives. The cervical swab was the most widely used and widely approved HPV DNA sampling method (Zhao et al., 2021). A DoS detection system based on a machine learning method for DAR-ML (Dynamic Secure Aware Routing by Machine Learning) would aid in the resolution of healthcare data (Nishimura et al., 2021). An extremely efficient CAD system accompanied by intelligence learning models uses ML-based feature modeling to increase predictive performance (Sengan et al., 2022). Visual anomaly detection is a crucial and difficult subject in ML and Computer Vision. As a result, a survey is needed to explore and determine the underlying concepts and assumptions for it. Image reconstruction and feature modeling are prerequisites for pixel-level visual anomaly detection, allowing researchers to draw conclusions from existing methodologies and explore new research avenues (Hsu et al., 2021).
Any technology that may deliver a more efficient, meaningful, and quick analysis to provide a suitable treatment plan on time is quite effective when it comes to human lives and health. Artificial Intelligence (AI), especially its subset Machine Learning (ML), is currently conquering the globe. Generally, when an ML model has been designed, more importantly, the data has been fed into it for the training. After that, we feed the model with test data to check how well it performs and how well it generalizes to new data. However, the model will only be stable if it works well on unknown data, is consistent, and can predict with high accuracy on a wide range of input data. But this is not always the case as ML models are not always stable, so we must assess their stability. CV comes on the scene at this point that can help to overcome over-fitting issues.
However, by partitioning the crucial data into three sets, the number of samples that can be utilized to train the model is significantly reduced, and the outcomes can sometimes be affected by a random selection of the (train, validation) sets. A process known as CV is a solution to this problem, in which only the test set is required for final evaluation, not the validation set (Herland et al., 2019; Kaushik et al., 2021; de Hond et al., 2022). Figure 2, specifies the basic steps that a CV technique follows:
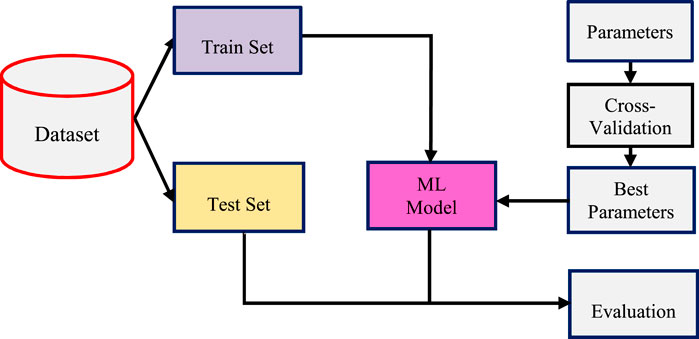
FIGURE 2. Process design for cross-validation (CV).
However, in the CV technique, the evaluation may differ greatly depending on how well the partition among the train set and test set is made. Thus, K-fold CV is one of the most preferably used and efficient methods that come to take place over CV (Drokow et al., 2021; Parraga et al., 2021).
The biggest advantage of using the K-Fold CV technique is that it does not care about how the data is divided (Bhatt et al., 2021). In the test set, every data point appears exactly once, but in the training set, it appears ‘k-1′ times. This k-fold CV technique follows some basic steps:
However, the fundamental disadvantage of this strategy is that the training algorithm may have been repeated k times from the start, indicating that evaluating it would take k times as long. To avoid this problem, a stratified approach with K-fold CV has been introduced over K-fold CV (Tanimu et al., 2021). This guarantees that each fold of the dataset contains the same proportion of observations with each label. It is, however, an enhanced version of the K-Fold approach (Allen et al., 2021). As a result, the Stratified K-Fold technique is preferred over K-Fold which deals with classification problems with unbalanced class distributions. This CV object returns stratified folds and is a variant of K-Fold. The folds are achieved by keeping the fraction of samples with each class constant. However, in the coming section, we have proposed a methodology for predicting cervical cancer by applying the SKCV technique to the cervical cancer dataset.
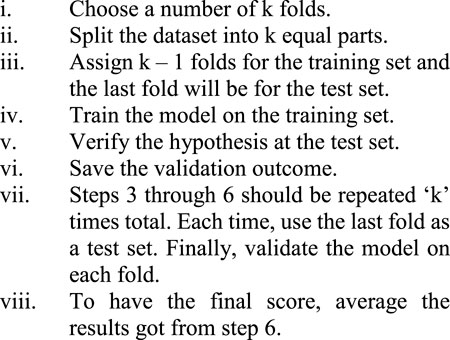
The statistical methods have been employed in the majority of studies thus far to examine the significant influencing factors for cervical cancer. As a result of recent developments in machine learning technology, research works on predicting the risk of cervical cancer has been conducted. The machine learning approach uses extensive links between risk factors to enhance the accuracy of cancer risk prediction. SKCV also includes train/test indices for splitting data into train/test sets. This CV object is a K-Fold variant that produces stratified folds. The folds are created by keeping track of the percentage of samples in each class (Klifto et al., 2021). Our proposed technique as shown in Figure 3, was divided into two major parts: 1) SKCV, and 2) ML classifiers. The seven main stages of this work include data preparation, data preprocessing, balance data via SMOTE(), identification of significant test variables or predictors, model training/building of four classifier models, applying SKCV techniques, and performance evaluation using ROC and PR Curve.
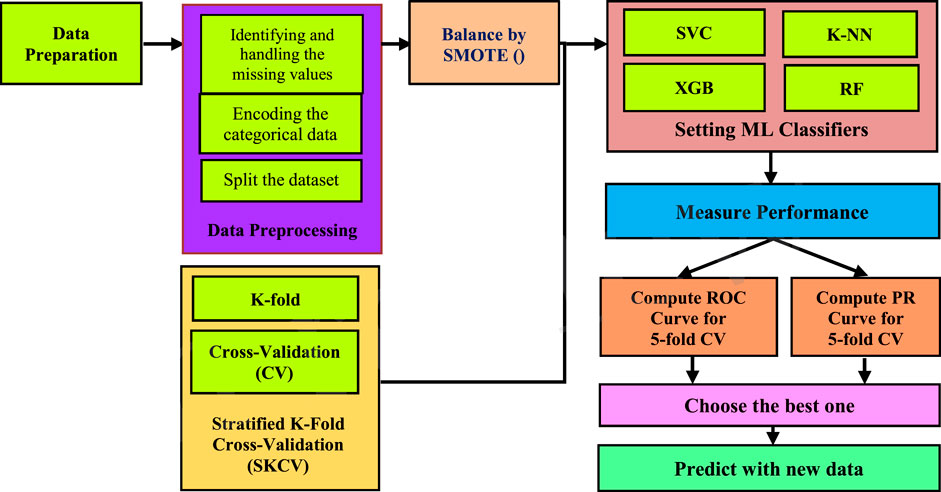
FIGURE 3. Process design for predicting cervical cancer.
Data preparation is the initial stage while building an ML model. In healthcare firms, the image data come along with its complications due to its complexity. Data collection and management, as well as the methods utilized to do so, are very much critical. With such underlying problems, it becomes a highly useful and important part to start with. A solid data preparation strategy enables efficient analysis, limits and decreases processing mistakes and inaccuracies, and makes processed data more accessible to all users. It is a crucial stage before processing that generally includes reformatting the data, correcting changes, and merging multiple data sets to supplement the current data. It is generally thought of as a time-consuming process for healthcare firms, but it is a necessary step in putting data into context so that it may be turned into insights that can aid decision-making while removing bias caused by poor data quality. In this article, we have collected the cervical cancer image dataset from the Kaggle repository that contains 858 individual patient records and 34 important features.
Data from the real world is typically partial, inconsistent, erroneous, and contains missing attributes or values. Therefore, data preprocessing comes in: that cleans, prepares, and organizes raw data so that it may be used in ML models. Pre-processing refers to the alterations done to raw data before it is fed to the algorithm. The process of transforming raw data into a clean data set is often known as data pre-processing. The first step is to eliminate any rows in the dataset that have missing data. Here, it first removes two columns having 787 missing entries and removes those rows with null entries. In further, removes the outliers (i.e., Age > 52, and Number of sexual partners > 8). Thereafter, we define target variables and remove target columns from the data (namely, “Hinselmann”, “Schiller”, “Cytology”, and “Biopsy”). Moreover, converting age (i.e., from 13 to 52) into nine groups where each group contains five consecutive age people. Data normalization is a fundamental step in pre-processing that converts the source data into a more usable format. The main goal is to reduce or eliminate duplicate data in this cervical cancer dataset if it exists. The min-max scaler has been used in this research to normalize this cancer data, which transforms linearly over the original unstructured data. The data is scaled from 0 to 1. However, PowerTransformer () method to normalize the data has been used and accomplished with a pipeline that implements both the fit () and transform () method with the final estimator.
When working with a dataset like here, which is highly imbalanced, one of the most critical steps is to balance the classes. One of the most powerful techniques for the imbalanced dataset is Synthetic Minority Oversampling Technique (SMOTE) which aims at balancing the class distribution by randomly increasing the minority class (Mathews and Seetha, 2022; Sowjanya and Mrudula, 2022). SMOTE is a type of data augmentation technique for increasing the size of a training image dataset deliberately by providing enhanced versions of the images.
In recent decades, evaluating the algorithm’s potential to adapt is a big challenge that demands a lot of attention while developing a model. Moreover, there is a need of developing a robust and accurate deep-learning model. To do so, we’ll need some kind of evaluation approach, or a mechanism to see if our model is functioning properly. One of the tools for evaluating our model is the K-fold as shown in Figure 4 and Figure 5. This technique has been utilized in this article not only to analyze the model but also to calculate the outcomes. A parameter labeled ‘k' determines how many folds the dataset will be divided into K-Fold CV. As a result, each fold in the dataset has an opportunity to be heard (k-1) times in the training set, ensuring that each perspective is included in the dataset and allowing the model to understand the actual performance of the model more efficiently. In most cases, the value of ‘k' is between 5 and 10. Moreover, CV allows the researchers to compare and choose the best model for predicting cervical cancer disease. Additionally, when a CV is used with the stratified sampling method, both the training and test sets have almost the same proportion of the feature with concern as the original dataset (Chauhan and Singh, 2022). Performing this with the target variable guarantees that the CV outcome is a close approximation of the error function. The stratified 5-fold CV method is implemented in this study, that is, similar to k-fold, except for performing stratified sampling rather than random sampling. As a result, the first step is to shuffle and divide the data into five folds.
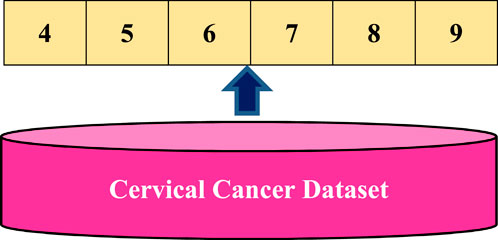
FIGURE 4. Splitting the dataset into 5-folds.
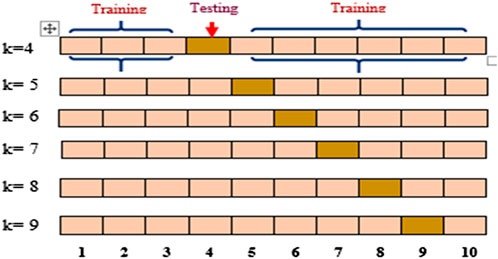
FIGURE 5. Major steps for 5-fold CV.
In each of the k interactions, one fold is utilized for testing and computing the empirical square loss, while the other folds are used to train the model. This allows the researcher to start a new interaction each time that he/she wants to try a different fold. This ensures that each of the ‘k’ components is tested just once. In the further section, two suitable performance evaluation techniques have been taken for interpreting cervical cancer over four ML classifiers.
In disease diagnosis, machine learning frequently outperforms humans. Algorithms are more accurate than radiologists in detecting malignant tumors. In this article, two of the most prominent diagnostic methods namely, ROC and PR Curves are used for interpreting probabilistic predictions for cervical cancer diagnosis as:
The Receiver Operating Characteristic Curve (ROC), is a curve that highlights the model’s binary performance of the classifier on the positive class. In the case of Area under the Curve (AUC), representing the X-axis as False Positive Rate (FPR) and Y-axis as True Positive Rate (TPR). TPR is calculated by dividing the number of true positives (TP) by the total number of TP and false negatives (FN). Whereas, FPR is obtained by dividing the total number of false positives (FP) by the total number of false positives (FP) and true negatives (TN).
However, the following graph represents how well these four models predict correct and incorrect classifications, while predicting cervical cancer from histogram images.
The main goal of the SVC classifier is to fit the data and deliver a “best fit” hyperplane that separates and categorizes our cervical cancer data. The implementation is based on the “libsvm” library, which includes kernel support for LinearSVC. However, SVC can be used to identify cervical cells in pap-smear images so that cancer can be detected (Jusman et al., 2021). A shallow classifier with strong classification abilities (Cubic SVM) (Yaman and Tuncer, 2022). The cervical cancer dataset has been trained with a support vector classifier when the SVC () method has been called. This SVC () method takes parameters as C (penalty parameter i.e., 1), probability (set to ‘TRUE’), and random_state (set to ‘42′) where the randomness can control with the random_state parameter and the penalty term “C” controls the strength of this penalty. Further, plotting a ROC Curve with the SKCV technique (where, k = 4, 5, 6, 7, 8, 9) for this SVC classifier, that represents the x-axis as the TPR and y-axis as the FPR as shown in Figure 6.
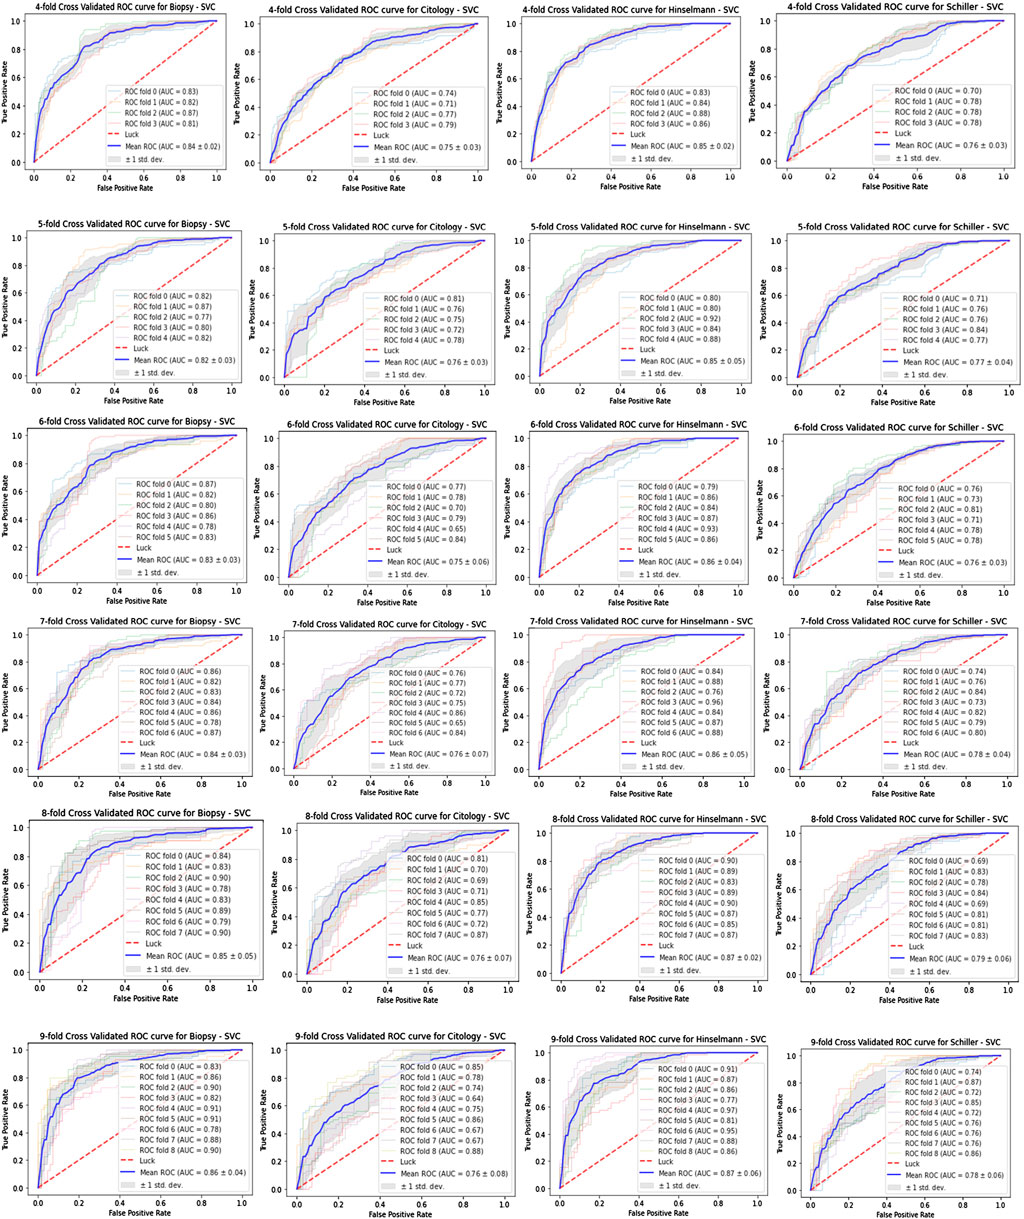
FIGURE 6. ROC curves for SVC.
An RF is a probabilistic predictor that fits many decision tree classifiers and applies a mean to increase the projected accuracy and reduce over-fitting (Alpan, 2021). However, in our work, this classifier takes only one parameter namely, random_state (set to ‘42′), which determines both the randomness of the samples used while creating trees (here, ‘858′) and also looking forward to the best split at each node. Similarly, ROC Curve with the SKCV technique (where, k = 4, 5, 6, 7, 8, 9) for this RF classifier can be designed, where the x-axis represents the TPR and y-axis for FPR. The study shows that RF has a considerable improvement in prediction accuracy, outperforming single classification approaches performed on identical cervical cancer datasets.
KNeighborsClassifier () class from the “sklearn.neighbors” library has been imported here, at the training phase for saving the data and also to classify it. It starts by fitting the k-nearest neighbors using the training dataset and finding the k-neighbors of each point, returning the distances to each point’s neighbors. Finally, for each point in x, it computes the (weighted) graph of k-Neighbors. Similarly, the ROC Curve with the SKCV technique (here, k = 4, 5, 6, 7, 8, 9) for this K-NN classifier can be designed, which represents both the TPR and FPR for the x and y-axis respectively. Cervical cancer using machine learning algorithms such as K-NN has been predicted to aid in early diagnosis (Ilyas, and Ahmad, 2021). KNN is prone to underfitting and overfitting, just like other nonparametric techniques. As a result, cross-validation can be used to select the best k estimate (Zhang et al., 2021).
XGBoost, a scalable tree boosting approach, has been used for cervical cancer risk prediction (Gupta, and Gupta, 2022). The tuned model employs regularization and integrates sparse-aware, and quantile methods to handle missing data (Jha et al., 2021). In this work, “n_estimators” (set to '10'), max depth (set to '5'), “learning_rate” (set to '0.4'), and random state (set to '42') are the four basic parameters. The “n_estimator”, determines the number of boosting stages to run; “max_depth”, controls the number of nodes to use; “learning_rate”; and “random_state”, controls the random permutation of the features at each split. Although, ROC Curve with the SKCV technique (here, k = 4, 5, 6, 7, 8, 9) for this XGB classifier can be designed, where TPR and FPR represents in the x-axis and y-axis respectively. XGB surpasses current state-of-the-art ML models due to its parallel computing capabilities and cluster distribution (Khoulqi and Idrissi, 2021).
PR curve is most useful for the classification problem applied in ML algorithms like cancer prediction. A precision-recall curve, like the ROC curve, plots the precision (y-axis) and recall (x-axis) for various thresholds for SVC model has been designed as shown in Figure 7 in this article as shown. However, the precision (P) is the number of TP divided by the total number of TP and FP, representing the accuracy with which a model predicts the positive class. Whereas, Recall (R) is calculated by dividing the number of TP by the total of both TP and FN.
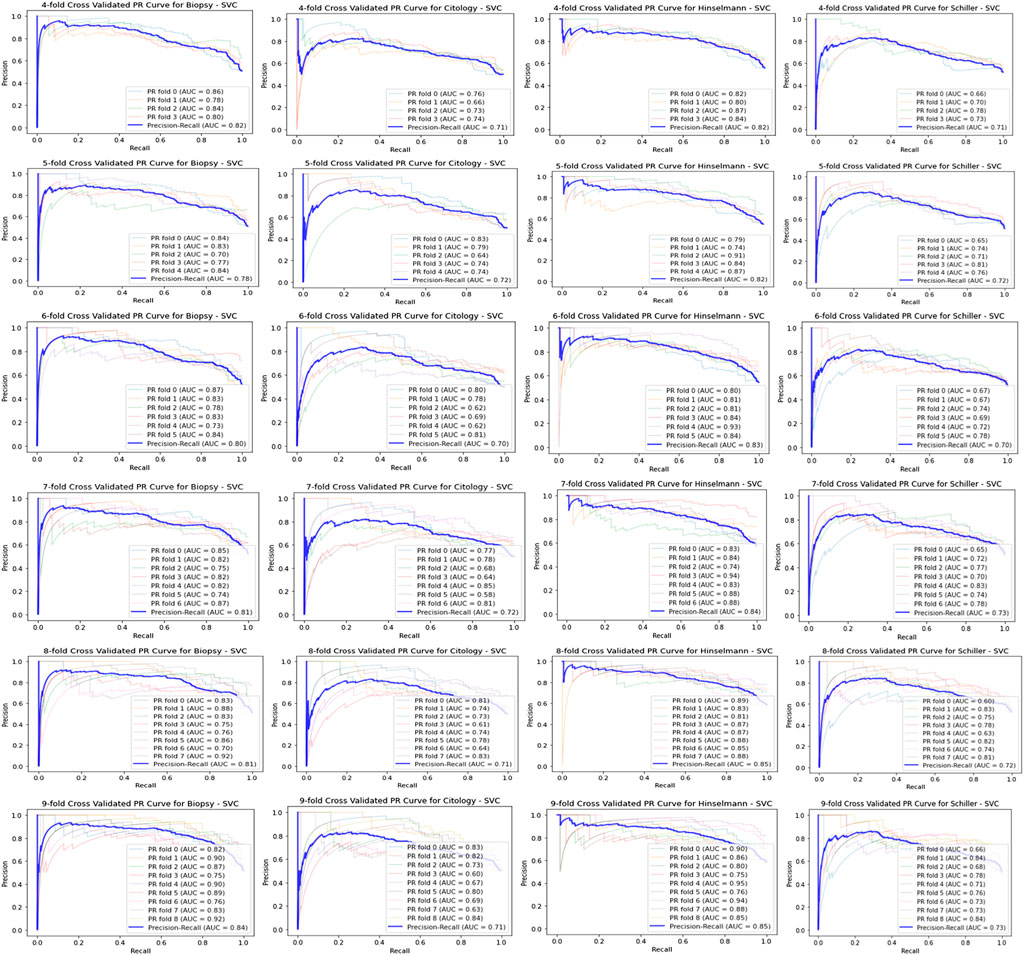
FIGURE 7. PR-Curve for SVC classifier.
Meanwhile, Figure 7 displays the K-fold CV for SVC model on biopsy using PR curve where k = 4, 5, 6, 7, 8, 9. Similarly, we can design PR curve for RF, K-NN, and XGB model as like plotted in Figure 7, representing the precision on y-axis and recall on x-axis for various threshold.
As discussed, the two most specific diagnostics tools ROC and PR curves are used here, to measure the performance of all four models on four target values. The roc_curve () method has been implemented, for designing the ROC curves for all four models, that take the true outcomes (0,1) from the test set as well as the projected probabilities for the 1 class. Alternatively, predicting the probability for each class can be more flexible. The objective of this is to allow the researcher to select and even customize the threshold for interpreting predicted probabilities. Further, the performance score in terms of ROC AUC, and PR for all four models have been depicted in Tables 1 and Table 2.
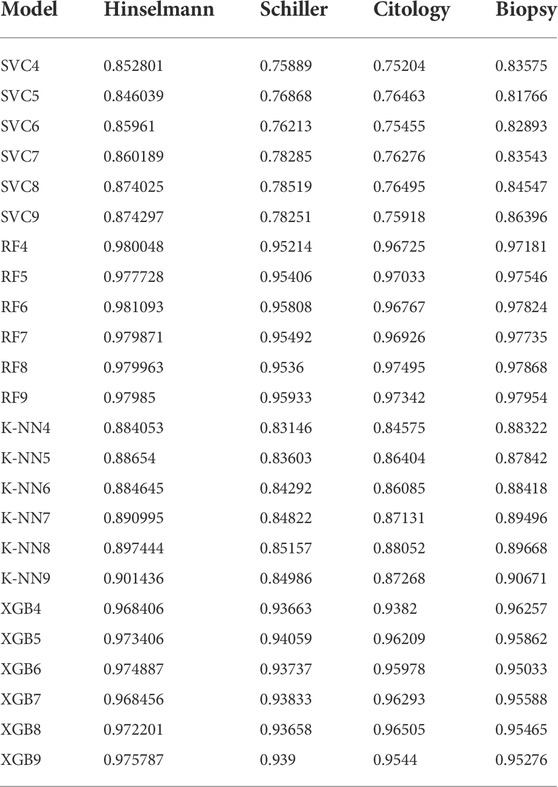
TABLE 1. Depicting ROC AUC scores for four ML classifiers on four diagnosing tools.
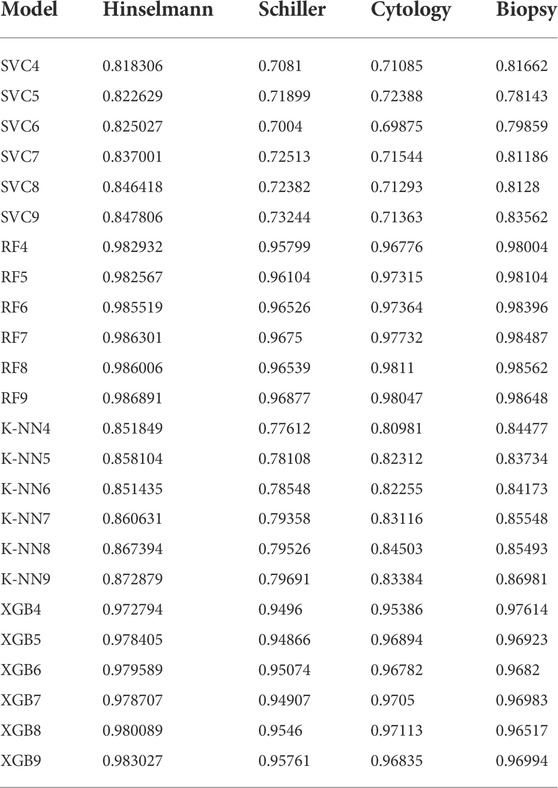
TABLE 2. Depicting Precision-Recall AUC scores for four ML classifiers on four diagnosing tools.
In ML, CV is mostly used to measure how well a model performs on untrained data. That seems to be, using a small sample to determine how well the model will typically perform if used to make predictions on data that was not included during the model’s training. However, it aids in identifying any overfitting challenges caused by training. But, implementing the K-fold CV technique provides an equal opportunity for each data point to include in the test set by dividing it into k equal parts. Thus, it helps in reducing the computational time, bias, and variance when the value for ‘k’ increases. The ratio of the feature of concern is the same across the original data, training set, and test set when the CV technique is used with stratified sampling. This guarantees that neither any value from training nor test sets are over/under-represented, resulting in a somewhat accurate prediction of performance/error. SKCV technique uses train/test indices to partition data into train/test sets, generating test sets with the same, or as near to the distribution of classes as possible. The proportion of the target variables (i.e., Hinselmann, Schiller, Cytology, and Biopsy) are rather consistent across the original data, training set, and test set in all five splits, that have been described in the above findings. Although, in our study, we kept n_splits as ‘5’, partitioning the cervical cancer dataset five times (4–9). Moreover, this model has been separated into five random index sets by using cv. n_splits (CV, the Stratified-FOLD Object). After that, fitted the four models to each test set and calculated an accuracy score. The average of the results obtained in each split is the performance metric supplied by k-fold CV.
This research offered a methodology for automatically detecting cervical cancer and alerting medical experts in time to intervene. The proposed system used stratified k-fold analysis and CV techniques to provide medical practitioners with the data they needed to make better diagnostic decisions. The best performing of four supervised machine learning algorithms was implemented on the proposed framework. This was discovered to be the SKCV strategy for four models to attain a ROC and PR accuracy score on four diagnostic testing instruments in an experiment. Finally, it was discovered that the model RF6 scored 98.10 percent for Hinselmann, 95.80 percent for Schiller, RF8 scored 97.49 percent for Cytology, and RF9 scored 97.95 percent for Biopsy. The most significant contribution of this work is the integration of a more robust cervical cancer prediction model into the SKCV model, which requires minimum patient engagement with the platform. However, the SKCV technique takes a lot of time to execute, but it still does not keep wasting data (due to the lack of a validation test), creating the biggest achievement in applications like inverse inference where the number of samples is minimal. Furthermore, this method can aid us in developing a machine-learning-based model, that is, both reliable and accurate.
The datasets presented in this study can be found in online repositories. The names of the repository/repositories and accession number(s) can be found in the article/Supplementary Material.
Ethical review and approval was not required for the study on human participants in accordance with the local legislation and institutional requirements. Written informed consent for participation was not required for this study in accordance with the national legislation and the institutional requirements. Written informed consent was not obtained from the individual(s) for the publication of any potentially identifiable images or data included in this article.
SaP, SD, and SrP contributed to the conceptual design of this work. SaP has collected the dataset and programmed it to extract the features for predicting cervical cancer using the Jupyter notebook. SaP, SrP, and SD wrote the manuscript and also revised as well carefully. SaP has checked the language of this manuscript using Grammarly software and put this paper in your journal that has been approved by all.
The authors declare that the research was conducted in the absence of any commercial or financial relationships that could be construed as a potential conflict of interest.
All claims expressed in this article are solely those of the authors and do not necessarily represent those of their affiliated organizations, or those of the publisher, the editors and the reviewers. Any product that may be evaluated in this article, or claim that may be made by its manufacturer, is not guaranteed or endorsed by the publisher.
The Supplementary Material for this article can be found online at: https://www.frontiersin.org/articles/10.3389/fnano.2022.972421/full#supplementary-material
Allen, J., Liu, H., Iqbal, S., Zheng, D., and Stansby, G. (2021). Deep learning-based photoplethysmography classification for peripheral arterial disease detection: a proof-of-concept study. Physiol. Meas. 42 (5), 054002. doi:10.1088/1361-6579/abf9f3
Alpan, K. (2021). “Performance evaluation of classification algorithms for early detection of behavior determinant based cervical cancer,” in 2021 5th International Symposium on Multidisciplinary Studies and Innovative Technologies (ISMSIT) (IEEE), 706–710.
Andersen, B., Christensen, B. S., Christensen, J., Ejersbo, D., Heje, H. N., Jochumsen, K. M., et al. (2019). HPV-prevalence in elderly women in Denmark. Gynecol. Oncol. 154 (1), 118–123. doi:10.1016/j.ygyno.2019.04.680
Antinyan, A., Bertoni, M., and Corazzini, L. (2021). Cervical cancer screening invitations in low and middle income countries: evidence from Armenia. Soc. Sci. Med. 273, 113739. doi:10.1016/j.socscimed.2021.113739
Australian_Government (2020). National cervical screening policy. Available at: http://www.cancerscreening.gov.au/internet/screening/publishing.nsf/Content/national- cervical-screening-policy (Accessed September 24, 2020).
Basak, M., Mitra, S., Agnihotri, S. K., Jain, A., Vyas, A., Bhatt, M. L. B., et al. (2021). Noninvasive point-of-care nanobiosensing of cervical cancer as an auxiliary to pap-smear test. ACS Appl. Bio Mat. 4 (6), 5378–5390. doi:10.1021/acsabm.1c00470
Bhatt, A. R., Ganatra, A., and Kotecha, K. (2021). Cervical cancer detection in pap smear whole slide images using convnet with transfer learning and progressive resizing. PeerJ Comput. Sci. 7, e348. doi:10.7717/peerj-cs.348
Chauhan, N. K., and Singh, K. (2022). Performance assessment of machine learning classifiers using selective feature approaches for cervical cancer detection. Wirel. Personal. Commun., 1–32. doi:10.1007/s11277-022-09467-7
Chitra, B., and Kumar, S. S. (2021). Recent advancement in cervical cancer diagnosis for automated screening: a detailed review. J. Ambient. Intell. Humaniz. Comput. 13, 251–269. doi:10.1007/s12652-021-02899-2
de Hond, A. A., Leeuwenberg, A. M., Hooft, L., Kant, I. M., Nijman, S. W., van Os, H. J., et al. (2022). Guidelines and quality criteria for artificial intelligence-based prediction models in healthcare: a scoping review. npj Digit. Med. 5 (1), 2. doi:10.1038/s41746-021-00549-7
Drokow, E. K., Baffour, A. A., Effah, C. Y., Agboyibor, C., Akpabla, G. S., Sun, K., et al. (2021). Building a predictive model to assist in the diagnosis of cervical cancer. Future Oncol. 18 (1), 67–84. doi:10.2217/fon-2021-0767
Fuzzell, L. N., Perkins, R. B., Christy, S. M., Lake, P. W., and Vadaparampil, S. T. (2021). Cervical cancer screening in the United States: challenges and potential solutions for underscreened groups. Prev. Med. 144, 106400. doi:10.1016/j.ypmed.2020.106400
Ghanaat, M., Goradel, N. H., Arashkia, A., Ebrahimi, N., Ghorghanlu, S., Malekshahi, Z. V., et al. (2021). Virus against virus: strategies for using adenovirus vectors in the treatment of HPV-induced cervical cancer. Acta Pharmacol. Sin. 42 (12), 1981–1990. doi:10.1038/s41401-021-00616-5
Gilham, C., Crosbie, E. J., and Peto, J. (2021). Cervical cancer screening in older women. BMJ 372, n280. doi:10.1136/bmj.n280
Government of Canada (2020). Canadian community health survey. Available at: https://www.canada.ca/en/health-canada/services/food-nutrition/food-nutrition-surveillance/health-nutrition-surveys/canadian-community-health-survey-cchs.html (Accessed July 4, 2020).
Gupta, S., and Gupta, M. K. (2022). A comprehensive data-level investigation of cancer diagnosis on Imbalanced data. Comput. Intell. 38 (1), 156–186. doi:10.1111/coin.12452
Herland, M., Bauder, R. A., and Khoshgoftaar, T. M. (2019). The effects of class rarity on the evaluation of supervised healthcare fraud detection models. J. Big Data 6 (1), 21. doi:10.1186/s40537-019-0181-8
Hsu, C. H., Chen, X., Lin, W., Jiang, C., Zhang, Y., Hao, Z., et al. (2021). Effective multiple cancer disease diagnosis frameworks for improved healthcare using machine learning. Measurement 175, 109145. doi:10.1016/j.measurement.2021.109145
Ilyas, Q. M., and Ahmad, M. (2021). An enhanced ensemble diagnosis of cervical cancer: a pursuit of machine intelligence towards sustainable health. IEEE Access 9, 12374–12388. doi:10.1109/access.2021.3049165
Jha, M., Gupta, R., and Saxena, R. (2021). “Cervical cancer risk prediction using XGboost classifier,” in 2021 7th International Conference on Signal Processing and Communication (ICSC) (IEEE), 133–136.
Jusman, Y., Sari, B. P., and Riyadi, S. (2021). “Cervical precancerous classification system based on texture features and support vector machine,” in 2021 1st International Conference on Electronic and Electrical Engineering and Intelligent System (ICE3IS) (IEEE), 29–33.
Kaushik, M., Joshi, R. C., Kushwah, A. S., Gupta, M. K., Banerjee, M., Burget, R., et al. (2021). Cytokine gene variants and socio-demographic characteristics as predictors of cervical cancer: a machine learning approach. Comput. Biol. Med. 134, 104559. doi:10.1016/j.compbiomed.2021.104559
Khoulqi, I., and Idrissi, N. (2021). “A deep convolutional neural networks for the detection of cervical cancer using MRIs,” in The Proceedings of the International Conference on Smart City Applications (Cham: Springer), 1001–1009.
Klifto, K. M., Yesantharao, P. S., Lifchez, S. D., Dellon, A. L., and Hultman, C. S. (2021). Chronic nerve pain after burn injury: an anatomical approach and the development and validation of a model to predict a patient’s risk. Plastic Reconstr. Surg. 148 (4), 548e–557e. doi:10.1097/prs.0000000000008315
Marcot, B. G., and Hanea, A. M. (2021). What is an optimal value of k in k-fold cross-validation in discrete Bayesian network analysis? Comput. Stat. 36 (3), 2009–2031. doi:10.1007/s00180-020-00999-9
Mathews, L., and Seetha, H. (2022). “Learning from imbalanced healthcare data using overlap pattern synthesis,” in Proceedings of International Conference on Computational Intelligence and Data Engineering (Singapore: Springer), 447–456.
Nishimura, H., Yeh, P. T., Oguntade, H., Kennedy, C. E., and Narasimhan, M. (2021). HPV self-sampling for cervical cancer screening: a systematic review of values and preferences. BMJ Glob. Health 6 (5), e003743. doi:10.1136/bmjgh-2020-003743
Parraga, F. T., Rodriguez, C., Pomachagua, Y., and Rodriguez, D. (2021). “A review of image-based deep learning algorithms for cervical cancer screening,” in 2021 13th International Conference on Computational Intelligence and Communication Networks (CICN) (IEEE), 155–160.
Peto, J., Gilham, C., Fletcher, O., and Matthews, F. E. (2004). The cervical cancer epidemic that screening has prevented in the UK. Lancet 364 (9430), 249–256. doi:10.1016/s0140-6736(04)16674-9
Ploysawang, P., Rojanamatin, J., Prapakorn, S., Jamsri, P., Pangmuang, P., Seeda, K., et al. (2021). National cervical cancer screening in Thailand. Asian pac. J. Cancer Prev. 22 (1), 25–30. doi:10.31557/apjcp.2021.22.1.25
Savira, M., Suhaimi, D., Putra, A. E., Yusrawati, Y., Lipoeto, N. I., et al. Faculty of Medicine (2022). Prevalence oncogenic human papillomavirus in cervical cancer patients in Riau Province Indonesia. Rep. Biochem. Mol. Biol. 10 (4), 573–579. doi:10.52547/rbmb.10.4.573
Sengan, S., Khalaf, O. I., Sharma, D. K., Hamad, A. A., and Arokia Jesu Prabhu L., (2022). Secured and privacy-based IDS for healthcare systems on E-medical data using machine learning approach. Int. J. Reliab. Qual. E-Healthcare (IJRQEH) 11 (3), 1–11. doi:10.4018/ijrqeh.289175
Sowjanya, A. M., and Mrudula, O. (2022). Effective treatment of imbalanced datasets in health care using modified SMOTE coupled with stacked deep learning algorithms. Appl. Nanosci. 12, 1–12. doi:10.1007/s13204-021-02063-4
Tanimu, J. J., Hamada, M., Hassan, M., and Ilu, S. Y. (2021). A contemporary machine learning method for accurate prediction of cervical cancer, EDP Sciences. SHS Web Conf. 102, 04004. doi:10.1051/shsconf/202110204004
Thomsen, L. T., Kjær, S. K., Munk, C., Ørnskov, D., and Waldstrøm, M. (2021). Benefits and potential harms of human papillomavirus (HPV)-based cervical cancer screening: a real-world comparison of HPV testing versus cytology. Acta Obstet. Gynecol. Scand. 100 (3), 394–402. doi:10.1111/aogs.14121
Xing, B., Guo, J., Sheng, Y., Wu, G., and Zhao, Y. (2021). Human papillomavirus-negative cervical cancer: a comprehensive review. Front. Oncol. 10, 606335. doi:10.3389/fonc.2020.606335
Yaman, O., and Tuncer, T. (2022). Exemplar pyramid deep feature extraction based cervical cancer image classification model using pap-smear images. Biomed. Signal Process. Control 73, 103428. doi:10.1016/j.bspc.2021.103428
Zhang, H., Chen, C., Ma, C., Chen, C., Zhu, Z., Yang, B., et al. (2021). Feature fusion combined with Raman spectroscopy for early diagnosis of cervical cancer. IEEE Photonics J. 13 (3), 1–11. doi:10.1109/jphot.2021.3075958
Zhao, Y., Bao, H., Ma, L., Song, B., Di, J., Wang, L., et al. (2021). Real-world effectiveness of primary screening with high-risk human papillomavirus testing in the cervical cancer screening programme in China: a nationwide, population-based study. BMC Med. 19 (1), 164. doi:10.1186/s12916-021-02026-0
Keywords: cervical histogram images, ML, SKCV, ROC AUC, pr, performance measure
Citation: Prusty S, Patnaik S and Dash SK (2022) SKCV: Stratified K-fold cross-validation on ML classifiers for predicting cervical cancer. Front. Nanotechnol. 4:972421. doi: 10.3389/fnano.2022.972421
Received: 18 June 2022; Accepted: 11 July 2022;
Published: 19 August 2022.
Edited by:
Ajeet Kaushik, Florida Polytechnic University, United StatesReviewed by:
Arunkumar Rengaraj, University of Miami, United StatesCopyright © 2022 Prusty, Patnaik and Dash. This is an open-access article distributed under the terms of the Creative Commons Attribution License (CC BY). The use, distribution or reproduction in other forums is permitted, provided the original author(s) and the copyright owner(s) are credited and that the original publication in this journal is cited, in accordance with accepted academic practice. No use, distribution or reproduction is permitted which does not comply with these terms.
*Correspondence: Sashikanta Prusty, c2FzaGkucHJ1c3R5NzlAZ21haWwuY29t
Disclaimer: All claims expressed in this article are solely those of the authors and do not necessarily represent those of their affiliated organizations, or those of the publisher, the editors and the reviewers. Any product that may be evaluated in this article or claim that may be made by its manufacturer is not guaranteed or endorsed by the publisher.
Research integrity at Frontiers
Learn more about the work of our research integrity team to safeguard the quality of each article we publish.