
95% of researchers rate our articles as excellent or good
Learn more about the work of our research integrity team to safeguard the quality of each article we publish.
Find out more
ORIGINAL RESEARCH article
Front. Nanotechnol. , 14 December 2021
Sec. Biomedical Nanotechnology
Volume 3 - 2021 | https://doi.org/10.3389/fnano.2021.719710
This article is part of the Research Topic Advances in Self-Assembled Nanocarriers for Drug Delivery View all 5 articles
Encapsulation in self-assembled block copolymer (BCP) based nanoparticles (NPs) is a common approach to enhance hydrophobic drug solubility, and nanoprecipitation processes in particular can yield high encapsulation efficiency (EE). However, guiding principles for optimizing polymer, drug, and solvent selection are critically needed to facilitate rapid design of drug nanocarriers. Here, we evaluated the relationship between drug-polymer compatibility and concentration ratios on EE and nanocarrier size. Our studies employed a panel of four drugs with differing molecular structures (i.e., coumarin 6, dexamethasone, vorinostat/SAHA, and lutein) and two BCPs [poly(caprolactone)-b-poly(ethylene oxide) (PCL-b-PEO) and poly(styrene)-b-poly(ethylene oxide) (PS-b-PEO)] synthesized using three nanoprecipitation processes [i.e., batch sonication, continuous flow flash nanoprecipitation (FNP), and electrohydrodynamic mixing-mediated nanoprecipitation (EM-NP)]. Continuous FNP and EM-NP processes demonstrated up to 50% higher EE than batch sonication methods, particularly for aliphatic compounds. Drug-polymer compatibilities were assessed using Hansen solubility parameters, Hansen interaction spheres, and Flory Huggins interaction parameters, but few correlations were EE observed. Although some Hansen solubility (i.e., hydrogen bonding and total) and Flory Huggins interaction parameters were predictive of drug-polymer preferences, no parameter was predictive of EE trends among drugs. Next, the relationship between polymer: drug molar ratio and EE was assessed using coumarin 6 as a model drug. As polymer:drug ratio increased from <1 to 3–6, EE approached a maximum (i.e., ∼51% for PCL BCPs vs. ∼44% PS BCPs) with Langmuir adsorption behavior. Langmuir behavior likely reflects a formation mechanism in which drug aggregate growth is controlled by BCP adsorption. These data suggest polymer:drug ratio is a better predictor of EE than solubility parameters and should serve as a first point of optimization.
Hydrophobic drugs are poorly soluble in biological media; hence, drug delivery carriers are often employed to improve their biodistribution profiles (Torchilin, 2007; Kumar et al., 2020). Amphiphilic block copolymer (BCP) micelles and self-assembled nanoparticles (NPs) consisting of a hydrophobic core and a hydrophilic corona are the most commonly employed hydrophobic drug carriers (Bobo et al., 2016) because of their high drug loading capacity, tunable properties, and potential for controlled and/or stimuli-responsive release (Mura et al., 2013). However, these self-assembled nanostructures have largely failed to be translated to the clinic (Anselmo and Mitragotri, 2016). The majority of pre-clinical micelles are composed of low molecular weight polymers that demonstrate poor stability in blood (Zhang et al., 2013). Their low entropic barrier to chain rearrangement can result in dissolution. Larger (> 10 kDa) BCP micelles are more stable (Johnson and Prud'homme, 2003a; Zhang and Eisenberg, 1999); however, large BCPs are more difficult to process because of their reduced aqueous solubility. Particularly, it can be challenging to identify the optimal drug, BCP, and solvent combinations and operating conditions to maximize encapsulation efficiency (EE) (Martínez Rivas et al., 2017).
Processes based on nanoprecipitation (Figure 1) have shown particular promise for synthesis of nanocarriers with high EE (Martínez Rivas et al., 2017). In nanoprecipitation approaches, hydrophobic drugs, and BCPs in organic solvent are mixed with a miscible aqueous phase. Because the two phases are miscible, the solution rapidly achieves supersaturation, resulting in the formation of nanoparticle aggregates containing drug and BCPs (Figure 1D). Batch nanoprecipitation methods typically employ sonication for mixing (Figure 1B), whereas continuous and/or semicontinuous manufacturing platforms, such as flash nanoprecipitation (FNP) or electrohydrodynamic mixing-mediated nanoprecipitation (EM-NP), achieve mixing using jet mixer reactors (Figure 1C) (Saad and Prud’homme, 2016) or electrospray devices (Figure 1A) (Lee et al., 2019; Cosby et al., 2020), respectively. In nanoprecipitation processes, operating parameters (i.e., voltage, organic:aqueous ratio) and polymer, drug, and solvent compatibility can contribute to EEs.
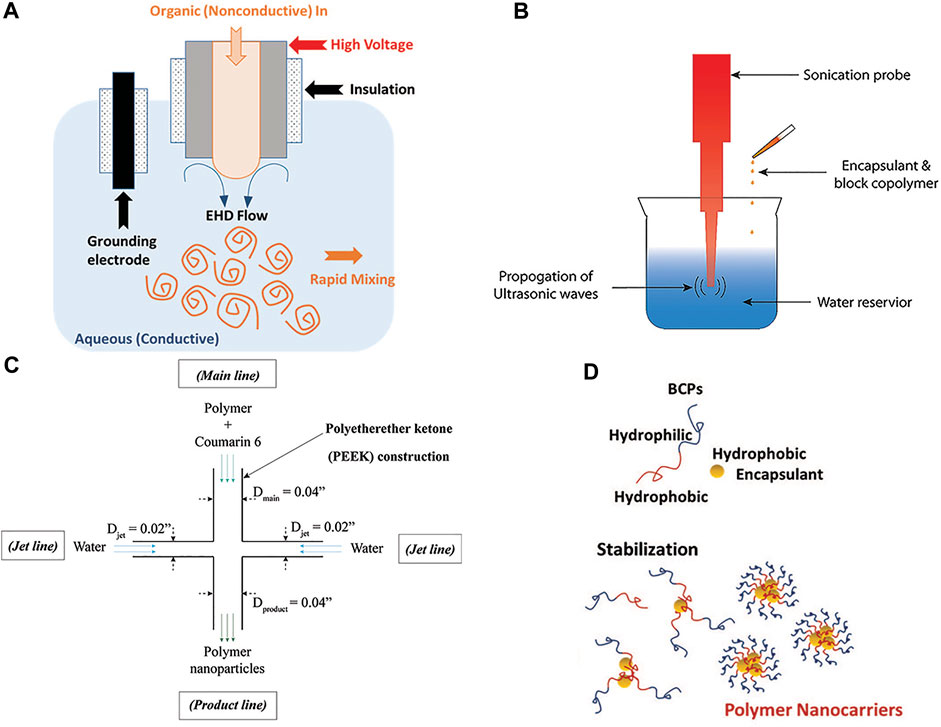
FIGURE 1. (A) Schematic of electrohydrodynamic mixing-mediated nanoprecipitation (EM-NP) process for synthesizing polymer nanocarriers. In EM-NP, electrohydrodynamic (EHD) flow of the continuous aqueous phase is generated by applying a voltage across an electrified needle and grounding electrode. EHD flow disperse the organic phase, containing block copolymers (BCPs) and encapsulants, which is simultaneously injected through the electrified needle. As miscible organic and aqueous solvents are employed, BCPs and encapsulants achieve instantaneous high supersaturation resulting in encapsulant aggregation and subsequent BCP adsorption. (B) Schematic of sonication nanoprecipitation process. The aqueous phase was sonicated with a constant duty cycle while the organic phase was added. (C) Jet mixing reactor (JMR) schematic. The JMR was used to compare EM-NP to FNP processes and consisted of a main line (dmain = 0.04″) carrying polymer and drug, and two perpendicular jet lines (djet = 0.02″) carrying water. Jet lines intersect with the main line at right angles in the confined JMR volume generating intense mixing. (D) Water miscible organic solvent containing BCPs and encapsulant are dispersed in water. BCPs and encapsulants achieve instantaneous high supersaturation resulting in encapsulant aggregation and subsequent BCP adsorption.
Here, we evaluated the effects of two of these contributing factors on EE of nanocarriers produced using nanoprecipitation. First, we explored the influence of polymer, drug, and solvent interactions on EE using Hansen solubility parameters (HSPs), Hansen interaction spheres (Ra), and Flory-Huggins interaction parameters (χsp) (Turpin et al., 2018). It has been suggested that optimal EE requires high drug compatibility with the hydrophobic BCP block (Sunoqrot et al., 2017) or hydrogen bonding potential of that block (Zhang et al., 2009), and is maximized when solution drug concentrations near maximum solubility are employed (Mora-Huertas et al., 2010). However, others have suggested that solubility in both BCP blocks is required (Latere Dwan'Isa et al., 2007) or that none of the parameters can adequately capture EE trends because they account primarily for enthalpic contributions without incorporating entropic corrections (Turpin et al., 2018). Second, we investigated EE as a function of drug: polymer ratio, comparing the influence of this parameter to that of polymer-drug-solvent compatibilities.
As model systems, we investigated BCPs consisting of polyethylene oxide (PEO) as the hydrophilic block and either poly(styrene) (PS) or poly(caprolactone) (PCL) as the hydrophobic block (i.e., PS9.5kDa-b-PEO18kDa and PCL6kDa-b-PEO5kDa). PS was chosen because it has minimal hydrogen bonding potential relative to PCL, important for testing the hypothesis that hydrogen bonding potential drives high EE (Zhang et al., 2009). A series of four drugs with differing molecular structures were employed (Figure 2): aromatics coumarin 6 and dexamethasone (DEX), which display steroid-like structures; vorinostat (also known as SAHA), which contains a single ring structure, an aliphatic tail, and a polar terminal group; and lutein, which contains a long aliphatic segment terminated by ring structures on each end. These compounds have different molecular structures allowing the predictive potential of solubility parameters to be assessed. Additionally these materials have biological use as fluorescent imaging agents [coumarin 6 (Eley et al., 2004; Nabar et al., 2018a)], anti-inflammatory steroids [DEX (Nabar et al., 2018a)], cancer therapeutics [vorinostat/SAHA (Chiao et al., 2013)], and nutraceuticals [lutein, found in fruits and vegetables (Krinsky and Johnson, 2005; Mitri et al., 2011)]. Nanocarriers were synthesized using three nanoprecipitation methods: batch sonication (Figure 1B), FNP in a jet-mixing reactor (JMR) (Figure 1C), and primarily EM-NP (Figure 1A) to assess EE differences arising from manufacturing method. Collectively, these experiments and models provide important insight into nanocarrier design to maximize EE.
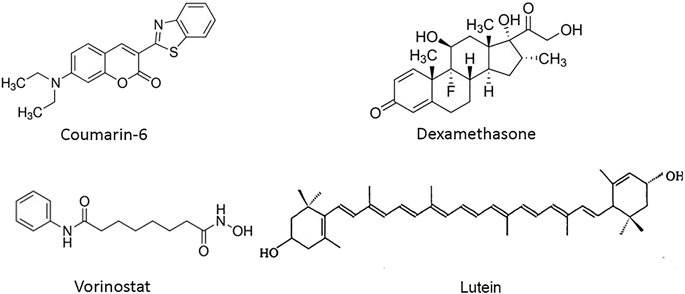
FIGURE 2. Chemical structures of drugs encapsulated in polymer carriers. (Left to right) Coumarin 6 and dexamethasone (DEX) compounds with steroid structures and several aromatic rings, vorinostat, also known as SAHA and lutein, containing long aliphatic segments.
Poly(ε-caprolactone-b-ethylene oxide) (PCL6kDa-b-PEO5kDa) and poly(styrene-b-ethylene oxide) (PS9.5kDa-b-PEO18.0kDa) amphiphiles with carboxylic acid termination were purchased from Polymer Source (Montreal, Canada). Dexamethasone (DEX) (Cat No. BML-EI126-0001) was purchased from Enzo Life Sciences. Coumarin 6 dye (Cat No. 442631), Suberoylanilide hydroxamic acid (SAHA, also known as Vorinostat, Cat No. SML 0061), Lutein (Xanthophyll, Cat No. X6250), tetrahydrofuran (THF, Cat No. 401757), and dimethyl sulfoxide (DMSO, Cat No. 276855) were purchased from Sigma Aldrich. Hamilton™ metal hub blunt point needles (27 gauge, 410 µm o.d.; 210 µm i.d.) and glass Luer lock syringes (1 ml) were purchased from Fisher Scientific. Polytetrafluoroethylene heat shrink tubing (30 gauge, 0.006″ wall, shrink ratio 2:1) was purchased from Component Supply company (Lakeland, FL). For centrifugal filtration, Amicon Ultra centrifugal filter units (pore size: 100 kDa MWCO, Cat No. UFC910024) were purchased from Fisher Scientific.
BCP NPs and drug loaded nanocarriers were produced by mixing water-miscible organic solvent containing hydrophobic encapsulants and BCP with water, thereby inducing nanoprecipitation. Polymer nanocarriers were synthesized using probe sonication, EM-NP, or FNP in a jet mixing reactor (Figure 1). The organic phase consisted of one of the BCPs (PCL-b-PEO at 18.2 nmol and PS-b-PEO at 7.2 nmol) and one hydrophobic encapsulant (0.1 μmol) prepared at fixed BCP to hydrophobic encapsulant molar ratio (ratios of 0.18 and 0.072 for PCL-b-PEO and PS-b-PEO, respectively) in a water-miscible organic solvent (either THF or DMSO). A fixed molar ratio was employed in these experiments to examine the effect of molecular volume on encapsulation efficiency in the context of solvent and polymer compatibility. Low polymer:drug molar ratios were employed to delineate differences in EE observed by distinct BCP types. For solvents, THF was generally preferred as it is more biocompatible (FDA, 1997); however, DMSO was used as a co-solvent with SAHA to increase its solubility.
For PS-b-PEO nanocarriers, PS-b-PEO (1 mg ml−1 in THF, 200 μL) was mixed with coumarin 6 (5 mg ml−1 in THF, 7 μL), DEX (5 mg ml−1 in THF, 8 μL), Lutein (1 mg ml−1 in THF, 57 μL), or SAHA (5 mg ml−1 in DMSO, 5 μL). The final volume of organic phase was adjusted to 800 μL by adding excess organic solvent; for coumarin 6, DEX, and Lutein samples, THF, whereas, for SAHA, THF, and DMSO were added to make the final volume ratio 1:1 of THF to DMSO. For PCL-b-PEO nanocarriers, PCL-b-PEO (1 mg ml−1 in THF, 200 μL) was mixed with the same amount of hydrophobic encapsulant and excess organic solvent as used for PS-b-PEO nanocarriers. The aqueous phase for each sample was 10 ml of ultrapure water (Milli-Q).
Selected EM-NP experiments examined the effect of increasing BCP to drug molar ratio on EE to explore the importance of drug aggregate nucleation rate relative to BCP aggregation rate. Aggregation rates are concentration dependent, thus aggregation should occur more rapidly at higher concentration. Coumarin 6 was selected as the model drug because of its fluorescent properties that enable easy discernment of particle aggregation under UV light. In these experiments, the organic THF solution contained a fixed amount of Coumarin 6 (0.1 μmol) and with increasing BCP amounts (PCL-b-PEO, 4.5 nmol–0.73 μmol and PS-b-PEO, 1.8 nmol–0.29 μmol). PCL-b-PEO or PS-b-PEO (20 mg/ml in THF, 2.5–400 μL) was mixed with coumarin 6 (5 mg ml−1 in THF, 7 μL). The final volume of organic phase was adjusted to 800 μL by adding excess THF.
For EM-NP synthesis, the organic phase was loaded into a glass syringe (1 ml capacity) connected to a PTFE insulated stainless steel needle. A grounding wire, insulated 1 cm to the tip, was also prepared. The needle and the grounding wire were submerged inside ultrapure water (Milli-Q, 10 ml) contained in a glass vial. A high voltage supply was used to apply a high voltage (−2500 V) across the needle and grounding wire as the organic phase was pumped into the aqueous phase using a syringe pump (flow rate: 12.7 ml h−1). Half of the organic phase (400 μL) was sprayed in each experiment.
Batch nanoprecipitation using probe sonication for mixing was employed as a control (Figure 1B). In the probe sonication method, half of the organic phase (400 μL) was pipetted into ultrapure water (Milli-Q, 10 ml) contained in a glass vial while the aqueous phase was sonicated using a probe sonicator (Branson Sonifier 450) at a constant duty cycle. Sonication was continued for 5 min after addition of the organic phase. For additional comparison, BCP nanocarriers were also synthesized using FNP in a jet mixing reactor (JMR) (Ranadive et al., 2019). The JMR is a crossflow micromixer (Figure 1C) in which two fluid jet lines impinge on a single main fluid line at right angles. The EM-NP system operates in semi-batch, whereas the JMR is a continuous flow system. Thus, to approximate EM-NP conditions, the flow rates of organic and aqueous fluid streams were chosen to match the final organic to aqueous ratio achieved through EM-NP. EM-NP and JMR experiments were both performed at specific polymer:drug molar ratios (i.e., 1.45 for PS-b-PEO and 3.64 for PCL-b-PEO), selected to maximize EE. Briefly, PCL-b-PEO or PS-b-PEO (20 mg ml−1 in THF, 200 μL) were mixed with coumarin 6 (5 mg ml−1 in THF, 7 μL) model encapsulants. The final volume of organic phase was adjusted to 800 μL by adding excess organic solvent. The organic solution was then added through the main flow line of the JMR at 0.4 ml min−1, whereas ultrapure water (Milli-Q) was injected through the jet lines at 10 ml min−1. Coumarin 6 loaded nanocarriers were collected from the product line. All samples were purified via centrifugal filtration (molecular weight cutoff: 100 kDa) to remove organic solvent and un-encapsulated drugs prior to evaluation.
Particle sizing can be determined using a variety of techniques, such as dynamic light scattering (DLS), electron microscopy (EM), or nanoparticle tracking analysis (NTA). Although DLS or NTA can yield critical information on particle size, they does not permit evaluation of particle morphological changes that might be anticipated as particles shift from spherical to worm-like morphologies (Duong et al., 2014). Thus, nanocarrier size and polydispersity were characterized using transmission electron microscopy (TEM). It is important to note that TEM will show smaller particle sizes than DLS as a result of differences in hydration.
Before depositing a sample on a TEM grid, a PELCO easiGlow Glow Discharge Cleaning System was used to make the grid surface more hydrophilic. Then, 12.5 μL of the sample was pipetted onto a silicon pad. TEM grid was inverted over the sample droplet for 5 min. Excess sample was then wicked away using filter paper. The deposited sample was negatively stained using 1% uranyl acetate. TEM images were collected using an FEI Tecnai G2 Bio Twin TEM (80 kV).
Particle size and distribution were determined using ImageJ software using the “Analyze Particles” feature (Abramoff et al., 2004). The Feret length (LF), or the longest distance between two points of a particle circumference, was used to represent NP diameter. Size analysis was performed for each sample in triplicate and pooled. Particle size histograms were plotted as the normalized frequency as a function of LF (bin size: 5 nm). Particle size distributions (PSD) were fit to log-normal distributions using SigmaPlot (Systat Software Inc., San Jose, CA, United States). Briefly, data were fit to the following equations to extract the particle distribution parameters, mode, mean, standard deviation, and effective polydispersity (PDeff):
where x0 and b are the median and the shape parameter, respectively.
Mode:
Lower (−dev) and upper (+dev) deviations containing 68% of the particles:
Polydispersity is often defined as the standard deviation/mean. Given the lognormal behavior of these particles, we employed the effective polydispersity (PDeff):
A detailed description of lognormal fits can be found in our previous work (Lee et al., 2019).
The encapsulation efficiency of each drug in PS-b-PEO and PCL-b-PEO NPs was evaluated using UV-Vis spectroscopy. Before using UV-Vis spectroscopy and within 5 min of initial synthesis, BCP nanocarriers were purified via centrifugal filtration (molecular weight cutoff: 100 kDa, centrifugation speed, and duration: 4,000 rpm and 15 min, respectively) to remove excess THF and un-encapsulated drug. After the initial filtration step, additional filtration washing was performed with 3 ml of distilled water, repeated 2 times. After purification, ∼100 μL of concentrated product remained. An additional 1,000 μL of distilled water was added to recover the product, which was then retrieved and placed in a glass vial (4 ml capacity). Purified products were dried overnight in a vacuum chamber. Dried products in glass vials were resuspended in 1 ml of organic solvent, chosen to dissolve nanocarriers and release encapsulated drug. Prior to use, standard curves for drug in organic solvent were generated for each compound. Solvents were also chosen so as to not interfere with the drug compound spectral peak. Specifically, THF was used for coumarin 6 and lutein, whereas chloroform was used for DEX. A solution of THF and DMSO (1:1 v/v) was used for SAHA. The wavelengths used to quantify coumarin 6, DEX, lutein, and SAHA were 443, 250, 450, and 242 nm, respectively. Encapsulation efficiency (%) was calculated as follows:
Hansen solubility parameters (HSPs) representing the contributions from dispersion (δD), polar (δP), and hydrogen bonding (δH) forces, are widely used to access polymer and drug compatibility (Turpin et al., 2018). HSPs were calculated using the group contribution method of Van Krevelen and Te Nijenhuis (Hansen, 2007; Van Krevelen and Te Nijenhuis, 2009). The total solubility parameter value, was then calculated using the equation (Hansen, 2004) (Supplementary Table S1):
Molecules that have closer values of each individual and total parameter should display greater compatibility. HSP differences (Table 1) were calculated by subtracting values for each individual parameter and total (Supplementary Table S1).
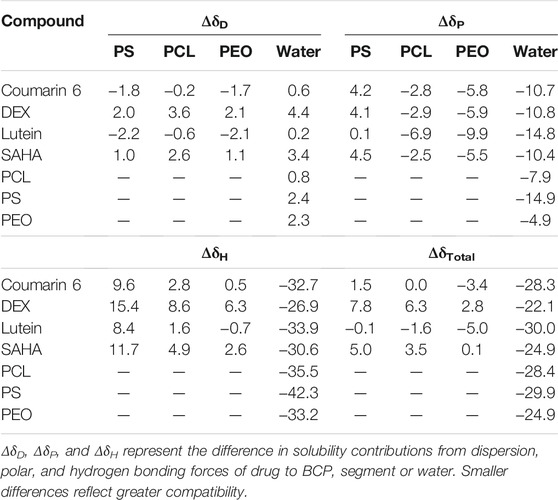
TABLE 1. Solubility parameter differences between drugs, BCP blocks, and water determined from HSP values in Supplementary Table S1.
Hansen solubility parameters (HSPs) for BCP blocks PS, PCL, and PEO, drug encapsulants coumarin 6, DEX, lutein, and SAHA, and THF and DMSO solvents were estimated using the group contribution method of Van Krevelen and Te Nijenhuis. HSPs for water were adopted from the literature (Hansen, 2007). Hansen interaction spheres, given as Ra values, map the distance between HSPs for two molecules in three-dimensional space (Table 2). Ra values were calculated according to (Latere Dwan'Isa et al., 2007):
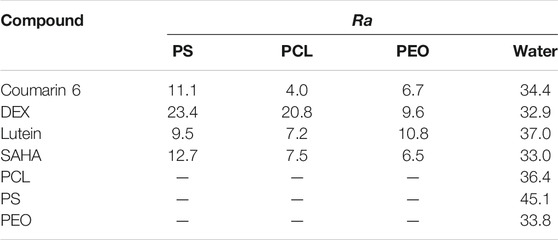
TABLE 2. Hansen solubility parameter distance (Ra) between drug compounds and hydrophobic BCP blocks and water. Lower values indicate greater compatibility.
Flory Huggins interaction parameters
where vs is the molar volume of the drug, R is the gas constant, and T is the temperature in Kelvin.
Statistical analysis was performed using JMP Pro 14 (SAS Institute, Cary, NC, United States) and SigmaPlot (Systat Software Inc., San Jose, CA, United States). The student’s t-test was used to examine statistical differences between EE achieved for a single drug in PCL-b-PEO vs. PS-b-PEO. Analysis of variance (ANOVA) and Tukey Honestly Significant Difference (HSD) test were used to compare coumarin 6 EE achieved using PCL-b-PEO or PS-b-PEO NPs synthesized using EM-NP or JMR. The level of significance (α) was 0.05 for all tests with p-value < 0.05 indicating statistical significance.
In these experiments, we investigated the size distribution of empty micelles and BCP nanocarriers synthesized via EM-NP versus batch sonication. Scalable nanoprecipitation processes have been shown to yield smaller, more monodisperse nanoparticles than their batch counterparts (Lim et al., 2014)1. We also studied the effect of drug encapsulation on resultant nanocarrier sizes. A fixed molar ratio of drug to mass of polymer was employed, yielding polymer:drug molar ratios of 0.18 and 0.072 for PCL-b-PEO and PS-b-PEO, respectively. These low ratios were employed as they represent high drug concentrations relative to polymer, useful to elucidate EE differences between drug molecular structures. To reduce variation resulting from solvent effects, THF was primarily employed with the exception of SAHA, which is only sparingly soluble in THF. For SAHA experiments, a THF/DMSO co-solvent system was employed, which also permitted preliminary investigation of the role of solvent selection in size and EE. For comparing processes, the same organic phases were employed, but mixing was provided by EHD flow or probe sonication for EM-NP and sonication, respectively.
First, empty PS-b-PEO and PCL-b-PEO control micelles were synthesized, evaluated via TEM, and their particle size distributions determined (Supplementary Figures S1, S2; Supplementary Table S2). For both BCPs, empty micelles synthesized via EM-NP had mean Feret lengths,
Comparing samples synthesized using sonication to EM-NP, empty micelles synthesized via sonication in THF were larger (p < 0.0001) (Supplementary Figures S2A,C) with mean
Next, nanocarriers containing drug were synthesized via both processes and compared. In EM-NP, drug carrier sizes were statistically different for carriers synthesized with PS vs. PCL blocks (Figure 3; Supplementary Figure S3; Supplementary Table S3). Carriers were larger than empty micelles, except for DEX in PCL-b-PEO and SAHA in PS-b-PEO (Supplementary Table S2). Increased size with encapsulant loading can be attributed to nucleation of encapsulant aggregates that are stabilized by BCP absorption (Johnson and Prud'homme, 2003a; Nabar et al., 2018a). Size differences were also observed across drug types (Supplementary Table S3), with nanocarrier sizes generally increasing as coumarin 6 < DEX < lutein/SAHA. Coumarin 6 and DEX have similar, steroidal chemical structures (Figure 2) that are more compact than lutein and SAHA, which contain long aliphatic regions. Unfortunately, SAHA is not fully soluble in THF and was synthesized with DMSO as a co-solvent. As DMSO increases empty micelle sizes (Supplementary Table S2), comparison of the two nanocarriers is not appropriate and size correlation to aliphatic content was not attempted.
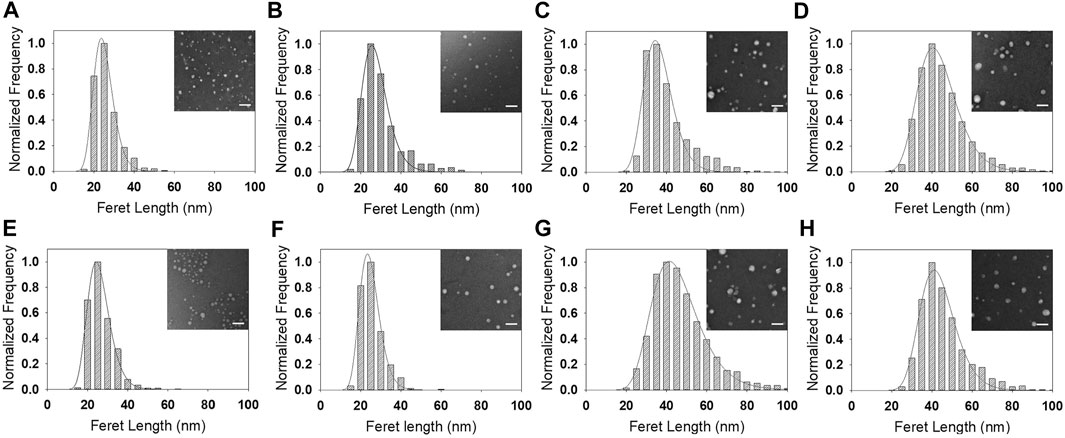
FIGURE 3. Size distributions and lognormal fits of (A–D) PS-b-PEO NPs and (E–H) PCL-b-PEO NPs synthesized via EM-NP and encapsulating (A,E) Coumarin 6, (B,F), DEX, (C,G) Lutein, and (D,H) SAHA. Inset: sample TEM image; scale bar: 100 nm. Full size versions of TEM images are available as Supplementary Figure S3.
Comparing EM-NP nanocarrier sizes to those synthesized via sonication (Figures 3 vs 4, Supplementary Figures 3 vs 4, Supplementary Table S3), coumarin 6 and DEX displayed similar trends to those observed in empty micelles (Supplementary Table S2), with sizes increased for sonication processes compared to EM-NP (p < 0.001). However, polydispersities were relatively similar for both processes. Lutein and SAHA displayed no correlation between synthesis process and size. However, there was a correlation with polymer type; PCL-b-PEO lutein sonication samples were smaller than EM-NP samples (and vice versa for PS-b-PEO) (p < 0.001). Polydispersities between both processes also remained similar or showed no correlation. These results underscore the complexity of nanocarrier formation processes, which depend on several time scales, including τagg, τdrug (hydrophobic drug aggregation times), and drug-polymer association times. τagg and τdrug must be larger than τmix to ensure operation in the homogenous kinetics regime (Johnson and Prud'homme, 2003b). Additionally, drug-polymer association times will dictate whether nanocarriers form by drug-polymer association and then BCP aggregation or via drug aggregation followed by drug-polymer association. The latter can lead to significantly larger nanocarriers whose size is dictated by the drug aggregate size (Nabar et al., 2018b). The timescales τdrug and τagg can be manipulated by changing the degree of drug and polymer supersaturation, respectively, to control encapsulation processes (Mahajan and Kirwan, 1994).
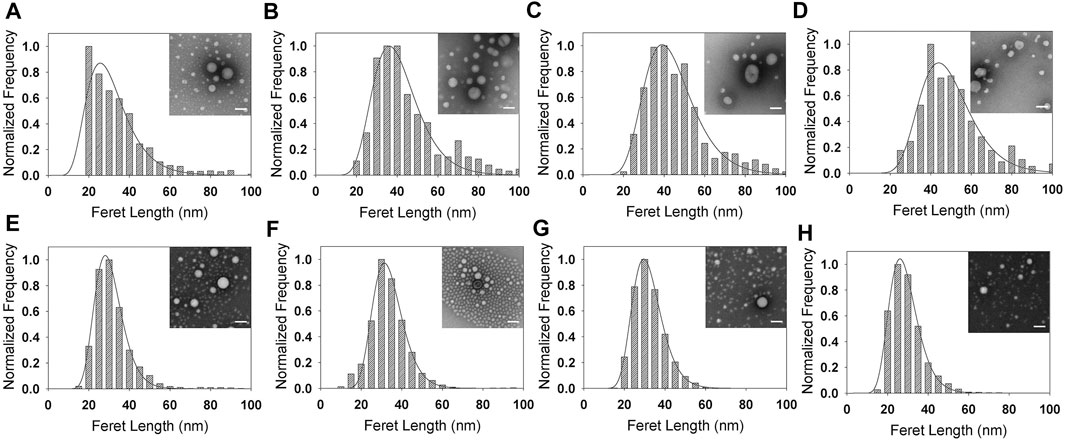
FIGURE 4. Size distributions and lognormal fits of (A–D) PS-b-PEO NPs and (E–H) PCL-b-PEO NPs synthesized via sonication and encapsulating (A,E) Coumarin 6, (B,F), DEX, (C,G) Lutein, and (D,H) SAHA. Inset: sample TEM image; scale bar: 100 nm. Full size versions of TEM images are available as Supplementary Figure S4.
Next, we evaluated drug EE for each carrier type synthesized via EM-NP and sonication (Figure 5, Supplementary Table S4). In EM-NP, PS-b-PEO generally displayed lower or statistically equivalent EE performance compared to PCL-b-PEO BCPs. It has been hypothesized that EE is driven largely by δH compatibility (Zhang et al., 2009), and the PS BCP block displays no hydrogen bonding capacity (i.e., δH = 0), which may explain its poorer performance. Remarkably, very high encapsulation efficiencies were observed for lutein and SAHA, which both contain long aliphatic regions (Figure 2), whereas minimal encapsulation in either polymer was observed for steroidal coumarin 6 and DEX compounds. These differences were abrogated in sonication synthesis, although PCL generally outperformed PS as observed in EM-NP. Lutein and SAHA PCL-b-PEO nanocarriers synthesized via EM-NP, but not sonication, also demonstrated significant size increases compared to coumarin 6 and DEX carriers (Supplementary Table S3). Previous studies have indicated an association between increased EE and larger NP size (Dai et al., 2015). These observations suggest a potential formation mechanism in which drug aggregates are passivated by PCL-b-PEO adsorption. The long aliphatic regions of lutein and SAHA likely promote slower aggregation (higher τdrug) than that of steroidal compounds, which may stabilize rapidly through π-π stacking interactions (Akbulut et al., 2009). Growing aggregates can be stabilized by PCL adsorption through favorable drug-polymer interactions and/or slower τagg. With its low hydrogen bonding capacity, PS-b-PEO is unable to adequately stabilize growing aggregates of either type, resulting in its poor EE. This result suggests that the insufficient mixing observed in sonication processes, and the corresponding failure to achieve the homogenous kinetics regime, prevented efficient encapsulation of aliphatic hydrophobic compounds by sonication. Because of the complexity of EM-NP process, it is difficult to determine its associated τmix. In addition, determining τdrug for each compound is beyond the scope of this work. However, these results suggest that EM-NP can enhance encapsulation efficiency, particularly for aliphatic compounds, by enhancing mixing.
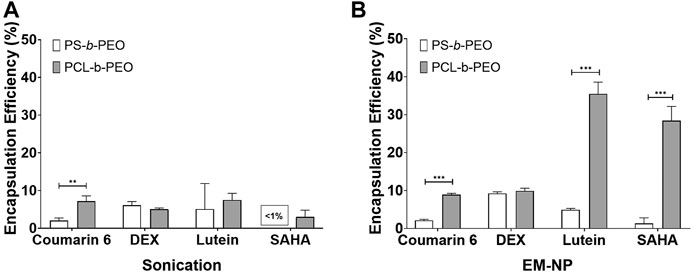
FIGURE 5. Encapsulation efficiency (%) of PS-b-PEO, and PCL-b-PEO NPs for Coumarin 6, DEX, Lutein, and SAHA synthesized via (A) Sonication, and (B) EM-NP. Error bars = standard deviation from mean. N = 3 for each data point. Statistically difference between PS-b-PEO and PCL-b-PEO NPs indicated by **p < 0.001 or ***p < 0.0001.
Next, we compared performance of EM-NP to FNP processes in a micromixer [e.g., similar to (Ranadive et al., 2019; Johnson and Prud'homme, 2003b)] using a jet-mixing reactor (JMR) previously employed for silver nanoparticle synthesis (Holunga et al., 2005). The EM-NP system operates in semi-batch, whereas the JMR is a continuous flow system. Thus, these experiments assess the effect of semi-batch versus continuous operation. EM-NP operates at low organic:aqueous ratios, which decrease NP size in the homogenous kinetics regime and can potentially influence EE (Miladi et al., 2015). Thus, we utilized FNP conditions that matched organic:aqueous ratios of EM-NP at the conclusion of spray. These experiments were performed using coumarin 6 as a model encapsulant at drug: polymer ratios of 1.45 for PS-b-PEO and 3.64 for PCL-b-PEO. These ratios were much higher than those employed above and were increased to maximize EE for comparison to FNP systems.
Results for both processes were similar across polymer types with no statistical differences detected across any group (i.e., polymers or synthesis methods) (Figure 6, Supplementary Tables S5–S7). This encouraging result suggests similarity between these two processes. In EM-NP, EHD mixing is achieved in a large aqueous sink, whereas JMR achieves mixing in a confined cross-flow geometry. Even though the EM-NP reactor is ∼20x larger than the JMR, EHD mixing is rapid enough to produce NPs with high EE. Similarly, despite semi-continuous operation in which BCP and encapsulant supersaturation profiles are changing with time, results were not distinguishable from those obtained in the JMR. In FNP, relatively constant supersaturation is achieved after initial start-up, and here EM-NP was performed using short spray times approximating steady state conditions. It is unclear how longer EM-NP operation would influence products. Further refinement of EM-NP into a fully continuous process could reduce these disparities.
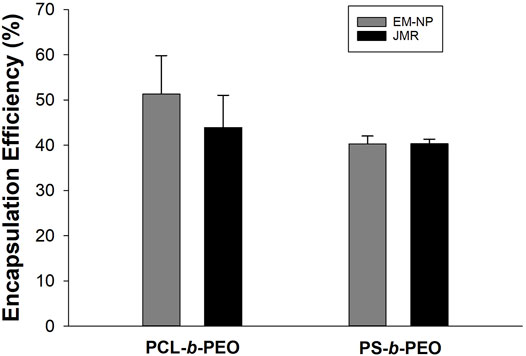
FIGURE 6. EM-NP vs. FNP JMR Coumarin 6 encapsulation efficiency (%) in PS-b-PEO and PCL-b-PEO nanocarriers. Error bars = standard deviation from mean. Number of experimental runs at each data point, n = 2. No statistical differences were detected between EM-NP and JMR samples or between polymer carriers.
In addition to synthesis method (i.e., mixing effects), several variables affect the EE of hydrophobic compounds in polymer NPs, including the size of hydrophobic core, polymer-encapsulant, and polymer-solvent/anti-solvent compatibility (Liu et al., 2006). In this study, the collapsed hydrophobic core sizes were relative similar (i.e., Rg of PS and PCL in water estimated at ∼1.182 nm (Drenscko and Loverde, 2017) and ∼1.183 nm [Di Pasquale et al., 2014), respectively], thus differences in polymer, drug, and solvent compatibility would be expected to dominate any observed differences. Enhanced drug solubility in a polymer carrier can result from several different chemical interactions, but hydrogen bonding is the most frequently reported for hydrophobic drug carriers (Zhang et al., 2009). Additionally, solubility can be enhanced when drugs minimize unfavorable interactions with polymer, for example, by self-associate through π-π stacking (Akbulut et al., 2009). To understand the role of molecular compatibility, we evaluated EE in the context of several theoretical constructs, specifically HSPs (Table 1), including δtot and δH, Hansen solubility spheres (Ra) (Table 2), and Flory Huggins interaction parameters
Affinity of polymers to encapsulants was evaluated using HSPs, Ra values, and
First, we evaluated the hypothesis that high polymer-encapsulant compatibility, and therefore EE, is observed when δH values of the BCP hydrophobic block and drug are closely matched (Zhang et al., 2009). For all encapsulants tested, ΔδH values suggest that PCL blocks have greater drug compatibility than PS blocks (Table 1). Experimental results support this hypothesis, as coumarin 6, lutein, and SAHA EEs were higher for PCL-b-PEO vs. PS-b-PEO, and DEX EE showed negligible difference between BCPs (Supplementary Table S4). Hansen ΔδH differences in PCL blocks were lowest for lutein and highest for DEX suggesting that EE should increase as DEX < SAHA < coumarin 6 < lutein. However, our experimental results did not support this. Whereas lutein did have the highest EE in PCL, SAHA also had an unexpectedly high EE. Higher EE of SAHA may have been influenced by the use of mixed solvent; however, coumarin 6 and DEX EE were similar despite substantial ΔδH differences. We also investigated the hypothesis that EE and Δδtot between drugs and hydrophobic BCP blocks are linearly correlated (Grizić and Lamprecht, 2020), but experimental results did not support this hypothesis. Using Δδtot, PCL-b-PEO was predicted to be more compatible with coumarin 6, DEX, and SAHA encapsulants, whereas PS-b-PEO was predicted more compatible with lutein. We did not observe any correlation between Δδtot and EE (Table 1, Supplementary Table S4). Good solubility of drug in a BCP block has been reported to occur when Δδtot < 5 (J/cm3)1/2 (Krevelen, 1990); however, coumarin 6 had low Δδtot that did not translate to high EE. It has been further suggested that compatibility with both BCP blocks maximizes EE (Latere Dwan'Isa et al., 2007). Using the sum of the absolute value of Δδtot for both blocks, the same EE trends are predicted as when using Δδtot for the hydrophobic BCP alone, which we did not observe. We also evaluated (poor) compatibility with the anti-solvent, water, which we would expect to be the driving force in drug or BCP aggregation given the low organic:aqueous ratios of EM-NP. Although the four encapsulants tested were all hydrophobic and considered insoluble in water, compounds with higher water compatibility may not be encapsulated as efficiently because aggregates formed may be less stable (Akbulut et al., 2009). However, in comparing drug-water ΔδH and Δδtot and EE data, no clear trends are observed (Table 1, Supplementary Table S4). HSPs ΔδH and Δδtot were predictive of lower PS compatibility in water, which would translate to lower τagg and potentially lower EE as BCPs could potentially aggregate before interacting with drug molecules, and PS BCP EE were lower than those of PCL BCPs. Thus, ΔδH were predictive of polymer EE trends, but not predictive of EE trends between drug structures, and Δδtot for hydrophobic BCP blocks, the full BCP, or the anti-solvent were not predictive of EE trends.
In addition to HSPs, compatibility of two molecules can be assessed in three-dimensional Hansen space using the Hansen solubility parameter distance, Ra. Smaller Ra values indicate greater compatibility. Ra values suggest greater drug compatibility in PCL versus PS BCP blocks (Table 2), consistent with experimental EE observations (Supplementary Table S4). Ra values for BCPs suggest PS has lower compatibility, which would suggest faster τagg and potentially less ability to passivate growing drug aggregates. These data are all supported by the lower EE observed in PS BCPs. For PS, EE was predicted by Ra to scale as DEX < SAHA < coumarin 6 < lutein and for PCL as DEX < SAHA < lutein < coumarin 6. This did not match our experiment observations (Supplementary Table S4). Despite spanning the predicted range, DEX and coumarin 6 EE in PCL-b-PEO were only different by only 1% and not statistically significant (α = 0.05). When PEO is considered in addition to the hydrophobic BCP blocks, coumarin 6 in PCL is predicted to have the highest EE, which we did not observe. Nor were any trends observed for drug-water Ra values and EE (Table 2). Hence, Ra values were not predictive of EE experimental trends.
Another factor that can influence EE and that is, not included in HSPs or Ra calculations is the bulkiness of drug molecules. The Flory Huggins interaction parameter,
Flory Huggins parameters indicate greater compatibility with all drugs for PCL than PS, consistent with our EE observations (Supplementary Table S4). Further, DEX had relatively low compatibility with either polymer, which is in a good agreement with EE results. The highest compatibility was predicted for coumarin 6 in PCL; however, it displayed lower EE than lutein. Thus,
In the prior experiments, EE was evaluated for a fixed polymer:drug molar ratio, selected to be low to enable differences between drug, polymer, and solvent interactions to be assessed. However, it is recognized that increasing drug concentration in the organic solution can dramatically enhance EE. Thus, we next evaluated the effect of increasing polymer:drug molar ratio on EE using coumarin 6 as a model drug. In these experiments, coumarin 6 concentration was held constant at 0.1 µmol, whereas polymer concentration was varied to generate different molar ratios ranging from 0.05–7.28 for PCL and 0.02–2.91 for PS (Figure 7; Supplementary Tables S6, S7). For comparison, values of 0.18 and 0.072 were used in our prior EM-NP vs. sonication experiments, and values of 3.64 and 1.45 were used for our EM-NP vs. FNP experiments, for PCL and PS, respectively.
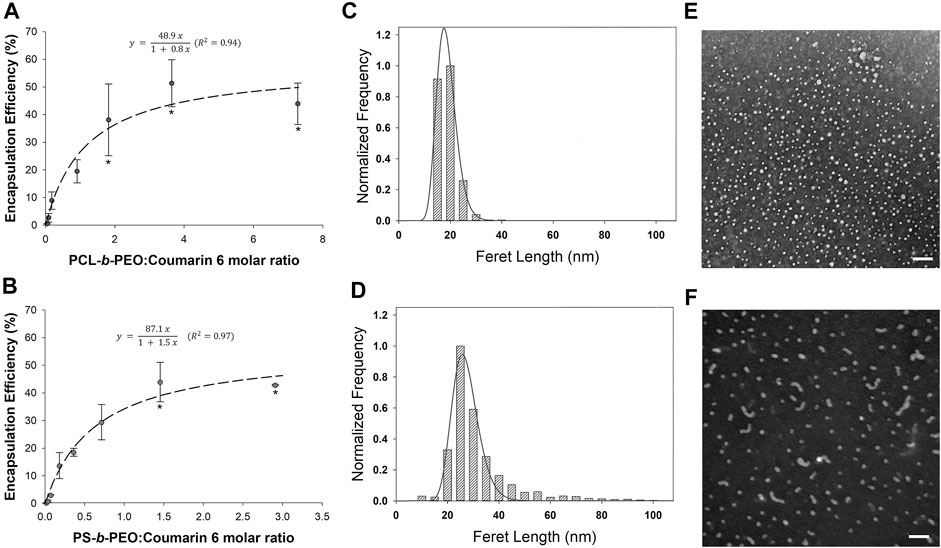
FIGURE 7. Coumarin 6 encapsulation efficiency (%) in (A) PCL-b-PEO and (B) PS-b-PEO nanocarriers synthesized using EM-NP at varying BCP to Coumarin 6 M ratio. Error bars = standard deviation from mean. Experimental runs at each data point, n = 2. Stars in each frame indicate no statistical difference. (C,D) Size distribution and log normal fits and (E,F) corresponding TEM images for coumarin 6 loaded (C,E) PCL-b-PEO NPs (polymer:drug molar ratio = 3.64) and (D,F) PS-b-PEO NPs (polymer:drug molar ratio = 1.45) synthesized using EM-NP. TEM Scale bar = 100 nm.
First, we note that in the absence of polymer stabilizer (i.e., polymer:drug ratio = 0), coumarin-6 aggregates form that are sufficiently large to be entirely removed during purification steps. Thus, BCP is required for drug stabilization. At low polymer to coumarin 6 ratios of ∼0.02–0.09 (i.e., drug in excess), EE was very low (i.e., from 0.3–4%). However, EE steadily increased to a saturation value at polymer:drug ratios of ∼3.6 for PCL-b-PEO (EE: 51.3 ± 8.49%) and ∼1.5 for PS-b-PEO (EE: 43.9 ± 7.14%), representing a breakpoint. After this point, higher polymer:drug ratios did not yield a statistically significant increase in EE.
This response resembles a Langmuir adsorption processes, further supporting a formation mechanism in which drug aggregates are stabilized by BCP adsorption. As the drug concentration in these experiments is fixed, τdrug should remain relatively constant (i.e., baring changes in solution viscosity), whereas drug-polymer association time and τagg would be decreased at increasing ratio [i.e., higher polymer concentration and supersaturation (Johnson and Prud’homme, 2003)]. At low polymer:drug ratios, insufficient polymer is present to stabilize the growing drug aggregate, which will eventually precipitate from solution. We observed this phenomenon during centrifugal purification of these samples, with large losses on the filter membrane filters. As polymer:drug ratio increases, polymer chains are increasingly able to stabilize and ultimately saturate the coumarin 6 aggregate surface. At the breakpoint, the growth of coumarin 6 aggregates is quenched by adsorption of BCPs on aggregate surface, representing a condition in which τdrug and τagg are approximately equivalent (Johnson and Prud'homme, 2003b).
Both polymers exhibited similar EE maxima, although as predicted by compatibility factors, PCL was slightly higher than PS (∼51 vs. ∼44%). However, at these high polymer:drug ratios, differences between polymer-drug compatibility were largely minimized, enabling high EE to be obtained. This encouraging result suggests greater latitude in nanocarrier BCP selection is possible if high polymer concentrations are employed relative to drug. However, although similar EE maxima were observed, the breakpoints at which these behaviors occurred differed. τagg is reduced with increasing BCP hydrophobicity (i.e., PS or PCL) (Johnson, 2003), and is dependent on molecular weight of the hydrophobic block. Since the molecular weight of the PS BCP block was ∼1.5 times that of the PCL block and PS has less compatibility with the water anti-solvent (i.e., greater differences in δtot and δH), PS-b-PEO τagg will be lower, consistent with its breakpoint positioned at a lower polymer:drug ratio. Thus, whereas high and relatively equivalent EE can be obtained for either polymer, this occurs at a lower polymer:drug ratio for more hydrophobic polymers. However, result should be interpreted with some caution as different polymer:drug ratios were employed for PS and PCL studies. Further experiments at different ratios would enhance these findings.
Because increased drug loading can also affect NP size (Johnson and Prud'homme, 2003a; Nabar et al., 2018a), we also characterized NP sizes at the Langmuir polymer:drug molar ratio breakpoints (i.e., 1.45 for PS-b-PEO and 3.64 for PCL-b-PEO) (Figures 7C,D; Table 4). For PS BCPs, nanocarrier sizes were statistically larger to those observed at low polymer:drug ratio (Supplementary Table S3), whereas for PCL BCP nanocarriers sizes at the break point were slightly smaller (p < 0.001). This may result from faster stabilization of drug aggregates limiting their size. However, despite these encouraging results, we did observe a greater number of worm-like structures (Figures 7E,F), particular for PS BCPs. Thus, morphology should be considered in optimizing polymer:drug molar ratios. It is likely that an optimum occurs near the breakpoint in which high EE with spherical morphology can be obtained. We also note that although a particular polymer: drug ratio may be employed during synthesis, the nanocarriers produced can be concentrated or diluted as needed. Drug release and toxicity behaviors would have to be further explored at the concentration of intended use.
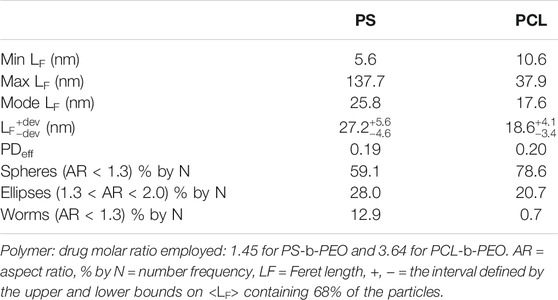
TABLE 4. Size characteristics of Coumarin 6 loaded PS-b-PEO and PCL-b-PEO NPs synthesized at the breakpoint at which drug EE no longer increases with increasing polymer:drug ratio.
In this report, we evaluated sizes and EE of four different drugs (i.e., coumarin 6, DEX, SAHA, and lutein) in two BCPs (i.e., PCL-b-PEO and PS-b-PEO) using the EM-NP process, nanoprecipitation via batch sonication, and FNP in a JMR. A primary goal of our study was to assess drug: polymer compatibility as a determinant of EE using Hansen solubility parameters (HSPs), Hansen interaction spheres (Ra), and Flory Huggins interaction parameters
The raw data supporting the conclusion of this article will be made available by the authors, without undue reservation.
KL, FK, LC, and GY synthesized and characterized nanocarriers. FK performed JMR studies and studies at increased polymer:drug ratio. KL, FK, and JW analyzed data. KL and FK prepared the initial manuscript draft, which was edited by JW. All authors have edited, contributed to, and approved the final manuscript.
This work was funded by the National Science Foundation under grant number CMMI-1344567. Instrument support for TEM was provided by the Ohio State University Institute for Materials Research (IMR) under award IMR-FG019.
The authors declare that the research was conducted in the absence of any commercial or financial relationships that could be construed as a potential conflict of interest.
All claims expressed in this article are solely those of the authors and do not necessarily represent those of their affiliated organizations, or those of the publisher, the editors and the reviewers. Any product that may be evaluated in this article, or claim that may be made by its manufacturer, is not guaranteed or endorsed by the publisher.
The authors acknowledge the assistance of Atifeh Alizadehbirjandi for her assistance with initial studies of SAHA encapsulation.
The Supplementary Material for this article can be found online at: https://www.frontiersin.org/articles/10.3389/fnano.2021.719710/full#supplementary-material
Abramoff, M. D., Magelhaes, P. J., and Ram, S. J. (2004). Image Processing with ImageJ. Biophotonics Int. 11, 36–42.
Akbulut, M., Ginart, P., Gindy, M. E., Theriault, C., Chin, K. H., Soboyejo, W., et al. (2009). Generic Method of Preparing Multifunctional Fluorescent Nanoparticles Using Flash NanoPrecipitation. Adv. Funct. Mater. 19, 718–725. doi:10.1002/adfm.200801583
Anselmo, A. C., and Mitragotri, S. (2016). Nanoparticles in the Clinic. Bioeng. Translational Med. 1, 10–29. doi:10.1002/btm2.10003
Bobo, D., Robinson, K. J., Islam, J., Thurecht, K. J., and Corrie, S. R. (2016). Nanoparticle-Based Medicines: A Review of FDA-Approved Materials and Clinical Trials to Date. Pharm. Res. 33, 2373–2387. doi:10.1007/s11095-016-1958-5
Chiao, M.-T., Cheng, W.-Y., Yang, Y.-C., Shen, C.-C., and Ko, J.-L. (2013). Suberoylanilide Hydroxamic Acid (SAHA) Causes Tumor Growth Slowdown and Triggers Autophagy in Glioblastoma Stem Cells. Autophagy 9, 1509–1526. doi:10.4161/auto.25664
Cosby, L. E., Lee, K. H., Knobloch, T. J., Weghorst, C. M., and Winter, J. O. (2020). Comparative Encapsulation Efficiency of Lutein in Micelles Synthesized via Batch and High Throughput Methods. Ijn Vol. 15, 8217–8230. doi:10.2147/ijn.s259202
Dai, L., Li, C.-X., Liu, K.-F., Su, H.-J., Chen, B.-Q., Zhang, G.-F., et al. (2015). Self-assembled Serum Albumin-Poly(l-Lactic Acid) Nanoparticles: a Novel Nanoparticle Platform for Drug Delivery in Cancer. RSC Adv. 5, 15612–15620. doi:10.1039/c4ra16346j
Di Pasquale, N., Marchisio, D. L., Barresi, A. A., and Carbone, P. (2014). Solvent Structuring and its Effect on the Polymer Structure and Processability: The Case of Water-Acetone Poly-ε-Caprolactone Mixtures. J. Phys. Chem. B 118, 13258–13267. doi:10.1021/jp505348t
Drenscko, M., and Loverde, S. M. (2017). Characterisation of the Hydrophobic Collapse of Polystyrene in Water Using Free Energy Techniques. Mol. Simulation 43, 234–241. doi:10.1080/08927022.2016.1253840
Duong, A. D., Ruan, G., Mahajan, K., Winter, J. O., and Wyslouzil, B. E. (2014). Scalable, Semicontinuous Production of Micelles Encapsulating Nanoparticles via Electrospray. Langmuir 30, 3939–3948. doi:10.1021/la404679r
Eley, J. G., Pujari, V. D., and McLane, J. (2004). Poly (Lactide-co-glycolide) Nanoparticles Containing Coumarin-6 for Suppository Delivery: In Vitro Release Profile and In Vivo Tissue Distribution. Drug Deliv. 11, 255–261. doi:10.1080/10717540490467384
FDA (1997). Guidance for Industry, Q3C Impurities: Residual Solvents. Rockville, MD: Center for Drug Evaluation and Research.
Grizić, D., and Lamprecht, A. (2020). Predictability of Drug Encapsulation and Release from Propylene. Int. J. Pharm. 586.
Hansen, C. M. (2004). 50 Years with Solubility Parameters-Past and Future. Prog. Org. Coat. 51, 77–84. doi:10.1016/j.porgcoat.2004.05.004
Holunga, D. M., Flagan, R. C., and Atwater, H. A. (2005). A Scalable Turbulent Mixing Aerosol Reactor for Oxide-Coated Silicon Nanoparticles. Ind. Eng. Chem. Res. 44, 6332–6341. doi:10.1021/ie049172l
Johnson, B. K. (2003). Flash NanoPrecipitation of Organic Actives via Confined Micromixing and Block Copolymer Stabilization. Princeton University.
Johnson, B. K., and Prud'homme, R. K. (2003). Flash NanoPrecipitation of Organic Actives and Block Copolymers Using a Confined Impinging Jets Mixer. Aust. J. Chem. 56, 1021–1024. doi:10.1071/ch03115
Johnson, B. K., and Prud'homme, R. K. (2003). Mechanism for Rapid Self-Assembly of Block Copolymer Nanoparticles. Phys. Rev. Lett. 91, 118302. doi:10.1103/physrevlett.91.118302
Johnson, B. K., and Prud’homme, R. K. (2003). Mechanism for Rapid Self-Assembly of Block Copolymer Nanoparticles. Phys. Rev. Lett. 91, 118302. doi:10.1103/physrevlett.91.118302
Krinsky, N. I., and Johnson, E. J. (2005). Carotenoid Actions and Their Relation to Health and Disease. Mol. Aspects Med. 26, 459–516. doi:10.1016/j.mam.2005.10.001
Kumar, R., Dalvi, S. V., and Siril, P. F. (2020). Nanoparticle-Based Drugs and Formulations: Current Status and Emerging Applications. ACS Appl. Nano Mater. 3, 4944–4961. doi:10.1021/acsanm.0c00606
Latere Dwan'Isa, J. P., Rouxhet, L., Préat, V., Brewster, M. E., and Ariën, A. (2007). Prediction of Drug Solubility in Amphiphilic Di-block Copolymer Micelles: the Role of Polymer-Drug Compatibility. Pharmazie 62, 499–504.
Lee, K. H., Yang, G., Wyslouzil, B. E., and Winter, J. O. (2019). Electrohydrodynamic Mixing-Mediated Nanoprecipitation for Polymer Nanoparticle Synthesis. ACS Appl. Polym. Mater. 1, 691–700. doi:10.1021/acsapm.8b00206
Lim, J.-M., Swami, A., Gilson, L. M., Chopra, S., Choi, S., Wu, J., et al. (2014). Ultra-high Throughput Synthesis of Nanoparticles with Homogeneous Size Distribution Using a Coaxial Turbulent Jet Mixer. ACS Nano 8, 6056–6065. doi:10.1021/nn501371n
Liu, J., Lee, H., and Allen, C. (2006). Formulation of Drugs in Block Copolymer Micelles: Drug Loading and Release. Cpd 12, 4685–4701. doi:10.2174/138161206779026263
Lübtow, M. M., Haider, M. S., Kirsch, M., Klisch, S., and Luxenhofer, R. (2019). Like Dissolves like? A Comprehensive Evaluation of Partial Solubility Parameters to Predict Polymer-Drug Compatibility in Ultrahigh Drug-Loaded Polymer Micelles. Biomacromolecules 20, 3041–3056. doi:10.1021/acs.biomac.9b00618
Mahajan, A. J., and Kirwan, D. J. (1994). Nucleation and Growth Kinetics of Biochemicals Measured at High Supersaturations. J. Cryst. Growth 144, 281–290. doi:10.1016/0022-0248(94)90468-5
Martínez Rivas, C. J., Tarhini, M., Badri, W., Miladi, K., Greige-Gerges, H., Nazari, Q. A., et al. (2017). Nanoprecipitation Process: From Encapsulation to Drug Delivery. Int. J. Pharmaceutics 532, 66–81. doi:10.1016/j.ijpharm.2017.08.064
Meunier, M., Goupil, A., and Lienard, P. (2017). Predicting Drug Loading in PLA-PEG Nanoparticles. Int. J. Pharmaceutics 526, 157–166. doi:10.1016/j.ijpharm.2017.04.043
Miladi, K., Sfar, S., Fessi, H., and Elaissari, A. (2015). Encapsulation of Alendronate Sodium by Nanoprecipitation and Double Emulsion: From Preparation to In Vitro Studies. Ind. Crops Prod. 72, 24–33. doi:10.1016/j.indcrop.2015.01.079
Mitri, K., Shegokar, R., Gohla, S., Anselmi, C., and Müller, R. H. (2011). Lipid Nanocarriers for Dermal Delivery of Lutein: Preparation, Characterization, Stability and Performance. Int. J. Pharmaceutics 414, 267–275. doi:10.1016/j.ijpharm.2011.05.008
Mora-Huertas, C. E., Fessi, H., and Elaissari, A. (2010). Polymer-based Nanocapsules for Drug Delivery. Int. J. Pharmaceutics 385, 113–142. doi:10.1016/j.ijpharm.2009.10.018
Mura, S., Nicolas, J., and Couvreur, P. (2013). Stimuli-responsive Nanocarriers for Drug Delivery. Nat. Mater 12, 991–1003. doi:10.1038/nmat3776
Nabar, G., Mahajan, K., Calhoun, M., Duong, A., Souva, M., Xu, J., et al. (2018). Micelle-templated, Poly(lactic-Co-Glycolic Acid) Nanoparticles for Hydrophobic Drug Delivery. Ijn Vol. 13, 351–366. doi:10.2147/ijn.s142079
Nabar, G. M., Winter, J. O., and Wyslouzil, B. E. (2018). Nanoparticle Packing within Block Copolymer Micelles Prepared by the Interfacial Instability Method. Soft Matter 14, 3324–3335. doi:10.1039/c8sm00425k
Ranadive, P., Parulkar, A., and Brunelli, N. A. (2019). Jet-mixing Reactor for the Production of Monodisperse Silver Nanoparticles Using a Reduced Amount of Capping Agent. React. Chem. Eng. 4, 1779–1789. doi:10.1039/c9re00152b
Saad, W. S., and Prud’homme, R. K. (2016). Principles of Nanoparticle Formation by Flash Nanoprecipitation. Nano Today 11, 212–227. doi:10.1016/j.nantod.2016.04.006
Sahu, S., Saraf, S., Kaur, C. D., and Saraf, S. (2013). Biocompatible Nanoparticles for Sustained Topical Delivery of Anticancer Phytoconstituent Quercetin. Pak J. Biol. Sci. 16, 601–609. doi:10.3923/pjbs.2013.601.609
Shin, H.-J., Beak, H. S., Il Kim, S., Joo, Y. H., and Choi, J. (2018). Development and Evaluation of Topical Formulations for a Novel Skin Whitening Agent (AP736) Using Hansen Solubility Parameters and PEG-PCL Polymers. Int. J. Pharmaceutics 552, 251–257. doi:10.1016/j.ijpharm.2018.09.064
Sun, J., Wei, Q., Shen, N., Tang, Z., and Chen, X. (2020). Predicting the Loading Capability of mPEG-PDLLA to Hydrophobic Drugs Using Solubility Parameters †. Chin. J. Chem. 38, 690–696.
Sunoqrot, S., Alsadi, A., Tarawneh, O., and Hamed, R. (2017). Polymer Type and Molecular Weight Dictate the Encapsulation Efficiency and Release of Quercetin from Polymeric Micelles. Colloid Polym. Sci. 295, 2051–2059. doi:10.1007/s00396-017-4183-9
Thanh, N. T. K., Maclean, N., and Mahiddine, S. (2014). Mechanisms of Nucleation and Growth of Nanoparticles in Solution. Chem. Rev. 114, 7610–7630. doi:10.1021/cr400544s
Torchilin, V. P. (2007). Micellar Nanocarriers: Pharmaceutical Perspectives. Pharm. Res. 24, 1–16. doi:10.1007/s11095-006-9132-0
Turpin, E. R., Taresco, V., Al-Hachami, W. A., Booth, J., Treacher, K., Tomasi, S., et al. (2018). In Silico Screening for Solid Dispersions: The Trouble with Solubility Parameters and χFH. Mol. Pharmaceutics 15, 4654–4667. doi:10.1021/acs.molpharmaceut.8b00637
Van Krevelen, D. W., and Te Nijenhuis, K. (2009). “Cohesive Properties and Solubility,” in Properties of Polymers: Their Correlation with Chemical Structure; Their Numerical Estimation and Prediction from Additive Group Contributions (Elsevier), 189–227. doi:10.1016/b978-0-08-054819-7.00007-8
Zhang, J., Li, S., Li, X., Li, X., and Zhu, K. (2009). Morphology Modulation of Polymeric Assemblies by Guest Drug Molecules: TEM Study and Compatibility Evaluation. Polymer 50, 1778–1789. doi:10.1016/j.polymer.2009.02.004
Zhang, L., and Eisenberg, A. (1999). Thermodynamic vs Kinetic Aspects in the Formation and Morphological Transitions of Crew-Cut Aggregates Produced by Self-Assembly of Polystyrene-B-Poly(acrylic Acid) Block Copolymers in Dilute Solution. Macromolecules 32, 2239–2249. doi:10.1021/ma981039f
Keywords: electrohydrodynamic mixing, nanoprecipitation, Hansen solubility parameters, block copolymer, drug encapsulation, micromixer
Citation: Lee KH, Khan FN, Cosby L, Yang G and Winter JO (2021) Polymer Concentration Maximizes Encapsulation Efficiency in Electrohydrodynamic Mixing Nanoprecipitation. Front. Nanotechnol. 3:719710. doi: 10.3389/fnano.2021.719710
Received: 02 June 2021; Accepted: 15 November 2021;
Published: 14 December 2021.
Edited by:
Aliasgar Shahiwala, Dubai Pharmacy College, United Arab EmiratesReviewed by:
Raj Kumar, University of Nebraska Medical Center, United StatesCopyright © 2021 Lee, Khan, Cosby, Yang and Winter. This is an open-access article distributed under the terms of the Creative Commons Attribution License (CC BY). The use, distribution or reproduction in other forums is permitted, provided the original author(s) and the copyright owner(s) are credited and that the original publication in this journal is cited, in accordance with accepted academic practice. No use, distribution or reproduction is permitted which does not comply with these terms.
*Correspondence: Jessica O. Winter, d2ludGVyLjYzQG9zdS5lZHU=
†These authors have contributed equally to this work and share first authorship
Disclaimer: All claims expressed in this article are solely those of the authors and do not necessarily represent those of their affiliated organizations, or those of the publisher, the editors and the reviewers. Any product that may be evaluated in this article or claim that may be made by its manufacturer is not guaranteed or endorsed by the publisher.
Research integrity at Frontiers

Learn more about the work of our research integrity team to safeguard the quality of each article we publish.