- 1Department of Radiology and Biomedical Imaging, MRRC, Yale University, New Haven, CT, United States
- 2Materials Science Division, Bangladesh Atomic Energy Centre, Dhaka, Bangladesh
- 3Department of Applied Physics, Electronics and Communication Engineering, Islamic University, Kushtia, Bangladesh
We synthesized spinel ferrite nanoensembles (MnFe2O4, CoFe2O4, and Fe3O4) using the chemical co-precipitation method and characterized their physical, chemical, and magnetic properties by X-ray diffraction (XRD), transmission electron microscopy (TEM), physical properties measurement system (PPMS), Mössbauer spectroscopy, Fourier transform infrared spectroscopy (FTIR), dynamic light scattering (DLS) and Raman spectroscopy. Their relaxation properties and potential for hyperthermia therapy were determined using nuclear magnetic resonance (NMR) and cell viability assay, respectively. XRD and TEM data confirmed that the particle core sizes were 6–9 nm before coating while their sizes increased to 10–14 nm and 14–20 nm after coating with chitosan and polyethylene glycol (PEG), respectively. Mössbauer spectroscopy showed superparamagnetic behavior for MnFe2O4 nanoparticles and ferrimagnetic behavior for the CoFe2O4 and Fe3O4 nanoparticles. A detailed studies of MH loops of all three ferrites before and after coating showed surface functionalization by a large reduction of coercivity and anisotropy. The successful coating was further confirmed by the peak shifts in the FTIR spectra of the particles whereas Raman spectra of coated ferrites also displayed the characteristic absorption patterns and suppression of the ferrite peaks suggesting successful coating. The induced heating profile of the nanoparticles in stable suspension was tested with a radio frequency magnetic field of 76 mT and a frequency of 400 kHz. High mortality (>98%) of 9 L gliosarcoma cancer cells by hyperthermia suggested that these nanoparticles could be used for cancer therapy. Transverse relaxivities (r2) determined by NMR for chitosan-coated MnFe2O4, CoFe2O4, and Fe3O4 nanoparticles were 297 (±22), 353 (±26), and 345 (±13), mM−1S−1, while for PEG-coated nanoparticles are 165 (±22), 146 (±14), and 159 (±07) mM−1S−1, respectively. Overall these spinel ferrite nanoensembles show great promise for cancer theranostics research applications.
Introduction
For the last decade, the nano ferrite-based contrast agents for biomedicine applications were extensively studied and these can transform both cancer diagnostics and therapeutics (Jordan et al., 1997; Fortin et al., 2007; Prasad et al., 2007; Zhou et al., 2007; Dobson 2008; Gazeau et al., 2008; McCArthy and Weissleder 2008; Lu et al., 2009; Tong et al., 2010; Tsai et al., 2010; Lee et al., 2011; Rümenapp et al., 2012; Pinter et al., 2016; Nguyen et al., 2018). For magnetic resonance imaging (MRI) contrast, the magnetic relaxation that consists of Néel and Brownian relaxation, and/or hysteresis effects, is directly related to their magnetic moments, their anisotropy, and particle size (Na et al., 2009). Therefore transverse relaxation time (T2) of these particles decreases with their increasing magnetic moment. A higher magnetic moment of nano-ensembles shortens relaxation time, which reduces the number of particles needed for an efficient contrast enhancement. Additionally, when exposed to an alternating magnetic field local temperature can be increased (i.e., hyperthermia) because higher magnetic moments coupled with controlled anisotropy of nano ferrites give rise to enhanced specific loss power (SLP) for induced heating. To enhance the potential of these ferrites in MRI contrast and thermal therapeutic applications, these nano ferrite-based contrast agents have to overcome the toxicity issues by applying surface coating (polymer, polysaccharide) and/or encapsulation (e.g., in lipids). The coating also improves the injectability, biocompatibility, and may also be exploited to achieve tissue-targeting (Sharifi et al., 2012; Issa et al., 2013).
The biocompatibility of any reagent is of utmost importance for biomedical applications. We would recall the limitations of gadolinium (Gd)-chelates as contrast agents which cannot be used for patients with kidney issues. However, the MRI relaxation times in muscle, fat, and tumor are sometimes very similar making tumor identification very difficult without any contrast agents. Ferrite nano-ensembles (MnFe2O4, CoFe2O4, and Fe3O4) show promising properties as Gd-based contrast agents. However, the toxicity of cobalt ferrite is higher than that of manganese ferrite and magnetite nanoparticles, but their higher magnetization and magnetocrystalline anisotropy provide enhanced induction heating efficacy and T2 relaxivity, and thus the required dose might be reduced considerably. An agent with higher efficacy at a low administered dose reduces the risk of agent-based toxicity issues further.
In this study, we synthesized MnFe2O4, CoFe2O4, and Fe3O4 nano-ensembles using the chemical co-precipitation method and coated them with chitosan and polyethylene glycol (PEG) to improve their solution stability and biocompatibility. Chitosan is biocompatible and biodegradable and has been utilized in many biomedical applications, while PEG coating has shown prolonged circulation of the nanoparticles (Abdelbary, 2011; Batra et al., 2012; Rosière et al., 2018; Vieira et al., 2018; Wang et al., 2018). The nanoparticles were subjected to structural characterization, their contrast-enhancing properties were demonstrated by measurement of T2 relaxivity, their induction heating efficacy by measuring specific loss power (SLP), and mortality effect on the 9 L gliosarcoma cancer cells.
Materials and Methods
Ferrite nanoensembles (MnFe2O4, CoFe2O4, and Fe3O4) were synthesized by chemical co-precipitation method using a molar ratio in the stoichiometric range of (M])/(Fe) = 1:2 of manganese, cobalt, and iron salts (Hoque, et al., 2016a; Hoque et al., 2016b). The salts used in this study for the preparation of different ferrites are Mn(NO3)2.6H2O, CoCl2.4H2O, FeSO4.6H2O, and FeCl3. Sodium hydroxide (NaOH) and ammonium hydroxide (NH4OH) were used as the co-precipitating agent.
Sample Preparation
Manganese nitrate, cobalt chloride, and iron chloride salts were dissolved homogeneously in distilled water. 8 M of NaOH solution was then added dropwise into the salt solutions while continuously stirring at 500 rpm. An extra 6 M of NaOH for CoFe2O4 and NH4OH for MnFe2O4 was added to maintain the pH of the solution at pH 11 and allowed to react for 30–40 min. The manganese ferrite nanoparticles were heated at 60°C for 60 min, while cobalt ferrite nanoparticles were heated at 90°C for 60 min to complete their ferritization reaction. Fe3O4 was synthesized in a nitrogen environment at ambient temperature (i.e. without heating) to avoid oxidation of Fe3O4. In this case, FeSO4.6H2O and FeCl3 were mixed homogeneously in the required cation ratio, followed by the addition of 8 M of NH4OH dropwise to maintain a pH of 11. The ferritization reaction for the formation of Fe3O4 took place spontaneously at ambient temperature. The precipitate was collected through centrifugation at 8000 rpm for 15 min followed by rigorous washing through filtration. Complete extraction of solvent was confirmed by the AgNO3 test. An aqueous solution of chitosan (ALDRICH) with low molecular weight and Brookfield viscosity 20 cps was prepared by adding 0.4 gm of chitosan into a mixture of 40 ml water and the required amount of acetic acid solution. The aqueous solution of PEG 8000 was prepared by adding the required amount of PEG into the water. The dissolved chitosan and PEG were added to the solution containing the ferrite nanoparticles under bath sonication for homogeneous mixing. The pH was also maintained in the range of 9–11, with slow addition of NH4OH to conglomerate the chitosan dissolved in the solution Hong (Hong et al., 2010). An immediate change was observed after the addition of chitosan and PEG, which transformed detached particles into colloidal suspensions.
Measurements
X-ray diffraction (XRD) was carried out using a Rigaku Mo Kα radiation source, which determined grain size and lattice parameters of as-dried samples. XRD patterns of as-dried powder yielded broad diffused patterns near the maximum intensity peak of 311 of these ferrite nanoensembles. The XRD scan was carried out for a 2-theta angle range of 12.5–40° with a scan step size of 0.0167°. Transmission electron microscopy (TEM) was carried out using the TEM Model: Tecnai F-12, (Field Electron and Ion Company; FEI), the United States with an operating voltage of 120 kV. The samples for TEM analysis were prepared by drop drying a dilute dispersion of these nanoparticles on an electron transparent carbon-coated Cu grid. The field dependence magnetic properties of these samples were also performed using physical properties measurement system (PPMS) Model: D235; Dynacool by Quantum Design; United States. The Mӧssbauer spectra were recorded using the Mӧssbauer spectrometer of See Co. The spectra were recorded for 24 h using the samples in the powder form in the transmission geometry. A constant acceleration spectrometer operated in connection with a multi-channel analyzer in the time scale mode. The source was kept at room temperature and consists of approximately 20 mCi of Co57 diffused into rhodium or palladium foil. The spectrometer was calibrated against a metallic iron foil and zero velocity was taken as the centroid of its room temperature Mössbauer spectrum. After the characterizations of bare nanoparticles, the surface was modified by coating with chitosan and PEG. Various concentrations of the nanoparticles were prepared by serial dilution of a 20 mg/ml stock solution.
The crystalline nature and coating status were examined by Fourier transform infrared spectroscopy (FTIR) Model: L1600300 Spectrum TWO UTA, ETHERNET, 1 PerkinElmer; United Kingdom. 2 mg/ml concentration of nanoensembles in the cuboids was used for the measurement of hydrodynamic diameter and polydispersity index (PDI) using dynamic light scattering (DLS) Model: Nanoplus-1, Zeta/nano Particle Analyzer, United States. Raman spectroscopy was acquired using pellets with a Raman Spectrometer of Model: Monovista CRS+, S and I; Germany. For hyperthermia studies concentrations of 4, 2, and 1 mg/ml in three different Eppendorf tubes were used and the rise of temperature vs. time was measured using hyperthermia set-up Model: EASY Heat 5060LI, Ambrell Company, United States. The hyperthermia set-up consisted of an RF coil with 8 turns with diameter that produced an RF magnetic field of amplitude 76 mT and frequency of 400 kHz. To perform a necrosis study on 9 L cancer cells by magnetic particle hyperthermia, we first carried out cytotoxicity studies of the chitosan and PEG-coated nanoparticles on 9 L rat gliosarcoma cells by viability assay. 2×10⁶ cells per condition were transferred in an Eppendorf tube by adding 2 mg/ml of chitosan and PEG-coated ferrite nanoensembles suspended in the PBS and incubated for 24 h at 37°C in a 5% CO2 incubator (Mode: NU-400-E; Nuaire; United States). The 9 L rat gliosarcoma cells were grown in DMEM supplemented with 10% FBS, 200 μg/ml penicillin, and 200 μg/ml streptomycin at 37°C in Petri dishes (Corning, NY, United States). The Petri dishes containing the cells with nanoparticles were kept in a 5% CO2 incubator to investigate the effect of magnetic particle hyperthermia on the cancer cells. After 80% confluence, cells were harvested and counted. 2×10⁶ cells per condition were transferred in an Eppendorf tube and incubated with 2 mg/ml of ferrite nanoparticles (chitosan and PEG-coated) for twice the exposure time in the radiofrequency field. Then the cells were subjected to an AC magnetic field at 76 mT and frequency of 400 kHz for 30 min and the effects of hyperthermia on the cell viability were determined by inverted light microscope with camera hemocytometer of (Optika, Italy). The viability assay was carried out by the trypan blue exclusion test counting the number of trypan blue-positive (dead) and negative (alive). The first control C1 consisted of cells incubated in the DMEM media followed by the exposure to RF induction heating for 30 min in the absence of the nanoparticles, whereas the second control C2 consisted of cells treated with ferrite nanoparticles coated with chitosan and PEG at the concentration of 2 mg/ml under induction heating for the same period.
The solution of the ferrite nanoensembles coated with chitosan and PEG were prepared at five different concentrations for relaxivity studies. The transverse relaxation times T2 of water protons in the presence of biocompatible chitosan and PEG-coated ferrite nanoparticles at different concentrations were measured using nuclear magnetic resonance (NMR) (Bruker Avance Digital, 400 MHz, the field at 9.4 T). The Carr–Purcell–Meiboon–Gill pulse sequence was used for the measurement of T2. MRI images of the five phantoms at different concentrations were also acquired at 11.7 T using a Bruker Avance spectrometer and analyzed by MATLAB simulation software.
Results and Discussion
X-Ray Diffraction
MnFe2O4, CoFe2O4, and Fe3O4 nano ferrites were successfully synthesized using the chemical co-precipitation method and characterized for their physical, chemical, and magnetic properties. XRD was used to provide structural information on the phases, grain size, and lattice parameters of the nanoparticles as shown in Figure 1. All Bragg reflections for MnFe2O4, CoFe2O4, and Fe3O4 indexed in the figures confirmed the formation of single-phase spinel ferrites. XRD patterns of all three ferrites yielded broad peaks suggesting that particles have nanometric dimensions. The average particle sizes were 10, 8, and 5 nm for MnFe2O4, CoFe2O4, and Fe3O4, respectively, estimated from the full-width-half-maxima (FWHM) of the maximum intensity peak (311) using Scherrer’s formula. The lattice parameters determined from the x-ray diffraction data using the Nelson-Riley method were 8.49, 8.33, and 8.20 Å for MnFe2O4, CoFe2O4, and Fe3O4 nanoparticles, respectively. Table 1 shows particle size (d), lattice parameter (a), X-ray density (ρx), specific surface area (S), hopping lengths for the tetrahedral (LA) and octahedral sites (LB) of MnFe2O4, CoFe2O4, and Fe3O4 spinel ferrites nanoparticles in as dried condition at room temperature determined using the formula reported earlier (Satalkar and Kane 2016). The hopping length or the distance between the magnetic ions of B-site is less than A-site because of the more magnetic ions in B-sites. The specific surface area (S) of Fe3O4 is the lowest of all three ferrites in the as-synthesized condition, which is extremely important for the catalytic activity.
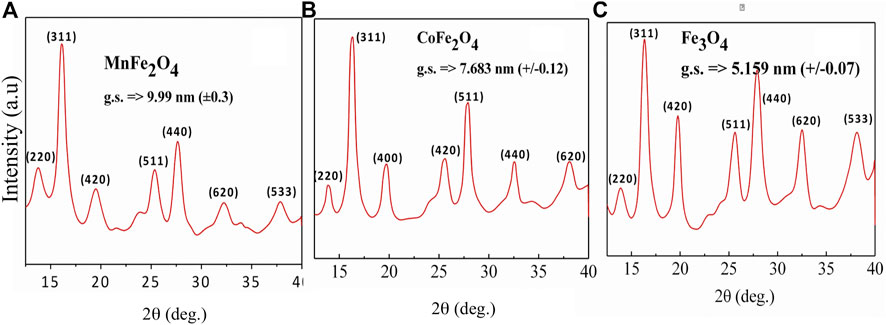
FIGURE 1. X-ray diffraction patterns of (A) MnFe2O4(B) CoFe2O4 and (C) Fe3O4 ferrite nanoparticles in the as-dried condition at room temperature.

TABLE 1. Particle size (d), lattice parameter (a), X-ray density (ρx), specific surface area (S), hopping lengths for the tetrahedral (LA) and octahedral sites (LB) of MnFe2O4, CoFe2O4, and Fe3O4 spinel ferrites nanoparticles in as-dried condition at room temperature.
Transmission Electron Microscopy
Figures 2A–C shows TEM micrographs of MnFe2O4, CoFe2O4, and Fe3O4 nanoparticles in the bare, chitosan, and PEG-coated dry state. The particles have a semi-spherical shape in the bare state with particle sizes about 9, 7, and 6 nm for MnFe2O4, CoFe2O4, and Fe3O4, respectively. The particle sizes after coating with chitosan and PEG are bigger, i.e., 14 and 20 nm for MnFe2O4, 12 and 16 nm for CoFe2O4, and 10 and 14 nm for Fe3O4, respectively. The particle sizes in the bare states are in agreement with the sizes determined from the XRD patterns. Figure 2D shows representative STEM EDS mapping images of chitosan-coated CoFe2O4 with HAADF image, which shows a single crystallite of 10 nm sizes. The red and green dots show the distribution of Co. and Fe. The even distribution of red and green dots exhibit compositional homogeneity.
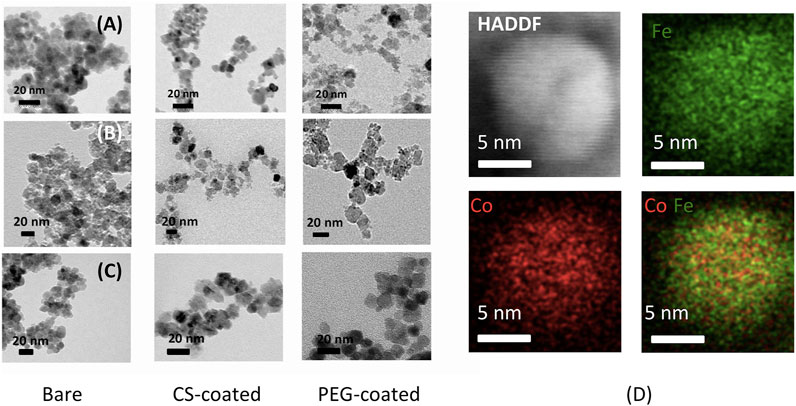
FIGURE 2. TEM images of MnFe2O4, CoFe2O4, and Fe3O4 with for the (A) bare nanoparticles, (B) chitosan-coated, (C) PEG-coated nanoparticles, and (D) STEM EDS mapping of chitosan-coated CoFe2O4 nanoparticle.
Magnetic Properties
Figure 3A shows the M-H hysteresis loops of MnFe2O4, CoFe2O4, and Fe3O4 nanoparticles in the as-dried condition measure with a maximum applied field of 5 T at 5 and 300 K. Figure 3B shows the M-H hysteresis loops of all three ferrites in the chitosan-coated state and Figure 3C are the low field hysteresis loops of all three ferrites. The results indicate that the magnetization of MnFe2O4 and CoFe2O4 did not attain saturation magnetization with 5 T at 300 K although the magnetization is fairly saturated for Fe3O4. This shows that the non-collinear magnetization due to canted spin, which was recovered at 5 K. It is interesting to note that the spin-canting effect also reduced because of the chitosan-coating presented in Figure 3B and especially notable in Figure 3C of low field hysteresis. In Figure 3C, it is interesting to note that while the coercivity and the area of the loop reduced largely of CoFe2O4 and MnFe2O4, even for Fe3O4 the orientation of the M-H loops demonstrate that the spins become collinear in the coating condition. This is because with coating the agglomerations of the particles are reduced, which reduces magnetic domains and the average anisotropy of the particles is reduced. Table 2 presents the maximum magnetization (Mmax), remnant magnetization (Mr), and coercivity (Hc) extracted from the hysteresis loops at 5 and 300 K and the calculated values magnetic moment (nB) and anisotropy constants (K). Magnetocrystalline anisotropy (K1) of CoFe2O4 is 1.89 × 10⁶ erg cm−3 which is higher than Fe3O4 (1.4 × 10⁵ erg cm−3) and MnFe2O4 (3.3 × 10⁴ erg cm−3). The higher values of K1 of cobalt ferrites generally give rise to the area in the hysteresis loop when the particle size is larger.
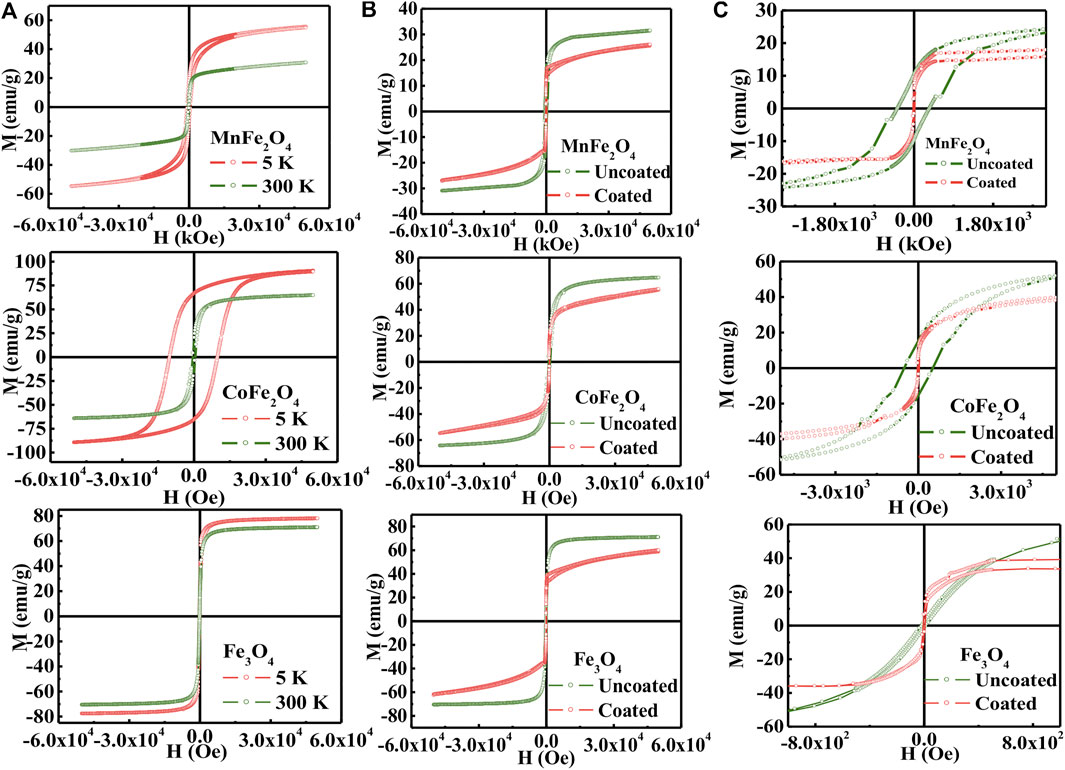
FIGURE 3. (A) M-H hysteresis loops for the compositions of MNFe2O4, COFe2O4, and Fc3O4 nanoparticles in the bare state at 5 and 300K, (B) uncoated and coated condition with chitosan and (C) The low field region of H-M hysteresis loops presented in (B).

TABLE 2. Maximum magnetization (Mmax), remnant magnetization (Mr), coercivity (Hc), average anisotropy (K), and magnetic moment (nB) of MnFe2O4, CoFe2O4, and Fe3O4 spinel ferrites nanoparticles in the uncoated condition at 5 and 300 K, and in the coated condition at 300 K.
Mӧssbauer Spectroscopy
The Mӧssbauer spectra of MnFe2O4, CoFe2O4, and Fe3O4 nanoparticles in the as-dried condition and bare state without the application of magnetic field and temperature are shown in Figure 4. The curve of MnFe2O4 in Figure 4A reveals a mixed contribution of ferrimagnetic and superparamagnetic phases. There is a central doublet subspectrum, which represents the contribution of the superparamagnetic phase. The spectrum also contains a sextet sub-spectrum that represents ferrimagnetic phases. In Figure 4B, the spectrum of CoFe2O4 exhibits a sextet pattern and confirms the ferrimagnetic nature of the sample. Considering the contribution of three sub-species, theoretical and experimental data matched perfectly. Two sub-species exhibit sextet patterns that indicate ferrimagnetic contribution only. There is a small volume fraction of superparamagnetic phase represented by a small doublet pattern. The spectrum of Fe3O4 in Figure 4C represents a sextet pattern, and the subspectra that fitted the experimental data to the theoretical one, are also sextet that demonstrates only ferrimagnetic contributions. Two of the subspecies are sextets representing ferromagnetic contributions due to Fe3+ and the other sextet represents the contribution of Fe2+. The various electronic and magnetic contributions represented by the hyperfine parameters such as chemical shift, quadrupole splitting, internal magnetic field, along with the relative areas are indicated in Table 3. Cation distributions cannot be determined because of the presence of doublets that represent superparamagnetic phases and do not take part in the long range ordering.

FIGURE 4. Mossbauer spectra at room temperature of (A) MnFe2O4, (B) CoFe2O4 and (C) Fe3O4 nanoparticle in the as-dried condition.
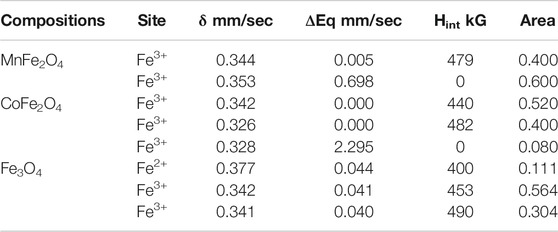
TABLE 3. Hyperfine parameters, isomer Shift (δ), quadruple splitting (ΔEq), internal hyperfine magnetic field (Hint), and area under the curve of subspecies from the model fitting of experimental data of Mössbauer spectroscopy for MnFe2O4, CoFe2O4 and Fe3O4 ferrite nanoparticles in the as-dried condition at room temperature.
Fourier Transform Infra-red Spectroscopy
The FTIR spectra of chitosan and the MnFe2O4, CoFe2O4, and Fe3O4 nanoparticles in their bare state and when coated with chitosan are shown in Figure 5. In the bare states, the bands around 400 and 600 cm−1 are stretching modes with the metal in octahedral and tetrahedral sites which is a common feature of spinel ferrites (Cannas et al., 2008). In the chitosan-coated nanoparticles, the octahedral and tetrahedral absorption peaks around 400 and 600 cm−1 either disappeared or decreased in intensity suggesting successful coating with chitosan. In the chitosan-coated nanoparticles, other peak positions are due to the vibrational mode of C-O-C, CH3, NH2, and CH2 are at 1070, 1450, 1620, and 2930 cm−1, respectively. The absorptions at 1450 and 1620 cm−1 are due to the presence of -CH3 in the amide and NH2 in the amino group of chitosan. The broad peaks in the 3200–3500 cm−1 region are due to the stretching vibration of the O–H group and residual H2O present in chitosan. Similar absorption peaks are present for chitosan-coated samples and suggest sufficient surface coating with chitosan. FTIR spectra of pure chitosan in this study are similar to those obtained by Kolhe and Kannan (Kolhe and Kannan 2003).

FIGURE 5. FTIR spectra of chitosan, chitosan-coated, and uncoated (A) MnFe2O4, (B) CoFe2O4 and (C) Fe3O4 nanoparticles.
Dynamic Light Scattering
The hydrodynamic diameter of the nanoparticle is a critical parameter in biomedical applications as it determines the injectability, biodistribution, and clearance of hyperthermia or MRI agents (Yamauchi et al., 2007; Driscoll, 2007). Figures 6A–C show the hydrodynamic diameter and polydispersity index (PDI) of chitosan and PEG-coated MnFe2O4, CoFe2O4, and Fe3O4 nanoparticles at the concentration of 2 mg/ml and room temperatures. The hydrodynamic diameter and polydispersity index of chitosan and PEG-coated samples are presented in Table 4. These results reveal information about the diameter of the inorganic core along with the attached dragging fluid while the coated nanoparticle is in the Brownian motion (Maaz et al., 2009). Only inorganic core information can be obtained during the estimation of grain size using XRD and TEM in the absence of the hydration layer. For optimization of in-vivo transportation of nanoparticles and their performance for biological applications, the measurement of hydrodynamic diameter is crucial, and this value should be below 250 nm (Hoque et al., 2016c). The polydispersity index (PDI) is another important parameter for drug delivery applications using lipid-based carriers, where a PDI range below 0.300 is acceptable (Danaei et al., 2018). The average hydrodynamic diameter of the chitosan and PEG-coated MnFe2O4 ferrite nanoparticles are 130 and 172 nm, and their PDIs are 0.303 and 0.207, respectively, whereas the average hydrodynamic diameter of the chitosan and PEG-coated CoFe2O4 ferrite nanoparticles are 156 and 187 nm, and their PDIs are 0.349 and 0.237, respectively. The average hydrodynamic diameter of the chitosan and PEG-coated Fe3O4 ferrite nanoparticles are 110 and 118 nm, with PDIs of 0.248 and 0.224 respectively. The hydrodynamic diameter and polydispersity index values of all samples presented in Figure 6 and Table 4 suggests that these particles are suitable for biomedical applications. For all the samples, it appears that the PEG-coated nanoparticles have larger diameters, suggesting that the sphere of hydration is larger in PEG coating than in chitosan coating. The sizes of the dry particles (from TEM) are comparable for both the chitosan and PEG-coated nanoparticles. In the dry state, the increases in particle size upon coating ranged from 2 to 5 nm.
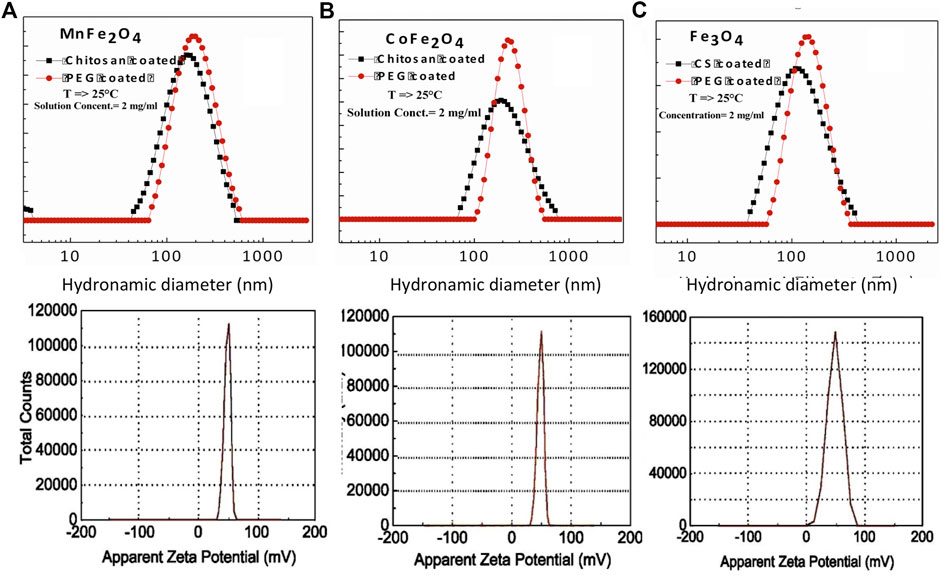
FIGURE 6. Hydrodynamic diameter, polydispersity index, and Zeta potential of chitosan-coated (A) MnFe2O4, (B) CoFe2O4 and (C) Fe3O4 nanoparticles as determined by DLS.
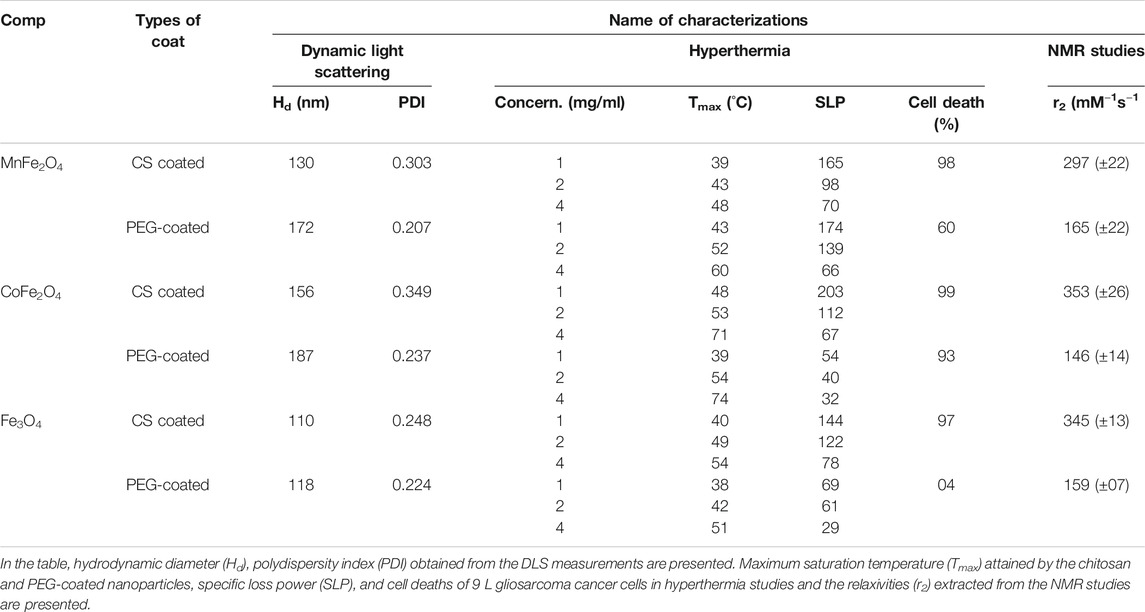
TABLE 4. Data extracted from DLS, hyperthermia, and NMR studies of MnFe2O4, CoFe2O4, and Fe3O4 ferrite nanoparticles coated with chitosan, PEG are presented.
Raman Spectroscopy
Raman spectroscopy of bare and chitosan-coated MnFe2O4 (a), CoFe2O4 (b) Fe3O4 (c) are presented in Figure 7. Raman spectra of the bare and coated MnFe2O4 showed a peak at 625 and 642 cm−1. For the CoFe2O4 nanoparticles, peaks were observed at 457, 628 cm−1 for the bare samples, and 465 cm−1 for the coated sample. The 628 cm−1 peaks were severely suppressed upon coating. The bare Fe3O4 nanoparticles also showed peaks 485 and 662 cm−1 which were suppressed upon coating. All peaks of these samples confirmed their spinel structure. Peaks at 473 and 564 cm−1 represent 3T2g mode. This mode represents the antisymmetric bending of an oxygen atom in metal-oxygen ions at an octahedral sublattice. The peak at 300 cm−1 represents the symmetric bending of oxygen modes Eg in metal-oxygen ions at octahedral sublattice. The peaks at 619 and 689 cm−1 represents A1g modes that are related to the motion of oxygen around metal ions at the tetrahedral sites. Since chitosan is characterized by very high absorption, the intensities of the coated peaks are weaker compared to their bare counterparts.

FIGURE 7. Raman spectra of bare (black) and chitosan-coated (red) MnFe2O4(A) CoFe2O4(B) and Fe3O4(C) nanoparticles.
Hyperthermia Measurements
Figure 8 shows the induction heating properties of chitosan-coated MnFe2O4, CoFe2O4, and Fe3O4 nano ferrite solutions. Sample temperatures increased with exposure time and concentration of the nanoparticles. The maximum temperature and the specific loss power (SLP) determined from Figure 8 are listed in Table 4. We observe that the maximum temperature attained by the chitosan-coated MnFe2O4 nanoparticles of concentrations 4, 2, and 1 mg/ml are 48, 43, and 39°C, respectively, whereas the maximum temperatures attained by the CoFe2O4 solutions of concentrations 4, 2, and 1 mg/ml are 71, 53 and 48°C, respectively. The chitosan-coated Fe3O4 solutions at those same concentrations rose to 54, 49, and 40°C, respectively. The temperature range of 42–46°C is mostly suitable for hyperthermia applications. The linear fitting graph of chitosan-coated MnFe2O4, CoFe2O4, and Fe3O4 at different concentrations with temperatures is presented in Figure 8D. The results show a relationship between the maximum temperatures and the nanoparticle concentrations, suggesting that the desired heating profile may be tuned by adjusting the concentration of the nanoparticles.
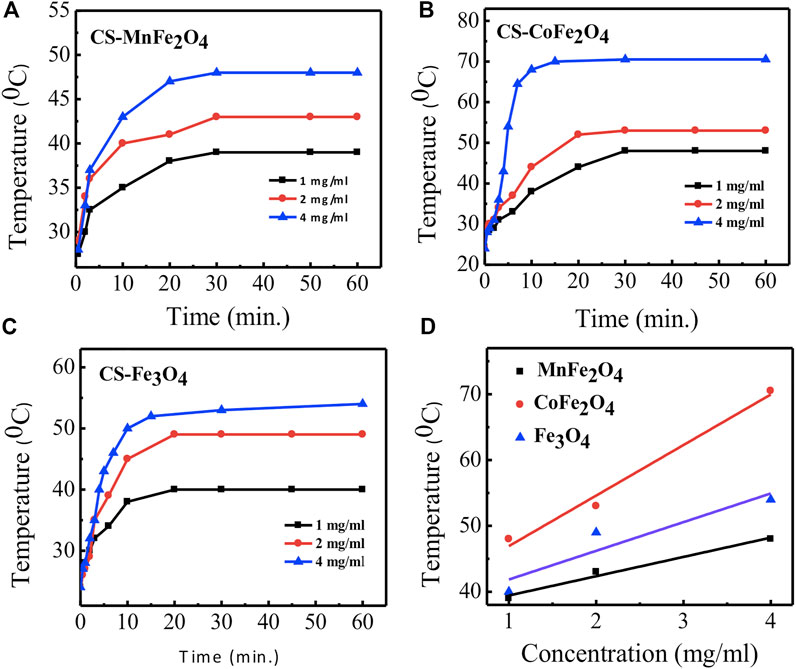
FIGURE 8. Time dependence of temperature rise of particles at a concentration of 1, 2, and 4 mg/ml in water for different compositions coated with chitosan (A) MnFe2O4(B) CoFe2O4(C) Fe3O4(D) linear fitting graphs of concentration dependence of temperature rise of particles for different compositions coated with chitosan by using the radio frequency field of 400 kHz and 76 mT for 60 min.
The time dependence of temperature graphs of PEG-coated MnFe2O4, CoFe2O4, and Fe3O4 nano ferrites with different concentrations are shown in Figures 9A–C, respectively. The results indicate that CoFe2O4 samples at 4, 2, and 1 mg/ml concentrations attained the maximum temperatures of 60, 52, 43°C, respectively. MnFe2O4 and Fe3O4 attained the maximum temperatures of 74, 54, and 39°C and 51, 42, and 38°C, respectively, at the same concentrations. The linear dependence of the maximum temperature with the concentrations of PEG-coated MnFe2O4, CoFe2O4, and Fe3O4 is shown in Figure 9D and demonstrates that the heat can be tuned by adjusting the concentration of the nano ferrites.
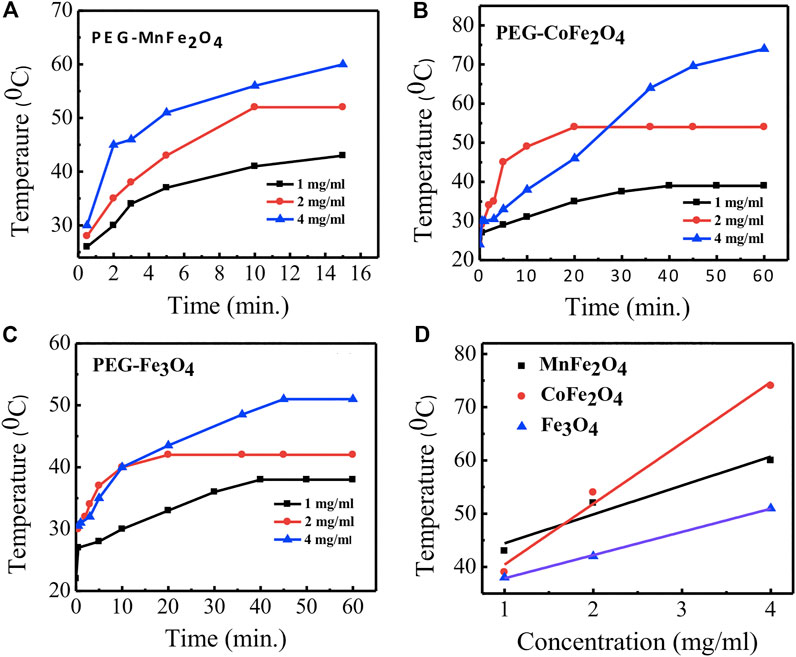
FIGURE 9. Time dependence of temperature rise of particles at a concentration of 1, 2, and 4 mg/ml in water for different compositions coated with PEG (A) MnFe2O4(B) CoFe2O4(C) Fe3O4(D) linear fitting graphs of concentration dependence of temperature rise of particles for different compositions coated with PEG by using a radio frequency (RF) field of 400 kHz and 76 mT for 60 min.
SLP decreased with increasing the temperature and concentration of the nanoparticle suspensions. The SLP refers to the amount of heat generated by the particles per unit volume of suspension per unit time and is an important factor affecting the hyperthermia effects. The results are shown in Table 4 and Figure 10 suggest that the samples in the present study are suitable for hyperthermia applications in cancer therapy.
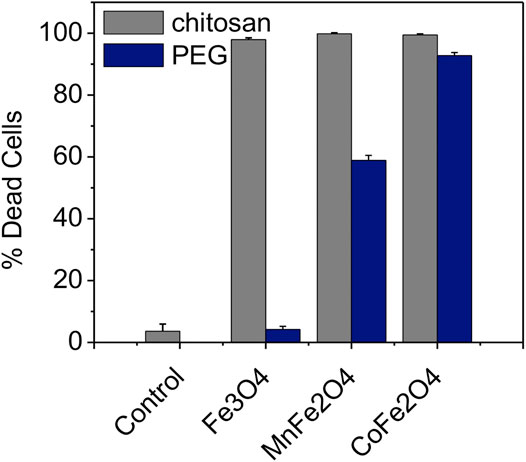
FIGURE 10. Necrosis of 9 L tumor cells induced by 30 min of rf induction heating for chitosan (gray bars) and PEG-coated (blue bars) Fe3O4, MnFe2O4, and CoFe2O4 nanoparticles. The concentration for all samples was 2 mg/ml in PBS (H = 76 mT and f = 400 kHz). Control cells were exposed to rf heating without particles (just PBS).
Figure 10 shows the mortality of 9 L gliosarcoma cells caused by induction heating in the presence of chitosan and PEG-coated nanoensembles as evaluated by the cell viability assay along with the control cells dispersed in the media. In this study, the concentration of the nanoparticles was 2 mg/ml in PBS while the field amplitude (H) was 76 mT and the frequency (f) was 400 kHz. The temperature of the pure water or PBS rose by only 2°C (i.e. from 24 to 26°C). It was found that after 24 h of incubation with the nanoparticle concentration of 2 mg/ml, cells were viable at both chitosan and PEG-coated compositions of MnFe2O4; CoFe2O4, and Fe3O4 with membrane and shape integrity similar to the cells in the control group. The cells remained unaffected during induction heating at this RF field without nanoparticles (control). The mortality of the cancer cells are presented in Table 4. The high mortality of cancer cells nearly (98, 99, and 97%) showed by chitosan-coated MnFe2O4, CoFe2O4, and Fe3O4 ferrite nanoparticles, respectively were higher than those of the PEG-coated MnFe2O4, CoFe2O4 and Fe3O4 ferrite nanoparticles (60, 93, and 04%). The cells were polarized at the center of the Eppendorf tubes where the intensity of the RF magnetic field generated by the induction coil was maximum. When the tubes were withdrawn from the magnetic field, the cells redispersed in the media. This suggests that the nanoparticles were attached to or taken up by the cells. A detailed study on the cellular uptake of the nanoparticles by the cancer cells will be carried out in the future.
Nuclear Magnetic Resonance and Magnetic Resonance Imaging
The relaxation rates of ferrite nanoensembles coated with chitosan and PEG were measured at various nanoparticle concentrations and times. Concentration dependence of T2 relaxation rates of ferrite nanoensembles has been measured by MRI (Figure 11). Each of these figures shows the transverse R2 relaxation rates (R2 = 1/T2) for samples with different biocompatible coating materials using five different concentrations from 0.11 to 0.55 mM. The linear relationship between R2 relaxation rates and concentration suggests that these nano ferrites could be utilized as MRI contrast agents. The transverse relaxivity r2 was determined from the slope of the linear fit. The relaxivities r2 of chitosan-coated MnFe2O4, CoFe2O4, and Fe3O4 ferrite nanoensembles were 297 (±22), 353 (±26), and 345 (±13) mM−1s−1, respectively, while those of the PEG-coated counterparts were 165 (±22), 146 (±14) and 159 (±07) mM−1s−1, respectively (Table 4). While comparing the r2 values of nanoensembles with different coating materials, we observed that the r2 value of CoFe2O4 is higher than Fe3O4 and possesses higher magnetization than that of Fe3O4 (Joshi et al., 2009). For all three ferrite nanoensambles, the r2 of the chitosan-coated nanoparticles was consistently higher than those of the PEG-coated nanoparticles. This could be explained in part by the smaller hydrodynamic diameters of the chitosan-coated nanoparticles relative to their PEG-coated counterparts as r2 depends on the coating element, particle size, and shape (Na et al., 2009). Smaller particles move faster and interact with more water protons leading to higher dephasing of the magnetic field as a result of which relaxivity increases (Hong et al., 2010).

FIGURE 11. NMR relaxivity profiles and concentration dependence of relaxation rate (1/T2 = R2) of nanoparticles with coating agents chitosan and PEG for (A) MnFe2O4(B) CoFe2O4 and (C) Fe3O4 ferrite nanoparticles.
In vitro MRI imaging was carried out with chitosan-coated nanoensembles with different concentrations in small glass tubes of 5 mm diameter. Figure 12 shows T2 weighted images were acquired using a spin-echo sequence, while T2* images were acquired using a gradient echo sequence and analyzed by MATLAB. The concentrations of the nanoparticles used in this experiment are in the range of 0.01 to 0.05 mg/ml. MRI images indicate a significant difference in R2 relaxation rates in each tube. The phantom images in Figure 12 shows that the relaxation of all three ferrites are quite high, CoFe2O4 being the highest.
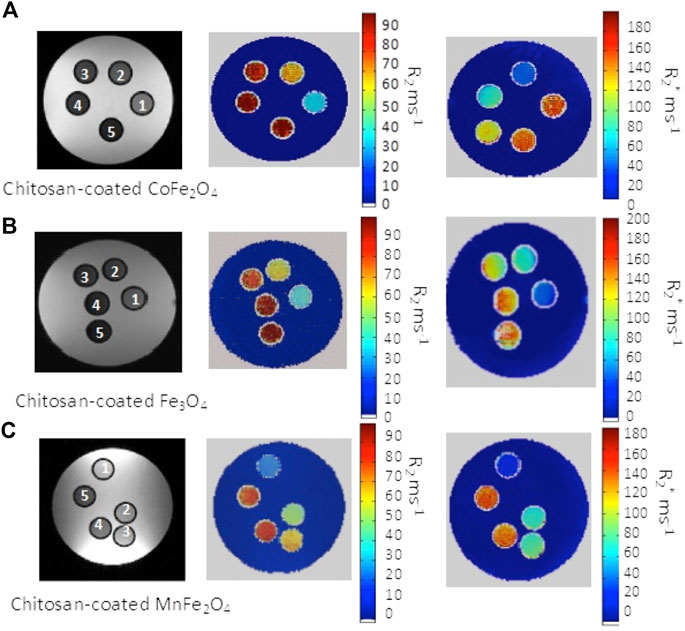
FIGURE 12. In vitro MR images of water phantoms containing chitosan coated (A) CoFe2O4, (B) Fe3O4 and (C) MnFe2O4 spinel ferrites of inside the five tubes at different concentration demonstrating contrast for each composition with respect to water (in each image 1 to 5 represents lowers to higher concentration) with T2 weighted spin-echo image and R2 and R2* mapping are pressented.
Conclusion
In summary, spinel ferrite nanoensembles were prepared by the chemical co-precipitation method. We determined that all samples have dimensions in the nanometer range and single-phase cubic spinel structure. We also concluded that MnFe2O4 is superparamagnetic while CoFe2O4 and Fe3O4 nanoparticles are ferromagnetic. Higher relaxivity values r2 were obtained for all compositions, and the induction heating efficacy of these samples indicate possible use for hyperthermia applications. Besides, this work demonstrates that biocompatible chitosan and PEG-coated nanoparticles can be used also as potential MRI contrast agents although the relaxivity values are half for PEG-coated samples than the chitosan-coated samples. We determined also that although chitosan-coated all three ferrites are equally efficient to cause the mortality of the cancer cells, the PEG-coated MnFe2O4 and CoFe2O4 ferrite nanoparticles are more efficient for cell death while Fe3O4 could not play a role to destroy the cancer cells. Finally, spinel ferrite nanoensembles are more promising as both hyperthermia and MRI contrast agents while coating plays an important role in determining the efficiencies of them.
Data Availability Statement
The original contributions presented in the study are included in the article/Supplementary material, further inquiries can be directed to the corresponding author.
Author Contributions
SH and MI were involved in the synthesis and functionalization of nanoparticles, SH was involved in hyperthermia, SH and MI were involved in the studies of TEM, DLS, Zeta potential and Mossbauer, FTIR and Raman spectroscopy, SH, DC, and SM were involved in the NMR and MRI studies. All the authors were involved in the manuscript preparation and editing.
Funding
The authors express gratitude for the support from the NIH grants R01 CA-140102 (to FH), R01 EB-011968 (to FH), P30 NS-052519 (to FH). Funding provided by the International Science Programme, Uppsala University, Sweden to BAN-02/2 is highly acknowledged. The authors also appreciate greatly the Nano-5003 project of the Annual Development Programme of Planning Commission, Bangladesh.
Conflict of Interest
The authors declare that the research was conducted in the absence of any commercial or financial relationships that could be construed as a potential conflict of interest.
Acknowledgments
The authors acknowledge greatly the Dept. of Diagnostic Radiology, Yale University, the United States. The authors are also grateful to the Bangladesh Atomic Energy Commission for the support provided to perform this research.
References
Abdelbary, G. (2011). Ocular Ciprofloxacin Hydrochloride Mucoadhesive Chitosan-Coated Liposomes. Pharm. Dev. Technol. 16 (11), 44–56. doi:10.3109/10837450903479988
Batra, J., Robinson, J., Mehner, C., Hockla, E., Miller, E., Radisky, D. C., et al. (2012). PEGylation Extends Circulation Half-Life while Preserving In Vitro and In Vivo Activity of Tissue Inhibitor of Metalloproteinases-1 (TIMP-1). PLoS One 7, e50028. doi:10.1371/journal.pone.0050028
Cannas, C., Ardu, A., Musinu, A., Peddis, D., and Piccaluga, G. (2008). Spherical Nanoporous Assemblies of Iso-Oriented Cobalt Ferrite Nanoparticles: Synthesis, Microstructure, and Magnetic Properties. Chem. Mater. 20, 6364–6371. doi:10.1021/cm801839s
Danaei, M., Dehghankhold, M., Ataei, S., Hasanzadeh Davarani, F., Javanmard, R., Dokhani, A., et al. (2018). Impact of Particle Size and Polydispersity Index on the Clinical Applications of Lipidic Nanocarrier Systems. Pharmaceutics 10 (2), 57–64. doi:10.3390/pharmaceutics10020057
Dobson, J. (2008). Magnetic Nanoparticles for Gene and Drug Delivery. Int. J. Nanomedicine 3 (2), 169–180. doi:10.2147/ijn.s1608
Driscoll, D. F. (2007). Globule-size Distribution in Injectable 20% Lipid Emulsions: Compliance with USP Requirements. Am. J. Health Syst. Pharm. 64 (19), 2032–2036. doi:10.2146/ajhp070097
Fortin, J. P., Wilhelm, C., Servais, J., Ménager, C., Bacri, J. C., and Gazeau, F. (2007). Size-sorted Anionic Iron Oxide Nanomagnets as Colloidal Mediators for Magnetic Hyperthermia. J. Am. Chem. Soc. 129 (9), 2628–2635. doi:10.1021/ja067457e
Gazeau, F., Lévy, M., and Wilhelm, C. (2008). Optimizing Magnetic Nanoparticle Design for Nanothermotherapy. Nanomedicine 3 (6), 831–844. doi:10.2217/17435889.3.6.831
Hong, S., Chang, Y., and Rhee, I. (2010). Chitosan-coated Ferrite (Fe3O4) Nanoparticles as a T2 Contrast Agent for Magnetic Resonance Imaging. J. Korean Phys. Soc. 56 (3), 868–873. doi:10.3938/jkps.56.868
Hoque, S. M., Hossain, M. S., Choudhury, S., Akhter, S., and Hyder, F. (2016a). Synthesis and Characterization of ZnFe2O4 Nanoparticles and its Biomedical Applications. Mater. Lett. 162, 60–63. doi:10.1016/j.matlet.2015.09.066
Hoque, S. M., Huang, Y., Cocco, E., Maritim, S., Santin, A. D., Shapiro, E. M., et al. (2016b). Improved Specific Loss Power on Cancer Cells by Hyperthermia and MRI Contrast of Hydrophilic FexCo1-xFe2O4nanoensembles. Contrast Media Mol. Imaging 11 (6), 514–526. doi:10.1002/cmmi.1713
Hoque, S. M., Tariq, M., Liba, S. I., Salehin, F., Mahmood, Z. H., Khan, M. N. I., et al. (2016c). Thermo-therapeutic Applications of Chitosan and PEG Coated NiFe2O4 Nanoparticles. Nanotechnology 27 (28), 285–702. doi:10.1088/0957-4484/27/28/285702
Issa, B., Obaidat, I., Albiss, B., and Haik, Y. (2013). Magnetic Nanoparticles: Surface Effects and Properties Related to Biomedicine Applications. Int J. Mol. Sci. 14 (11), 21266–21305. doi:10.3390/ijms141121266
Jordan, A., Scholz, R., Wust, P., Fähling, H., Krause, J., Wlodarczyk, W., et al. (1997). Effects of Magnetic Fluid Hyperthermia (MFH) on C3H Mammary Carcinomain Vivo. Int. J. Hyperthermia 13 (6), 587–605. doi:10.3109/02656739709023559
Joshi, H. M., Lin, Y. P., Aslam, M., Prasad, P. V., Schultz-Sikma, E. A., Edelman, R., et al. (2009). Effects of Shape and Size of Cobalt Ferrite Nanostructures on Their MRI Contrast and Thermal Activation. J. Phys. Chem. C 113 (41), 17761–17767. doi:10.1021/jp905776g
Kolhe, P., and Kannan, R. M. (2003). Improvement in Ductility of Chitosan through Blending and Copolymerization with PEG: FTIR Investigation of Molecular Interactions. Biomacromolecules 4, 173–180. doi:10.1021/bm025689+
Lee, J. H., Jang, J. T., Choi, J. S., Moon, S. H., Noh, S. H., Kim, J. W., et al. (2011). Exchange-coupled Magnetic Nanoparticles for Efficient Heat Induction. Nat. Nanotech. 6 (7), 418–422. doi:10.1038/nnano.2011.95
Lu, J., Ma, S., Sun, J., Xia, C., Liu, C., Wang, Z., et al. (2009). Manganese Ferrite Nanoparticle Micellar Nanocomposites as MRI Contrast Agent for Liver Imaging. Biomaterials 30 (15), 2919–2928. doi:10.1016/j.biomaterials.2009.02.001
Maaz, K., Karim, S., Mumtaz, A., Hasanain, S. K., Liu, J., and Duan, J. L. (2009). Synthesis and Magnetic Characterization of Nickel Ferrite Nanoparticles Prepared by Co-precipitation Route. J. Magnetism Magn. Mater. 321 (12), 1838–1842. doi:10.1016/j.jmmm.2008.11.098
McCArthy, J., and Weissleder, R. (2008). Multifunctional Magnetic Nanoparticles for Targeted Imaging and Therapy. Adv. Drug Deliv. Rev. 60 (11), 1241–1251. doi:10.1016/j.addr.2008.03.014
Na, H. B., Song, I. C., and Hyeon, T. (2009). Inorganic Nanoparticles for MRI Contrast Agents. Adv. Mater. 21 (21), 2133–2148. doi:10.1002/adma.200802366
Nguyen, T., Mammeri, F., and Ammar, S. (2018). Iron Oxide and Gold Based Magneto-Plasmonic Nanostructures for Medical Applications: A Review. Nanomaterials 8 (3), 149–177. doi:10.3390/nano8030149
Pinter, N. K., Klein, J. P., and Mechtler, L. L. (2016). Potential Safety Issues Related to the Use of Gadolinium-Based Contrast Agents. CONTINUUM: Lifelong Learn. Neurol. 22 (5), 1678–1684. doi:10.1212/con.0000000000000378
Prasad, N. K., Rathinasamy, K., Panda, D., and Bahadur, D. (2007). Mechanism of Cell Death Induced by Magnetic Hyperthermia with Nanoparticles of γ-MnxFe2-xO3 Synthesized by a Single Step Process. J. Mater. Chem. 17 (48), 5042–5051. doi:10.1039/b708156a
Rosière, R., Van Woensel, M., Gelbcke, M., Mathieu, V., Hecq, J., Mathivet, T., et al. (2018). New Folate-Grafted Chitosan Derivative to Improve Delivery of Paclitaxel-Loaded Solid Lipid Nanoparticles for Lung Tumor Therapy by Inhalation. Mol. Pharmaceutics 15 (3), 899–910. doi:10.1021/acs.molpharmaceut.7b00846
Rümenapp, C., Gleich, B., and Haase, A. (2012). Magnetic Nanoparticles in Magnetic Resonance Imaging and Diagnostics. Pharm. Res. 29 (5), 1165–1179. doi:10.1007/s11095-012-0711-y
Satalkar, M., and Kane, S. N. (2016). On the Study of Structural Properties and Cation Distribution of Zn0.75-xNixMg0.15Cu0.1Fe2O4 Nano Ferrite: Effect of Ni Addition. J. Phys. Conf. Ser. 755, 1–10. doi:10.1088/1742-6596/755/1/012050
Sharifi, I., Shokrollahi, H., and Amiri, S. (2012). Ferrite-based Magnetic Nanofluids Used in Hyperthermia Applications. J. Magnetism Magn. Mater. 324 (6), 903–915. doi:10.1016/j.jmmm.2011.10.017
Tong, S., Hou, S., Zheng, Z., Zhou, J., and Bao, G. (2010). Coating Optimization of Superparamagnetic Iron Oxide Nanoparticles for High T2Relaxivity. Nano Lett. 10 (11), 4607–4613. doi:10.1021/nl102623x
Tsai, Z. T., Wang, J. F., Kuo, H. Y., Shen, C. R., Wang, J. J., and Yen, T. C. (2010). In situ preparation of High Relaxivity Iron Oxide Nanoparticles by Coating with Chitosan: A Potential MRI Contrast Agent Useful for Cell Tracking. J. Magnetism Magn. Mater. 322 (2), 208–213. doi:10.1016/j.jmmm.2009.08.049
Vieira, A. C. C., Chaves, L. L., Pinheiro, S., Pinto, S., Pinheiro, M., Lima, S. C., et al. (2018). Mucoadhesive Chitosan-Coated Solid Lipid Nanoparticles for Better Management of Tuberculosis. Int. J. Pharmaceutics 536 (1), 478–485. doi:10.1016/j.ijpharm.2017.11.071
Wang, F. Z., Zhang, M. W., Zhang, D. S., Huang, Y., Chen, L., Jiang, S. M., et al. (2018). Preparation, Optimization, and Characterization of Chitosan-Coated Solid Lipid Nanoparticles for Ocular Drug Delivery. J. Biomed. Res. 32 (5), 411–423. doi:10.7555/JBR.32.20160170
Yamauchi, M., Tsutsumi, K., Abe, M., Uosaki, Y., Nakakura, M., and Aoki, N. (2007). Release of Drugs from Liposomes Varies with Particle Size. Biol. Pharm. Bull. 30 (5), 963–965. doi:10.1248/bpb.30.963
Keywords: spinel ferrite nanoensembles, chitosan and PEG coating, XRD, raman, mössbauer spectroscopy, hyperthermia, magnetic resonance imaging
Citation: Hoque SM, Islam MK, Hoq A, Haque MM, Maritim S, Coman D and Hyder F (2021) Comparative Study of Specific Loss Power and Transverse Relaxivity of Spinel Ferrite Nanoensembles Coated With Chitosan and Polyethylene Glycol. Front. Nanotechnol. 3:644080. doi: 10.3389/fnano.2021.644080
Received: 19 December 2020; Accepted: 06 April 2021;
Published: 26 April 2021.
Edited by:
Pratima R. Solanki, Jawaharlal Nehru University, IndiaReviewed by:
Satyabrata Mohapatra, Guru Gobind Singh Indraprastha University, IndiaPramod K. Gupta, Hanyang University, South Korea
Copyright © 2021 Hoque, Islam, Hoq, Haque, Maritim, Coman and Hyder. This is an open-access article distributed under the terms of the Creative Commons Attribution License (CC BY). The use, distribution or reproduction in other forums is permitted, provided the original author(s) and the copyright owner(s) are credited and that the original publication in this journal is cited, in accordance with accepted academic practice. No use, distribution or reproduction is permitted which does not comply with these terms.
*Correspondence: S. Manjura Hoque, bWFuanVyYV9ob3F1ZUB5YWhvby5jb20=
 S. Manjura Hoque
 M. Khairul Islam2,3
 Amitra Hoq
 Samuel Maritim
 Daniel Coman
 Fahmeed Hyder