- 1Special Centre for Nanoscience, Jawaharlal Nehru University, New Delhi, India
- 2Department of Biotechnology, Delhi Technological University, New Delhi, India
- 3School of Physical Sciences, Jawaharlal Nehru University, New Delhi, India
- 4National Institute of Immunology, New Delhi, India
Antibiotics resistance is becoming one of the biggest problems of the 21st century. The prior detection of antibiotics resistance can help human beings in better treatment of diseases. Here, we have used l-Cysteine capped magnesium sulfide quantum dots (L-Cyst-MgS QDs) to detect Levofloxacin antibiotic. L-Cyst-MgS QDs were synthesized using the hydrothermal method. Transmission electron microscopy study showed monodispersed L-Cyst-MgS QDs of 2–4 nm in size. Energy dispersive x-ray photoemission spectroscopy study confirmed the elemental composition of the L-Cyst-MgS QDs without any impurity. UV-vis absorption study showed a peak centered around 340 nm. The photoluminescence study exhibited the maximum peak at 410 nm for 340 nm of excitation wavelength. L-Cyst-MgS QDs were studied with thirteen antibiotics, namely Thiamphenicol, Gentamicin, Erythromycin, Ofloxacin, Ampicillin, Ciprofloxacin, Tetracycline, Chloramphenicol, Florfenicol, Amoxicillin, Moxifloxacin, Norfloxacin, and Levofloxacin. Among these, Levofloxacin showed the most significant change in the peaks’ intensity and was further used for the interaction study. In the interaction study, the peak corresponding to MgS showed a continuous decrease, while the peak corresponding to Levofloxacin showed an increase with the increased concentrations (0–100 μg/ml) of Levofloxacin. Linear behavior was obtained in the range of 1–90 μg/ml. FT-IR study confirmed the interaction of the Levofloxacin with L-Cyst-MgS QDs. The Time-resolved fluorescence spectroscopy showed identical lifetime for both the samples and no spectral overlap confirm the FRET free system. The underlying mechanism is explained based on the electron transfer from the conduction band of the L-Cyst-MgS QDs to the HOMO of Levofloxacin. The limit of detection was found to be 0.21 μg/ml.
Introduction
The population increase in the last two centuries has considerably increased pharmaceuticals use in society because of growing health problems. The discovery of the first antibiotic in 1928 has revolutionized the pharmaceutical industry as antibiotics can cure many diseases (Martinez et al., 2008; Adzitey, 2015). There is a considerable increase in antibiotics use since then in both human and animal hosts because of two main reasons. Firstly, because of the specific nature against bacteria and fungi (Levy, 1978; Bungau et al., 2015; Ferrone et al., 2017) and secondly, because of their capability to increase the growth rate of animals and improve their feed efficiency (Aarestrup and Wegener., 1999; Cháfer-Pericás et al., 2010; Deng et al., 2014). However, their presence in the environment is equally dangerous and alarming. If a large quantity of antibiotics is introduced in the environment, then it will give rise to bacterial resistance to antibiotics making an adverse effect on the use of antibiotics for treatment of both humans and animals (Martínez, 2008; Bungau et al., 2015; Mahmood et al., 2019). These effects necessitate the need to detect antibiotics in the environment as it is a matter of great concern in modern times. Conventionally, the methods available for detecting antibiotics are chromatography, which requires extensive equipment and preparation. The chromatography process is quite complicated since it requires accurate quantification, simultaneous detection, and high specificity based on the structural information of the analytes (Deng et al., 2014; Dai et al., 2017; Pérez et al., 2017). Other methods for antibiotic determination include electrophoresis (Dai et al., 2017; Jang et al., 2017; Ji et al., 2017), diode array (Bitas and Samanidou, 2016), or enzyme immunosorbent assay (ELISA) (Kong et al., 2017; Váradi et al., 2017), polymerase chain reaction (PCR), or immunologic reactions have been developed. While such well-established techniques are present for the detection of antibiotics, there are also some disadvantages of these techniques like costly equipment, tiring and laborious work for the preparation of samples, and a constant requirement for well-trained human resources (Chauhan et al., 2016; Yadav et al., 2020). These disadvantages give rise to the necessity of economically feasible techniques. Optical sensing of antibiotics is a solution for this significant problem since it requires fewer human resources and instruments and involves less time than other methods.
Fluorescent materials are mostly used for optical sensing applications (Sarkar et al., 2020). Among various fluorescent materials, quantum dots (QDs) have the highest fluorescence. Also, their size can be easily controlled using different capping agents and synthesis parameters. Such tunability of size allows the fluorescence emission between UV and visible range (Garimella et al., 2020; Kujur and Singh., 2020). Quantum dots as QDs only show unique optical properties, such as the dramatic enhancement of photoluminescence (PL) compared with the bulk counterpart of the same material. This happens due to the quantum confinement effect. Size is one of the significant parameters which affect the PL of a material. Several authors have shown that with the decrease in the size of the material, PL properties increases. Also, PL emission can be obtained in either the UV region or visible region. The UV region's PL spectra arise due to the direct transfer of e-from the conduction band to the valence band. The PL spectra in the visible light can be due to the material’s surface defect, giving non-radiative recombination. QDs have symmetrical fluorescence emission spectra and broad absorption spectra, having only 25–40 nm of half-width. They can also emit multicolor fluorescence when excited at the same wavelength, making them ideal optical detection materials (Alivisatos et al., 2005). The capping agent also allows for making them specific toward the detection of a particular biomolecule. Magnesium sulfide (MgS) QDs have been synthesized earlier using the hydrothermal method for using as a potential replacement of electrode material in lithium-ion batteries, but this material’s optical properties remain unexplored (Zhang et al., 2018). MgS is a well-known material for a potential replacement of electrode material in lithium-ion batteries, but this material's optical properties remain unexplored. Here, we have tried to explore the optical properties of MgS QDs. We have studied the absorption and emission characteristics of extremely small size of L-Cyst-MgS. This also helps us in understanding the effect of reduction in size on optical properties of MgS QDs. In this work, optical sensing of Levofloxacin was carried out by analyzing its interaction with L-Cyst-MgS QDs. In this context, a novel and fully optimized method for the synthesis of L-Cyst capped MgS QDs, and their specific nature antibiotic for the detection of Levofloxacin has been proposed. L-Cyst-MgS QDs were synthesized using the hydrothermal method and characterized using transmission electron microscopy (TEM), energy dispersive x-ray emission (EDX), UV-visible, and fluorescence spectroscopy. L-Cyst-MgS QDs were studied with thirteen antibiotics. Among these, Levofloxacin antibiotics showed the most significant change. Linear detection of Levofloxacin antibiotic was obtained in the 1–90 μg/ml range.
Experimental
Reagents
Magnesium nitrate [Mg(NO3)2.H2O] (98.99%) and l-cysteine (99.99%) were purchased from Sigma Aldrich, and sodium sulfide pellets [Na2S] (99.99%) was purchased from SDL. All the antibiotics i.e., Thiamphenicol, Gentamicin, Erythromycin, Ofloxacin, Ampicillin, Ciprofloxacin, Tetracycline, Chloramphenicol, Florfenicol, Amoxicillin, Moxifloxacin, Norfloxacin, Levofloxacin, were purchased from SRL, Hi-media, and Sigma Aldrich. 10 ml of 0.1 millimolar concentration was prepared for each antibiotic.
Characterizations Techniques
The obtained L-Cyst-MgS-QDs were further characterized using high-resolution transmission electron microscopy (HR-TEM; JEOL-TEM-2100F), energy dispersive x-ray spectroscopy (EDX) (Bruker), UV-vis absorption spectroscopy (T-90+UV-vis spectrometer, P. G. Instruments), and fluorescence spectroscopy (Carry Eclipse Spectrophotometer, Agilent Technologies). The interaction of L-Cyst-MgS-QDs with thirteen antibiotics was studied using fluorescence spectroscopy. The interaction study of Levofloxacin with L-Cyst-MgS-QDs was studied at various concentrations in the range of 0–100 μg/ml. These results were further confirmed with Fourier transform infrared (FT-IR-Spectrum 2-Perkin Elmer), and Fluorescence life-time decay was recorded in a commercial TCSPC setup FL-920 (Edinburgh Instruments) by exciting the samples at 375 nm using a picosecond diode laser (pulse width ∼60 ps).
Synthesis of L-Cyst Capped MgS QDs
Magnesium nitrate [Mg(NO3)2.H2O] (98.99%) powder and sodium sulfide pellets [Na2S] (99.99) were mixed with l-Cysteine in various concentrations till the solution becomes transparent. This solution was placed in a hydrothermal teflon vessel and kept in a steel chamber for hydrothermal synthesis at 200°C for 4 h. The obtained solution was the first centrifuge for 30 min and then dialyzed overnight to remove the impurities.
Results and Discussions
Transmission Electron Microscopy (TEM) Analysis
TEM study was carried out to observe the structure and the particle size of the synthesized QDs. Figure 1A shows the HR-TEM image of L-cyst-MgS-QDs. The d spacing calculated from the lattice fringes was found to be 3.5 Å. Figure 1B shows images of TEM of L-cyst-MgS-QDs showing uniformly distributed L-Cyst-MgS-QDs. It can be seen from the image that the L-cyst-MgS-QDs size is very small and monodispersed. The size of the QDs was calculated using a histogram and fitted with the gaussian function [Figure 1C] and obtained the average size ranging from 2 to 4 nm. TEM study shows that we have synthesized small size quantum dots with high surface area to volume ratio capped with l-Cysteine.
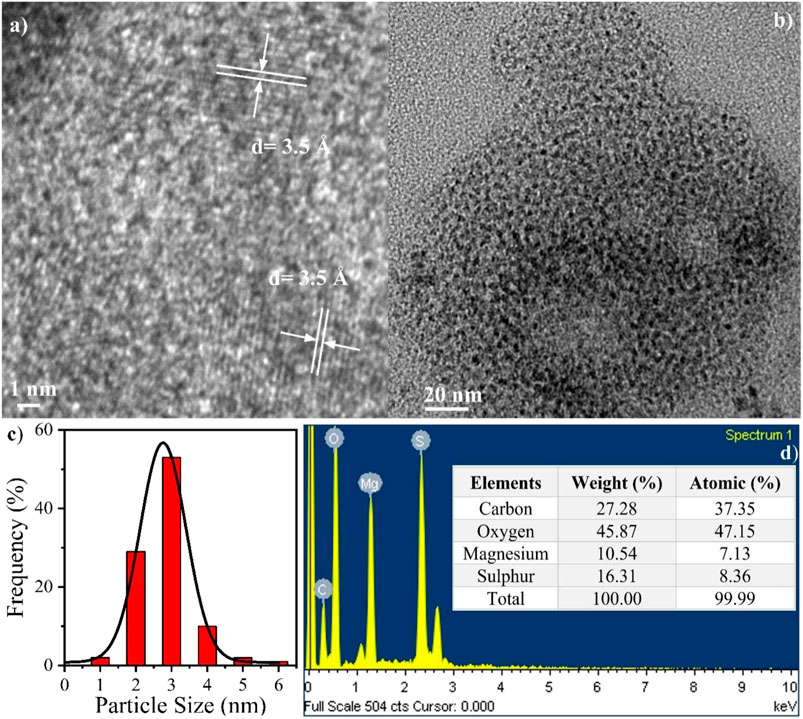
FIGURE 1. (A) HR-TEM image, (B) TEM image, (C) size distribution bar plot fitted with Gaussian function, and (D) EDX results showing the constituent elements, and the inset Table shows the corresponding weight and atomic distribution.
Figure 1D shows EDX measurement to find the elemental composition. It can be seen from Figure 1D that the elemental composition of L-cyst-MgS-QDs consists of carbon, oxygen, magnesium, and sulfur (Sankararamakrishnan et al., 2019). Carbon and oxygen confirm the l-cysteine presence, while Mg and S confirm the presence of MgS. The inset of Figure 1D shows the Table for the elemental composition and their percentage by weight and atomic weight. It can be seen from the Table, the total weight and atomic of all the elements compose of L-cyst-MgS-QDs is 100 and 99.99%, respectively. This shows that the reaction was completed, and no residual precursor was left over after completing the reaction. Also, the atomic ratio of Mg and sulfur is nearly equal in the 1:1 ratio; results confirm the formation of L-cyst-MgS-QDs (Hu et al., 2010). TEM and EDX studies confirm the formation of pure and small size L-cyst-MgS-QDs without any impurity. These L-cyst-MgS-QDs were further studied using a UV-vis spectrometer and fluorescence spectrophotometer to study their optical properties.
UV-Vis Absorption Spectra and Fluorescence Study of L-Cyst-MgS-QDs
UV-VIS absorption spectrum and fluorescence emission spectra of L-Cyst-MgS QDs are shown in Figure 2. UV- vis absorption spectrum was recorded in the wavelength range of 270–430 nm. A small hump was obtained in L-Cyst-MgS QDs at a wavelength of 310 nm as shown in Figure 2A. The first peak hump around 320 nm is due to the σ - σ transition of an electron from sigma bond between Mg and S. The second hump at around 400 nm is due to the n-σ* transition due to lone pair electron of sulfur and sigma bond of Mg. The UV- vis absorption spectrum of Levofloxacin shows two peaks at 292 nm and 330 nm. Out of which broad peak at 292 nm indicate the n → π* transition while other peak at 330 nm shows the π → π* transition (Mat Amin et al., 2012). Figure 2B shows the fluorescence spectra obtained at different excitation wavelengths in the range of 260–360 nm. The fluorescence spectra were recorded for the varying excitation wavelengths of 300–350 nm. The highest emission was obtained at a wavelength of 410 nm for an excitation wavelength of 340 nm. These results indicate that L-Cyst- MgS QDs is an excellent candidate to study antibiotics’ interaction using fluorescence spectroscopy. The quantum yield of L-Cyst-MgS QDs was calculated against the reference (quinine sulfate) that’s already known. The absorbance and photoluminescence (PL) spectrum of quinine sulfate were obtained using photometry at 340 nm. The quantum yield was found to be 2%.
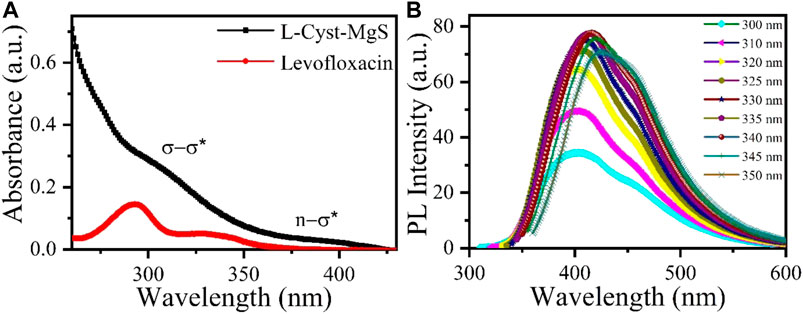
FIGURE 2. (A) UV-Vis absorption spectra of L-Cyst-MgS-QDs and Levofloxacin and (B) shows the fluorescence spectra of L-Cyst-MgS-QDs for varying wavelengths.
Response Study of L-Cyst-MgS-QDs With Levofloxacin
L-Cyst-MgS-QDs were studied with thirteen antibiotics using fluorescence spectroscopy as shown in Figure 3A. The thirteen antibiotics are Thiamphenicol, Gentamicin, Erythromycin, Ofloxacin, Ampicillin, Ciprofloxacin, Tetracycline, Chloramphenicol, Florfenicol, Amoxicillin, Moxifloxacin, Norfloxacin and Levofloxacin. The experiment was performed by adding 200 µL of L-Cyst-MgS-QDs into a solution of 200 μL of each antibiotic (1 mg/ml) and 2.6 ml of DI and the responses were recorded. The area was calculated for each study and a bar graph was plotted to see the specific detection of the L-Cyst-MgS-QDs toward Levofloxacin. Figure 3A shows the area under the curve for the response of the fluorescence signal. The area under the curve for Levofloxacin is considerably higher than that of the other antibiotics. Figures 3B,C show the image of all the antibiotics under visible light and UV light, respectively. The most significant change in the intensity can be observed for Levofloxacin. These results demonstrate the high selectivity of L-Cyst-MgS-QDs toward Levofloxacin. Figure 3B shows the response study of the L-Cyst-MgS-QDs with varying Levofloxacin concentrations in the physiological range of 0–100 μg/ml. It can be seen from Figure 3B that with the increase in the Levofloxacin concentration, the peak corresponding to L-Cyst-MgS-QDs (410 nm) is decreasing; however, the peak corresponding to the Levofloxacin is increasing (480 nm). The inset of Figure 3B shows the calibration curve obtained using the area under the curve for each concentration and plotted against the Levofloxacin concentration. Good linearity of 0.95 was obtained from the linear fit of the experimental data. Also, from this curve, it can see that the linear range was obtained from 1 to 90 μg/ml. Using this linearity plot, the limit of detection (LOD) was found to be 0.21 μg/ml. These studies suggest that L-Cyst-MgS-QDs is a suitable material for the detection of Levofloxacin.
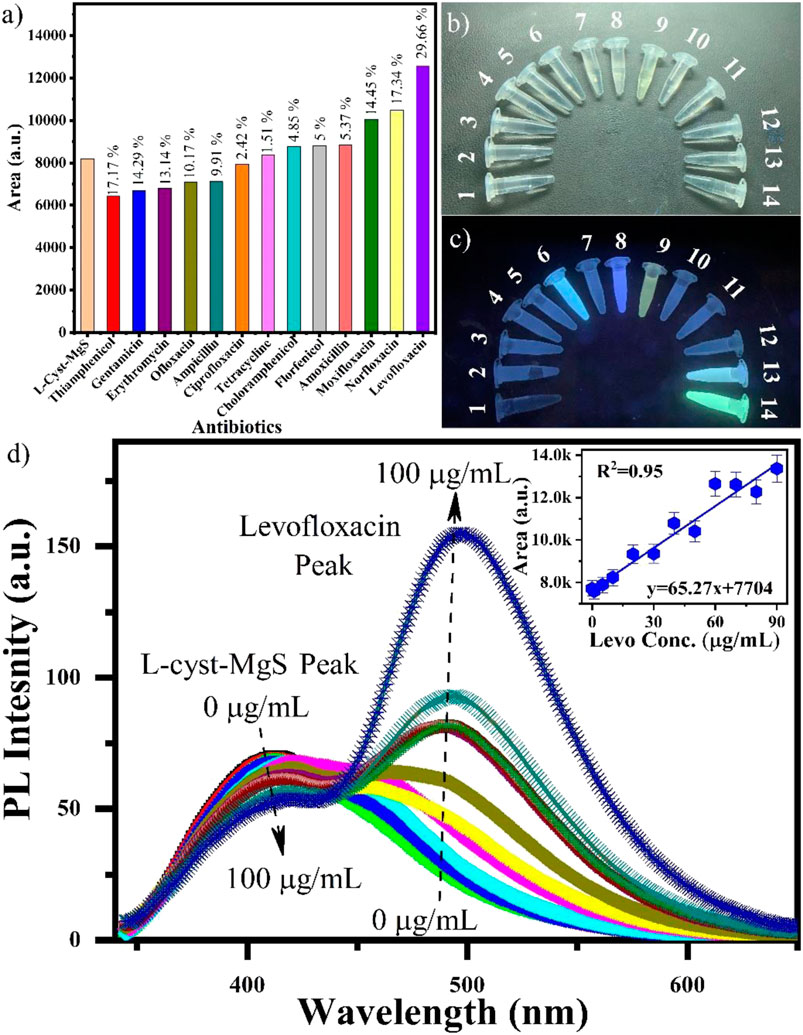
FIGURE 3. (A) Selectivity study for L-cyst-MgS with thirteen antibiotics, photographic image of all the thirteen antibiotics 1: L-Cyst-MgS, 2: Thiamphenicol, 3: Gentamicin, 4: Erythromycin, 5: Ofloxacin, 6: Ampicillin, 7: Ciprofloxacin, 8: Tetracycline, 9: Chloramphenicol, 10: Florfenicol, 11: Amoxicillin, 12: Moxifloxacin, 13: Norfloxacin, and 14: Levofloxacin under (B) visible light, (C) UV light and (D) response study of L-cyst-MgS with Levofloxacin in the range of 0–100 g/ml concentrtion range. The inset shows the corresponding calibration curve.
FT-IR and TCSPC Studies of L-Cyst-MgS-QDs Interaction With Levofloxacin
Figure 4A shows the FT-IR study of L-Cyst-MgS-QDs and Levofloxacin. FTIR measurement was carried out in the wavenumber range between 400 and 4,000 cm−1. Figure 4A represents the l-Cysteine capped MgS and having a well-resolved peak at 1,556 and 2,920 cm−1 are ascribed the asymmetric stretching vibration of COO- and anti-symmetric stretching of -CH2. Considering the FTIR spectrum of pure l-Cysteine, the respective peak at 2,548 cm−1 corresponding to the stretching vibrations of S-H disappeared, resulting in the cleavage of the S-H bond formation of MgS bonds (Li et al., 2017). In Figure 4B, the symmetric stretching carboxylate (-COO-) peak of Levofloxacin was observed at 1,394 cm−1, while in the case of L-Cys-MgS-Levo, this peak was shifted to 1,385 cm−1, which suggests the binding of MgS with Levofloxacin (Qassim., 2015).
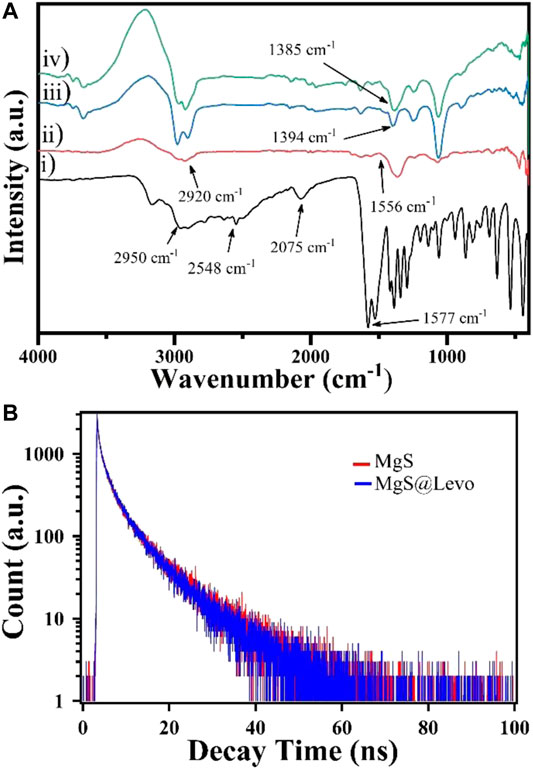
FIGURE 4. (A) FT-IR spectra of (i) l-cysteine, (ii) L-cyst-MgS, (iii) Levofloxacin and (iv) L-cyst-MgS-levofloxacin; and (B) TCSPC plot for L-cyst-MgS and L-cyst-MgS-Levofloxacin.
Figure 4B shows the time-resolved fluorescence plot of L-Cyst-MgS-QDs in the presence and absence of Levofloxacin and fitted with three exponential decay function, which is given below;
The calculated lifetime was obtained nearly 8.43 ns and 7.78 ns for MgS-QDs and Levofloxacin’s presence, respectively, by three exponential decay functions. There is a little difference of lifetime among these two systems that showed no spectral overlap. So, there is no fluorescence resonance energy transfer process took place (Yan et al., 2015). From the plotted and calculated life-time data, it is clear that Levofloxacin is not quenching the fluorescence of MgS and this interaction between MgS and Levofloxacin takes place through the electron transfer process.
L-Cyst-MgS Levofloxacin Interaction Mechanism
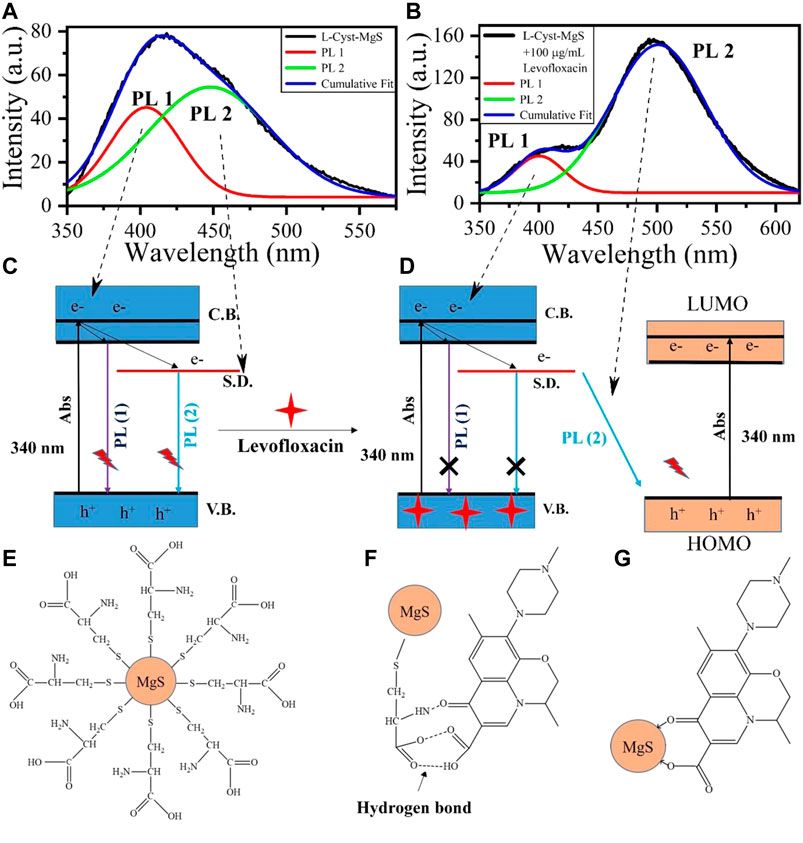
While studying the UV-absorbance curve of Levofloxacin and L-Cyst-MgS-QDs, Levofloxacin's absorption band is much closer to the UV absorbance curve of L-Cyst-MgS-QDs, allowing the transfer of electron in the L-Cyst-MgS QDs to Levofloxacin. Moreover, time-resolved fluorescence measurement also showed no significant change in the fluorescence life-time of L-Cyst-MgS-QDs-LEVO and L-Cyst-MgS QDs, as shown in Figure 4B. This excludes the fluorescence resonance energy transfer mechanism (Yan et al., 2015). Figures 5A,B shows the deconvoluted PL spectra of L-cyst-MgS and L-cyst-MgS with 100 μg/ml Levofloxacin. The spectrum was deconvoluted using the Gaussian function, and in both the spectrum, two distinct peaks were obtained. These two peaks PL 1 and PL 2 in Figure 5A have been explained according to the band diagram of L-Cyst-MgS explained in Figure 5C. The PL 1 peak in L-cyst-MgS arises due to band edge transition of excited e-from conductance band to the valence band. The PL 2 peak in L-cyst-MgS appears due to the surface defect i.e., broadband transition (Pearson., 1963; Garimella et al., 2020). In the mixture of L-Cyst-MgS QDs and Levofloxacin solution, the Levofloxacin molecules tend to come close to the surface L-Cyst-MgS QDs with the help of hydrogen bonds. This bond forms among–NH2 group of L-Cyst with the carbonyl group of Levofloxacin and similarly carboxylic group L-Cyst with a carboxylic group Levofloxacin as shown in Figure 5E. On the exposure of light at a fixed wavelength of 340 nm, the photoluminescence intensity successively decreased at 410 nm (band edge) and increased at 458 nm with the increasing concentration of Levofloxacin as shown in Figure 3D. It is because of the absorption of light at 340 nm by L-Cyst-MgS QDs, which create the electron and hole in the valence band and conduction band, respectively. The hole of MgS QDs has more tendency to trap Levofloxacin (electron-rich) because of the vicinity between MgS and Levofloxacin molecules via hydrogen bonding as shown in Figures 5F,G. Thus electron-hole recombination does not take place between them. As a result, the emission spectra of MgS become quenched as it was coming from 410 nm (PL1) and surface defect (PL2) (Figure 5D). At the same time, Levofloxacin molecules were also excited at 340 nm, which generated electron and hole in the valence band (VB) and conduction band (CB), respectively. And therefore, the electron in surface defect of MgS has an alternative route of recombination of electron-hole with HOMO (hole) of Levofloxacin. Thus, emission spectra were observed with enhanced PL intensity at 458 nm (PL3) (Figure 5D). The shifting in the PL spectra in Figure 3D is due to Levofloxacin’s interaction with the MgS molecule as shown in Figure 5G. The above results indicate that electron transfer from the MgS-QDs to Levofloxacin is responsible for the increase in Levofloxacin and a slight decrease in the intensity of L-Cyst-MgS-QDs.
Conclusion
L-Cyst capped MgS QDS were synthesized using the hydrothermal method. TEM study showed that L-Cyst-MgS QDs have a size distribution from 2 to 4 nm and are very well dispersed. EDX study confirmed the completion of the reaction and formation of L-Cyst-MgS QDs without any impurity. UV absorbance study revealed maximum absorption in the range of 300–350 nm for L-Cyst-MgS. In the photoluminescence (PL) study, maximum emission was obtained at 410 nm for 340 nm of excitation for L-Cyst-MgS. Among Thiamphenicol, Gentamicin, Erythromycin, Ofloxacin, Ampicillin, Ciprofloxacin, Tetracycline, Chloramphenicol, Florfenicol, Amoxicillin, Moxifloxacin, Norfloxacin, Levofloxacin antibiotics, Levofloxacin showed the most significant change in PL spectra. Linear detection of Levofloxacin was obtained in the `range of 1–90 g/ml. The Time-resolved fluorescence spectroscopy showed identical lifetime for both the samples and no spectral overlap confirm the FRET free system. This was further confirmed using Fourier Transform infrared spectroscopy. The underlying mechanism can be explained based on the electron transfer from the conduction band of the L-Cyst-MgS QDs to the HOMO of Levofloxacin. The limit of detection (LOD) was found to be 0.21 μg/ml.
Data Availability Statement
The raw data supporting the conclusions of this article will be provided after corresponding authors consent.
Author Contributions
AK and PS have formulated the concept. ZH and TD have carried out the synthesis and characterization experiments. RK has helped in formulating the mechanism. JS helped in drafting the revised manuscript. AS and NC helped during measurements.
Conflict of Interest
The authors declare that the research was conducted in the absence of any commercial or financial relationships that could be construed as a potential conflict of interest.
Acknowledgments
The authors would like to thanks the Department of Biotechnology (DBT), India Indo-Russia project (DBT/IC-2/Indo-Russia/2017-19/02), and Department of Science and Technology (DST), India TDP/BDTP/24/2019 and ICMR, India (34/13/2019-TF Nano/BMS), Government of India, for financial support. The authors also acknowledge the Advanced Instrument Research Facility (AIRF), JNU, New Delhi.
References
Aarestrup, F. M., and Wegener, H. C. (1999). The effects of antibiotic usage in food animals on the development of antimicrobial resistance of importance for humans in Campylobacter and Escherichia coli. Microb. Infect. 1, 639–644. doi:10.1016/s1286-4579(99)80064-1
Adzitey, F. (2015). Antibiotic classes and antibiotic susceptibility of bacterial isolates from selected poultry; a mini review.
Alivisatos, A. P., Gu, W., and Larabell, C. (2005). Quantum dots as cellular probes. Annu. Rev. Biomed. Eng. 7, 55–76. doi:10.1146/annurev.bioeng.7.060804.100432
Bitas, D., and Samanidou, V. F. (2016). Effective cleanup for the determination of six quinolone residues in shrimp before HPLC with diode array detection in compliance with the European Union Decision 2002/657/EC. J. Separ. Sci. 39, 4805–4811. doi:10.1002/jssc.201600945
Bungau, S., Suciu, R., Bumbu, A., Cioca, G., and Tit, D. (2015). Study on hospital waste management in medical rehabilitation clinical hospital. J. Environ. Prot. Ecol. Baile Felix. 16, 980–987.
Cháfer-Pericás, C., Maquieira, Á., and Puchades, R. (2010). Fast screening methods to detect antibiotic residues in food samples. Trac. Trends Anal. Chem. 29, 1038–1049. doi:10.1016/j.trac.2010.06.004
Chauhan, R., Singh, J., Sachdev, T., Basu, T., and Malhotra, B. (2016). Recent advances in mycotoxins detection. Biosens. Bioelectron. 81, 532–545. doi:10.1016/j.bios.2016.03.004
Dai, T., Duan, J., Li, X., Xu, X., Shi, H., and Kang, W. (2017). Determination of sulfonamide residues in food by capillary zone electrophoresis with on-line chemiluminescence detection based on an Ag(III) complex. Int. J. Mol. Sci. 18, 1286. doi:10.3390/ijms18061286
Deng, F. Y., Huang, C. X., and Liu, Y. (2014). Determination of Levofloxacin in chicken tissue, manure and serum by self-ordered ring fluorescent microscopic imaging. J. Anal. Chem. 69, 283–289. doi:10.1134/s1061934814030046
Ferrone, V., Cotellese, R., Di Marco, L., Bacchi, S., Carlucci, M., Cichella, A., et al. (2017). Meropenem, Levofloxacin and linezolid in human plasma of critical care patients: a fast semi-automated micro-extraction by packed sorbent UHPLC-PDA method for their simultaneous determination. J. Pharmaceut. Biomed. Anal. 140, 266–273. doi:10.1016/j.jpba.2017.03.035
Garimella, L. B. V. S., Dhiman, T. K., Kumar, R., Singh, A. K., and Solanki, P. R. (2020). One-step synthesized ZnO np-based optical sensors for detection of aldicarb via a photoinduced electron transfer route. ACS Omega 5 (6), 2552–2560. doi:10.1021/acsomega.9b01987
Hu, J., Chen, Z., Chen, H., Chen, H., Song, Y., Sun, Y., et al. 2010). Single-crystal MgS nanotubes: synthesis and properties. CrystEngComm 12, 1286–1289. doi:10.1039/b919643a
Jang, M. G., Jang, M. D., and Park, J. (2017). Doxycycline as a new chiral selector in capillary electrophoresis. J. Chromatogr. A 1508, 176–181. doi:10.1016/j.chroma.2017.06.019
Ji, H., Wu, Y., Duan, Z., Yang, F., Yuan, H., and Xiao, D. (2017). Sensitive determination of sulfonamides in environmental water by capillary electrophoresis coupled with both silvering detection window and in-capillary optical fiber light-emitting diode-induced fluorescence detector. Electrophoresis 38, 452–459. doi:10.1002/elps.201600364
Kong, D., Xie, Z., Liu, L., Song, S., Kuang, H., and Xu, C. (2017). Development of ic-ELISA and lateral-flow immunochromatographic assay strip for the detection of vancomycin in raw milk and animal feed. Food Agric. Immunol. 28, 414–426. doi:10.1080/09540105.2017.1293014
Kujur, V. S., and Singh, S. (2020). Structural, magnetic, optical and photocatalytic properties of GaFeO3 nanoparticles synthesized via non-aqueous solvent-based sol–gel route. J. Mater. Sci. Mater. Electron. 31, 17633–17646. doi:10.1007/s10854-020-04318-2
Levy, S. B. (1978). Emergence of antibiotic-resistant bacteria in the intestinal flora of farm inhabitants. J. Infect. Dis. 137, 689–690. doi:10.1093/infdis/137.5.688
Li, L., Liao, L., Ding, Y., and Zeng, H. (2017). Dithizone-etched CdTe nanoparticles-based fluorescence sensor for the off-on detection of cadmium ion in aqueous media. RSC Adv. 7 (17), 10361–10368. doi:10.1039/c6ra24971j
Mahmood, A. R., Al-Haideri, H. H., and Hassan, F. M. (2019). Detection of antibiotics in drinking water treatment plants in Baghdad City, Iraq. Health: Advance Pub.
Martinez, J. L., Fajardo, A., Garmendia, L., Hernandez, A., Linares, J. F., Martínez-Solano, L., et al. (2008). A global view of antibiotic resistance. FEMS Microbiol. Rev. 33, 44–65. doi:10.1111/j.1574-6976.2008.00142.x
Martínez, J. L. (2008). Antibiotics and antibiotic resistance genes in natural environments. Science 321, 365–367. doi:10.1126/science.1159483
Mat Amin, K. A., Gilmore, K. J., Matic, J., Poon, S., Walker, M. J., Wilson, M. R., et al. (2012). Polyelectrolyte complex materials consisting of antibacterial and cell-supporting layers. Macromol. Biosci. 12 (3), 374–382. doi:10.1002/mabi.201100317
Pearson, R. G. (1963). Hard and soft acids and bases. J. Am. Chem. Soc. 85 (22), 3533–3539. doi:10.1021/ja00905a001
Pérez, R. A., Albero, B., Férriz, M., and Tadeo, J. L. (2017). Analysis of macrolide antibiotics in water by magnetic solid-phase extraction and liquid chromatography-tandem mass spectrometry. J. Pharmaceut. Biomed. Anal. 146, 79–85. doi:10.1016/j.jpba.2017.08.013
Qassim, A. W. (2015). Determination of Levofloxacin in pharmaceutical formulation tavanic by Visible spectrophotometry of its chelating complex with aluminum ion (iii). Int. J. Dev. Res. 5 (6), 4702–4706.
Sankararamakrishnan, N., Singh, R., and Srivastava, I. (2019). Performance of novel MgS doped cellulose nanofibres for Cd(II) removal from industrial effluent – mechanism and optimization. Sci. Rep. 9, 12639–12648. doi:10.1038/s41598-019-49076-2
Sarkar, T., Dhiman, T., Sajwan, R., Sri, S., and Solanki, P. R. (2020). Studies on carbon-quantum-dot-embedded iron oxide nanoparticles and their electrochemical response. Nanotechnology 31 (35), 355502. doi:10.1088/1361-6528/ab925e
Váradi, L., Luo, J. L., Hibbs, D. E., Perry, J. D., Anderson, R. J., Orenga, S., et al. (2017). Methods for the detection and identification of pathogenic bacteria: past, present, and future. Chem. Soc. Rev. 46, 4818–4832. doi:10.1039/c6cs00693k
Yadav, A. K., Dhiman, T. K., Lakshmi, G. B. V. S., Berlina, A. N., and Solanki, P. R. (2020). A highly sensitive label-free amperometric biosensor for norfloxacin detection based on chitosan-yttria nanocomposite. Int. J. Biol. Macromol. 151, 566–575. doi:10.1016/j.ijbiomac.2020.02.089
Yan, X., Li, H., Han, X., and Su, X. (2015). A ratiometric fluorescent quantum dots based biosensor for organophosphorus pesticides detection by inner-filter effect. Biosens. Bioelectron. 74, 277–283. doi:10.1016/j.bios.2015.06.020
Keywords: hydrothermal synthesis, levofloxacin antibiotic, MgS quantum dots, L-cysteine, photo-induced electron transfer
Citation: Hashmi SZH, Dhiman TK, Chaudhary N, Singh AK, Kumar R, Sharma JG, Kumar A and Solanki PR (2021) Levofloxacin Detection Using l-Cysteine Capped MgS Quantum Dots via the Photoinduced Electron Transfer Process. Front. Nanotechnol. 3:616186. doi: 10.3389/fnano.2021.616186
Received: 11 October 2020; Accepted: 08 January 2021;
Published: 17 February 2021.
Edited by:
Kumud Malika Tripathi, Indian Institute of Petroleum and Energy (IIPE), IndiaReviewed by:
Seshadri Reddy Ankireddy, Eternal University, IndiaSumit Sonkar, Malaviya National Institute of Technology, Jaipur, India
Copyright © 2021 Hashmi, Dhiman, Chaudhary, Singh, Kumar, Sharma, Kumar and Solanki. This is an open-access article distributed under the terms of the Creative Commons Attribution License (CC BY). The use, distribution or reproduction in other forums is permitted, provided the original author(s) and the copyright owner(s) are credited and that the original publication in this journal is cited, in accordance with accepted academic practice. No use, distribution or reproduction is permitted which does not comply with these terms.
*Correspondence: Anil Kumar, YW5pbGtAbmlpLmFjLmlu
†These authors have contributed equally to this work
 S. Z. H. Hashmi
 Tarun Kumar Dhiman
 Navneet Chaudhary
 Avinash Kumar Singh
 Rahul Kumar1,3
 Anil Kumar