 Carla Letizia Busceti1†
 Domenico Bucci1†
 Mariarosaria Scioli1
 Paola Di Pietro1
 Ferdinando Nicoletti1,2
 Stefano Puglisi-Allegra1
 Michela Ferrucci3
 Francesco Fornai1,3*
- 1Department of Molecular Pathology, IRCCS Neuromed, Pozzilli, Italy
- 2Department of Physiology and Pharmacology, Sapienza University of Rome, Rome, Italy
- 3Department of Translational Research and New Technologies in Medicine and Surgery, University of Pisa, Pisa, Italy
Cushing's syndrome is due to increased glucocorticoid levels in the body, and it is characterized by several clinical alterations which concern both vegetative and behavioral functions. The anatomical correlates of these effects remain largely unknown. Apart from peripheral effects induced by corticosteroids as counter-insular hormones, only a few reports are available concerning the neurobiology of glucocorticoid-induced vegetative and behavioral alterations. In the present study, C57 Black mice were administered daily a chronic treatment with corticosterone in drinking water. This treatment produces a significant and selective increase of TH-positive neurons within two nuclei placed in the lateral column of the brainstem reticular formation. These alterations significantly correlate with selective domains of Cushing's syndrome. Specifically, the increase of TH neurons within area postrema significantly correlates with the development of glucose intolerance, which is in line with the selective control by area postrema of vagal neurons innervating the pancreas. The other nucleus corresponds to the retrorubral field, which is involved in the behavioral activity. In detail, the retrorubral field is likely to modulate anxiety and mood disorders, which frequently occur following chronic exposure to glucocorticoids. To our knowledge, this is the first study that provides the neuroanatomical basis underlying specific symptoms occurring in Cushing's syndrome.
Introduction
Cushing's syndrome is due to increased glucocorticoid levels in the body, and it is characterized by several clinical alterations which concern vegetative and behavioral functions (Starkman et al., 1992). For instance, altered metabolism (including diabetes), increased blood pressure, sleep disorders, increased feeding, aggressiveness, anxiety, and psychosis have been described in patients suffering from Cushing's syndrome (Krieger and Glick, 1974; Shipley et al., 1992; Ntali et al., 2015). Also, increased feeding is often reported in patients with increased glucocorticoid levels, which results in an increase in body weight (Chanson and Salenave, 2010).
The anatomical correlates of these effects remain largely unknown. Apart from peripheral effects induced by corticosteroids as counter-insular hormones, only a few reports allow us to hypothesize which neurobiology underlies glucocorticoids-induced vegetative and behavioral alterations. Among these, a seminal article published by Sloviter et al. (1989) showed that adrenalectomy in rats causes profound hippocampal electrophysiological alterations and a nearly complete loss of granule cells in the hippocampal dentate gyrus. These authors demonstrated that corticosterone replacement rescues electrophysiological responses and prevents cell loss of hippocampal dentate granule cells in adrenalectomized rodents. This suggests that glucocorticoids play a fundamental role in maintaining the structural integrity of the normal adult hippocampus (Sloviter et al., 1989). However, it is unlikely that multiple metabolic and behavioral alterations induced by an excess of glucocorticoids may be entirely generated by hippocampal dysfunctions. Thus, it remains to be elucidated which other brain regions may contribute to increased feeding, altered glucose tolerance, anxiety, increased blood pressure, and alterations in the sleep pattern, which characterize Cushing's syndrome. Due to the seminal role of the brainstem reticular formation in promoting the sleep-waking cycle (Moruzzi and Magoun, 1949), alertness, and anxiety, as well as the specific vegetative control of the cardiovascular system and specific abdominal organs, this area deserves specific investigations. The reticular formation contains nuclei that are responsible for sleep-waking cycle, anxiety, aggressiveness, as well as blood pressure control and, in the case of area postrema (AP), specific control of pancreatic secretion (Loewy et al., 1994). The recruitment of these domains in Cushing's syndrome questions whether glucocorticoid may alter the brainstem reticular formation. Among reticular nuclei, these effects are mainly controlled by the lateral, TH-positive column of reticular nuclei (Bucci et al., 2017, 2018). In line with this, in a recent article, we indicated a selective increase of catecholamine cells placed in the caudal part of the lateral column of the brainstem reticular formation. This evidence was limited to investigations carried out in organotypic cell cultures following corticosterone incubation (Busceti et al., 2019). Here, aiming at translating these effects into system neurobiology, we investigated ex vivo, in the whole brain, which nuclei of the brainstem reticular formation may be altered concomitantly with the occurrence of glucose intolerance and increased body weight following chronic exposure to corticosteroids in mice. Such a project encompassing a plethora of behavioral and vegetative domains cannot be solved in a single research article. Due to the recent discovery of a prominent role of AP in controlling the subdivision of the vegetative nervous system innervating the pancreas, the present study mostly focused on correlating altered TH expression in AP with altered glucose tolerance, which typically features Cushing's syndrome.
Materials and methods
Animals
For these experiments, we used 8-weeks-old C57Bl/6J male mice (N = 18) (Charles River, Calco, LC, Italy). All animals were maintained under controlled conditions (room temperature = 22°C; humidity = 40%) on a 12-h light-dark cycle with food and water ad libitum.
Experimental strategy
C57Bl/6J male mice (N = 9) were chronically administered with corticosterone for 5 weeks (Sigma Aldrich, MI, Italy, code: C-2505) in the drinking water (normal drinking water was replaced with a 0.66% ethanol solution containing 100 μg/mL corticosterone). Based on the daily water intake, the daily dose of corticosterone ranges between 1.5 mg/Kg and 2 mg/Kg. Vehicle-treated mice (N = 9) were treated for 5 weeks with a 0.66% ethanol solution in the drinking water. Solutions were freshly prepared. Body weight changes were monitored weekly during the treatment period (5 weeks, Figure 1A). All mice were assessed for glucose tolerance under basal conditions and after 2 or 4 weeks of chronic treatment with corticosterone (Figure 1A), body weight was monitored. At the end of the treatment, all mice were killed and dissected brains were used for the immunohistochemical analysis of TH-positive cells in the whole rostro-caudal extension of the brainstem reticular formation (Figure 1A). All anatomical points of reference were indicated according to the atlas of Paxinos and Franklin (2001) for mice.
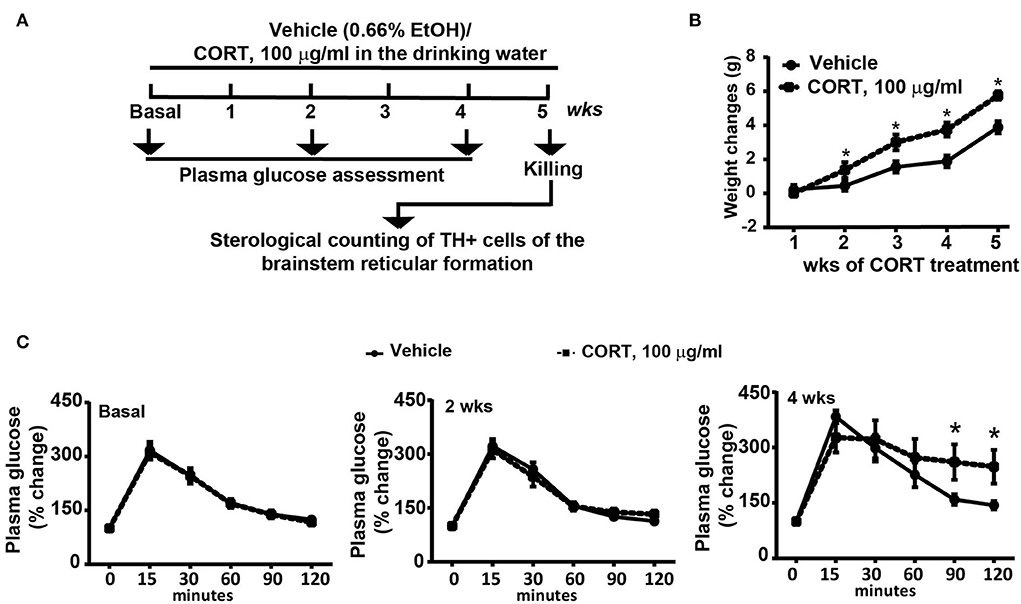
Figure 1. Chronic treatment with corticosterone induced in mice higher body weight and glucose intolerance. (A) Experimental strategy used to induce an animal model of exogenous glucocorticoid excess in mice (N = 9 per group). (B) Body weight changes in response to treatment for 5 weeks with vehicle [0.66% of ethanol (Et-OH)] or corticosterone (CORT, 100 μg/ml in the drinking water). Values are means +/– S.E.M. of 9 mice per group. (C) Glucose tolerance curve in mice before (Basal) or following 2 weeks or 4 weeks of chronic treatment with vehicle or CORT (values are means +/– S.E.M. of 8 mice per group with the exclusion of 1 mouse per group as not-responder to the glucose bolus). *p < 0.05, Two-way RM Anova.
Glucose tolerance test
A glucose solution (20% in 0.9% NaCl) was administered by intraperitoneal (i.p.) injection (100 μl/10 g body weight). Blood glucose was measured at five time points (15, 30, 60, 90, and 120 min after i.p. injection of glucose) during the following 4 h. Blood samples were obtained by a small incision on the paw, and glucose levels were measured by using the blood glucometer One Touch Vita (Johnson & Johnson, NY, USA).
Immunohistochemistry
Dissected brains were fixed overnight at 4°C in Carnoy's solution (60% ethanol, 10% acetic acid, and 30% chloroform with a ratio of fixing solution to the tissue of 20:1 in weight). After fixing the tissue, brain samples were embedded in paraffin and cut with a rotative microtome (Leica, Wetzlar, Germany, code: RM 2245) to obtain 20 μm thick sections. These slices were sampled along the whole rostro-caudal extent of the brainstem reticular formation. Tissue sections were incubated overnight with a monoclonal mouse anti-TH primary antibody (1:100; Sigma Aldrich, code: T1299) and then for 10 min with a secondary biotin-coupled anti-mouse secondary antibody (1:400; Vector Laboratories, Burlingame, CA, USA code: BA-2000). 3,3-Diaminobenzidine tetrachloride (Sigma Aldrich, code: D4293-50set) was used for detection. Negative control was performed without incubation with primary antibody.
Sampling method
Stereological analysis for all catecholaminergic nuclei was carried out on serial coronal slices sampled every 160, 80, and 40 μm for substantia nigra pars compacta (SNC), ventral tegmental area (VTA), and all other nuclei counted, respectively. This sampling paradigm was established based on a pilot analysis carried out by using different inter-slice intervals (160, 80, and 40 μm). This allows us to obtain a CE value which is ~ 0.1.
As shown in Table 1, when sampling with high inter-slice intervals, there is relatively high coefficient of error (CE) values for most nuclei assessed, which can be reduced by reducing the inter-slice interval. This condition is intrinsically dependent on the low density of scattered TH-positive cells within most catecholaminergic nuclei of the brainstem reticular formation. Consistently, the CE values cannot be less than 0.1 as in the case of more densely packed neuron nuclei (West et al., 1996; Lewitus et al., 2012; Dell et al., 2016).
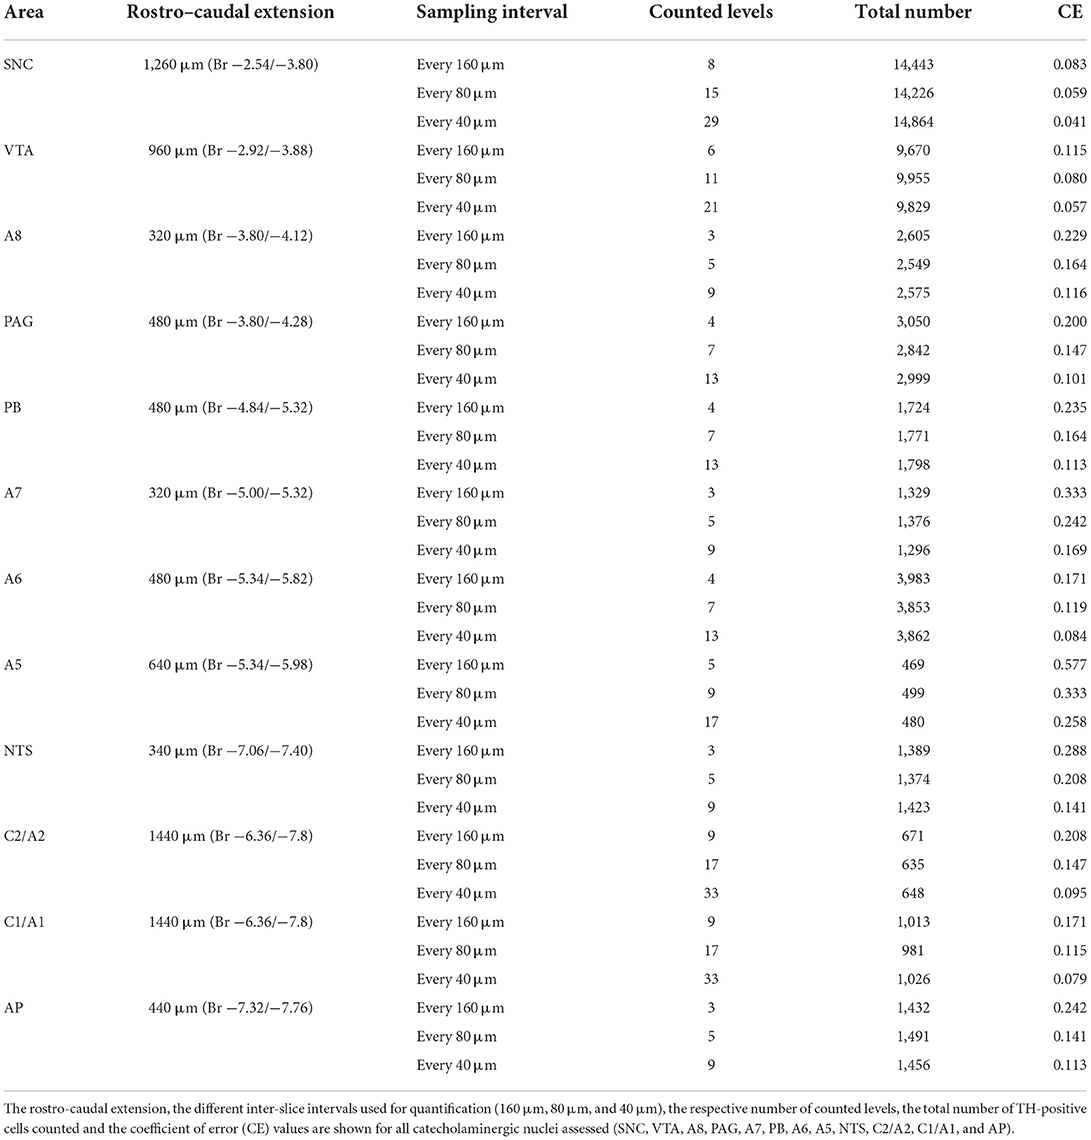
Table 1. Pilot analysis for stereological cell counting of catecholaminergic nuclei of the mouse brainstem reticular formation.
Stereology
Stereological counting of TH-positive cells was carried out by using a microscope Zeiss Axio Imager M1 (Zeiss, Wetzlar, Germany) associated with the software Image Pro-Plus 6.2 for Windows (vers. 6.2.1.491, Media Cybernetics, inc., Rockville, MD) equipped with a specific Macro (obtained by Immagine and Computer, Italy, MI) created ad hoc to perform the Optical Dissector technique. This Macro allows the operator to obtain an unbiased and optimized stereological cell count, according to King et al. (2002). All the areas of interest were identified and outlined at 2.5 × magnification. TH-positive cells were then counted at 100X magnification (numerical aperture 1.3) as previously described (King et al., 2002) by using a different dissector grid depending on the volume of the area to be analyzed. At the end of the procedure, a data sheet was produced containing all the data necessary to obtain the number of cells.
The total estimation of cell numbers (N) was calculated by using the following equation:
Where ssf is the “section sampling fraction,” asf is the “area sampling fraction,” tsf if the “thickness sampling fraction” (thickness of the tissue divided by the dissector height), and ΣQ- is the total number of cells counted within the dissector.
The “Section Sampling Fraction” (ssf) is represented by the number of regularly spaced sections used for counts divided by the total number of sections used to collect the entire structure of interest. To sample the whole brainstem area, we collected 261 sections of 20 μm (covering the full extent of the area which is 5,220 μm). Sections were sampled at a ratio of 1:8, 1:4, and 1:2 (ssf) for SNC, VTA, and all other nuclei assessed, respectively.
The “Area Sampling Fraction” (asf) represents the area between dissectors, that is, the ratio between the area of counting frames and the Area of Interest (AOI).
The remaining value is tsf , the “Thickness Sampling Frequency,” that is, the height sampling fraction and it is calculated as the ratio between the height of the counting frame and the thickness of the tissue. This value is calculated by our system in each counting frame. The Coefficient of error (CE) was calculated according to King et al. (2002).
Statistical analysis
Data are given as the mean ± SEM with statistical significance defined by p < 0.05. Statistical analyses were performed as follows: (i) Unpaired two-tailed Student's t-test (Figures 8A–C, 9A–H, 10A–D); (ii) Two-way RM ANOVA followed by Fisher's LSD (Figures 1B,C); and (iii) Pearson correlation test (Figures 11A–L, 12A–L). GraphPad Prism (Ver 5.01 GraphPad Software, Inc. La Jolla, CA, USA) statistical software was used for analysis.
Results
Chronic administration of corticosterone increases the number of catecholamine cells in the whole mouse brainstem reticular formation
Chronic administration of corticosterone (100 μg/mL in the drinking water for 5 weeks, Figure 1A) to C57Bl/6J male mice induces a progressive increase in body weight (Figure 1B) and occurrence of glucose intolerance 4 weeks after treatment (Figure 1C). Serial sections of the rostral and caudal brainstem were considered to include 12 catecholamine nuclei of the brainstem reticular formation. (i) The dopamine-containing mesencephalic nuclei: A8 (also known as retrorubral field, RRF) (Bregma −3.8/Bregma −4.12); A9 (SNC) (Bregma −2.54/Bregma −3.80); and A10 (VTA) (Bregma −2.92/Bregma −3.88). (ii) TH-positive cells inside the peri-aqueductal gray (PAG) (Bregma −3.8/Bregma −4.28); (iii) the pontine parabrachial nucleus (PB) (Bregma−4.84/Bregma −5.32); (iv) the A7 nucleus (nucleus of lateral lemniscus) (Bregma −5.00/Bregma −5.32); (v) the big pontine noradrenergic nucleus A6 (locus coeruleus, LC) (Bregma −5.34/Bregma −5.82); (vi) the A5 nucleus (Bregma −5.34/Bregma −5.98); (vii) the rostral ventrolateral medulla C1/A1 (Bregma −6.36/Bregma −7.8); (viii) the dorsomedial nucleus of ala cinerea, C2/A2 (Bregma −6.36/Bregma −7.8); (ix) TH-positive cells inside the nucleus of the solitary tract (NTS) (Bregma −7.06/Bregma −7.4); and (x) the area postrema (AP) (Bregma −7.32/Bregma −7.76) (representative pictures of Figures 2–7). This provides a scenario encompassing the lateral column of the brainstem reticular formation ranging from the SNC down to the AP (Figures 2, 7, respectively). These representative pictures aim to provide the anatomical background of brainstem reticular catecholamine nuclei. It is remarkable that, as shown in representative Figure 6, even the undefined A4 region could be well visualized in these slices. When considering altogether these 12 nuclei, no consistent difference was noticeable by comparing corticosterone- and vehicle-treated mice. Only in the most extreme regions (RRF and AP), placed at the rostral and caudal pole of the brainstem reticular formation, respectively, a difference in TH immunostaining was evident (compare representative pictures of Figures 3, 7 as well as Figures 9C, 10D). This was substantiated by the total cell count (Figures 9C, 10D).
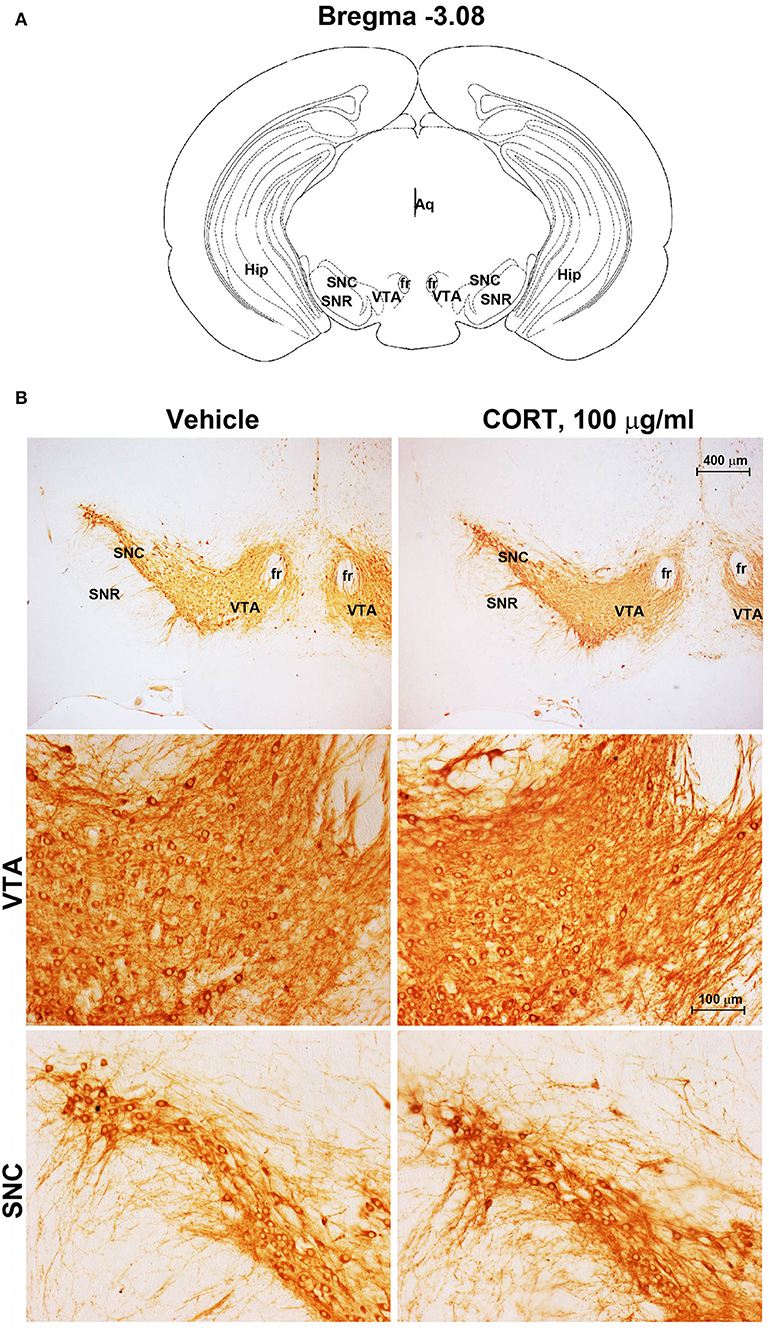
Figure 2. Chronic treatment with corticosterone does not change TH-immunoreactivity in the substantia nigra pars compacta and ventral tegmental area. (A) Schematic picture modified from the atlas of Paxinos and Franklin (2001) for mice showing the anatomical location of the catecholaminergic nuclei in substantia nigra pars compacta (SNC) and ventral tegmental area (VTA) at bregma level −3.08. Aq, Aqueduct of Sylvius; fr, fasciculus retroflexus; Hip, hippocampus; SNR, substantia nigra pars reticulata. (B) Representative images of TH-immunoreactive cells in SNC and VTA of mice subjected to chronic treatment with vehicle (ethanol 0.66%) or corticosterone (CORT, 100 μg/ml).
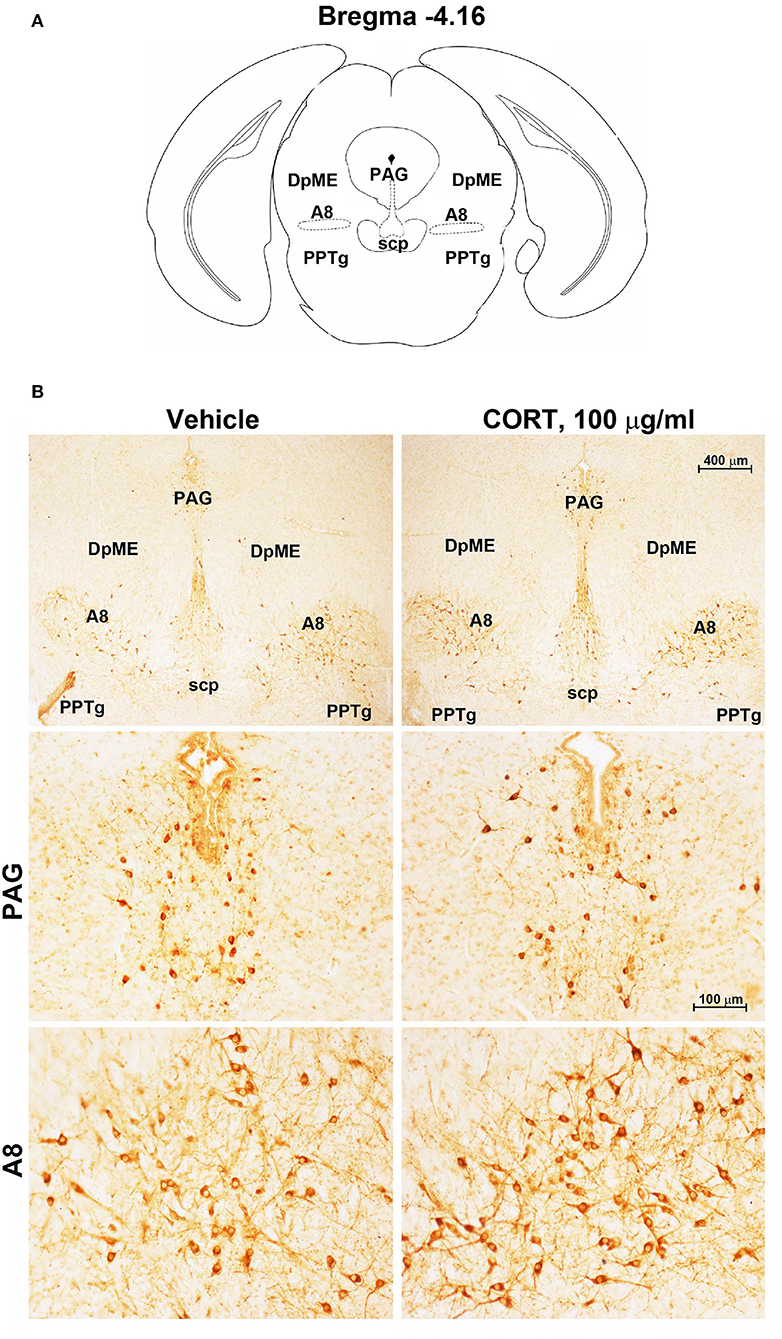
Figure 3. Chronic treatment with corticosterone increases TH-immunoreactivity in the retrorubral field (RRF). (A) Schematic picture modified from the atlas of Paxinos and Franklin (2001) for mice showing the anatomical location of the catecholaminergic nuclei in the peri-aqueductal gray (PAG) and retrorubral field (A8) at bregma level −4.16. DpME, deep mesencephalic nucleus; scp, superior cerebellar peduncle; PPTg, pedunculopontine tegmental nucleus. (B) Representative images of TH-immunoreactive cells in PAG and A8 of mice subjected to chronic treatment with vehicle (ethanol 0.66%) or corticosterone (CORT, 100 μg/ml).
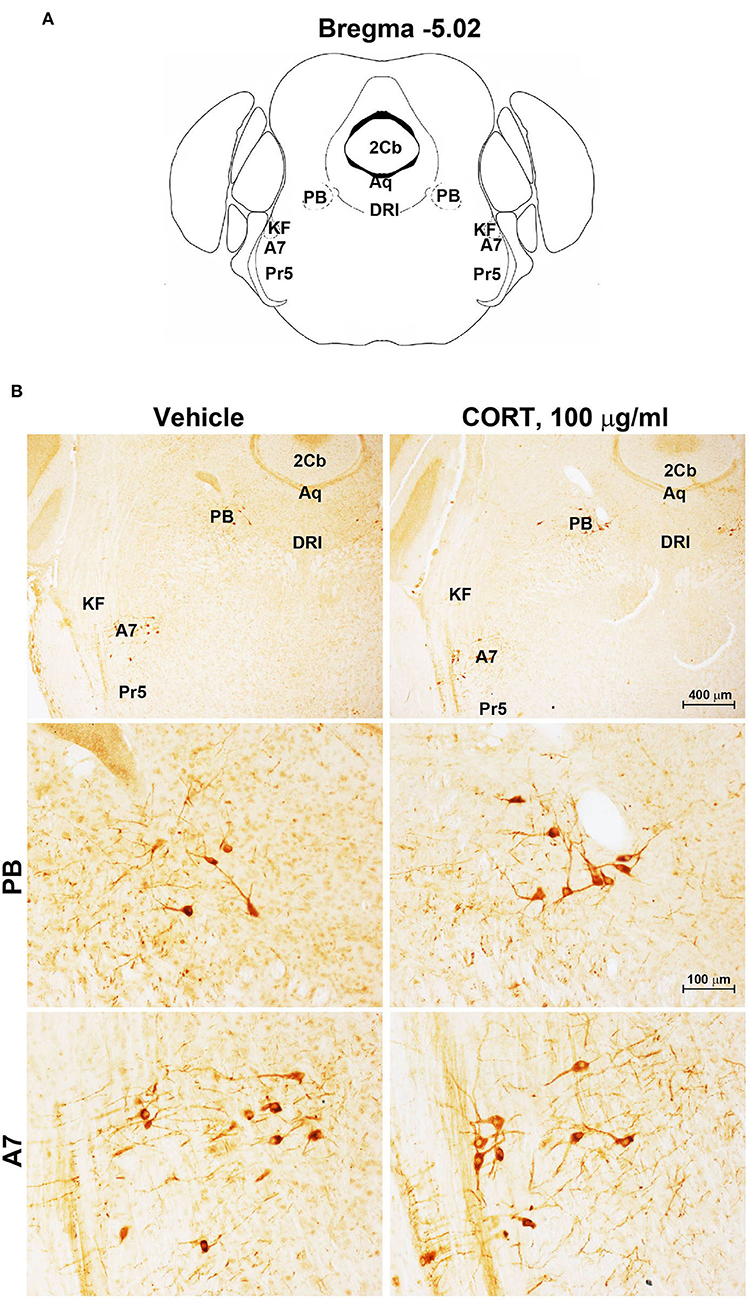
Figure 4. Chronic treatment with corticosterone does not change TH-immunoreactivity in the parabrachial nucleus and lateral lemniscus. (A) Schematic picture modified from the atlas of Paxinos and Franklin (2001) for mice showing the anatomical location of the catecholaminergic nuclei in the parabrachial nucleus (PB) and lateral lemniscus (A7) at bregma level −5.02. Aq, Aqueduct of Sylvius; 2Cb, Second Cerebellar lobule; DRI, dorsal raphe nucleus, interfascicular part; KF, Kölliker-Fuse nucleus; Pr5, principal sensory trigeminal nucleus. (B) Representative images of TH-immunoreactive cells in PB and A7 of mice subjected to chronic treatment with vehicle (ethanol 0.66%) or corticosterone (CORT, 100 μg/ml).
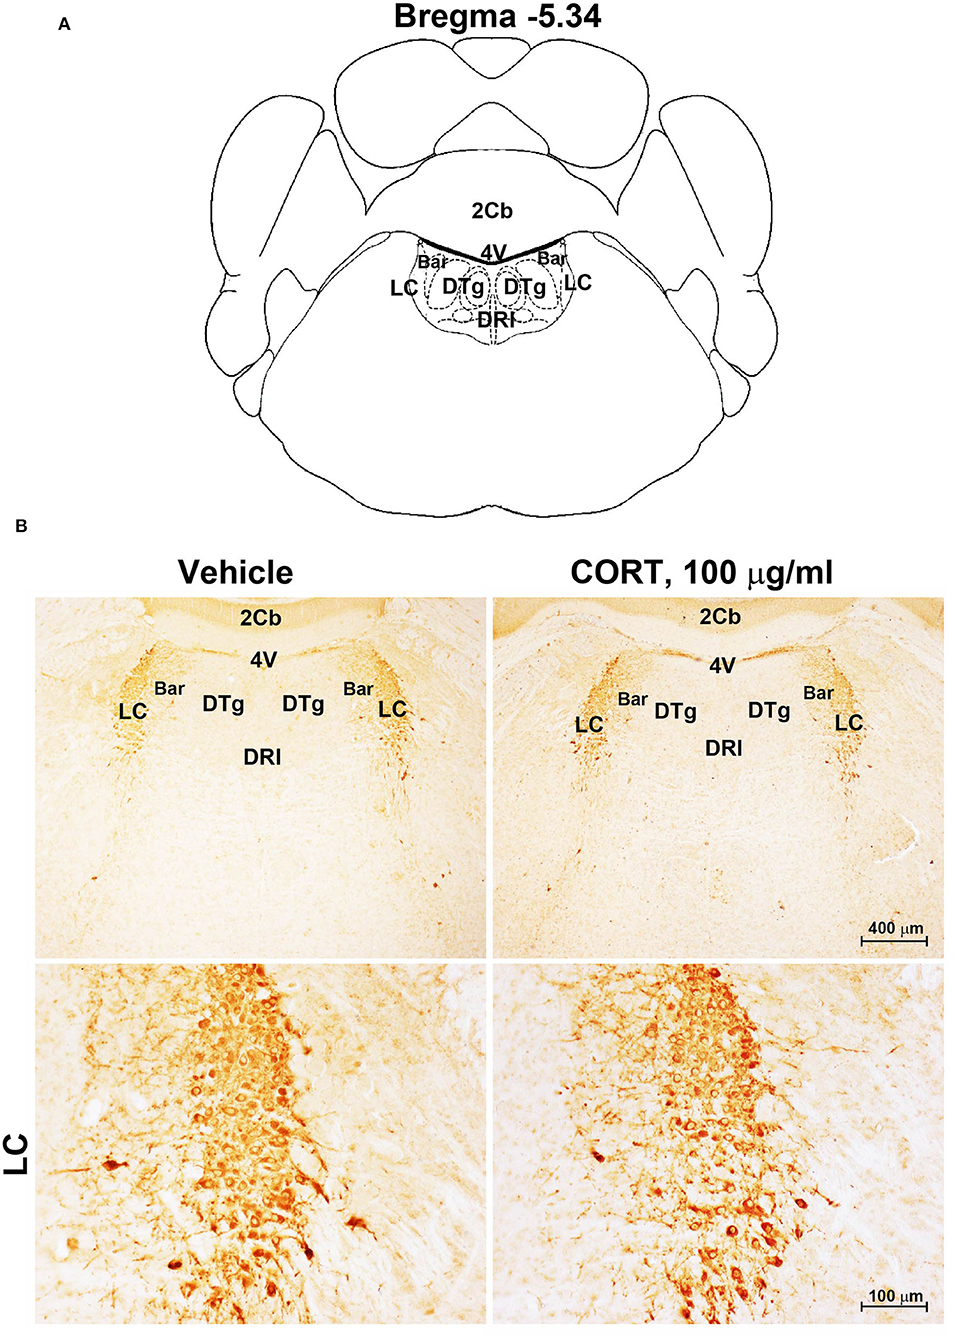
Figure 5. Chronic treatment with corticosterone does not induce variations in TH-immunoreactivity in the locus coeruleus. (A) Schematic picture modified from the atlas of Paxinos and Franklin (2001) for mice showing the anatomical location of Locus Coeruleus (LC) at the bregma level −5.34. Bar, Barrington's nucleus; 2Cb, Second Cerebellar lobule; DRI, dorsal raphe nucleus, interfascicular part; DTg, dorsal tegmental nucleus; 4V, 4th ventricle; (B) Representative images of TH-immunoreactive cells in the LC of mice subjected to chronic treatment with vehicle (ethanol 0.66%) or corticosterone (CORT, 100 μg/ml).
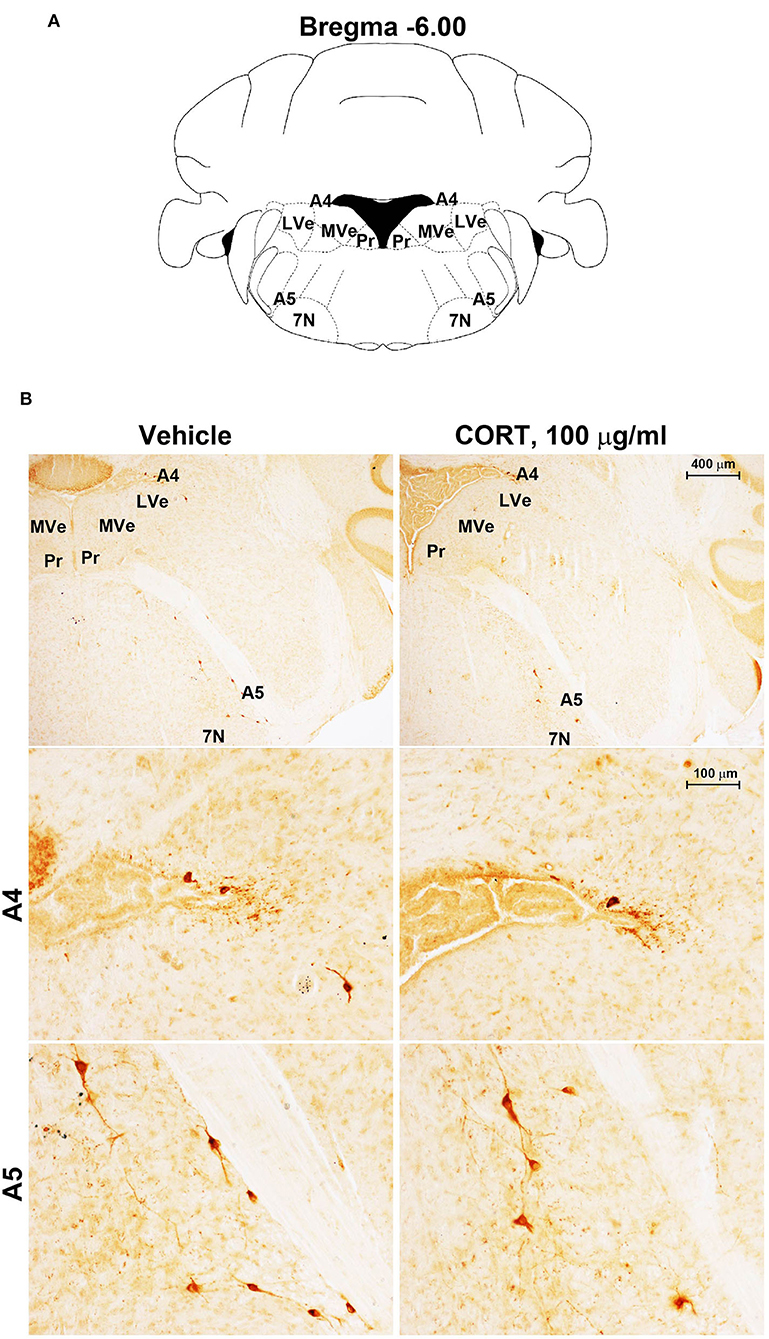
Figure 6. Chronic treatment with corticosterone does not change TH-immunoreactivity in the A5 catecholamine nucleus. (A) Schematic picture modified from the atlas of Paxinos and Franklin (2001) for mice showing the anatomical location of the A5 catecholamine nucleus at the bregma level −6.00. 7N, facial nucleus; Pr, prepositus nucleus; LVe, lateral vestibular nucleus; MVe, medial vestibular nucleus. (B) Representative images of TH-immunoreactive cells in A4 and A5 catecholamine nuclei in the brainstem reticular formation of mice subjected to chronic treatment with vehicle (ethanol 0.66%) or corticosterone (CORT, 100 μg/ml).
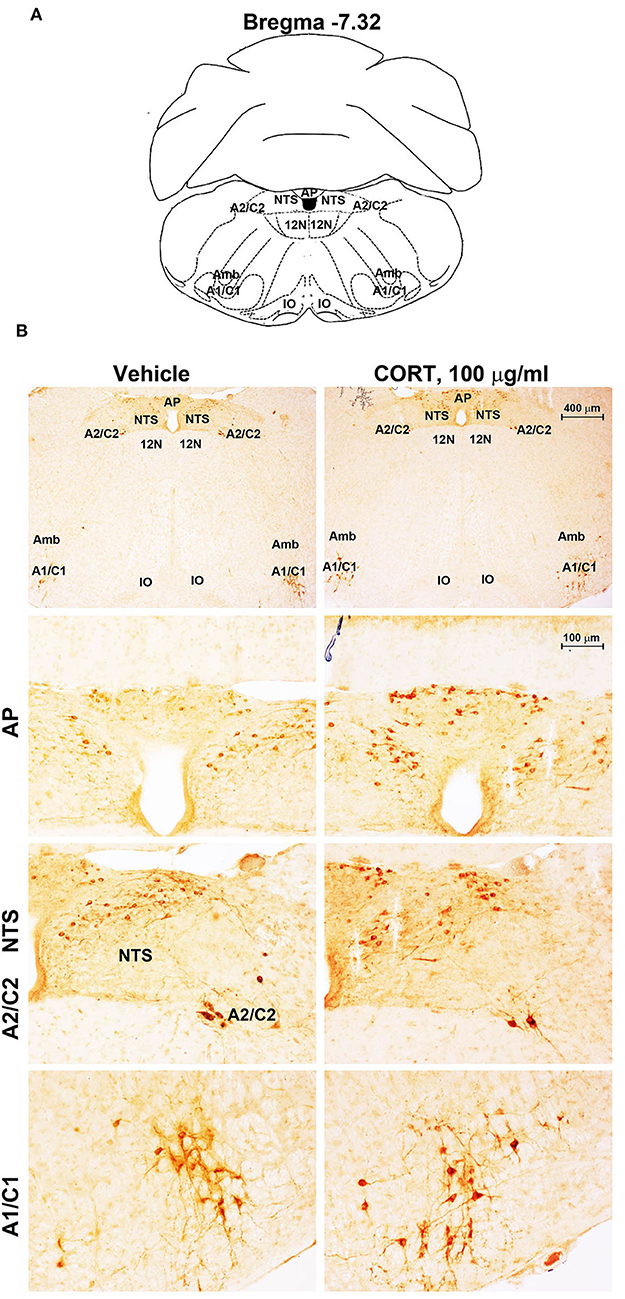
Figure 7. Chronic treatment with corticosterone increases TH-immunoreactivity in the area postrema (AP) of brainstem reticular formation. (A) Schematic picture modified from the atlas of Paxinos and Franklin (2001) for mice showing the anatomical location of the rostral ventrolateral medulla (C1/A1), the dorsomedial nucleus of ala cinerea (C2/A2), the nucleus of the solitary tract (NTS), and the area postrema (AP) at the bregma level −7.32. Amb, nucleus Ambiguus; IO, inferior olive; 12N, hypoglossal nucleus. (B) Representative images of TH-immunoreactive cells AP, NTS, A2C2, and A1/C1 catecholamine nuclei in the brainstem reticular formation of mice subjected to chronic treatment with vehicle (ethanol 0.66%) or corticosterone (CORT, 100 μg/ml).
Consistently with our previous findings obtained in organotypic mouse brainstem cultures (Busceti et al., 2019), stereological counting provides evidence for an increased number of TH-immunopositive cells in the whole rostro-caudal extension of the pons and medulla oblongata (from Bregma = −3.8 to Bregma = −7.64 without including the rostral midbrain) of mice treated with corticosterone compared with control vehicle-treated mice (Figure 8A).
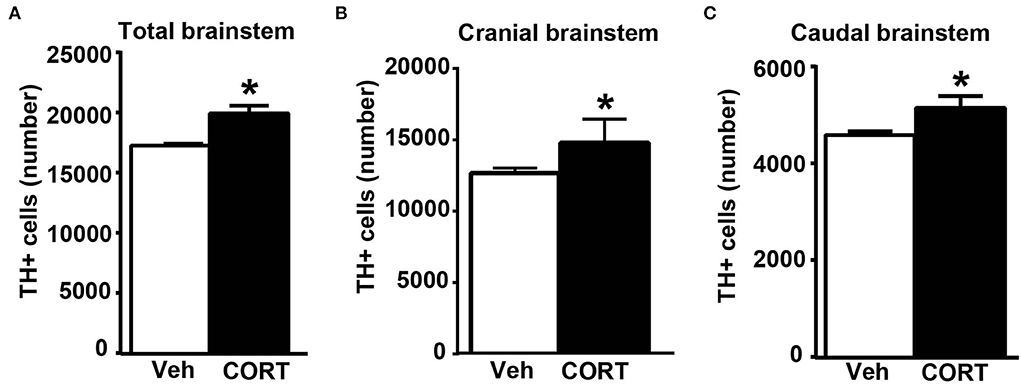
Figure 8. Chronic treatment with corticosterone increases the number of catecholamine cells in the pons and medulla oblongata. (A) Stereological counting of TH-immunoreactive cells into the whole rostro-caudal extension of the pons and medulla oblongata (from Bregma = −3.8 to Bregma = −7.64 without including the rostral midbrain) of mice subjected to chronic treatment with corticosterone (CORT, 100 μg/ml) and their control vehicle (ethanol 0.66%) mice. The number of TH-positive cells in catecholamine nuclei of the cranial brainstem (including A8, PAG, A7, PB, A6, and A5 catecholamine nuclei) or caudal brainstem (including NTS, C2/A2, C1/A1, and AP) of mice subjected to chronic treatment with vehicle or corticosterone is shown in (B,C), respectively. Values are means +/– S.E.M. of nine (vehicle) and eight (CORT) mice per group (one mouse in the group of corticosterone-treated mice was eliminated as a non-responder). *p < 0.05 Unpaired two-tailed Student t-test.
To assess the specific placement of increased TH-positive cells, which occurred following corticosterone administration in vivo, a stereological quantification was carried out by differentiating the cranial (Bregma −3.8/Bregma −5.82) from the caudal (Bregma −6.36/Bregma −7.64) part of the brainstem. Differing from in vitro data reporting an increase of TH in the caudal nuclei only (Busceti et al., 2019), the present investigation carried out ex vivo indicates that corticosterone-induced increase in the number of TH-immunopositive cells similarly occurs within cranial and caudal parts of the mouse brainstem (Figures 8B,C, respectively).
This suggests that, when administered in vivo, corticosterone significantly increases TH immunostaining in multiple brainstem regions compared with its effects in isolated brainstem slices. In detail, when counted ex vivo, the increase in the rostral brainstem overalls the increase in the caudal brainstem and both express representatively the increase in TH-positive cell bodies, which was measured in the whole brainstem (Figure 8). The previous study using organotypic cell cultures left the increase of TH immunopositive neurons in the caudal brainstem non-defined since stereology could not be carried out and the increase was roughly attributed to catecholamine cell groups within the lower medulla. In contrast, the present study, which is carried out ex vivo identifies specifically the caudal appendix of this region, the AP, as the specific part where the increase in TH takes place. For what concerns the rostral brainstem, the specific nucleus of RRF owns the increase in TH immunostaining.
In the cranial brainstem, TH-immunopositive cells increase significantly within the retrorubral field
To obtain a more detailed anatomical regional mapping of corticosterone-induced increase in the number of TH-positive cells, a detailed stereological analysis was carried out for each catecholamine nucleus of the brainstem reticular formation.
Stereological quantification performed in catecholamine nuclei from the anterior brainstem indicates a significant increase in the number of TH-positive cells in response to treatment with corticosterone within the RRF (A8, as shown in the graph and representative pictures of Figure 9C). In the SNC, VTA, PAG, PB, A7, and A6, an increase was steady although non-significant (Figures 9A,B,D–G, respectively). On the contrary, the A5 shows a decrease in TH-positive cells (Figure 9H).
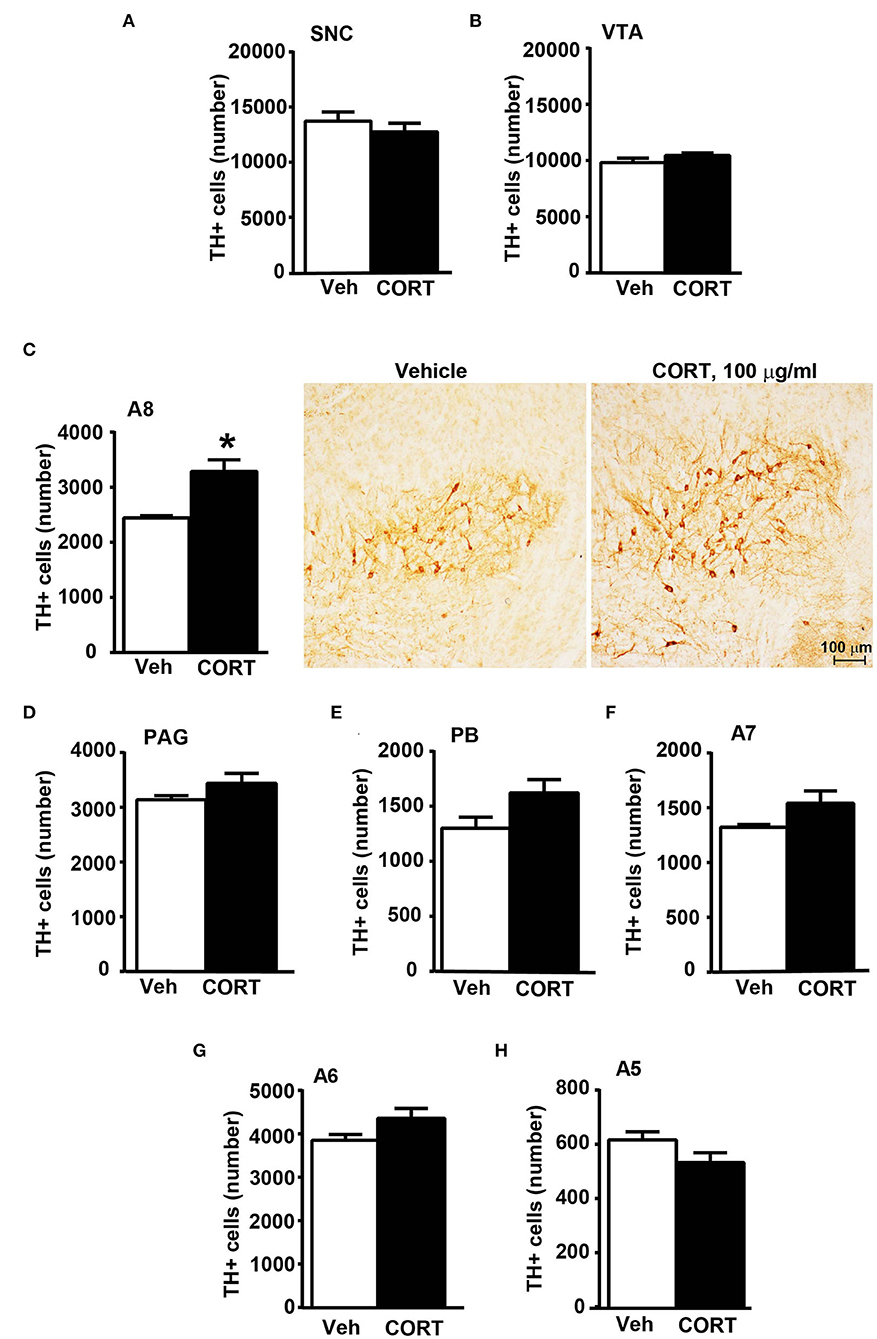
Figure 9. Chronic treatment with corticosterone increases the number of TH-positive cells in A8 inside the cranial mouse brainstem reticular formation. The number of TH positive cells in SNC and VTA in the midbrain of mice subjected to chronic treatment for 5 weeks with vehicle (ethanol 0.66%) or corticosterone (CORT, 100 μg/ml) is shown in (A,B), respectively [(A) vehicle 13721 +/– 890, CE: 0.093 +/– 0.005, CV: 0.184; CORT 12764 +/– 833, CE: 0.093 +/– 0.003, CV: 0.173; (B) vehicle 9822 +/– 406, CE: 0.085 +/– 0.003, CV: 0.117; CORT 10459 +/– 225, CE: 0.080 +/– 0.003, CV: 0.057]. (C) Stereological counting of TH immunoreactive cells in A8 of mice subjected to the same experimental conditions (vehicle 2445 +/– 40, CE: 0.108 +/– 0.002, CV: 0.047; CORT 3287 +/– 225, CE: 0.100 +/– 0.002, CV: 0.182). Representative images showing the robust increase of TH immunoreactive cells in A8 of corticosterone-treated mice are shown in the right part of (C). The number of TH-positive cells in PAG, PB, A7, A6, and A5 in the cranial brainstem of mice subjected to the same experimental conditions is shown in (D–H), respectively. Values are means +/– S.E.M. of nine (vehicle) and eight (CORT) mice per group (one mouse in the group of corticosterone-treated mice was eliminated as a non-responder). *p < 0.05 Unpaired two-tailed Student t-test. CE, Coefficient of Error; CV, Coefficient of Variation. [(D) vehicle 3139 +/– 81, CE: 0.101 +/– 0.002; CORT 3440 +/– 194, CE: 0.093 +/– 0.03, CV: 149; (E) vehicle 1302 +/– 106, CE: 0.134 +/– 0.006, CV: 0.230; CORT 1623 +/– 128, CE: 0.119 +/– 0.005, CV: 0.209; (F) vehicle 1323 +/– 25, CE: 0.163 +/– 0.003, CV: 0.054; CORT 1541 +/– 122, CE: 0.146 +/– 0.007, CV: 0.210; (G) vehicle 3853 +/– 139, CE: 0.099 +/– 0.002, CV: 0.102; CORT 4360 +/– 240, CE: 0.085 +/– 0.003, CV: 0.102; (H) vehicle 616 +/– 32, CE: 0.237 +/– 0.007, CV: 0.146; CORT 533 +/– 39, CE: 0.244 +/– 0.009].
In the caudal brainstem, TH-immunopositive cells increase significantly within area postrema
Stereological counting of TH-positive cells in response to treatment with corticosterone in C1/A1 (Figure 10C) shows an increase that remains non-significant. Similarly, non-significant variations are detected within either C2/A2 (Figure 10B) or NTS (Figure 10A). In contrast, we found a significant increase in the number of TH immunoreactive cells in AP of mice chronically administered corticosterone compared with control vehicle-administered mice (Figure 10D).
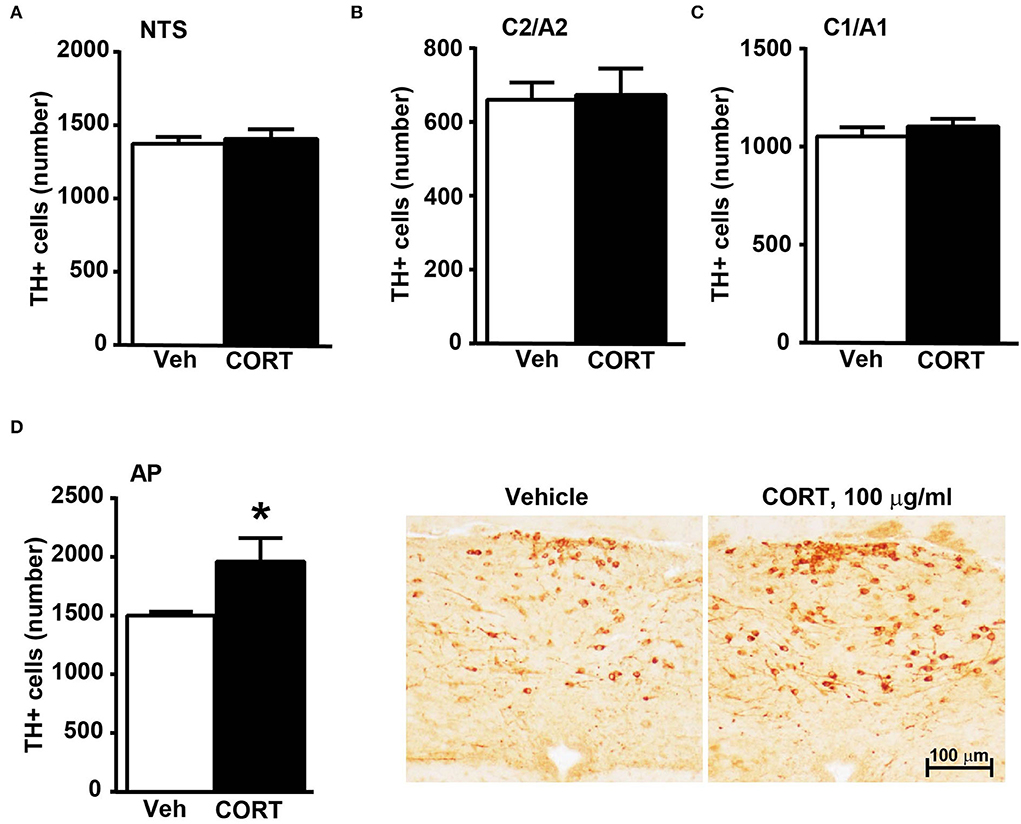
Figure 10. Chronic treatment with corticosterone increases the number of TH-positive cells in AP in the caudal mouse brainstem reticular formation. The number of TH-positive cells in NTS, C2/A2, C1/A1, and AP of mice chronically treated for 5 weeks with vehicle (ethanol 0.66%) or corticosterone (CORT, 100 μg/ml) is shown in (A–D), respectively. Values are means +/– S.E.M. of nine (vehicle) and eight (CORT) mice per group (one mouse in the group of corticosterone-treated mice was eliminated as a non-responder). *p < 0.05 Unpaired two-tailed Student t-test. CE, Coefficient of Error; CV, Coefficient of Variation. [(A) vehicle 1374 +/– 50, CE, 0.129 +/– 0.02, CV: 0.103; CORT 1407 +/– 70, CE: 0.126 +/– 0.002, CV: 131; (B) vehicle 661 +/– 49, CE: 0.099 +/– 0.002, CV: 0.209; CORT 674 +/– 76, CE: 0.097 +/– 0.002, CV: 0.298; (C) vehicle 1052 +/– 50, CE: 0.090 +/– 0.001, CV: 0.136; CORT 1104 +/– 41, CE: 0.090 +/– 0.002, CV: 0.097; (D) vehicle 1502 +/– 31, CE: 0.124 +/– 0.002, CV: 0.059; CORT 1961 +/– 215, CE: 0.112 +/– 0.005, CV: 0.291]. Representative images showing the robust increase of TH immunoreactive cells in AP of corticosterone-treated mice are shown in the right part of (D).
Correlation analysis between the number of TH-positive cells and glucose tolerance or body weight changes in response to treatment with vehicle or corticosterone
A correlation analysis was carried out between the number of TH-positive cells in each catecholamine nucleus of the brainstem reticular formation and parameters of glucose tolerance [the glucose blood levels detected 120 min after a bolus of glucose administered after 4 weeks of treatment with vehicle or corticosterone (Figure 11)] or body weight changes [body weight changes following 5 weeks of treatment with vehicle or corticosterone compared with respective values measured before the treatment (Figure 12)].
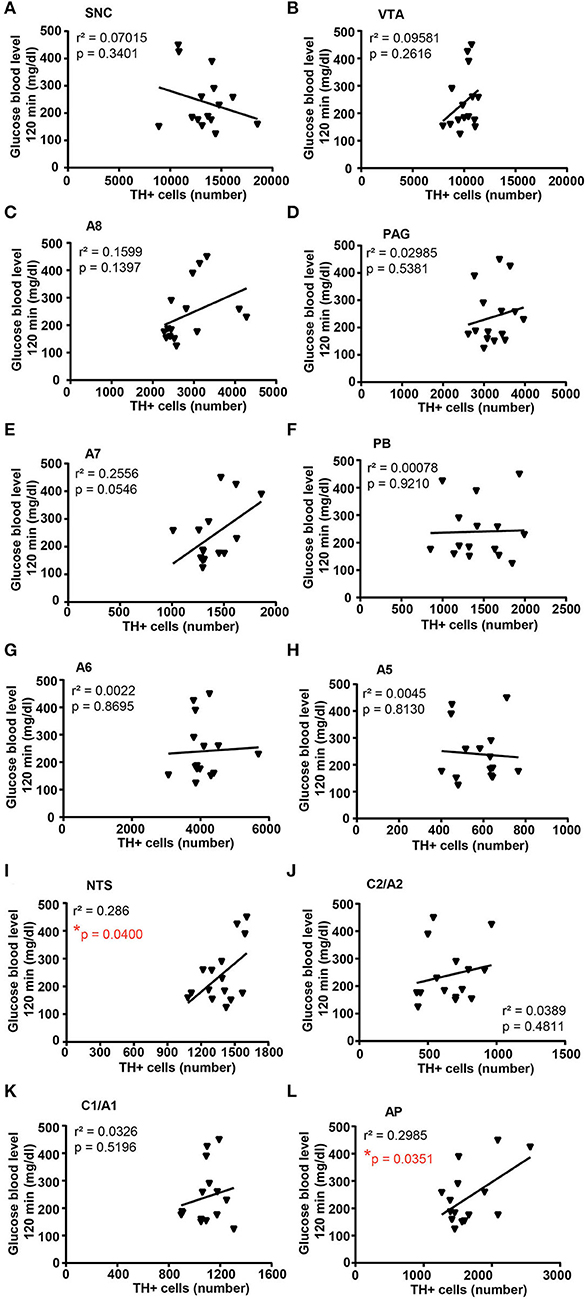
Figure 11. There is a positive correlation between the number of TH-positive cells in NTS and AP and glucose intolerance. Correlation analysis between the number of TH positive cells in SNC, VTA, A8, PAG, A7, PB, A6, A5, NTS, C2/A2, C1/A1, and AP and the glucose blood level monitored 120 min after a bolus of glucose (glucose 20% in 0.9% NaCl, i.p.) in mice treated for 4 weeks with vehicle (0.66% ethanol, N = 8; in the group of vehicle-treated mice, one mouse was excluded as not-responder to the glucose bolus) or corticosterone (100 μg/ml in the drinking water, N = 7; in the group of corticosterone-treated mice, one mouse was excluded as non-responder to the glucose bolus and one mouse was excluded as not-responder to corticosterone treatment) is shown in (A–L), respectively. *p < 0.05, Pearson correlation test.
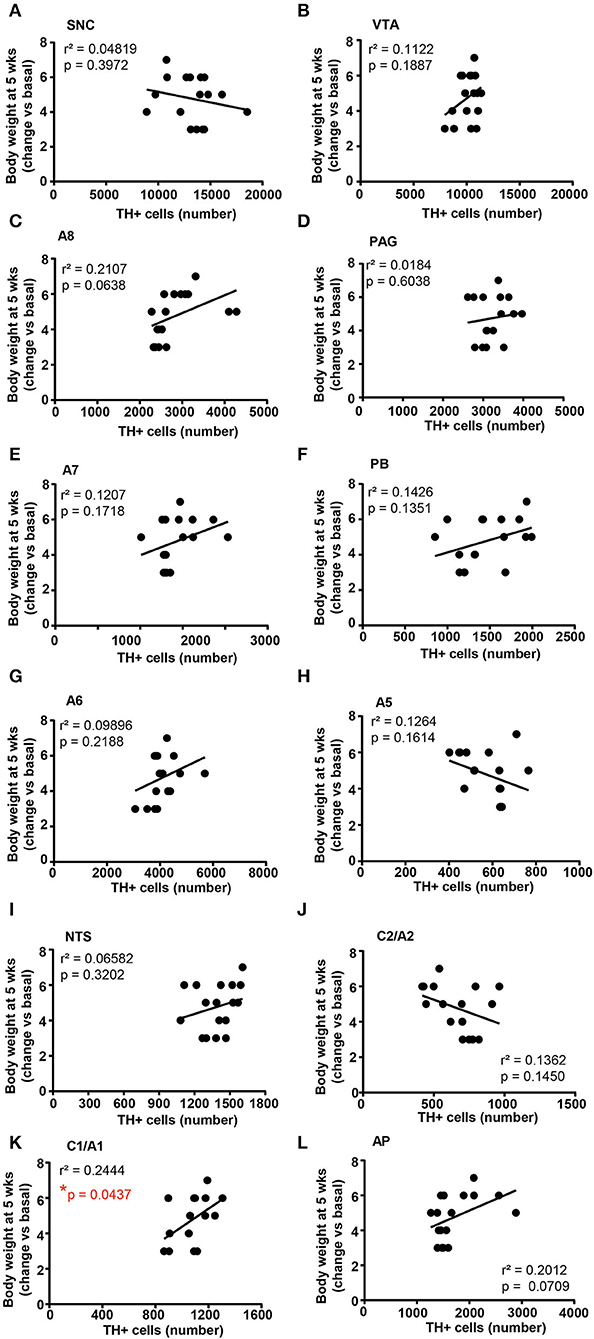
Figure 12. There is a positive correlation between the number of TH-positive cells in C1/A1 and the body weight increase. Correlation analysis between the number of TH positive cells in SNC, VTA, A8, PAG, A7, PB, A6, A5, NTS, C2/A2, C1/A1, and AP and the body weight changes vs. basal (before treatment) in mice treated for 5 weeks with vehicle (N = 9) or corticosterone (N = 8; 1 mouse was excluded as not-responder to the corticosterone treatment) is shown in (A–L), respectively. *p < 0.05, Pearson correlation test.
Concerning glucose tolerance, a positive correlation was selectively found between the number of TH-positive cells and glucose blood levels in NTS and AP (Figures 11I,L, respectively), while no significant correlation was detected in SNC, VTA, A8, PAG, A7, PB, A6, A5, C2/A2, and C1A1 (Figures 11A–J,K; respectively).
When the correlation analysis was carried out for the body weight changes, we selectively found a positive correlation between the number of TH-positive cells in the A1/C1 group and the increase in body weight (Figure 12K). No correlation was found between the number of TH-positive cells and the body weight changes in SNC, VTA, A8, PAG, A7, PB, A6, A5, NTS, C2/A2, and AP (Figures 12A–H,J,L, respectively).
Discussion
The present ex vivo study indicates that chronic administration of corticosterone significantly increases the number of catecholamine cells within two specific nuclei, the RRF and AP, posed respectively, at the rostral and caudal poles of the brainstem reticular formation.
These findings are in line with data showing that glucocorticoid receptor stimulation increases TH gene transcription (Hagerty et al., 2001). The promoter region of the TH gene contains glucocorticoids responsive element (GRE) (Hagerty et al., 2001) and elevated glucocorticoid levels accelerate both release and turnover of brain catecholamines (Abercrombie et al., 1989; Finlay et al., 1995; Sullivan, 2004; Kvetnansky et al., 2009). Chronic stress exposure activates catecholamine neurons (Mamalaki et al., 1992; Watanabe et al., 1995; Rusnak et al., 2001; Flugge et al., 2004) and long-term, reiterated stress exposure sensitizes the increase of TH mRNA levels in response to novel stressors (Serova et al., 1998, 1999; Rusnak et al., 2001; Tumer et al., 2001; Kvetnansky et al., 2003). However, during prolonged stress, the hyperactive state of catecholamine neurons may deplete catecholamine stores, which eventually may reduce the activity of catecholamine neurons (Loughlin et al., 1986; Valles et al., 2006). Moreover, alterations of catecholamine systems during chronic stress may contribute to neurodegeneration. Stress-related catecholamine alterations might accelerate neuronal degeneration by increasing the formation of toxic dopamine and norepinephrine by-products (Martinez-Vicente et al., 2008; da Luz et al., 2015; Sugama et al., 2016; Goldstein and Kopin, 2018; Kang et al., 2020; Fornai and Puglisi-Allegra, 2021).
The present findings provide a quantitative measurement of 12 TH-expressing nuclei, being analyzed by automated stereology, in brainstem reticular formation of mice subjected to chronic administration of corticosterone. The increase in TH-positive cells was significantly and selectively identified within two catecholamine cell groups, AP and RRF. While the increase in A1/C1, although non-significant per se, significantly correlates with the increased body weight of C57Bl/6 mice.
Remarkably, the increase of TH-positive cells within AP is significantly correlated with the onset of reduced tolerance to glucose in line with specific control of AP on those neurons in the dorsal vagal complex which innervates the pancreas (Loewy et al., 1994). The present study also indicates an increase of TH-positive cells within A1/C1, which, although is non-significant, is significantly correlated with an increase in the body weight of corticosterone-treated mice. The present findings detail and extend previous findings we obtained in vitro, which documented corticosterone-induced increased expression of catecholamine markers within organotypic cell cultures dissected from the caudal brainstem (Busceti et al., 2019).
Thus, the present data obtained in the whole brainstem indicates that chronic corticosterone elevates TH-positive cells within the RRF within the rostral brainstem, which differs from organotypic cell cultures where no effect was detected neither in slices from the pons nor the mesencephalon (Busceti et al., 2019).
Despite a significant increase in the number of TH-positive cells in A8, the greatest dopaminergic nuclei (A9 and A10) do not show any increase. These data suggest that there is no correlation between the alterations induced in response to chronic exposure to corticosterone and a specific neurotransmitter in all nuclei. The effect is rather confined to specific nuclei.
Remarkably, in the present ex vivo study, the increase in TH-positive cell bodies is selective for two nuclei, although it occurs non-significantly for most TH-positive nuclei, where the number of TH-positive cells surpasses those counted from the control brain. This trend is magnified compared to that documented in organotypic slices of the anterior brainstem where the overall amount was not significantly different (Busceti et al., 2019).
This widespread increase in TH immunoreactivity in the cranial brainstem does not occur in A5, where the trend is opposite to the other nuclei.
Although both AP and the RRF develop a significant increase of TH-positive neurons, only the increase in AP but not the increase in RRF correlates with corticosterone-induced glucose intolerance. It is expected that further studies will allow us to disclose a causal relationship between the increase of TH-positive cells within RRF (A8) and the development of other alterations associated with Cushing's syndrome, such as anxiety, aggressiveness, or sleep-waking cycle dysfunction. RRF is involved in a number of behavioral states and a number of axons connect A8 dopaminergic neurons with neurons in the amygdala (Wallace et al., 1989).
The amygdala, which is in close connection with the medial prefrontal cortex (mPFC) controls emotional responses, such as fear and anxiety (Sotres-Bayon and Quirk, 2010; Kumar et al., 2014; Likhtik et al., 2014; Bukalo et al., 2015), which characterize Cushing's syndrome. Corticosterone-induced emotional changes may likely be partly related to its effects on RRF (A8) neurons.
In fact, mPFC exerts an inhibitory control on the amygdala activity, thus controlling emotional behaviors (Rosenkranz and Grace, 2001; Quirk et al., 2003; Rosenkranz et al., 2003; Motzkin et al., 2015). Evidence exists that chronic corticosterone treatment in mice produces defective prefrontal inhibitory control of the amygdala (Liu et al., 2020) fostering anxiety and depression (Quirk and Gehlert, 2003; Correll et al., 2005; Rauch et al., 2006). Thus, corticosterone may produce a dual effect via RRF and mPFC, which synergize to produce anxiety and mood disorders. Specific behavioral investigations are needed to address this point.
Concerning the caudal part of the brainstem reticular formation, AP features a significant increase in the number of TH-positive in response to chronic treatment with corticosterone. This is fascinating since AP provides a selective control to the vagal efferent, which innervates the pancreas (Loewy et al., 1994). This is in line with altered tolerance to glucose occurring in these mice, which, in turn, significantly correlates with the increase in TH-positive cells within AP.
This is in line with the role of TH-positive cells within AP and its rostral branching within NTS as gluco-sensing neurons (Roberts et al., 2017). In detail, high glucose levels increase the firing of catecholamine neurons within AP and NTS by increasing spontaneous glutamate inputs (Roberts et al., 2017). This provides a mechanism by which changes in glucose could impact catecholamine neurons in the medullary reticular formation, thus controlling cardiovascular, respiratory, and gastrointestinal systems (Simon et al., 1985; Kubo et al., 1990; Itoh and Buñag, 1993; Schild et al., 1994; Saper et al., 2002; Olson et al., 2006). The present correlation data suggest that high plasmatic levels of glucocorticoids through increasing the number of catecholamine neurons in the AP may provide a neuroanatomical substrate extending beyond glucose intolerance.
In keeping with the caudal brainstem, considering the C1/A1 region, the increase in TH-positive cells is not significant; however, a significant correlation was measured between the number of TH-positive cells and increased body weight. This is very intriguing since these neurons of the ventrolateral medulla project to the paraventricular hypothalamic areas and are involved in feeding behavior (Rinaman, 1999; Gaykema et al., 2007). This suggests a neural basis to explain why glucocorticoids alter feeding activity, which, in turn, may contribute to metabolic alterations, fat re-distribution, and glucose intolerance concomitant to an increase in body weight, which occurs in Cushing's syndrome.
Conclusion
Chronic treatment with corticosterone induces in vivo a significant and selective alteration of TH-positive neurons within two nuclei placed in the lateral column of the brainstem reticular formation. These alterations significantly correlate with the selective domain of Cushing's syndrome. To our knowledge, this is the first study that provides a potential anatomical basis that may underlie specific symptoms occurring in Cushing's syndrome.
Data availability statement
The raw data supporting the conclusions of this article will be made available by the authors, without undue reservation.
Ethics statement
The animal study was reviewed and approved by Neuromed Institute Ethical Committee Ministry of Health (Authorization #1132/2016-PR).
Author contributions
CLB performed immunohistochemical analysis, statistical analysis, and wrote the manuscript. DB performed immunohistochemical analysis and stereological counting. PD performed glucose tolerance test. MS and MF revised the manuscript. SP-A, FN, and FF supervised research and revised the manuscript. All authors contributed to the article and approved the submitted version.
Funding
This work was supported by a grant from the Italian Ministry of Health (Ricerca Corrente to FF through IRCCS Neuromed).
Conflict of interest
The authors declare that the research was conducted in the absence of any commercial or financial relationships that could be construed as a potential conflict of interest.
Publisher's note
All claims expressed in this article are solely those of the authors and do not necessarily represent those of their affiliated organizations, or those of the publisher, the editors and the reviewers. Any product that may be evaluated in this article, or claim that may be made by its manufacturer, is not guaranteed or endorsed by the publisher.
References
Abercrombie, E. D., Keefe, K. A., DiFrischia, D. S., and Zigmond, M. J. (1989). Differential effect of stress on in vivo dopamine release in striatum, nucleus accumbens, and medial frontal cortex. J. Neurochem. 52, 1655–1658. doi: 10.1111/j.1471-4159.1989.tb09224.x
Bucci, D., Busceti, C. L., Biagioni, F., Ferrucci, M., Nicoletti, F., and Fornai, F. (2018). Step by step procedure for stereological counts of catecholamine neurons in the mouse brainstem. Arch. Ital Biol. 156, 171–182. doi: 10.12871/00039829201844
Bucci, D., Busceti, C. L., Calierno, M. T., Di Pietro, P., Madonna, M., Biagioni, F., et al. (2017). Systematic morphometry of catecholamine nuclei in the brainstem. Front. Neuroanat. 11, 98. doi: 10.3389/fnana.2017.00098
Bukalo, O., Pinard, C. R., Silverstein, S., Brehm, C., Hartley, N. D., Whittle, N., et al. (2015). Prefrontal inputs to the amygdala instruct fear extinction memory formation. Sci. Adv. 1, e1500251. doi: 10.1126/sciadv.1500251
Busceti, C. L., Ferese, R., Bucci, D., Ryskalin, L., Gambardella, S., Madonna, M., et al. (2019). Corticosterone upregulates gene and protein expression of catecholamine markers in organotypic brainstem cultures. Int. J. Mol. Sci. 20, 2901. doi: 10.3390/ijms20122901
Chanson, P., and Salenave, S. (2010). Metabolic syndrome in Cushing's syndrome. Neuroendocrinology. 1, 96–101. doi: 10.1159/000314272
Correll, C. M., Rosenkranz, J. A., and Grace, A. A. (2005). Chronic cold stress alters prefrontal cortical modulation of amygdala neuronal activity in rats. Biol. Psychiatry. 58, 382–391. doi: 10.1016/j.biopsych.2005.04.009
da Luz, M. H., Peres, I. T., Santos, T. G., Martins, V. R., Icimoto, M. Y., and Lee, K. S. (2015). Dopamine induces the accumulation of insoluble prion protein and affects autophagic flux. Front. Cell. Neurosci. 9, 12. doi: 10.3389/fncel.2015.00012
Dell, L. A., Patzke, N., Spocter, M. A., Siegel, J. M., and Manger, P. R. (2016). Organization of the sleep-related neural systems in the brain of the harbour porpoise (Phocoena phocoena). J. Comp. Neurol. 524, 1999–2017. doi: 10.1002/cne.23929
Finlay, J. M., Zigmond, M. J., and Abercrombie, E. D. (1995). Increased dopamine and norepinephrine release in medial prefrontal cortex induced by acute and chronic stress: effects of diazepam. Neuroscience 64, 619–628. doi: 10.1016/0306-4522(94)00331-X
Flugge, G., Van Kampen, M., and Mijnster, M. J. (2004). Perturbations in brain monoamine systems during stress. Cell Tissue Res. 315, 1–14. doi: 10.1007/s00441-003-0807-0
Fornai, F., and Puglisi-Allegra, S. (2021). Autophagy status as a gateway for stress-induced catecholamine interplay in neurodegeneration. Neurosci. Biobehav. Rev. 123,238–256. doi: 10.1016/j.neubiorev.2021.01.015
Gaykema, R. P. A., Chen, C.-C., and Goehler, L. E. (2007). Organization of immune-responsive medullary projections to the bed nucleus of the stria terminalis, central amygdala, and paraventricular nucleus of the hypothalamus: evidence for parallel viscerosensory pathways in the rat brain. Brain Res. 1130, 130–145. doi: 10.1016/j.brainres.2006.10.084
Goldstein, D. S., and Kopin, I. J. (2018). Linking stress, Catecholamine Autotoxicity, and allostatic load with neurodegenerative diseases: a focused review in memory of richard kvetnansky. Cell. Mol. Neurobiol. 38, 13–24. doi: 10.1007/s10571-017-0497-x
Hagerty, T., Morgan, W. W., Elango, N., and Strong, R. (2001). Identification of a glucocorticoid-responsive element in the promoter region of the mouse tyrosine hydroxylase gene. J. Neurochem. 76, 825–834. doi: 10.1046/j.1471-4159.2001.00072.x
Itoh, H., and Buñag, R. D. (1993). Age-related reduction of reflex bradycardia in conscious rats by catecholaminergic nucleus tractus solitarius lesions. Mech. Ageing Dev. 67, 47–63. doi: 10.1016/0047-6374(93)90111-4
Kang, S. S., Liu, X., Ahn, E. H., Xiang, J., Manfredssonm, F. P., Yang, X., et al. (2020). Norepinephrine metabolite DOPEGAL activates AEP and pathological Tau aggregation in locus coeruleus. J. Clin. Invest. 130,422–437. doi: 10.1172/JCI130513
King, M. A., Scotty, N., Klein, R. L., and Meyer, E. M. (2002). Particle detection, number estimation, and feature measurement in gene transfer studies: optical fractionator stereology integrated with digital image processing and analysis. Methods. 28, 293–299. doi: 10.1016/S1046-2023(02)00235-9
Krieger, D. T., and Glick, S. M. (1974). Sleep EEG stages and plasma growth hormone concentration in states of endogenous and exogenous hypercortisolemia or ACTH elevation. J. Clin. Endocrinol. Metab. 39, 986–1000. doi: 10.1210/jcem-39-6-986
Kubo, T., Goshima, Y., Hata, H., and Misu, Y. (1990). Evidence that endogenous catecholamines are involved in alpha 2-adrenoceptor-mediated modulation of the aortic baroreceptor reflex in the nucleus tractus solitarii of the rat. Brain Res. 526, 313–317. doi: 10.1016/0006-8993(90)91238-C
Kumar, S., Hultman, R., Hughes, D., Michel, N., Katz, B. M., and Dzirasa, K. (2014). Prefrontal cortex reactivity underlies trait vulnerability to chronic social defeat stress. Nat. Commun. 5, 4537. doi: 10.1038/ncomms5537
Kvetnansky, R., Rusnak, M., Dronjak, S., Krizanova, O., and Sabban, E. L. (2003). Effect of novel stressors on tyrosine hydroxylase gene expression in the adrenal medulla of repeatedly immobilized rats. Neurochem. Res. 28, 625–630. doi: 10.1023/A:1022846012174
Kvetnansky, R., Sabban, E. L., and Palkovits, M. (2009). Catecholaminergic systems in stress: structural and molecular genetic approaches. Physiol. Rev. 89, 535–606. doi: 10.1152/physrev.00042.2006
Lewitus, E., Sherwood, C. C., and Hof, P. R. (2012). Cellular signatures in the primary visual cortex of phylogeny and placentation. Brain Struct. Funct. 217, 531–547. doi: 10.1007/s00429-011-0338-5
Likhtik, E., Stujenske, J. M., Topiwala, M. A., Harris, A. Z., and Gordon, J. A. (2014). Prefrontal entrainment of amygdala activity signals safety in learned fear and innate anxiety. Nat. Neurosci. 17, 106–113. doi: 10.1038/nn.3582
Liu, W. Z., Zhang, W. H., Zheng, Z. H., Zou, J. X., Liu, X. X., Huang, S. H., et al. (2020). Identification of a prefrontal cortex-to-amygdala pathway for chronic stress-induced anxiety. Nat. Commun. 11, 2221. doi: 10.1038/s41467-020-15920-7
Loewy, A. D., Franklin, M. F., and Haxhiu, M. A. (1994). CNS monoamine cell groups projecting to pancreatic vagal motor neurons: a transneuronal labeling study using pseudorabies virus. Brain Res. 638, 248–260. doi: 10.1016/0006-8993(94)90657-2
Loughlin, S. E., Foote, S. L., and Grzanna, R. (1986). Efferent projections of nucleus locus coeruleus: morphologic subpopulations have different efferent targets. Neurosci. 18, 307–319. doi: 10.1016/0306-4522(86)90156-9
Mamalaki, E., Kvetnansky, R., Brady, L. S., Gold, P. W., and Herkenham, M. (1992). Repeated immobilization stress alters tyrosine hydroxylase, corticotrophin-releasing hormone and corticosteroid receptor messenger ribonucleic acid levels in rat brain. J. Neuroendocrinol. 4, 689–699. doi: 10.1111/j.1365-2826.1992.tb00220.x
Martinez-Vicente, M., Talloczy, Z., Kaushik, S., Massey, A. C., Mazzulli, J., Mosharov, E. V., et al. (2008). Dopamine-modified alpha-synuclein blocks chaperone-mediated autophagy. J. Clin. Investig. 118, 777–788. doi: 10.1172/JCI32806
Moruzzi, G., and Magoun, H. W. (1949). Brain stem reticular formation and activation of the EEG. Electroencephalogr. Clin. Neurophysiol. 1, 455–473. doi: 10.1016/0013-4694(49)90219-9
Motzkin, J. C., Philippi, C. L., Wolf, R. C., Baskaya, M. K., and Koenigs, M. (2015). Ventromedial prefrontal cortex is critical for the regulation of amygdala activity in humans. Biol. Psychiatry. 77, 276–284. doi: 10.1016/j.biopsych.2014.02.014
Ntali, G., Grossman, A., and Karavitaki, N. (2015). Clinical and biochemical manifestations of Cushing's. Pituitary. 18, 181–187. doi: 10.1007/s11102-014-0631-4
Olson, V. G., Heusner, C. L., Bland, R. J., During, M. J., Weinshenker, D., and Palmiter, R. D. (2006). Role of noradrenergic signaling by the nucleus tractus solitarius in mediating opiate reward. Science. 311, 1017–1020. doi: 10.1126/science.1119311
Paxinos, G., and Franklin, K. B. J. (2001). The Mouse Brain in Stereotaxic Coordinates. 2nd Ed. San Diego: Academic Press.
Quirk, G. J., and Gehlert, D. R. (2003). Inhibition of the amygdala: key to pathological states? Ann. NY Acad. Sci. 985, 263–272. doi: 10.1111/j.1749-6632.2003.tb07087.x
Quirk, G. J., Likhtik, E., Pelletier, J. G., and Pare, D. (2003). Stimulation of medial prefrontal cortex decreases the responsiveness of central amygdala output neurons. J. Neurosci. 23, 8800–8807. doi: 10.1523/JNEUROSCI.23-25-08800.2003
Rauch, S. L., Shin, L. M., and Phelps, E. A. (2006). Neurocircuitry models of posttraumatic stress disorder and extinction: human neuroimaging researchpast, present, and future. Biol. Psychiatry. 60, 376–382. doi: 10.1016/j.biopsych.2006.06.004
Rinaman, L. (1999). Interoceptive stress activates glucagon-like peptide-1 neurons that project to the hypothalamus. Am. J. Physiol. 277, R582–R590. doi: 10.1152/ajpregu.1999.277.2.R582
Roberts, B. L., Zhu, M., Zhao, H., Dillon, C., and Appleyard, S. M. (2017). High glucose increases action potential firing of catecholamine neurons in the nucleus of the solitary tract by increasing spontaneous glutamate inputs. Am. J. Physiol. Regul. Integr. Comp. Physiol. 313, R229–R239. doi: 10.1152/ajpregu.00413.2016
Rosenkranz, J. A., and Grace, A. A. (2001). Dopamine attenuates prefrontal cortical suppression of sensory inputs to the basolateral amygdala of rats. J. Neurosci. 21, 4090–4103. doi: 10.1523/JNEUROSCI.21-11-04090.2001
Rosenkranz, J. A., Moore, H., and Grace, A. A. (2003). The prefrontal cortex regulates lateral amygdala neuronal plasticity and responses to previously conditioned stimuli. J. Neurosci. 23, 11054–11064. doi: 10.1523/JNEUROSCI.23-35-11054.2003
Rusnak, M., Kvetnansky, R., Jelokova, J., and Palkovits, M. (2001). Effect of novel stressors on gene expression of tyrosine hydroxylase and monoamine transporters in brainstem noradrenergic neurons of long-term repeatedly immobilized rats. Brain Res. 899, 20–35. doi: 10.1016/S0006-8993(01)02126-6
Saper, C. B., Chou, T. C., and Elmquist, J. K. (2002). The need to feed: homeostatic and hedonic control of eating. Neuron 36, 199–211. doi: 10.1016/S0896-6273(02)00969-8
Schild, J. H., Clark, J. W., Hay, M., Mendelowitz, D., Andresen, M. C., and Kunze, D. L. (1994). A- and C-type rat nodose sensory neurons: model interpretations of dynamic discharge characteristics. J. Neurophysiol. 71, 2338–2358. doi: 10.1152/jn.1994.71.6.2338
Serova, L., Danailov, E., Chamas, F., and Sabban, E. L. (1999). Nicotine infusion modulates immobilization stress-triggered induction of gene expression of rat catecholamine biosynthetic enzymes. J. Pharmacol. Exp. Ther. 291, 884–892.
Serova, L., Sabban, E. L., Zangen, A., Overstreet, D. H., and Yadid, G. (1998). Altered gene expression for catecholamine biosynthetic enzymes and stress response in rat genetic model of depression. Brain Res. 63, 133–138. doi: 10.1016/S0169-328X(98)00270-8
Shipley, J. E., Schteingart, D. E., Tandon, R., and Starkman, M. N. (1992). Sleep architecture and sleep apnea in patients with Cushing's disease. Sleep. 15, 514–518. doi: 10.1093/sleep/15.6.514
Simon, O. R., Basuray, B. N., West, W. L., and Copeland, R. (1985). Interaction between the baroreflex and anterior hypothalamic stimulation. Demonstration of a noradrenergic involvement. Neuropharmacology. 24, 665–675. doi: 10.1016/0028-3908(85)90110-8
Sloviter, R. S., Valiquette, G., Abrams, G. M., Ronk, E. C., Sollas, A. L., Paul, L. A., et al. (1989). Selective loss of hippocampal granule cells in the mature rat brain after adrenalectomy. Science. 243, 535–538. doi: 10.1126/science.2911756
Sotres-Bayon, F., and Quirk, G. J. (2010). Prefrontal control of fear: more than just extinction. Curr. Opin. Neurobiol. 20, 231–235. doi: 10.1016/j.conb.2010.02.005
Starkman, M. N., Schteingart, D. E., and Schork, M. A. (1992). Discordant changes in plasma ACTH and beta-lipotropin/beta-endorphin levels in Cushing's disease patients with depression. Psychoneuroendocrinology 17, 619–626. doi: 10.1016/0306-4530(92)90020-8
Sugama, S., Sekiyama, K., Kodama, T., Takamatsu, Y., Takenouchi, T., Hashimoto, M., et al. (2016). Chronic restraint stress triggers dopaminergic and noradrenergic neurodegeneration: Possible role of chronic stress in the onset of Parkinson's disease. Brain Behav. Immun. 51, 39–46. doi: 10.1016/j.bbi.2015.08.015
Sullivan, R. M. (2004). Hemispheric asymmetry in stress processing in rat prefrontal cortex and the role ofmesocortical dopamine. Stress 7, 131–143. doi: 10.1080/102538900410001679310
Tumer, N., Demirel, H. A., Serova, L., Sabban, E. L., Broxson, C. S., and Powers, S. K. (2001). Gene expression of catecholamine biosynthetic enzymes following exercise: modulation by age. Neurosci. 103, 703–711. doi: 10.1016/S0306-4522(01)00020-3
Valles, A., Marti, O., and Armario, A. (2006). Long-term effects of a single exposure to immobilization: a c-fos mRNA study of the response to the homotypic stressor in the rat brain. J. Neurobiol. 66, 591–602. doi: 10.1002/neu.20252
Wallace, D. M., Magnuson, D. J., and Gray, T. S. (1989). The amygdalo-brainstem pathway: selective innervation of dopaminergic, noradrenergic and adrenergic cells in the rat. Neurosci. Lett. 97, 252–258. doi: 10.1016/0304-3940(89)90606-x
Watanabe, Y., McKittrick, C. R., Blanchard, D. C., Blanchard, R. J., McEwen, B. S., and Sakai, R. R. (1995). Effects of chronic social stress on tyrosine hydroxylase mRNA and protein levels. Brain Res. 32, 176–180. doi: 10.1016/0169-328X(95)00081-3
West, M. J., Ostergaard, K., Andreassen, O. A., and Finsen, B. (1996). Estimation of the number of somatostatin neurons in the striatum: an in situ hybridization study using the optical fractionator method. J. Comp Neurol. 370, 11–22. doi: 10.1002/(SICI)1096-9861(19960617)370:1<11::AID-CNE2>3.0.CO;2-O
Keywords: area postrema, retrorubral field, brainstem, Cushing's syndrome, catecholamines, glucocorticoids, glucose tolerance
Citation: Busceti CL, Bucci D, Scioli M, Di Pietro P, Nicoletti F, Puglisi-Allegra S, Ferrucci M and Fornai F (2022) Chronic treatment with corticosterone increases the number of tyrosine hydroxylase-expressing cells within specific nuclei of the brainstem reticular formation. Front. Neuroanat. 16:976714. doi: 10.3389/fnana.2022.976714
Received: 23 June 2022; Accepted: 06 October 2022;
Published: 28 October 2022.
Edited by:
Javier DeFelipe, Polytechnic University of Madrid, SpainReviewed by:
Carlos A. Mejias-Aponte, National Institute on Drug Abuse (NIH), United StatesJackson Cioni Bittencourt, University of São Paulo, Brazil
Copyright © 2022 Busceti, Bucci, Scioli, Di Pietro, Nicoletti, Puglisi-Allegra, Ferrucci and Fornai. This is an open-access article distributed under the terms of the Creative Commons Attribution License (CC BY). The use, distribution or reproduction in other forums is permitted, provided the original author(s) and the copyright owner(s) are credited and that the original publication in this journal is cited, in accordance with accepted academic practice. No use, distribution or reproduction is permitted which does not comply with these terms.
*Correspondence: Francesco Fornai, ZnJhbmNlc2NvLmZvcm5haUBtZWQudW5pcGkuaXQ=
†These authors have contributed equally to this work