 Vinod Jangir Kumar
 Klaus Scheffler1,2
 Gisela E. Hagberg
 Wolfgang Grodd
94% of researchers rate our articles as excellent or good
Learn more about the work of our research integrity team to safeguard the quality of each article we publish.
Find out more
ORIGINAL RESEARCH article
Front. Neuroanat. , 16 September 2021
Volume 15 - 2021 | https://doi.org/10.3389/fnana.2021.725731
This article is part of the Research Topic Thalamic Interactions with the Basal Ganglia: Thalamostriatal System and Beyond View all 7 articles
The thalamus (Th) and basal ganglia (BG) are central subcortical connectivity hubs of the human brain, whose functional anatomy is still under intense investigation. Nevertheless, both substructures contain a robust and reproducible functional anatomy. The quantitative susceptibility mapping (QSM) at ultra-high field may facilitate an improved characterization of the underlying functional anatomy in vivo. We acquired high-resolution QSM data at 9.4 Tesla in 21 subjects, and analyzed the thalamic and BG by using a prior defined functional parcellation. We found a more substantial contribution of paramagnetic susceptibility sources such as iron in the pallidum in contrast to the caudate, putamen, and Th in descending order. The diamagnetic susceptibility sources such as myelin and calcium revealed significant contributions in the Th parcels compared with the BG. This study presents a detailed nuclei-specific delineation of QSM-provided diamagnetic and paramagnetic susceptibility sources pronounced in the BG and the Th. We also found a reasonable interindividual variability as well as slight hemispheric differences. The results presented here contribute to the microstructural knowledge of the Th and the BG. In specific, the study illustrates QSM values (myelin, calcium, and iron) in functionally similar subregions of the Th and the BG.
Thalamus (Th) and basal ganglia (BG) are the major subcortical structures within the human brain housing a variety of cerebral functions. Here, Th serves as the central control and integration center. It is also referred to as the “gateway to the cortex” (Jones, 2007; Sherman and Guillery, 2009). The term BG defines a group of closely connected cell masses situated at the base of the telencephalon and on the top of the mesencephalon surrounding the adjacent diencephalon. The BG is involved in selective behavior, motor learning, and the control of dopamine neuron activity and value-based decisions (Kelly and Strick, 2004). The BG circuits in rodents and primates had most likely evolved already at the dawn of vertebrate evolution (Nieuwenhuys et al., 2008). They classically refer to three large subcortical nuclear masses. The caudate nucleus (NC), putamen (PU), and pallidal complex are composed of external (GPe) and internal segments (GPi) of globus pallidus (GP) and ventral pallidum. In addition, two closely related structures, substantia nigra and subthalamic nucleus are generally included as components of BG (Lanciego, 2012), but they will not be considered here. One part of BG encompassing NC and PU is the penetration by fascicles of the cortico- and striatofugal axons, also assigned as the striatum. The striatum (NC + GP) hosts the largest subcortical cell mass of the brain; it is functionally divided into a ventral and a dorsal part.
Due to the importance of Th and BG in health and disease (Herrero et al., 2002; DeLong and Wichmann, 2007; Paprocka et al., 2020), several in vivo studies have been performed by using different MRI modalities to investigate their functional and anatomical properties (Wu et al., 2012; Imai et al., 2018; Filyushkina et al., 2019). In particular, quantitative susceptibility mapping (QSM) provides a novel MRI contrast mechanism to quantify iron and biomarkers, including myelin, calcium, gadolinium, and super-paramagnetic iron oxide nanoparticles (Liu et al., 2015; Möller et al., 2019). The QSM provides excellent subcortical gray-matter nuclei contrast compared to the conventional MRI sequences such as T1- and T2-weighted. Therefore, QSM has been repeatedly used to depict typical subcortical structures and pathological alterations in Parkinson’s, Alzheimer’s, and other such diseases (Wang and Liu, 2015; Santin et al., 2016; Shahmaei et al., 2019; Liu et al., 2021). However, previous QSM work has also revealed that a refined depiction of subcortical anatomy requires field strength > 3 Tesla to sufficiently assess the finer details of subcortical structures (Loureiro et al., 2018; Alkemade et al., 2020).
As the Th and BG are composed of cell bodies with dendritic arborizations and densely myelinated connectivity hubs containing both projecting and receiving fibers, we hypothesize that in the QSM map, Th and BG show diamagnetic and paramagnetic sources of variable composition. Few studies depict that the microstructural properties of Th and BG using up to 7T MR QSM maps. Given the significant functional and structural importance of Th–BG, there is a motive to investigate it in a finer scale of resolution at higher field strengths. We, therefore, investigated diamagnetic and paramagnetic sources by using a predefined functional parcellation of Th and BG in a sample of 21 normal subjects by using QSM with ultrahigh-resolution data obtained at 9.4 Tesla.
Twenty-one healthy volunteers (thirteen male, eight female, 20–56 years old) without any neurological disorders were screened through a qualified rigorous safety assessment of a qualified doctor, and scanned at 9.4 Tesla (Siemens Medical Solutions, Erlangen, Germany) by using a 16-channel transmit/31-channel receive array (Shajan et al., 2014). B1-mapping, anatomical MP2RAGE images (Hagberg et al., 2017) and monopolar multiecho 3D gradient echo (GRE) images with 5 echoes and echo times, TE = 6–30 ms in steps of 6 ms; a repetition time TR = 35 ms; and nominal FA = 11° with a voxel size of 375 × 375 × 800 μm were acquired with an axial prescription.
A brief overview of the analysis workflow is illustrated in Figure 1.
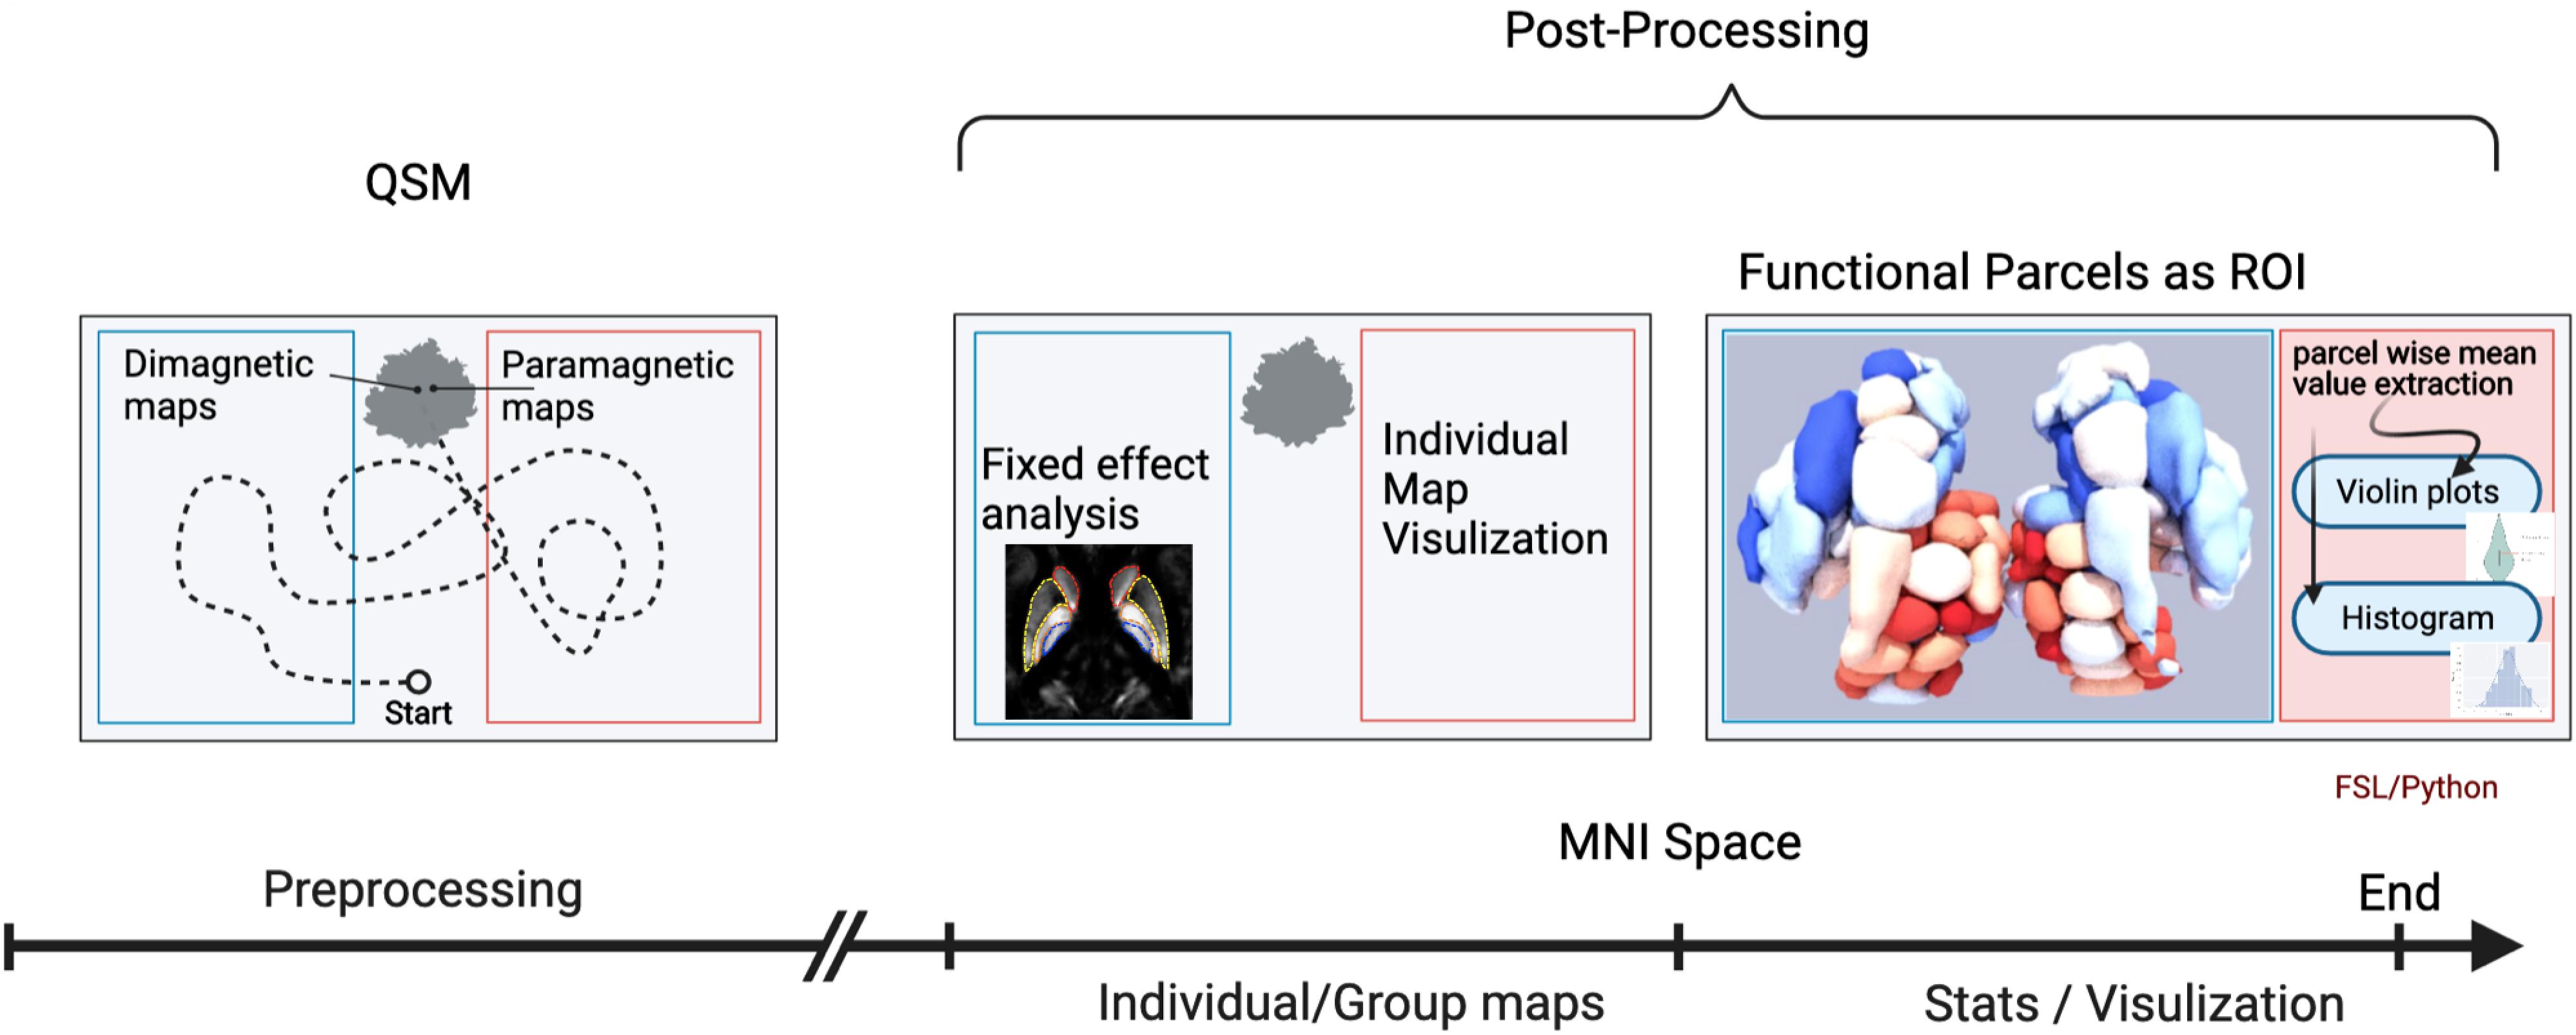
Figure 1. Workflow of the quantitative susceptibility mapping (QSM) evaluation. An illustration of the workflow depicts the analysis steps. The first analysis step was a mix of several preprocessing steps: (1) generation of QSM maps by using background removal imposing image smoothness and moderate contrast; (2) transformation into standard MNI brain space, after co-registration to anatomy data of each individual subject with known spatial transformation (DARTEL), and reslicing onto a grid with isotropic 400 μm voxels using trilinear interpolation; (3) bifurcation/subdivision into diamagnetic and paramagnetic components. In the next step, the diamagnetic and paramagnetic maps were bifurcated from the normalized QSM maps. Afterward, in the post-processing steps, individual as well as group fixed maps were visualized. The last analysis step encompasses statistics and visualization of the group results. The graphical workflow was created with BioRender.com https://app.biorender.com/biorender-templates.
Quantitative susceptibility mapping maps were reconstructed and preprocessed by using coil offset correction and adaptive coil combination before a Laplacian unwrapping, phase-based masking, as described previously (Hagberg et al., 2020). Whole-slab phase referencing followed by the variable-kernel (VSHARP) background removal and dipole inversion was done by using STI-studio. After coregistration to anatomical images, the QSM maps were normalized to the MNI space and multiplied by 1,000 to obtain standardized data in the ppb range.
In the first step, the MNI-spaced atlas were resliced to 400-micron native data resolution by using FMRIB Software Library (FSL) (Jenkinson et al., 2012). The choice to bring native space data into a common brain space compromises between obtaining sufficient anatomical detail and minimizing distortions due to the nonlinear transformation. Positive QSM values were assigned to paramagnetic maps, setting all other voxels to zero (>0) and vice versa; negative values (<0) were assigned to the diamagnetic maps.
The fixed effect (Figure 2) and individual maps were visualized for diamagnetic and paramagnetic contributions within BG and Th (Figures 3, 5).
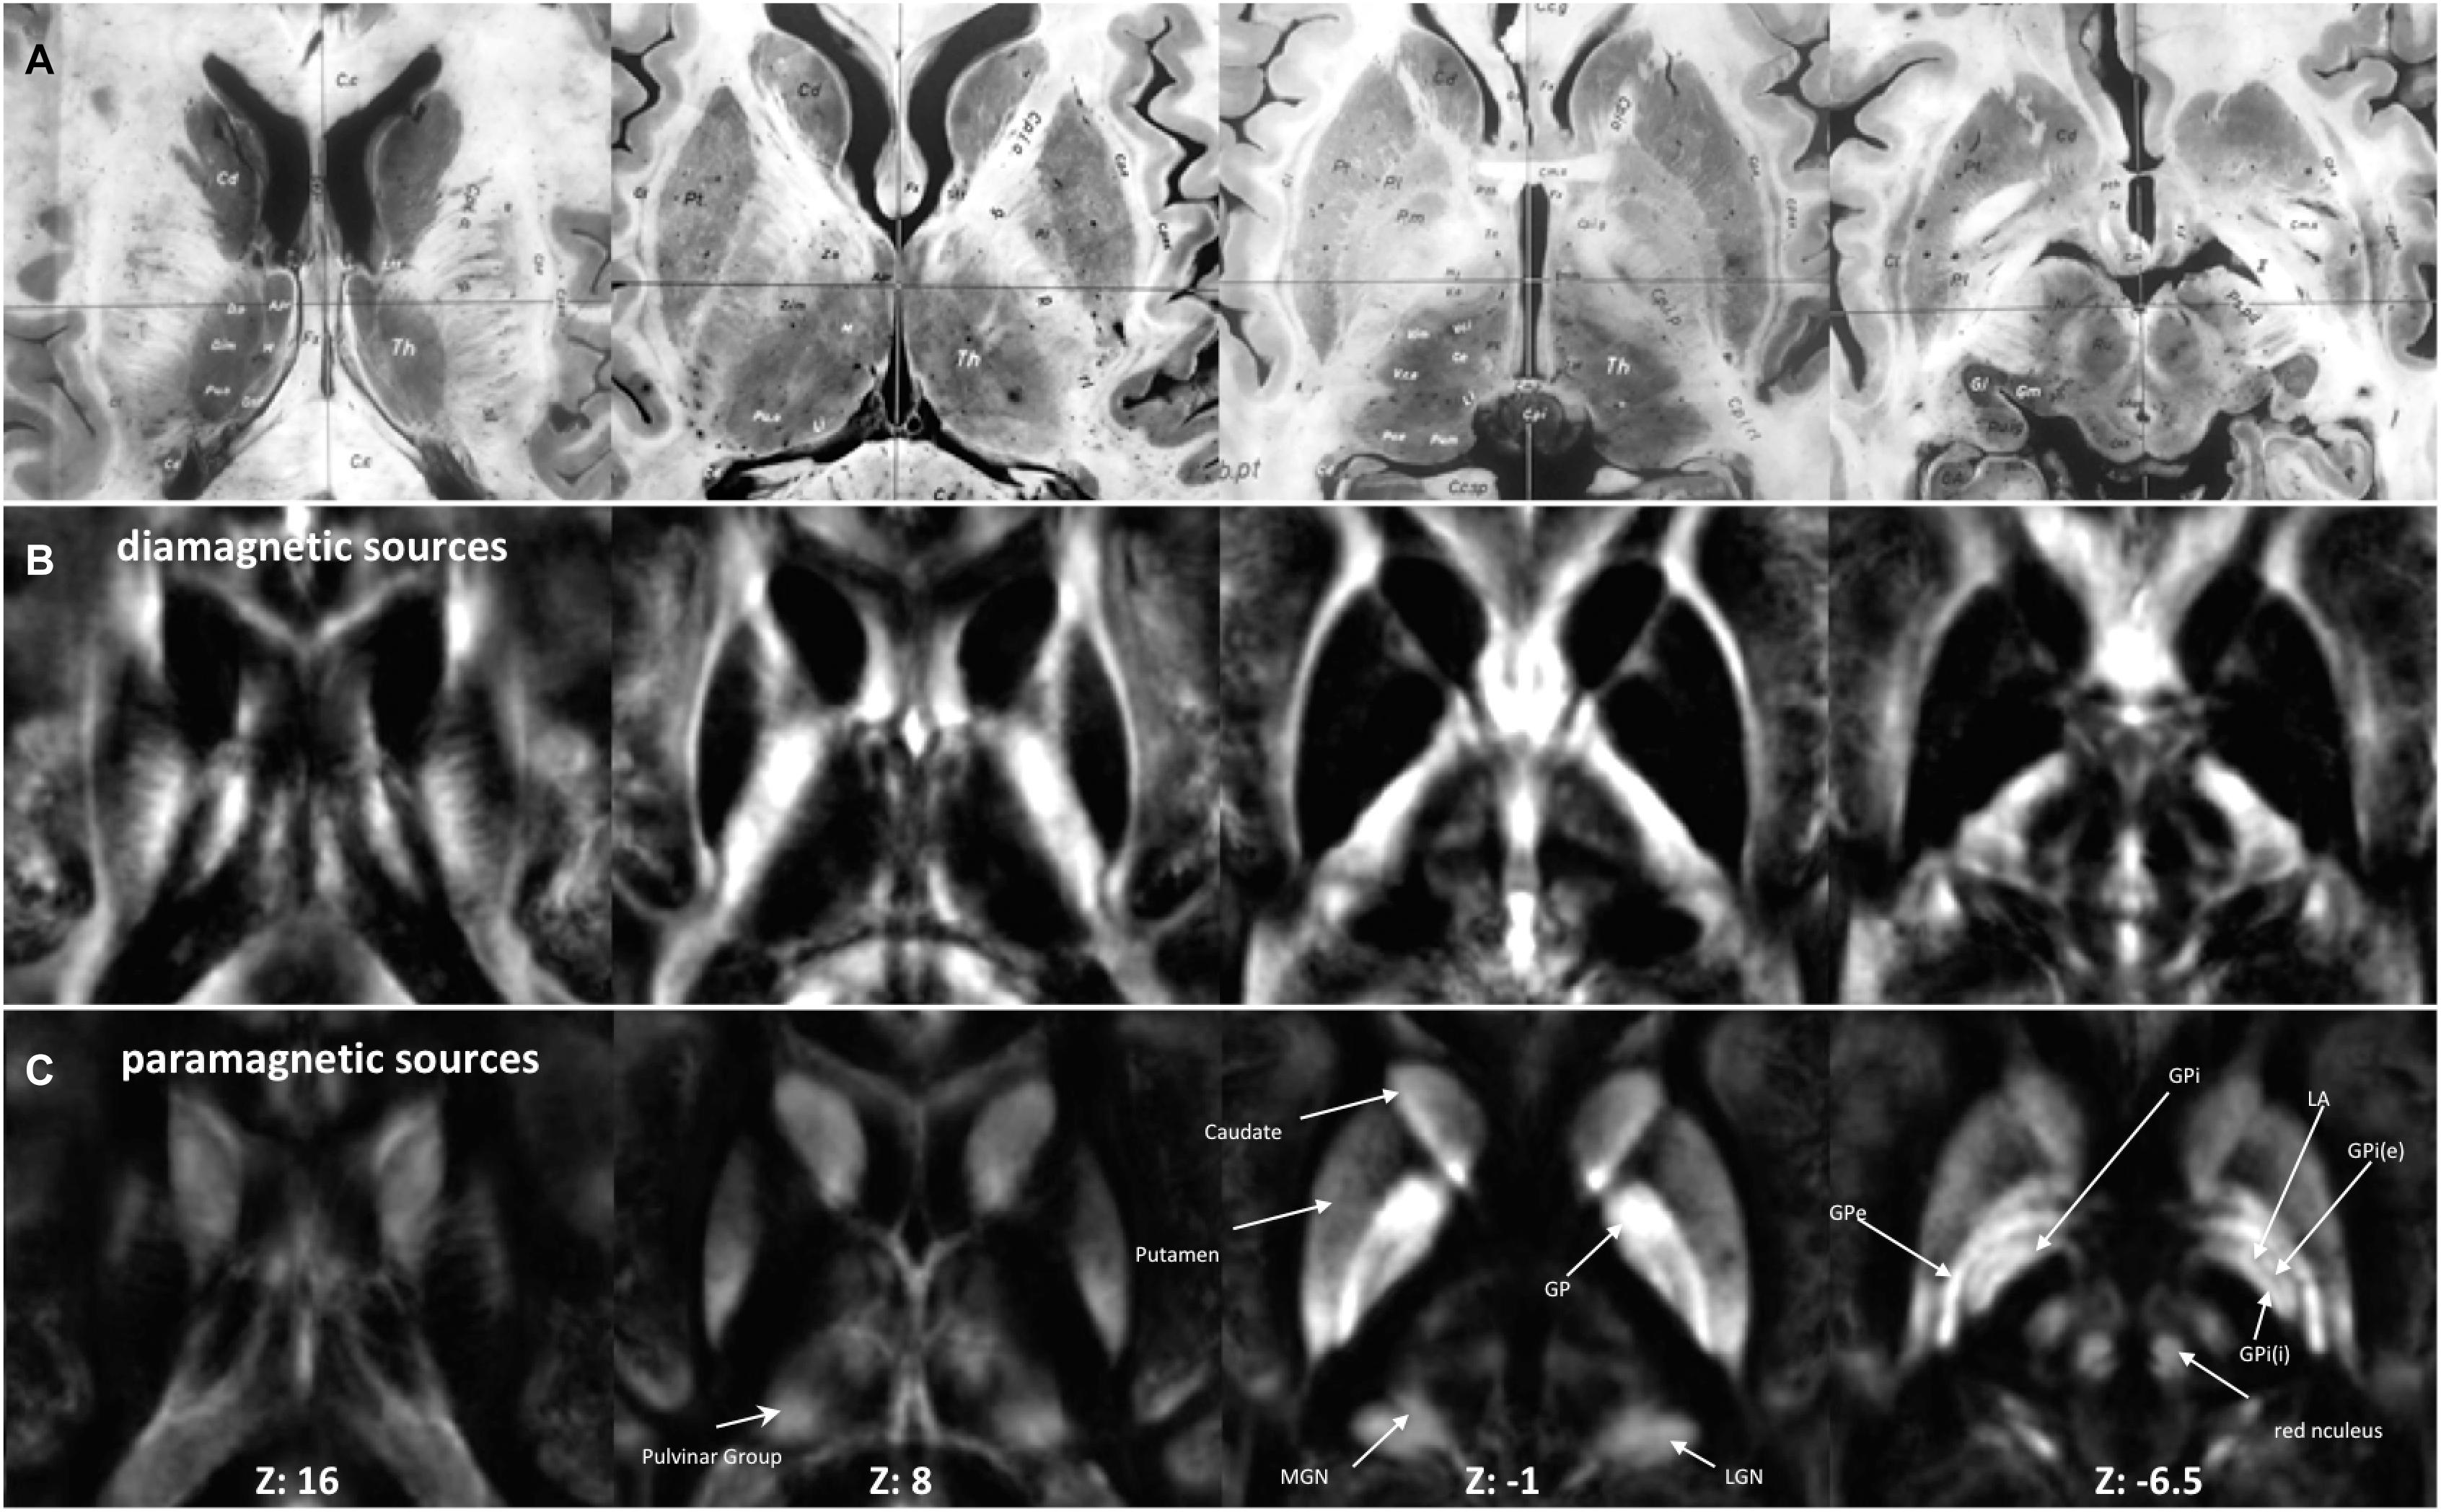
Figure 2. Anatomy and MRI of thalamus (Th) and basal ganglia (BG): (A) four selected slices were adapted (Schaltenbrand and Bailey, 1959) (B,C) Corresponding QSM images of diamagnetic and paramagnetic sources. GPe, external segments of the globus pallidus; GPi, internal segments of the globus pallidus; GPi (e), subsegment of internal segments of the globus pallidus; GPi (i), subsegment of internal segments of the globus pallidus; LGN, lateral geniculate nucleus; MGN, medial geniculate nucleus; LA, lamina accessoria.
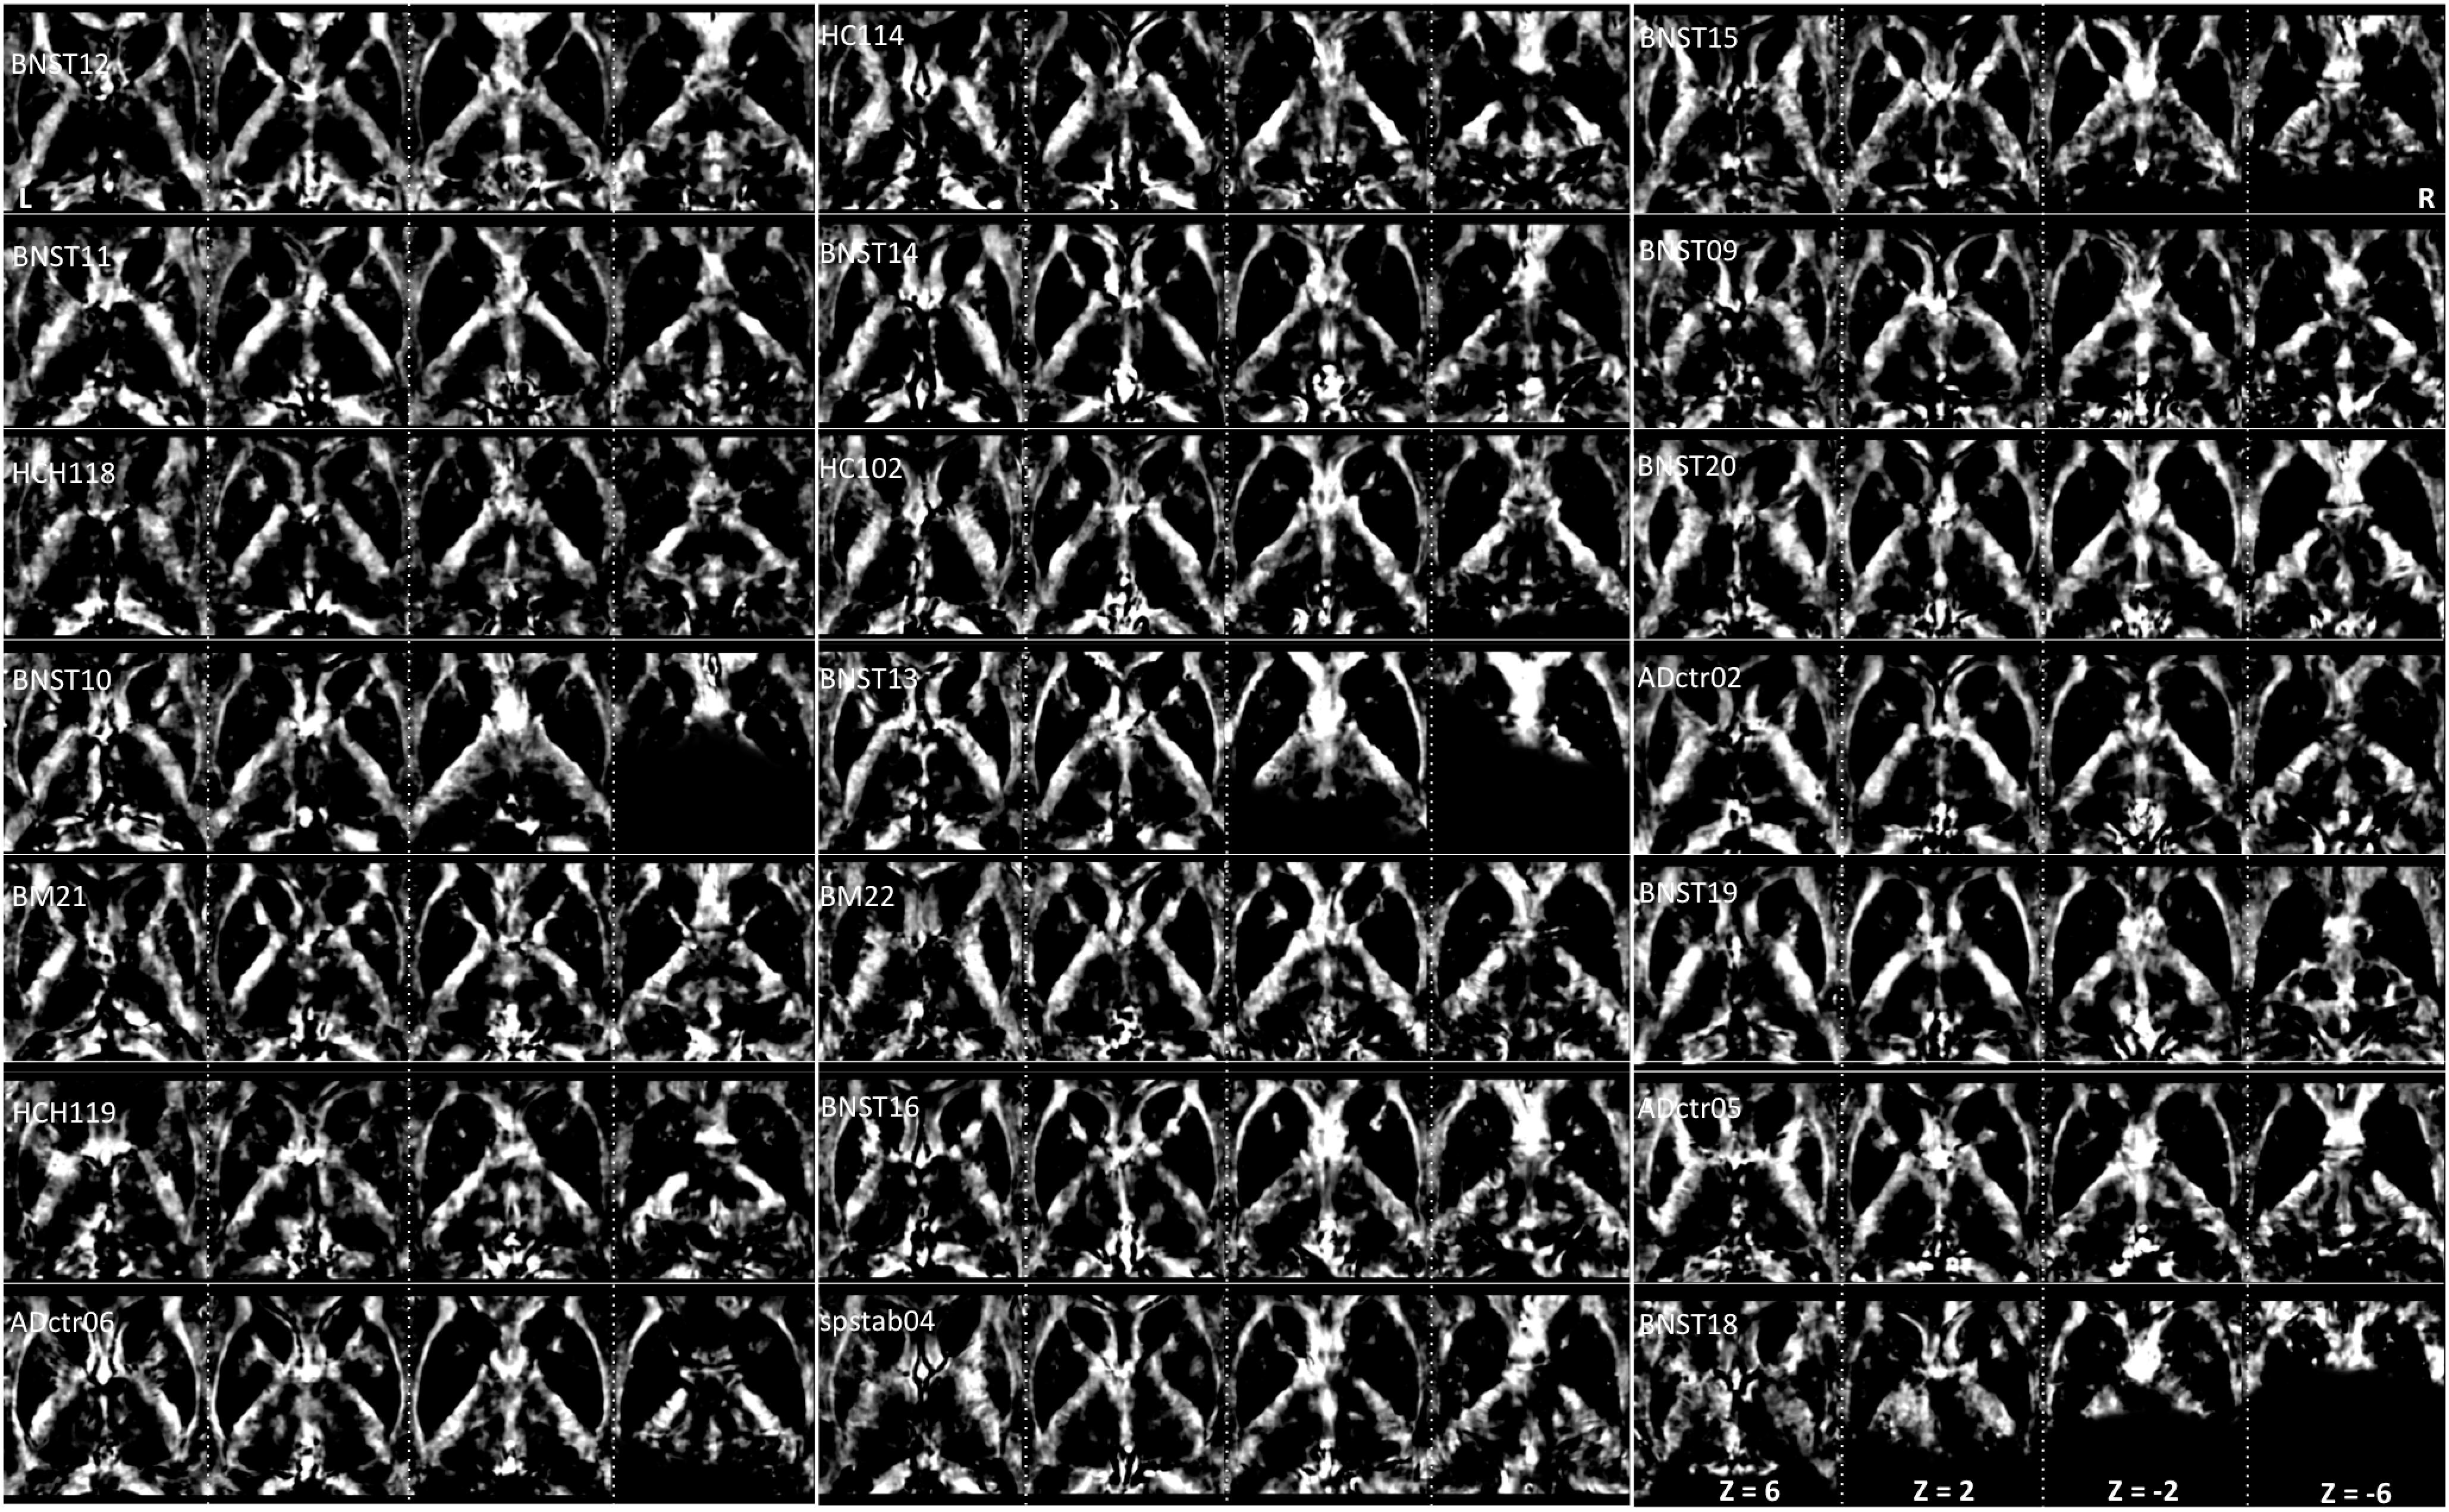
Figure 3. Interindividual maps: QSM images of diamagnetic sources (myelin and calcium, etc.) were obtained from 21 subjects ordered with increasing age. The grayscale color code indicates brighter values in the highly myelinated structures. In the grayscale, brighter values indicate higher and darker lower values. Note the highest values in the internal capsule: Th, NC, PU, and GP display lower values. However, in the quantitative analysis, the difference converges, as the scale of differences in the visualization is heavily biased by the internal capsule fiber contrast. Three subjects (BNST10, BNST13, and BNST18) show only partial coverage.
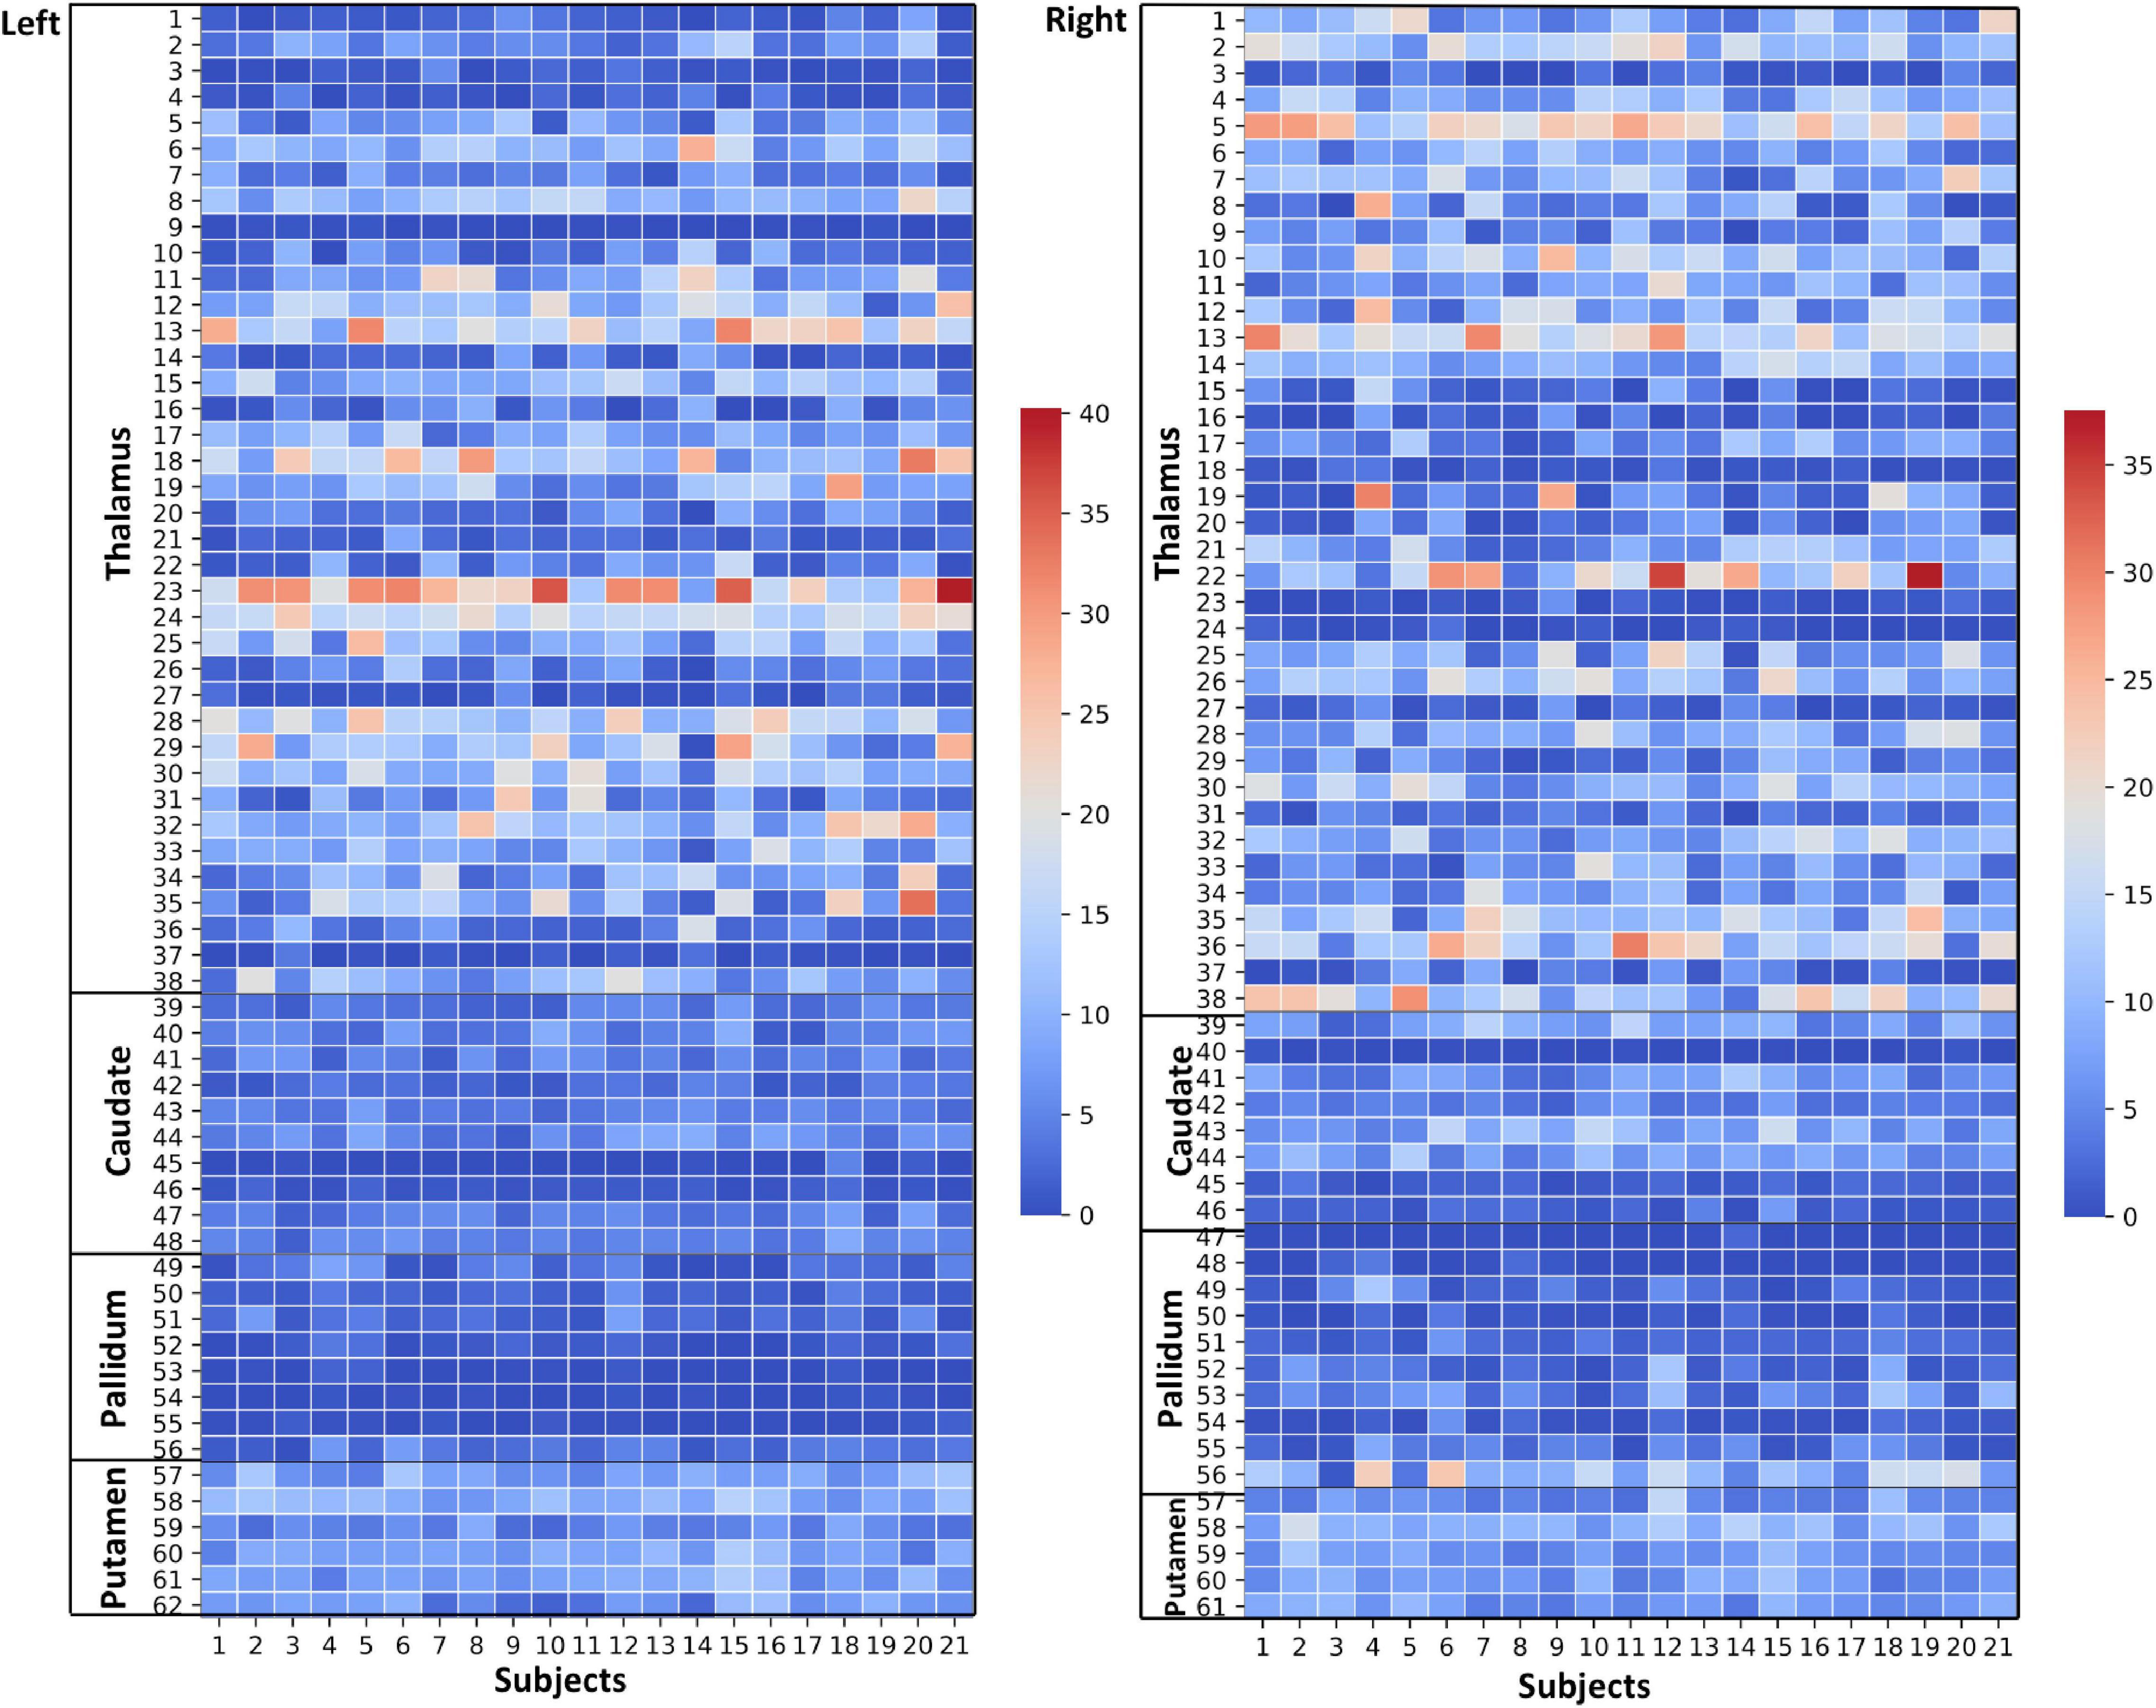
Figure 4. Thalamus and Basal Ganglia (Diamagnetic sources, i.e., Myelin, Calcium, etc.): Left hemisphere: Mean diamagnetic source values for all parcels in all subjects in the left hemisphere. Each column represents each subject. Each row represents a functional parcel. The total number of functional parcels is 62, i.e., Thalamus (38) + Caudate (10) + Pallidum (8) + Putamen. (6) Right hemisphere: Mean diamagnetic source values for all parcels in all subjects in the right hemisphere. The total number of ICP functional parcels is 61 i.e., Thalamus (38) + Caudate (8) + Pallidum (10) + Putamen (5). Note the higher values in some thalamus parcels compared to other structures.
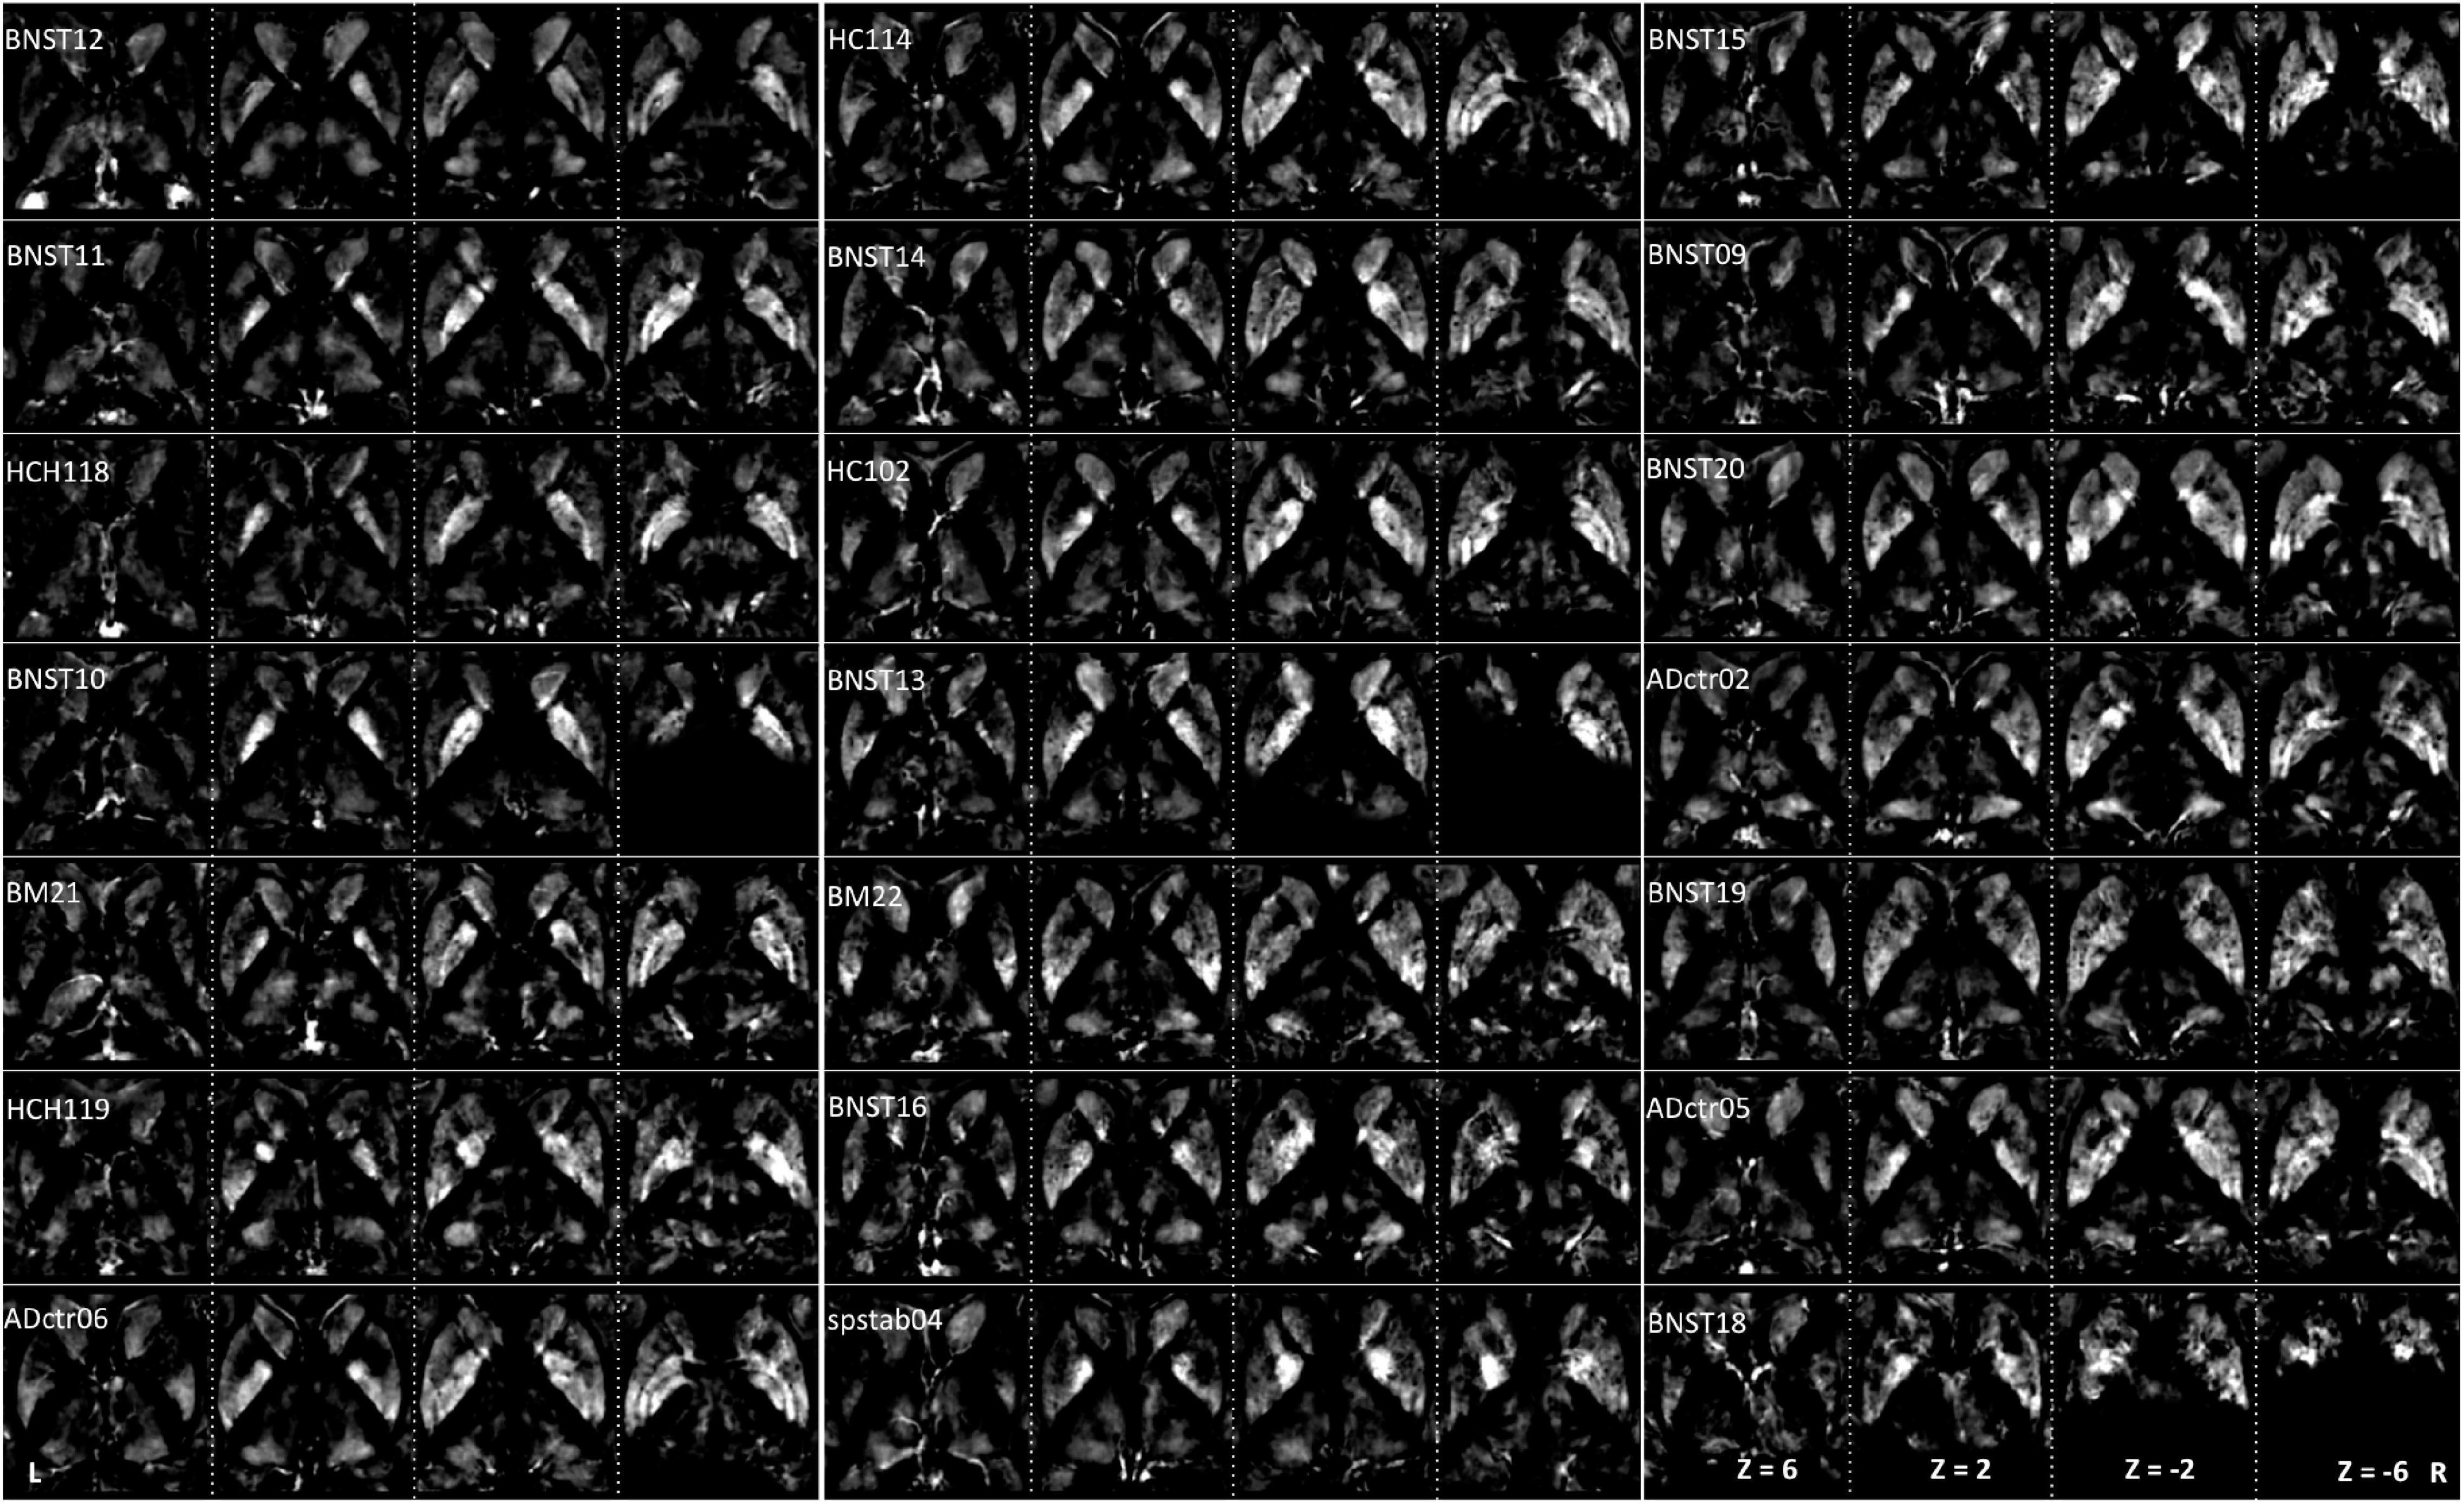
Figure 5. Intervididual maps: QSM images of paramagnetic sources (iron, etc.) obtained from 21 subjects ordered with increasing age. The grayscale color code indicates brighter values in the highly myelinated structures. Note the highest values in the pallidum, caudate, at the specific sites in putamen and thalamus. Darker values indicate lower values. Three subjects (BNST10, BNST13, BNST18) show only partial coverage.
A parcel-specific analysis was performed by using an existing functional parcellation of Th, NC, PU, and GP. The robust and reproducible parcellation of Th and BG was achieved by using instantaneous correlation analysis (Kumar et al., 2017; van Oort et al., 2018) at 7 Tesla HCP rfMRI data (Kumar et al., 2019). In the next step, nuclei-specific QSM means were computed for the left and right hemispheres in the diamagnetic and paramagnetic maps. Subject-specific mean values (Figures 4, 6), histogram (Figure 7), and violin plots (Figures 8, 10) were visualized to depict respective comparisons, i.e., quantitative overview and descriptive statistics.
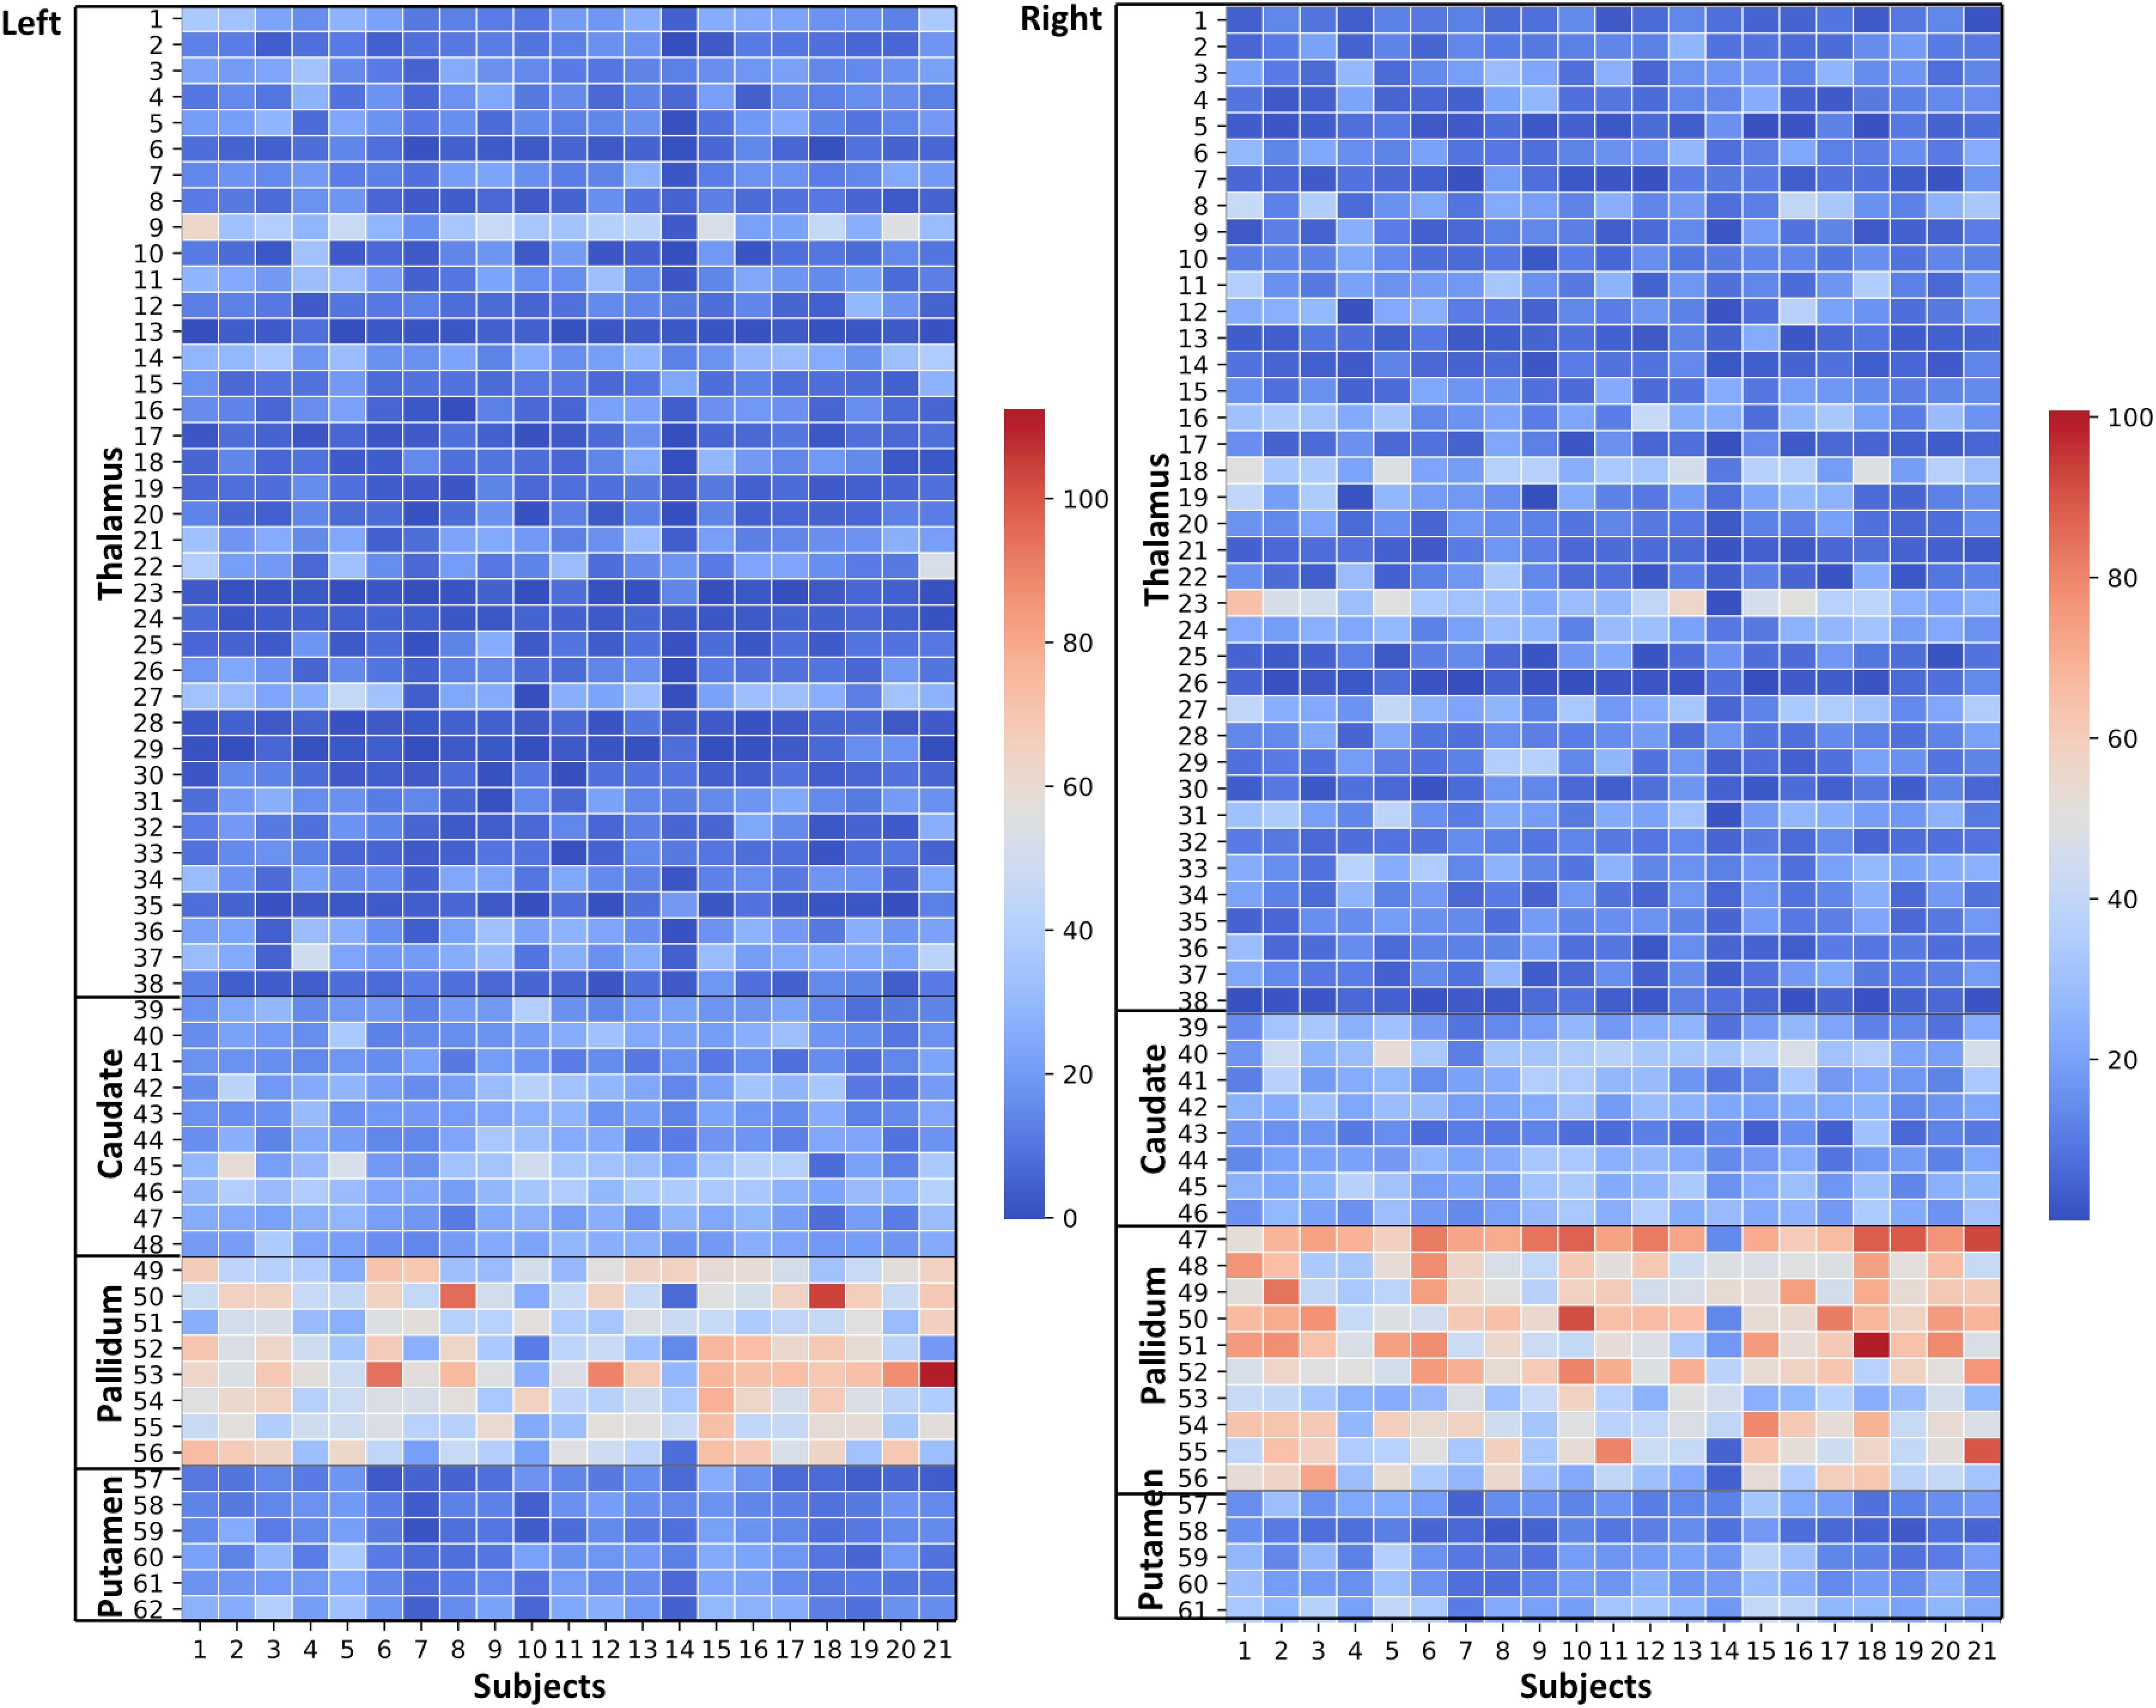
Figure 6. Effects of paramagnetic sources (iron) in Th and BG: Left hemisphere: Mean diamagnetic source values for all parcels in all subjects. Each column represents each subject. Each row represents a functional parcel. The total number of ICP functional parcels are 62, i.e., Th (38) + caudate (10) + pallidum (8) + putamen (6). Note the higher mean values in pallidum and some of Th parcels compared to other structures. Right hemisphere: Mean diamagnetic source values for all parcels in all subjects. Each column represents each subject. Each row represents a functional parcel. The total number of ICP functional parcels are 61, i.e., Th (38) + caudate (8) + pallidum (10) + putamen (5). Note the higher mean values in pallidum and some of Th parcels compared to other structures.
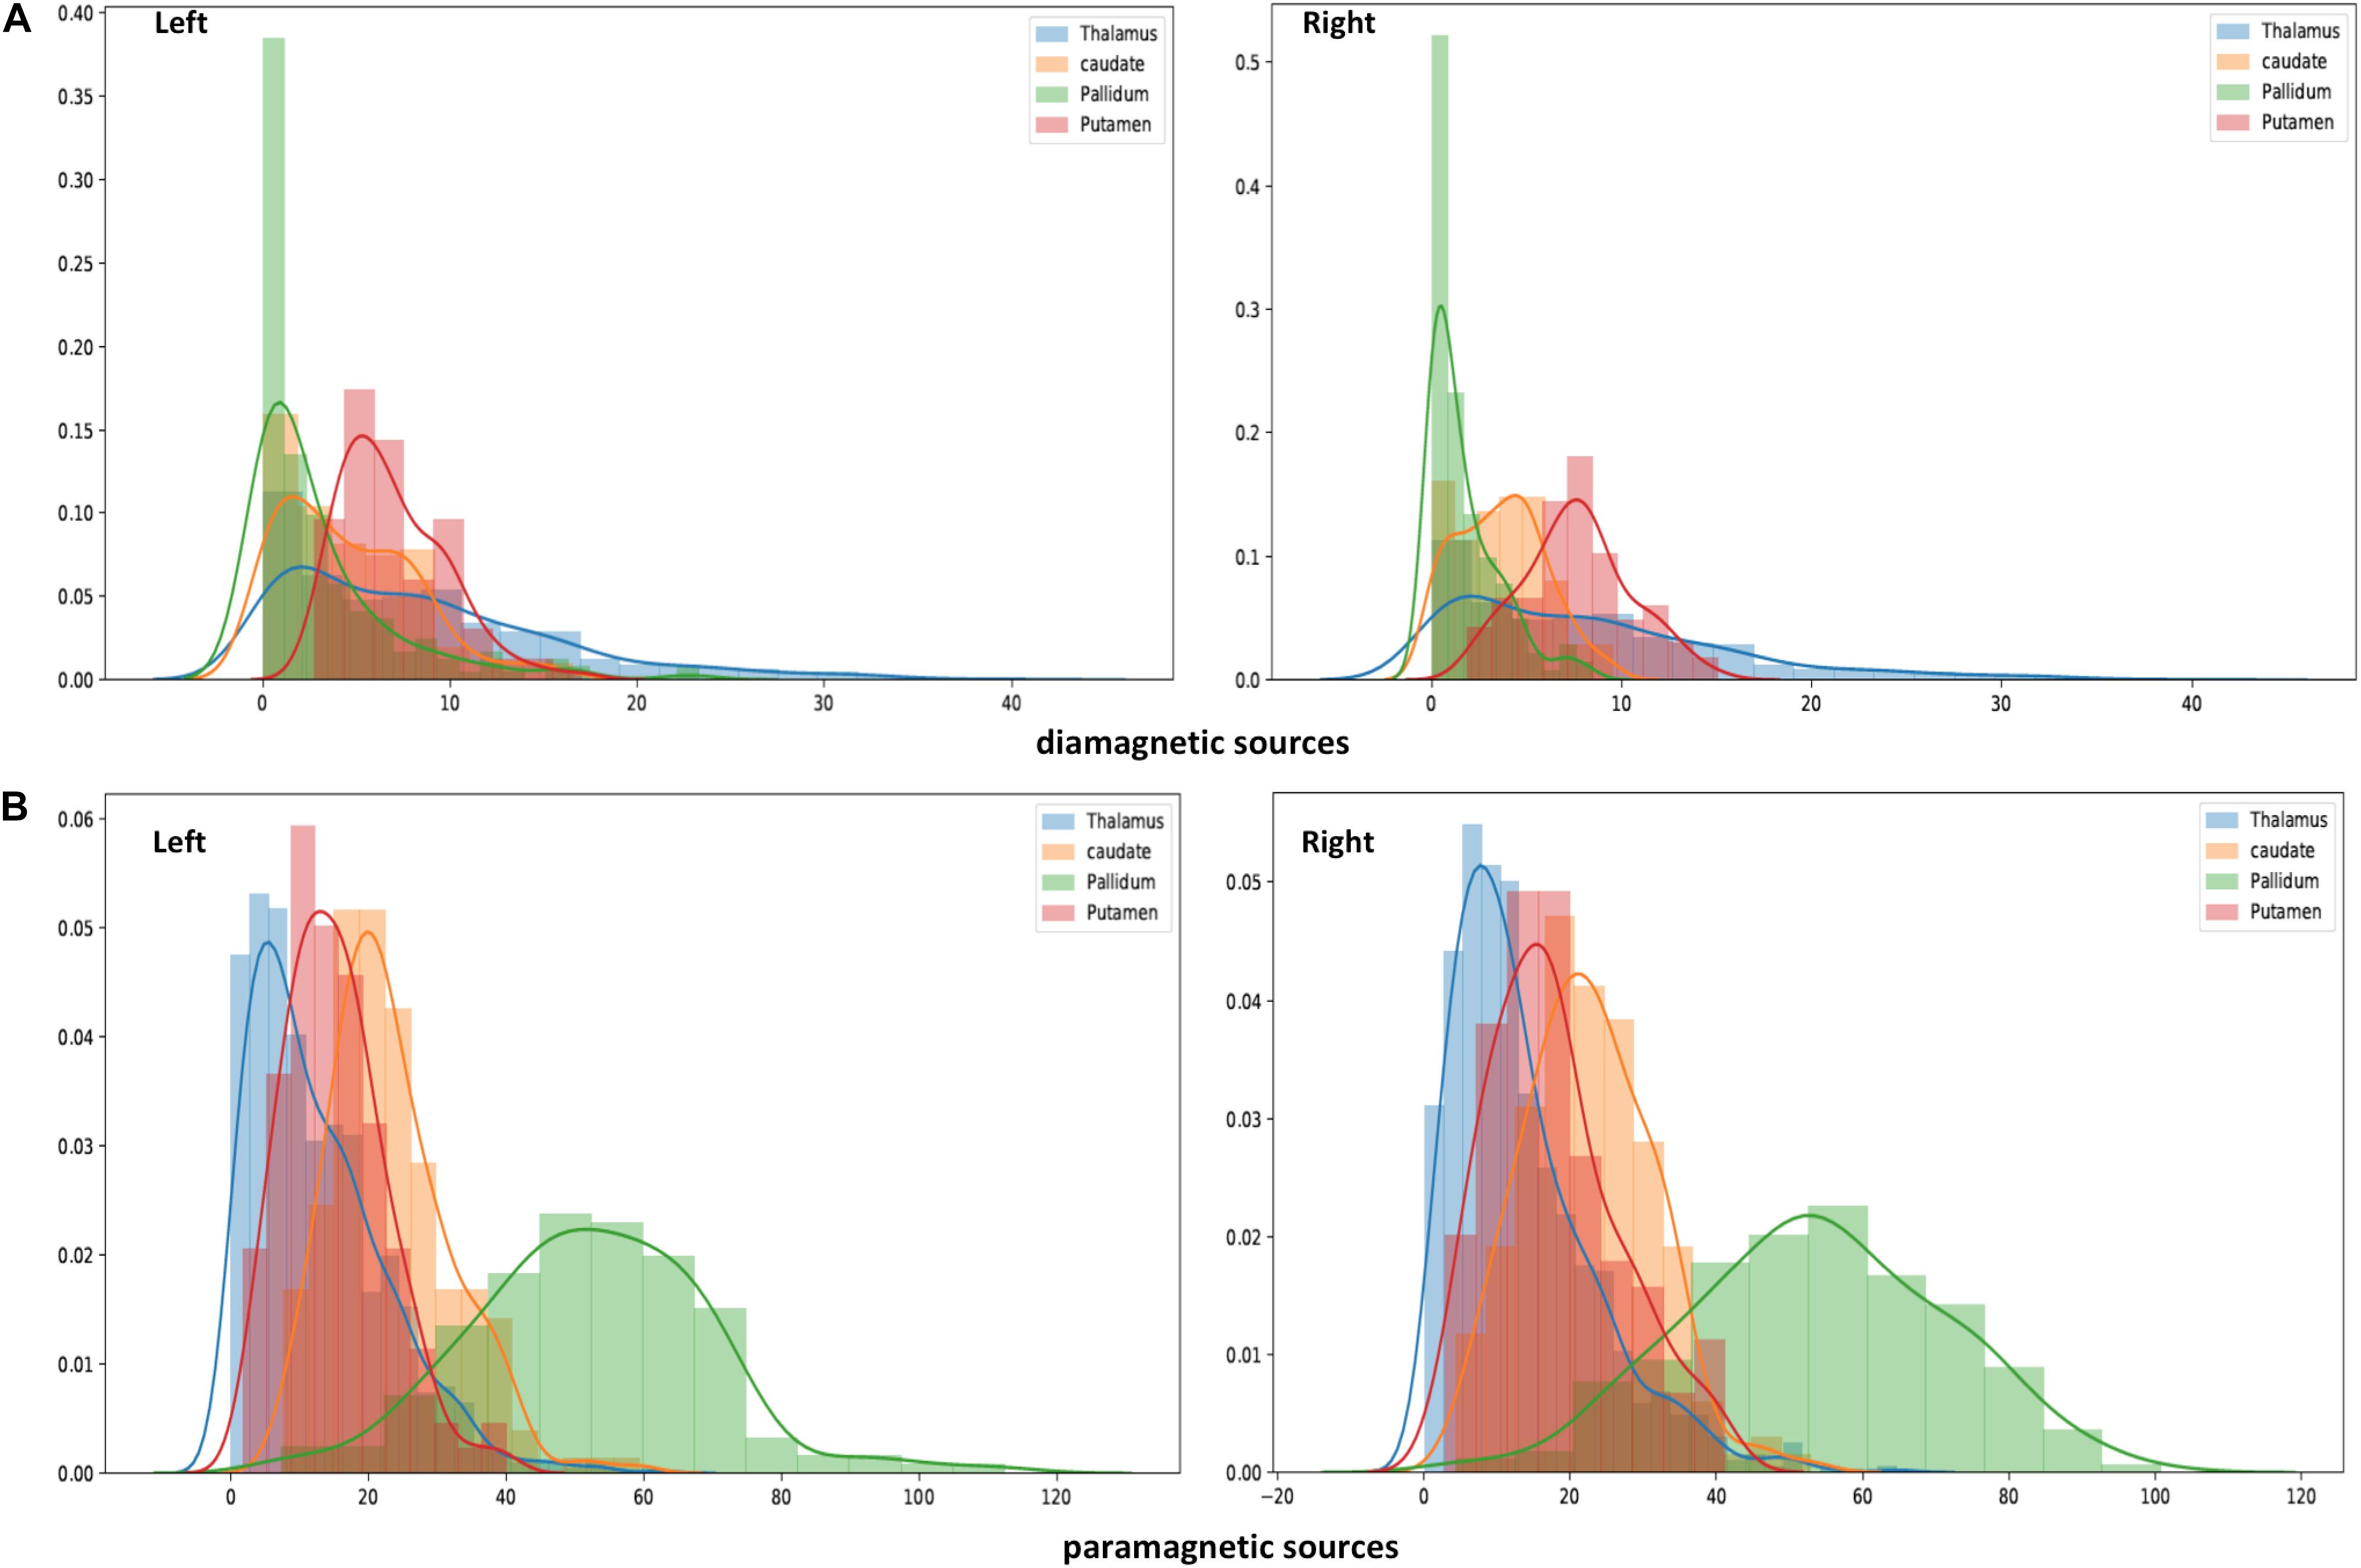
Figure 7. Histogram of QSM-values in diamagnetic (A) and paramagnetic sources (B): Distribution of mean di- and paramagnetic sources within Th and BG. The different colors indicate corresponding structures. The X-axis depicts different QSM values and the Y-axis depicts the amount of each value. Note the differences, where the diamagnetic source, the pallidum, shows the first peak, caudate the second, putamen the third, and Th in the last, while for the mean paramagnetic source, Th shows the first peak, putamen the second, caudate the third, and pallidum the last. Overall, the diamagnetic sources span a more narrow range of values than paramagnetic sources.
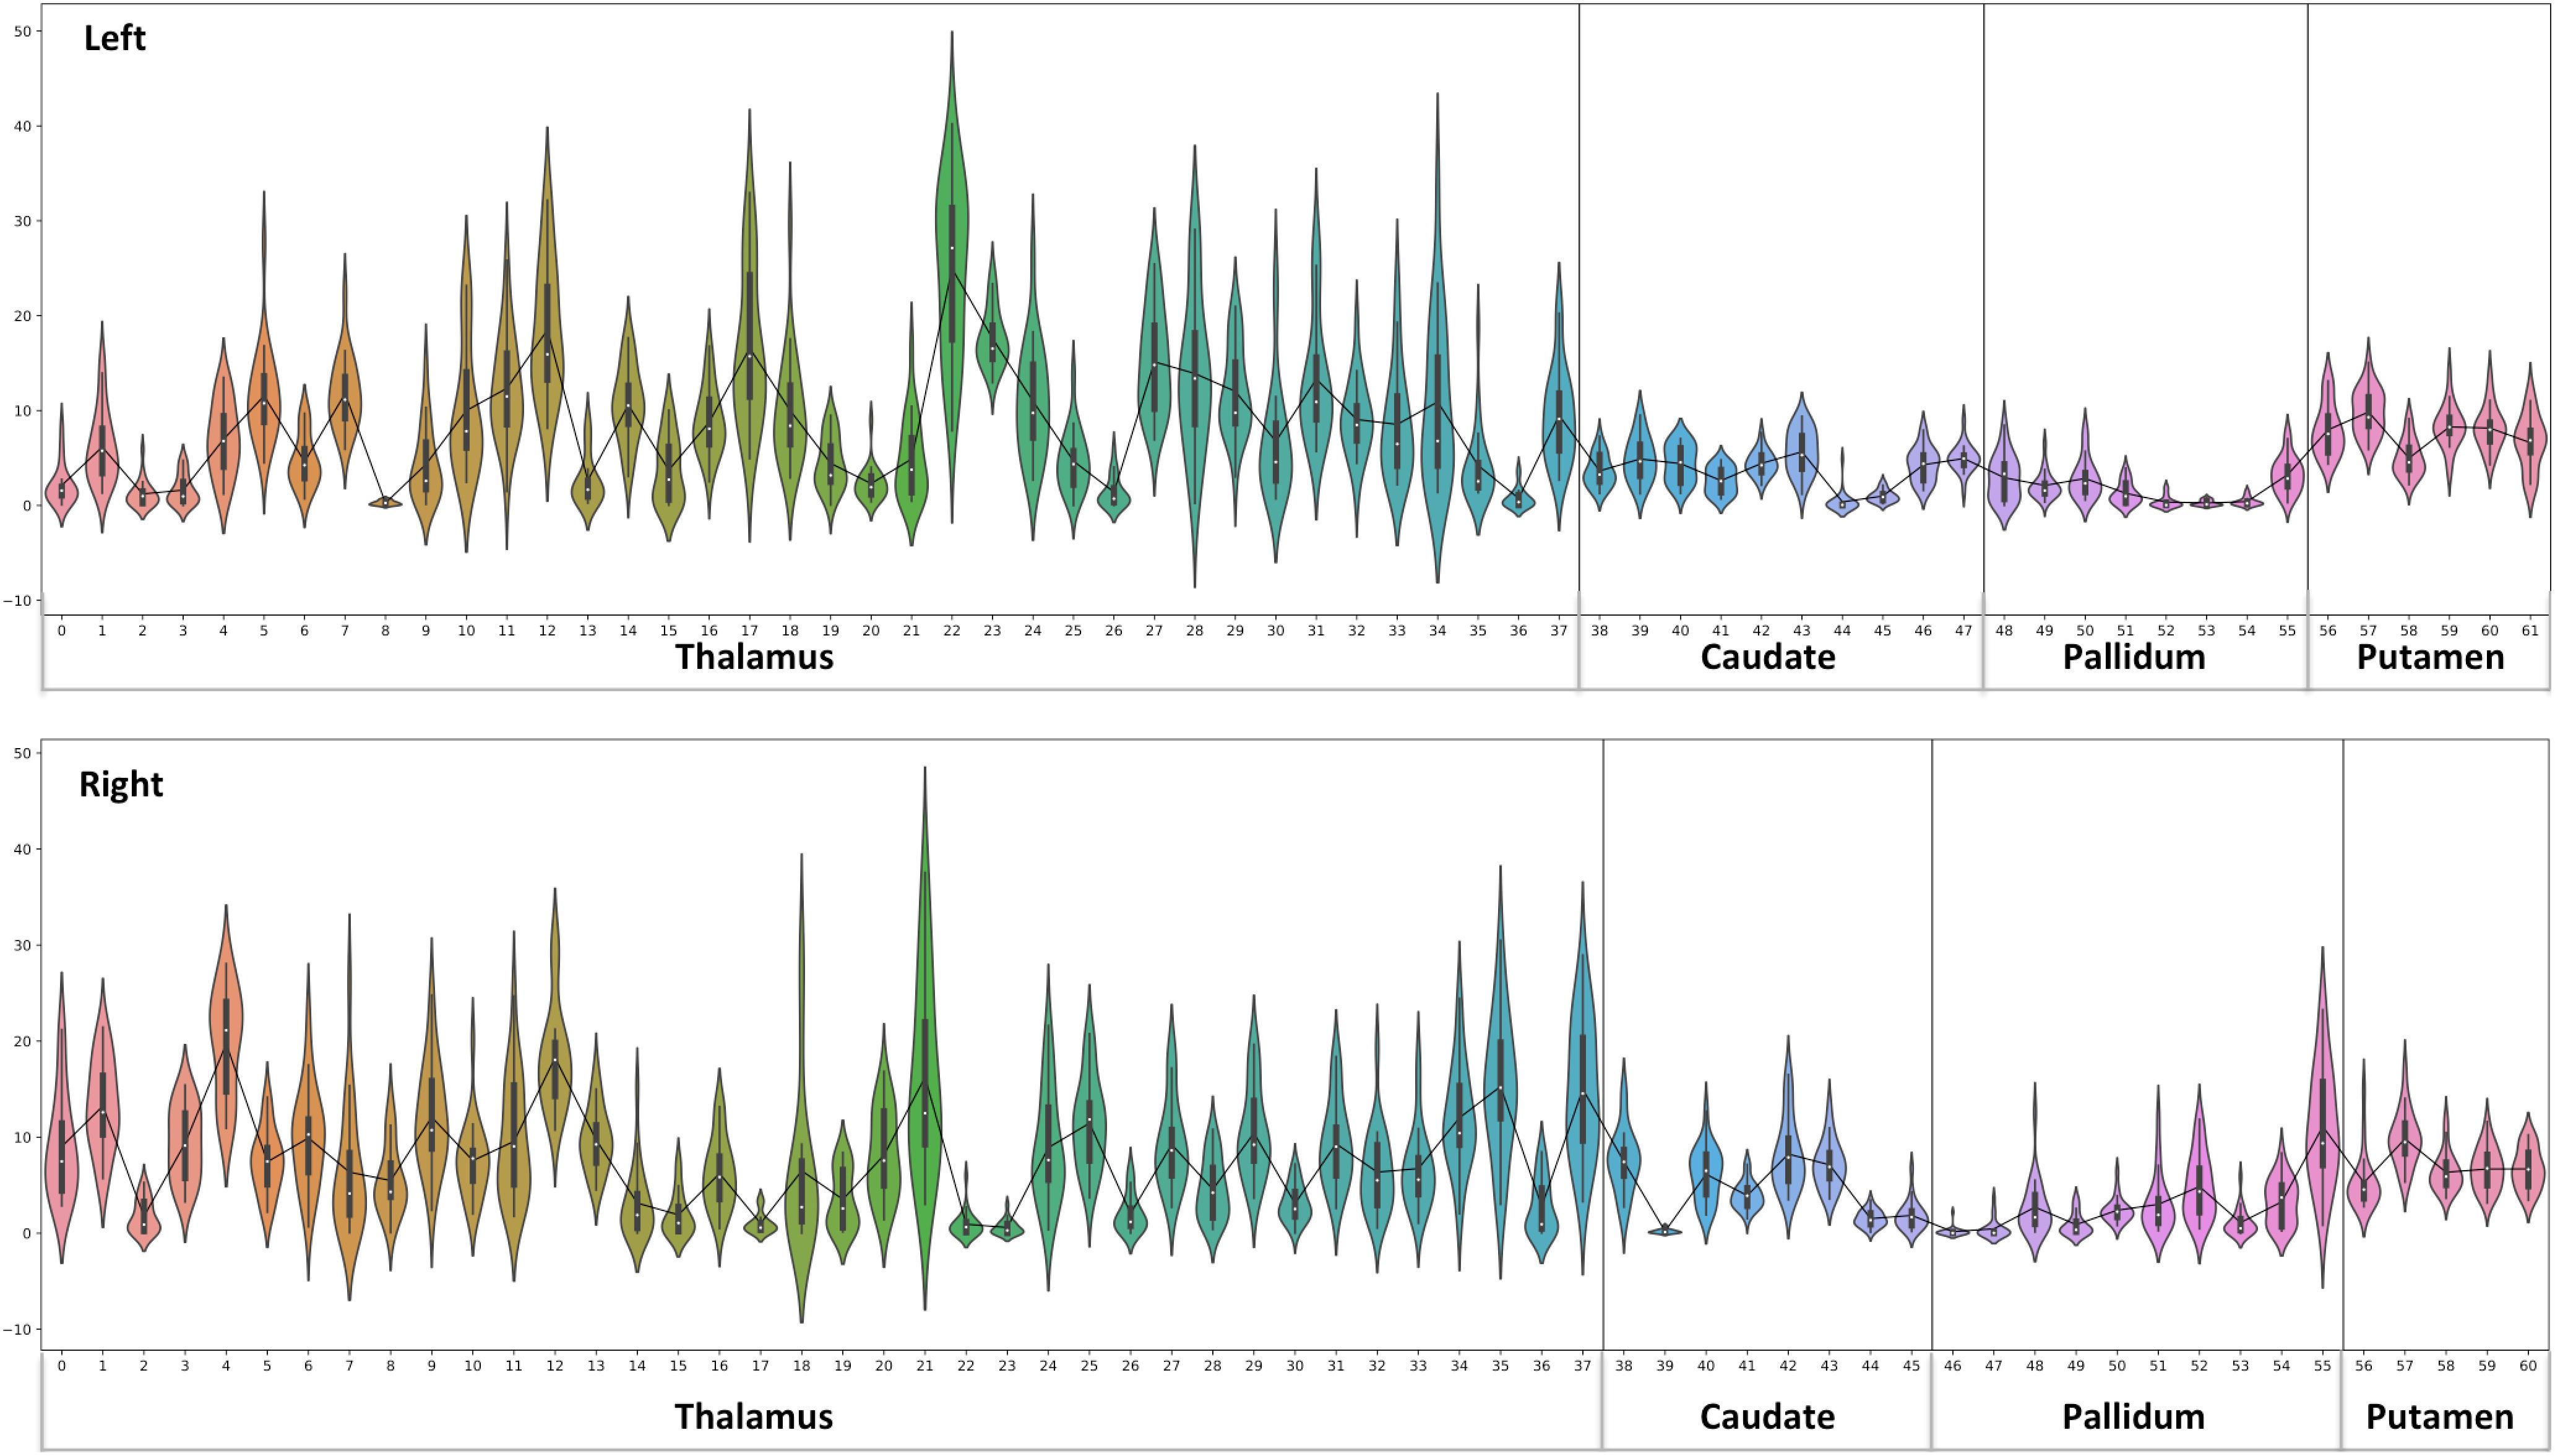
Figure 8. Violin plot of Diamagnetic sources, i.e., myelin and calcium: The violin plot highlights only the mean of each parcel. The black-line plot shows only the mean values of all parcels in all subjects. First, note the overall lower values for the caudate and pallidum, and in contrast, putamen and several parcels in the Th show consistently higher pallidum parcel values. Second, the violin plot reveals inter-individual variability.
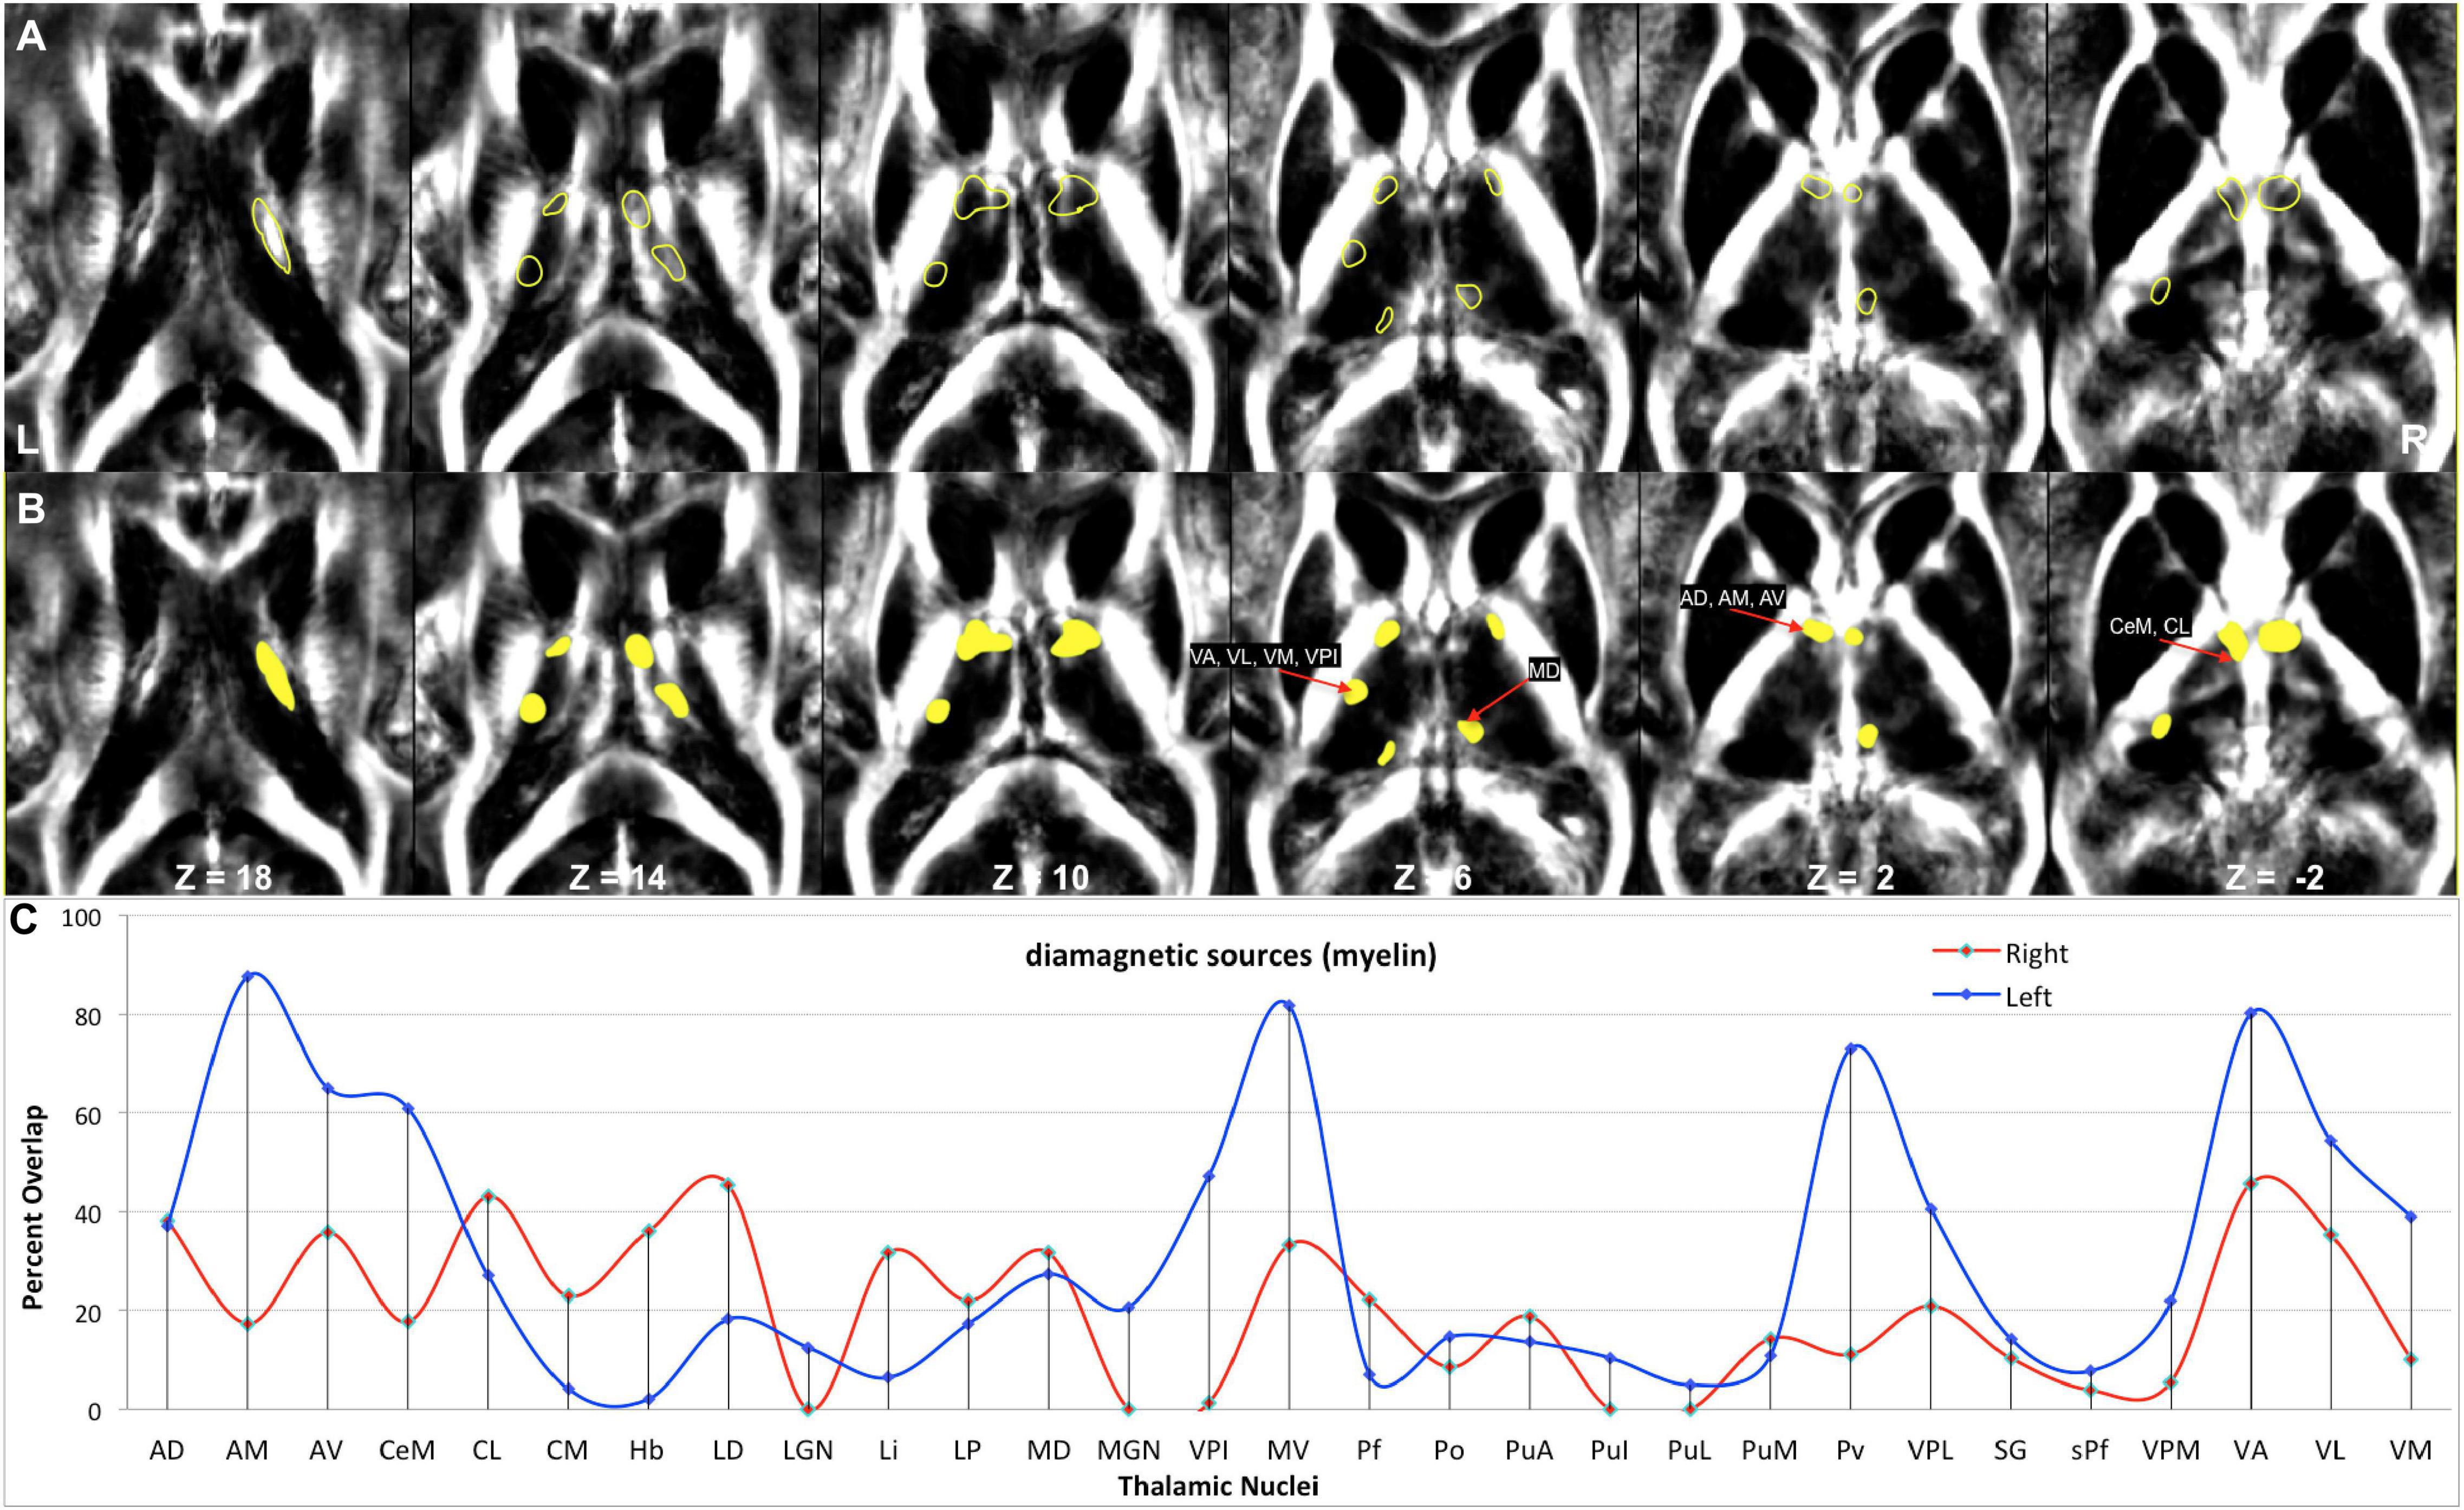
Figure 9. Depiction of values (>10 ppb) of diamagnetic sources in Th. (A) The spatial location of diamagnetic parcels with mean values > 10 ppb within the Th. BG does not reveal areas exceeding a threshold of >10 ppb. The yellow color outline encircles thalamic parcels. (B) Colored version of the first row illustrates regions with higher values. (C) Calculated overlap map of diamagnetic parcels with the thalamic nuclei according to the atlas of Morel show higher values in the anterior Th (AD, AM, and AV), intralaminar nuclei (CeM and CL), the motor and sensory nuclei (VA, VL, VM, VPI, and MV), and in Pv as well as the MD nuclei.
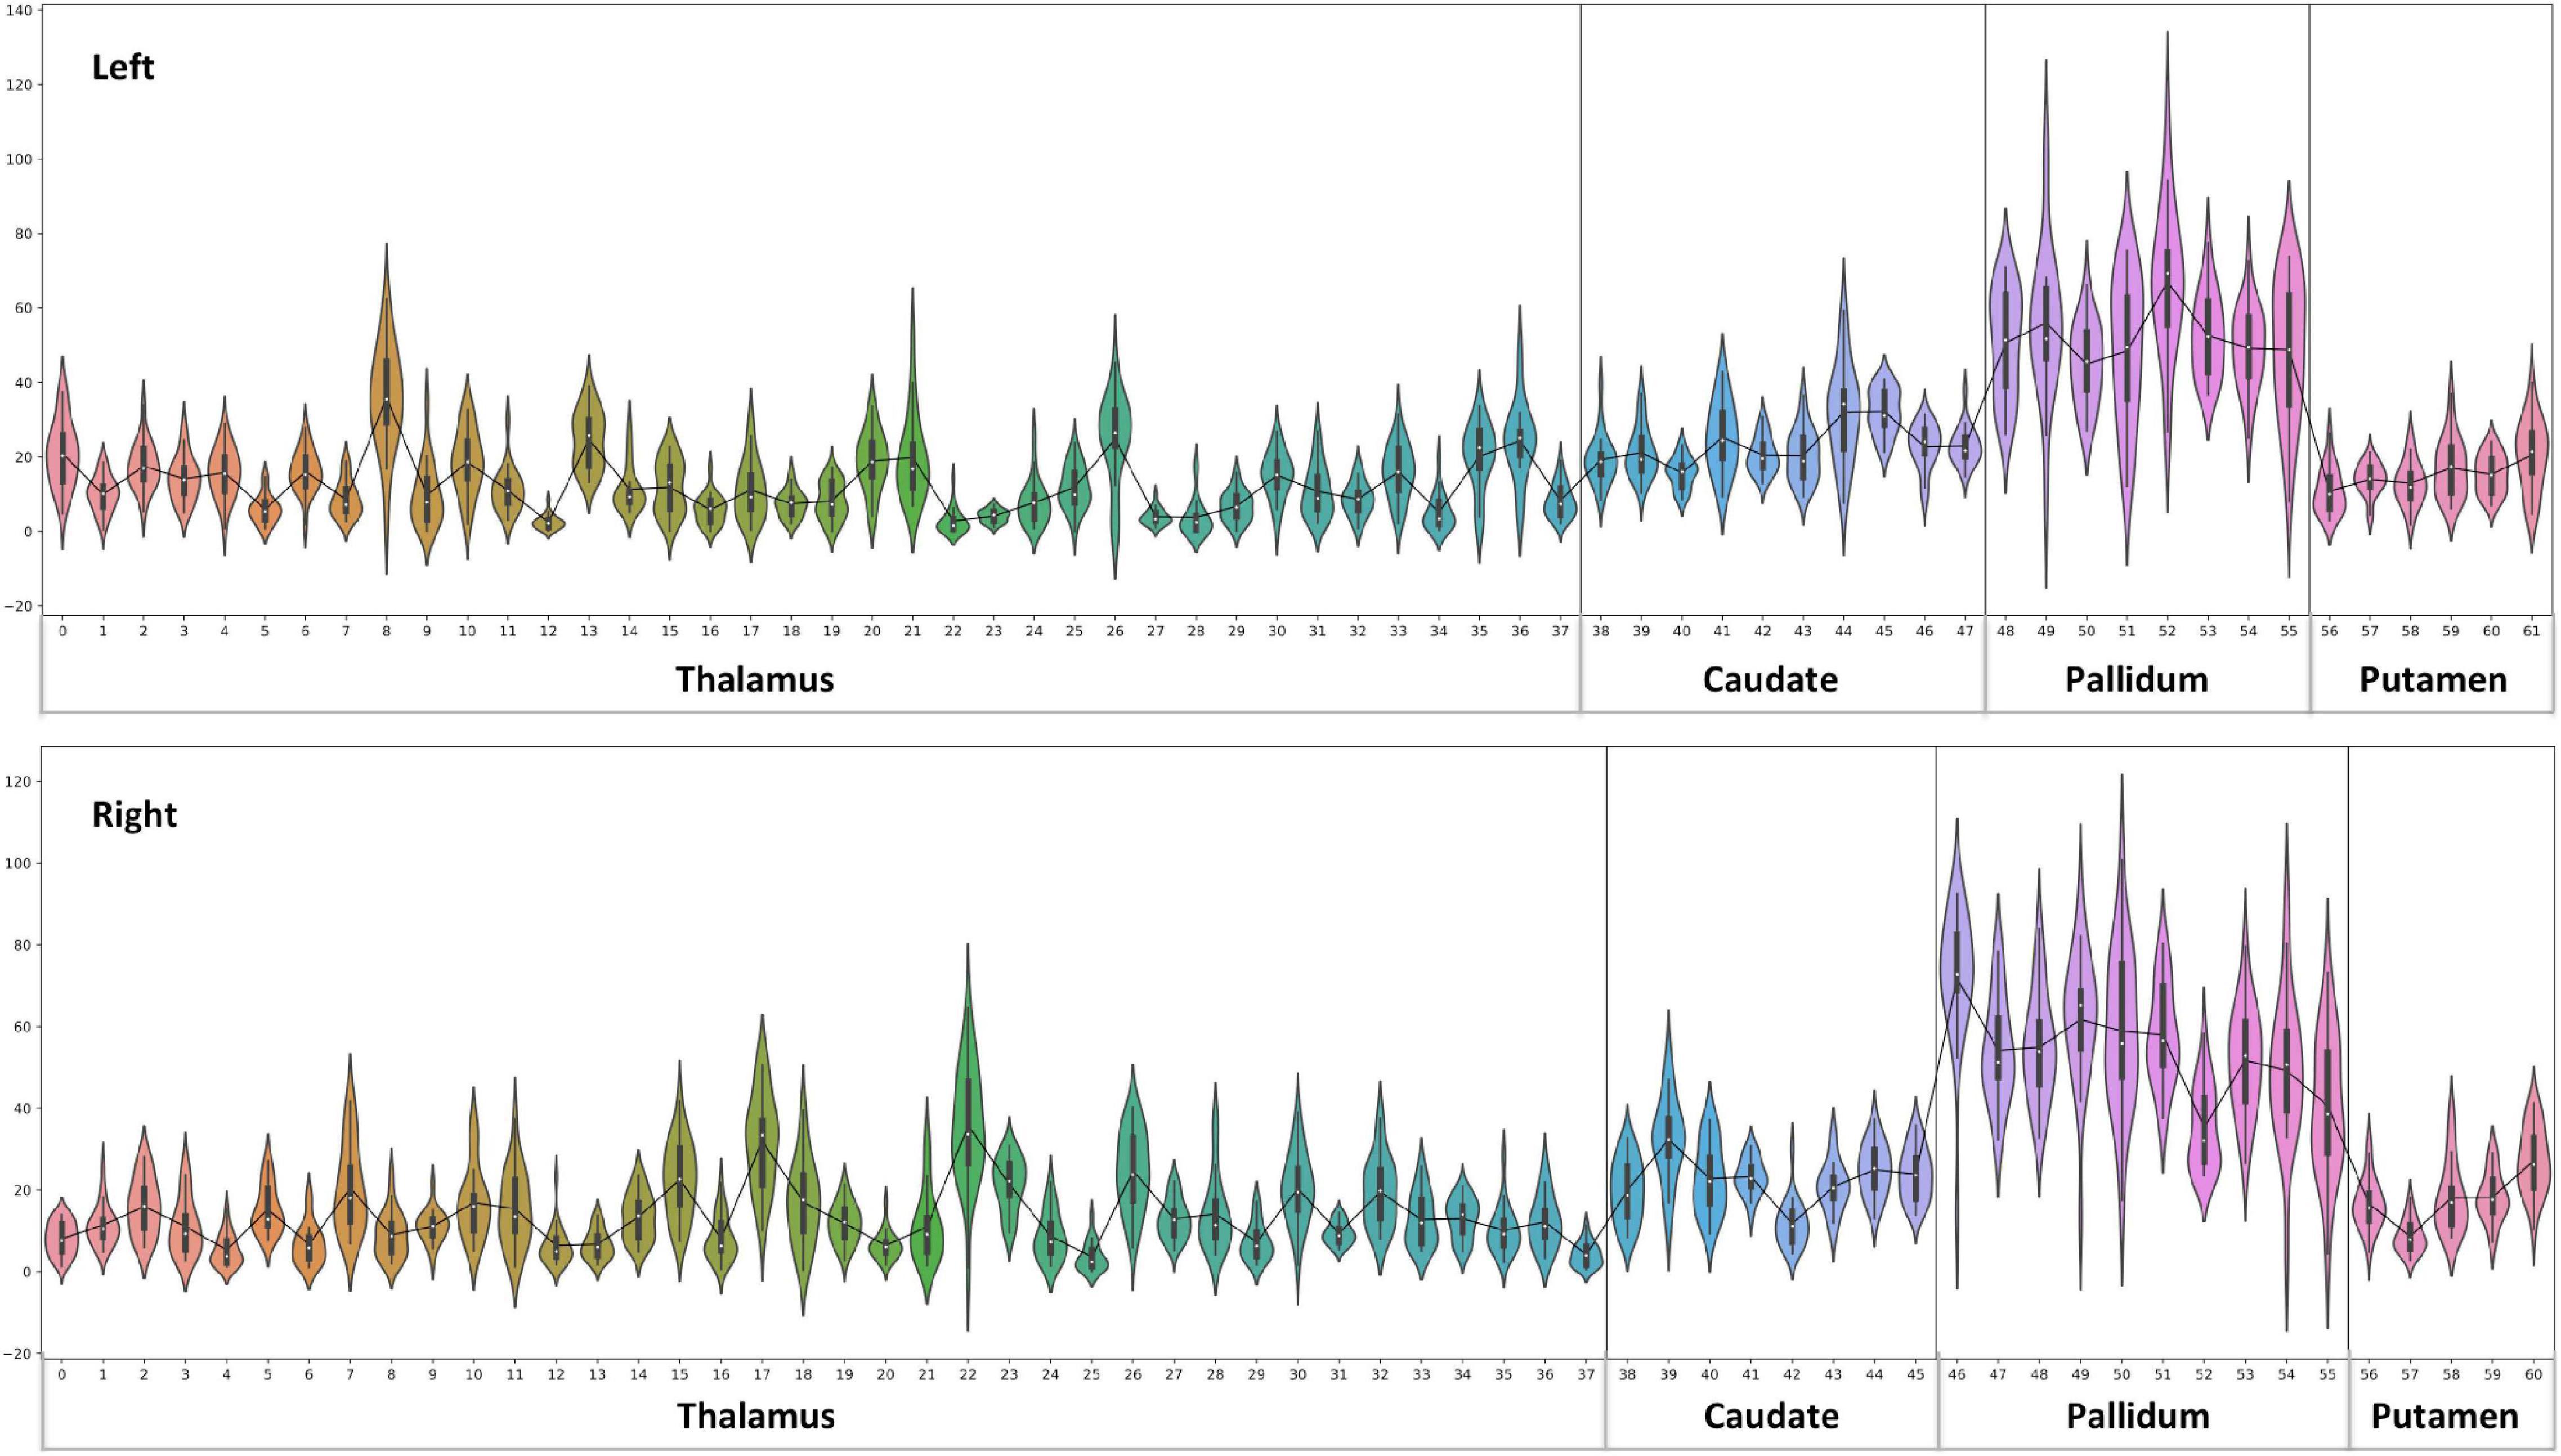
Figure 10. Violin plot of paramagnetic sources (iron): the violin plot highlights only the mean of each parcel. The black line plot shows only the mean values of all parcels in all subjects. First, note the overall lower values for the Th, caudate, and putamen contrast to consistent higher pallidum parcels values. Second, the violin plot reveals inter-individual variability.
Hotspots with higher mean values (Figures 9, 11) in the diamagnetic (>10) and paramagnetic (>20) maps were analyzed for their anatomical assignments within Th by using the atlas of Morel (Krauth et al., 2010).
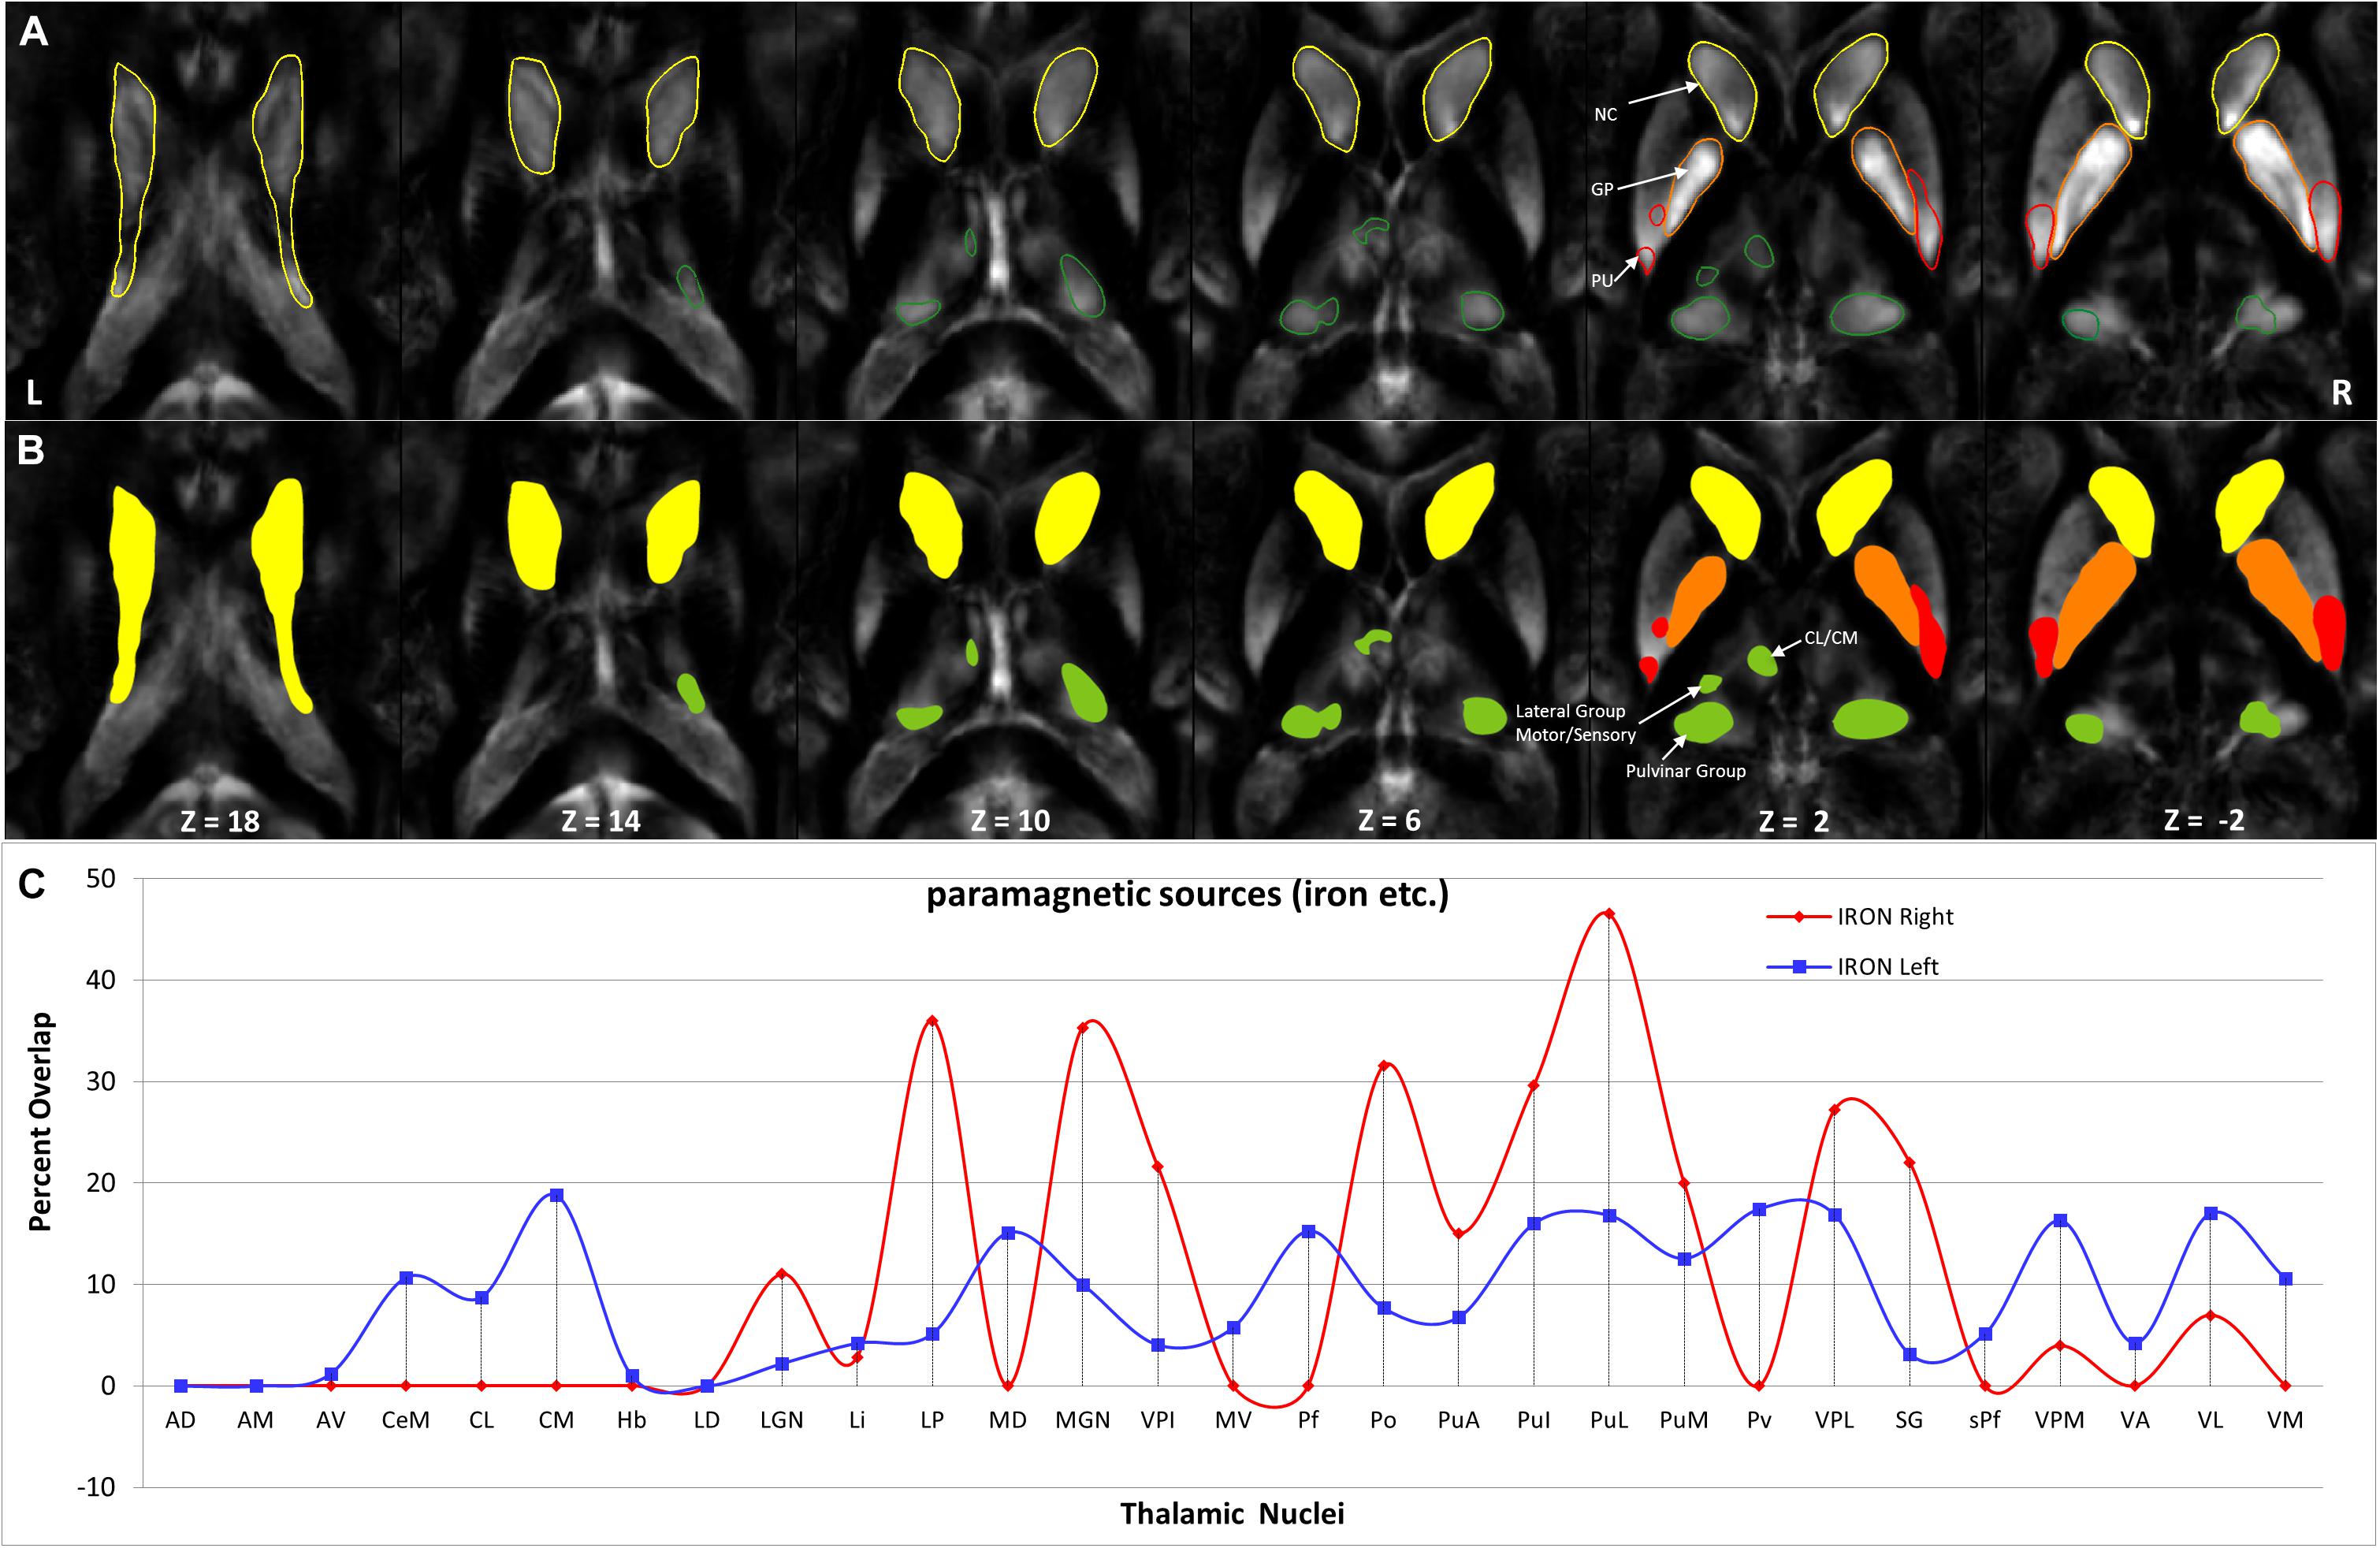
Figure 11. Depiction of value (>20) of paramagnetic sources in Th and BG: (A) Outline depiction of the paramagnetic parcel with mean values > 20 for the caudate (yellow), putamen (red), pallidum (orange), and Th (green). Note that the striatum (pallidum and caudate) encircle most of their structure above the threshold. (B) Colored version of the first row illustrates higher value regions. (C) Calculated overlap with the Thatlas shows higher values in the nuclei of the posterior Th (Po, PuA, Pul, and PuL), the relay nuclei (MGN, VPI, VPL, VPM, and VL), and the high-order intralaminar nuclei (CL and CM).
The group fixed effect maps exhibited an overview of significant paramagnetic and diamagnetic sources within Th and BG (Figure 2), and depicted the complex anatomical landscape of Th, NC, PU as well as of GPe and GPi of GP (Figure 2). The GPi of the GP further possesses two subsegments separated by lamina accessoria. Surprisingly, the anatomical observations indicate that not all individuals contain both subsegments within the GPi of the pallidum. The group fixed effect and the individual maps (between 60 and 70%) both possess subsegments of the internal segment of the pallidum (Figure 5). The individual-specific visualization of the di/paramagnetic maps depicts gross-level similarities and slight differences (Figures 3–6). The similarities comprise Th, NC, PU, and GP. Differences include variations in intensity and shape (i.e., contours, elongation, and curl). The reasons for these underlying individual variability variations might be due to technical and methodological reasons (shimming and SNR, etc.) and individual anatomical variations, including age and sex. However, details have to be addressed in future studies and when a larger data size becomes available.
The general patterns remain with lower diamagnetic values in BG in comparison with Th. Several parcels exhibit lower values in Th, and only a few parcels show higher diamagnetic values (Figures 4, 8). The violin plot of all mean values for all the subjects revealed a variable pattern in Th and BG with lower and others with higher myelin values. Therefore, we outlined only parcels showing higher values within Th and BG (Figures 4, 8). In differentiating BG parcels, NC and GP show similar values but PU exhibits slightly higher values (Figure 8). A combined histogram of Th and BG revealed an exciting distribution (Figure 7A) as GP shows the lowest values followed by NC and PU. The variation within Th was smoothened and depicted in a separate histogram (Figure 7A).
Paramagnetic (iron, etc.) mapping of the left and right BG and Th revealed higher values in GP in contrast to NC, PU, and Th (Figures 6, 10). The histogram of all mean values from all the subjects, i.e., violin plots, revealed a slightly variable pattern within Th with a somewhat higher pattern in NC and PU. The GP shows the highest values compared with Th, NC, and PU (Figure 10). Intuitively, the histogram depicts a gradient organization (Figure 7B). The first peak corresponds to Th, afterward to PU and NC, and the highest values correspond to GP (Figure 7B). A similar observation remains consistent in the violin maps also (Figure 10). The detailed, subject-level overview also depicts substantial interindividual and laterality differences (Figure 6). However, we did not delve further into the interindividual and lateral variability analysis due to limited individual data.
The higher value, which surpassed the mean value analysis of diamagnetic sources by more than >10 ppb and paramagnetic by more than 20 ppm, revealed a characteristic spatial distribution comprising a selected set of parcels within Th (Figures 9, 11).
In comparing those parcels with the thalamic nuclei as assigned in the atlas of Morel (Krauth et al., 2010), we found that the core (MGN, VPI, VPL, VPM, and VL), the matrix (intralaminar nuclei: CL and CM), and the pulvinar nuclei (PuA, Pul, and PuL) exhibit higher diamagnetic sources, i.e., myelin, calcium, etc. (Figure 9). In contrast, paramagnetic sources were partly dominant in the pulvinar (PuA, Pul, PuL, and PuM), the anterior (AD, AM, and AV), the intralaminar (CeM and CL), the lateral (VA, VL, VM, VPI, and MV), and the medial group (MD) (Figure 11). Interestingly, there was an agreeable laterality difference in the overlap.
Experimental findings in rodents and nonhuman primates have shown that the BG receives and processes cortical inputs and returns them via the midbrain and Th to the cortex. Based on these experiments, a series of functionally segregated and parallel-connected basal Th-frontal loops are postulated (Mink, 2013), which provide functionally relevant information from different frontal cortical areas for further processing. These projections to the striatum have a roughly topographical organization, in which the somatosensory and motor cortex project to the posterior PU and the prefrontal cortex to the anterior caudate. It has been suggested that the topographic relationship between the cerebral cortex and the striatum provides a basis for the segregation of functionally different circuits in the BG (Kelly and Strick, 2004; Obeso et al., 2008; Rodriguez-Oroz et al., 2009). Therefore, our study investigates diamagnetic and paramagnetic sources in the functional parcels within Th and BG by using 9.4 T QSM data to assess possible components of such segregated and parallelly connected basal Th-frontal loops.
In our awareness, such detailed parcel-specific analysis has not been performed earlier for Th, NC, PU, and GP. The study relies on the large sample of 7 Tesla data from the HCP project (Van Essen et al., 2012) used for a sample-driven rfMRI-based parcellation (Kumar et al., 2019). The used parcellations employed an instantaneous correlation analysis (Kumar et al., 2017; van Oort et al., 2018) to determine a stable and reproducible estimation of functional anatomy. However, an important future scope is to investigate Th and BG using different functional anatomy atlases. Such work could enhance our understanding by delivering more microstructural details of the underlying anatomy. The main idea of such a functional anatomical investigation should be to find spatio-temporal similarities in the structural space. Achieving such a functional, more-detailed anatomical map in vivo will expose us to a variety of novel questions, e.g., How does the QSM render on the functional space? Therefore, we retained a preliminary analysis. The major work remains to comprehend the relationship between QSM measures and functional anatomy.
The more insufficient spatial resolution at lower field strengths poses several perceptual limitations concerning detailed visualization of Th and BG (Forstmann et al., 2017). First, because of the inadequate precision to depict refined anatomical structures, i.e., “Where are we? What do we see?” Therefore, higher field strength like here at 9.4 T provides a much higher signal-to-noise ratio than standard 3 T (3.10 ± 0.20) and 1.76 ± 0.13 from 7 to 9.4 T (Pohmann et al., 2016), yielding superior data quality. However, given the anatomical complexity of Th and BG, much more research is warranted concerning MR-physics, sequences, artifact removal, and issues at higher field strengths.
Due to the unavailability of rsfMRI at 9.4 Tesla in our subjects, we used functional parcellation masks from the 7 T HCP data set, which contains a large sample of rsfMRI data, allowing a reliable and reproducible functional parcellation of the Th and BG.
There is interindividual variability, intraparcel differences, and slight differences between the hemispheres. It is well-established that the brain varies concerning interindividual, laterality, gender, and age. However, how such variability reflects properties of Th and BG in the microstructural space remains to be investigated. The reported variabilities could be due to methodological issues and individual properties such as gender and age. Thus, a larger sample of data is needed to sufficiently model the individual variability.
We found a higher contribution of paramagnetic sources in the GP parcels in contrast to the NC, PU, and Th parcels in descending order. The diamagnetic sources revealed substantial contribution in BG compared with Th because GP contains large dendritic arborizations packaged parallel to one another as the three-dimensional shape of flat disks (Yelnik et al., 1984). Among other reasons, such structural differences might be the reason why the pallidum shows relatively higher iron than Th, NC, and PU (Perng et al., 2021).
The diamagnetic sources are higher in Th compared with NC, PU, and GP. The Th encompasses distinct calcium-containing nuclei (Jones, 1998) as all nuclei exhibit a variable composition of parvalbumin and calbindin. The parvalbumin is a small, stable calcium-binding protein, and calbindin contains four active calcium-binding domains. In addition, Th contains myelinated fibers and lamina. Therefore, we observed higher values within Th. Several nuclei of Th receive sensory inputs and motor outputs and are densely connected via the axons; these are especially true for nuclei such as the MGN, VPI, VPL, VPM, and VL, in which we correspondingly observed higher diamagnetic values. The intralaminar nuclei are located within fibrous white matter bundles and show higher myelin values, i.e., CL and CM parcel space. The higher motor and sensory nuclei values (Figure 9) align with the higher myelin values in the connected motor and sensory cortex (Glasser and Van Essen, 2011). The intralaminar nuclei facilitate rapid communication between the brainstem and the cortex. The pulvinar group (PuA, Pul, and PuL) receives input from the structures such as the superior colliculus and densely communicates with the cortex. It also shows the higher diamagnetic values.
The study reveals a detailed functionally defined parcel-specific delineation of diamagnetic and paramagnetic sources in BG and Th. We found a more substantial contribution of paramagnetic sources in the pallidum in contrast to the caudate, PU, and Th in descending order. The diamagnetic sources revealed considerable contribution in BG compared with Th. In addition, our study shows a detailed anatomy-specific existence of diamagnetic and paramagnetic sources in BG and Th. However, interindividual variability and hemispheric differences of paramagnetic and diamagnetic sources were found in our group.
The anatomical assignments of the hotspot of diamagnetic and paramagnetic sources within Th revealed an association with a number of different nuclei. The parcels were located within core nuclei (MGN, VPI, VPL, VPM, and VL) and the matrix nuclei (intralaminar nuclei: CL, CM, and pulvinar: PuA, Pul, and PuL) exhibited higher diamagnetic sources, i.e., myelin and calcium. In contrast, paramagnetic sources were dominant in the pulvinar (PuA, Pul, PuL, and PuM), anterior (AD, AM, and AV), intralaminar (CeM and CL), and lateral nuclei group (VA, VL, VM, VPI, and MV) as well as in Pv and MD.
However, further future work is needed to comprehend the relationship between QSM maps and functional anatomy in general. Furthermore, a larger sample of data is required to examine age and gender effects and improve our understanding of the microstructures of Th and BG.
The data analyzed in this study is subject to the following licenses/restrictions: The second last authors of the manuscript acquired the dataset. Requests to access these datasets should be directed toZ2lzZWxhLmhhZ2JlcmdAdHVlYmluZ2VuLm1wZy5kZQ==.
The participants provided their written informed consent to participate in this study. The studies involving human participants were reviewed and approved by Ethics Committee of University of Tuebingen.
VK performed the analysis, prepared figures, and wrote the manuscript. KS contributed to the QSM data acquisition, feedback, and editing of the manuscript. GH contributed to the high-quality QSM data acquisition, preprocessing the data, editing the manuscript, and valuable feedback. WG contributed immensely in feedback, wrote the introduction/manuscript, and helped figure preparation. All authors contributed to the article and approved the submitted version.
This work was supported by the DFG (Grant number GZ: GR 833/13-1).
The authors declare that the research was conducted in the absence of any commercial or financial relationships that could be construed as a potential conflict of interest.
All claims expressed in this article are solely those of the authors and do not necessarily represent those of their affiliated organizations, or those of the publisher, the editors and the reviewers. Any product that may be evaluated in this article, or claim that may be made by its manufacturer, is not guaranteed or endorsed by the publisher.
Th, thalamus; BG, basal ganglia; QSM, quantitative susceptibility mapping; NC, caudate nucleus; PU, putamen; GP, globus pallidus; GPe, external segments of the globus pallidus; GPi, internal segments of the globus pallidus; T, Tesla.
Alkemade, A., Mulder, M. J., Groot, J. M., Isaacs, B. R., van Berendonk, N., Lute, N., et al. (2020). The amsterdam ultra-high field adult lifespan database (AHEAD): a freely available multimodal 7 tesla submillimeter magnetic resonance imaging database. NeuroImage 221:117200. doi: 10.1016/j.neuroimage.2020.117200
DeLong, M. R., and Wichmann, T. (2007). Circuits and circuit disorders of the basal ganglia. Arch. Neurol. 64, 20–24. doi: 10.1001/archneur.64.1.20
Filyushkina, V., Popov, V., Medvednik, R., Ushakov, V., Batalov, A., Tomskiy, A., et al. (2019). Hyperactivity of basal ganglia in patients with parkinson’s disease during internally guided voluntary movements. Front. Neurol. 10:847. doi: 10.3389/fneur.2019.00847
Forstmann, B. U., de Hollander, G., van Maanen, L., Alkemade, A., and Keuken, M. C. (2017). Towards a mechanistic understanding of the human subcortex. Nat. Rev. Neurosci. 18, 57–65. doi: 10.1038/nrn.2016.163
Glasser, M. F., and Van Essen, D. C. (2011). Mapping human cortical areas in vivo based on myelin content as revealed by T1- and T2-weighted MRI. J. Neurosci. Off. J. Soc. Neurosci. 31, 11597–11616. doi: 10.1523/JNEUROSCI.2180-11.2011
Hagberg, G., Eckstein, K., Cuna, E., and Scheffler, K. (2020). “Towards robust QSM in cortical and sub-cortical regions of the human brain at 9.4T: influence of coil combination and masking strategies,” in Proceedings of the 2020 ISMRM & SMRT Virtual Conference & Exhibition, Paris.
Hagberg, G. E., Bause, J., Ethofer, T., Ehses, P., Dresler, T., Herbert, C., et al. (2017). Whole brain MP2RAGE-based mapping of the longitudinal relaxation time at 9.4T. NeuroImage 144, 203–216.
Herrero, M.-T., Barcia, C., and Navarro, J. (2002). Functional anatomy of thalamus and basal ganglia. Childs Nerv. Syst. 18, 386–404. doi: 10.1007/s00381-002-0604-1
Imai, K., de Vries, L. S., Alderliesten, T., Wagenaar, N., van der Aa, N. E., Lequin, M. H., et al. (2018). MRI changes in the thalamus and basal ganglia of full-term neonates with perinatal asphyxia. Neonatology 114, 253–260. doi: 10.1159/000489159
Jenkinson, M., Beckmann, C. F., Behrens, T. E. J., Woolrich, M. W., and Smith, S. M. (2012). FSL. NeuroImage 62, 782–790.
Jones, E. G. (1998). Viewpoint: the core and matrix of thalamic organization. Neuroscience 85, 331–345. doi: 10.1016/s0306-4522(97)00581-2
Kelly, R. M., and Strick, P. L. (2004). Macro-architecture of basal ganglia loops with the cerebral cortex: use of rabies virus to reveal multisynaptic circuits. Prog. Brain Res. 143, 449–459.
Krauth, A., Blanc, R., Poveda, A., Jeanmonod, D., Morel, A., and Székely, G. (2010). A mean three-dimensional atlas of the human thalamus: generation from multiple histological data. NeuroImage 49, 2053–2062. doi: 10.1016/j.neuroimage.2009.10.042
Kumar, V., Beckmann, C. F., van Oort, E., Scheffler, K., and Grodd, W. (2019). “Multi-scale functional granularity in the thalamus and basal ganglia,” in : Proceedings Of The 25th Annual Meeting of the Organization for Human Brain Mapping, Rome.
Kumar, V. J., van Oort, E., Scheffler, K., Beckmann, C. F., and Grodd, W. (2017). Functional anatomy of the human thalamus at rest. NeuroImage 147, 678–691. doi: 10.1016/j.neuroimage.2016.12.071
Lanciego, J. L., Luquin, N., and Obeso, J. A. (2012). Functional neuroanatomy of the basal ganglia. Cold Spring Harb. Perspect. Med. 2:a009621. doi: 10.1101/cshperspect.a009621
Liu, C., Wei, H., Gong, N.-J., Cronin, M., Dibb, R., and Decker, K. (2015). Quantitative susceptibility mapping: contrast mechanisms and clinical applications. Tomography 1, 3–17. doi: 10.18383/j.tom.2015.00136
Liu, X., Du, L., Zhang, B., Zhao, Z., Gao, W., Liu, B., et al. (2021). Alterations and associations between magnetic susceptibility of the basal ganglia and diffusion properties in alzheimer’s disease. Front. Neurosci. 15:616163. doi: 10.3389/fnins.2021.616163
Loureiro, J. R., Himmelbach, M., Ethofer, T., Pohmann, R., Martin, P., Bause, J., et al. (2018). In-vivo quantitative structural imaging of the human midbrain and the superior colliculus at 9.4T. NeuroImage 177, 117–128. doi: 10.1016/j.neuroimage.2018.04.071
Mink, J. W. (2013). “Chapter 30 – the basal ganglia,” in Fundamental Neuroscience, 4th Edn, eds L. R. Squire, D. Berg, F. E. Bloom, S. du Lac, A. Ghosh, and N. C. Spitzer (San Diego, CA: Academic Press), 653–676.
Möller, H. E., Bossoni, L., Connor, J. R., Crichton, R. R., Does, M. D., Ward, R. J., et al. (2019). Iron, myelin, and the brain: neuroimaging meets neurobiology. Trends Neurosci. 42, 384–401. doi: 10.1016/j.tins.2019.03.009
Nieuwenhuys, R., Voogd, J., Huijzen, C. V., van Huijzen, C., and Voogd, J. (2008). The Human Central Nervous System. Cham: Springer.
Obeso, J. A., Rodríguez-Oroz, M. C., Benitez-Temino, B., Blesa, F. J., Guridi, J., Marin, C., et al. (2008). Functional organization of the basal ganglia: therapeutic implications for Parkinson’s dis-ease. Mov. Disord. 23, S548–S559.
Paprocka, J., Machnikowska-Sokołowska, M., Gruszczyńska, K., and Emich-Widera, E. (2020). Neuroimaging of basal ganglia in neurometabolic diseases in children. Brain Sci. 10:849. doi: 10.3390/brainsci10110849
Perng, V., Li, C., Klocke, C. R., Navazesh, S. E., Pinneles, D. K., Lein, P. J., et al. (2021). Iron deficiency and iron ex-cess differently affect dendritic architecture of pyramidal neurons in the hippocampus of piglets. J. Nutr. 151, 235–244. doi: 10.1093/jn/nxaa326
Pohmann, R., Speck, O., and Scheffler, K. (2016). Signal-to-noise ratio and MR tissue parameters in human brain imaging at 3, 7, and 9.4 tesla using current receive coil arrays. Magn. Reson. Med. 75, 801–809. doi: 10.1002/mrm.25677
Rodriguez-Oroz, M. C., Jahanshahi, M., Krack, P., Litvan, I., Macias, R., Bezard, E., et al. (2009). Initial clinical manifestations of Parkinson’s disease: features and pathophysiological mechanisms. Lancet Neurol. 8, 1128–1139. doi: 10.1016/s1474-4422(09)70293-5
Santin, M., Didier, M., Valabregue, R., Yahia-Cherif, L., García-Lorenzo, D., de Sousa, P., et al. (2016). Reproducibility of R2 ∗ and quantitative susceptibility mapping (QSM) reconstruction methods in the basal ganglia of healthy subjects. NMR Biomed. 30:e3491. doi: 10.1002/nbm.3491
Schaltenbrand, G., and Bailey, P. (1959). Einführung in die stereotaktischen Operationen mit einem Atlas des menschlichen Gehirns. Stuttgart: Thieme, 3.
Shahmaei, V., Faeghi, F., Mohammdbeigi, A., Hashemi, H., and Ashrafi, F. (2019). Evaluation of iron deposition in brain basal ganglia of patients with Parkinson’s disease using quantitative susceptibility mapping. Eur. J. Radiol. Open 6, 169–174. doi: 10.1016/j.ejro.2019.04.005
Shajan, G., Kozlov, M., Hoffmann, J., Turner, R., Scheffler, K., and Pohmann, R. (2014). A 16-channel dual-row transmit array in combination with a 31-element receive array for human brain imaging at 9.4 T. Magn. Reson. Med. 71, 870–879. doi: 10.1002/mrm.24726
Sherman, S. M., and Guillery, R. W. (2009). Exploring the Thalamus and Its Role in Cortical Function. Cambridge, MA: Mit Press.
Van Essen, D. C., Ugurbil, K., Auerbach, E., Barch, D., Behrens, T. E. J., Bucholz, R., et al. (2012). The human connectome project: a data acquisition perspective. NeuroImage 62, 2222–2231.
van Oort, E. S. B., Mennes, M., Navarro Schröder, T., Kumar, V. J., Zaragoza Jimenez, N. I., Grodd, W., et al. (2018). Functional parcellation using time courses of instantaneous connectivity. NeuroImage 170, 31–40. doi: 10.1016/j.neuroimage.2017.07.027
Wang, Y., and Liu, T. (2015). Quantitative susceptibility mapping (QSM): decoding MRI data for a tissue magnetic biomarker: QSM. Magn. Reson. Med. 73, 82–101. doi: 10.1002/mrm.25358
Wu, T., Wang, J., Wang, C., Hallett, M., Zang, Y., Wu, X., et al. (2012). Basal ganglia circuits changes in Parkinson’s disease patients. Neurosci. Lett. 524, 55–59.
Keywords: QSM, thalamus, basal ganglia, high field MRI, myelin, iron
Citation: Kumar VJ, Scheffler K, Hagberg GE and Grodd W (2021) Quantitative Susceptibility Mapping of the Basal Ganglia and Thalamus at 9.4 Tesla. Front. Neuroanat. 15:725731. doi: 10.3389/fnana.2021.725731
Received: 15 June 2021; Accepted: 23 July 2021;
Published: 16 September 2021.
Edited by:
Jared Brent Smith, Regenxbio Inc., United StatesReviewed by:
James Mac Shine, The University of Sydney, AustraliaCopyright © 2021 Kumar, Scheffler, Hagberg and Grodd. This is an open-access article distributed under the terms of the Creative Commons Attribution License (CC BY). The use, distribution or reproduction in other forums is permitted, provided the original author(s) and the copyright owner(s) are credited and that the original publication in this journal is cited, in accordance with accepted academic practice. No use, distribution or reproduction is permitted which does not comply with these terms.
*Correspondence: Vinod Jangir Kumar, bWFpbC52aW5vZEB5YWhvby5jb20=
Disclaimer: All claims expressed in this article are solely those of the authors and do not necessarily represent those of their affiliated organizations, or those of the publisher, the editors and the reviewers. Any product that may be evaluated in this article or claim that may be made by its manufacturer is not guaranteed or endorsed by the publisher.
Research integrity at Frontiers
Learn more about the work of our research integrity team to safeguard the quality of each article we publish.