 Fangyuan Yi1,2Jirui Wang1Meiqing Lin1
 Baizhu Li1Shiyu Han1Shan Wang1Yingbin Jin1Ning Hu1
 Yutong Chen1
 Xiuli Shang1*
- 1Department of Neurology, The First Affiliated Hospital of China Medical University, Shenyang, China
- 2Department of Neurology, Jin Qiu Hospital of Liaoning Province (Geriatric Hospital of Liaoning Province), Shenyang, China
Objective: White matter hyperintensities (WMH) are the most common neuroimaging manifestation of cerebral small vessel disease, and is frequently observed in Alzheimer’s disease (AD). This study aimed to investigate the relationship between WMH and cognition and to verify the mediation of grey matter atrophy in this relationship.
Methods: The diffusion tensor imaging (DTI) technique analyses white matter fiber tract to assess white matter integrity. Voxel-based morphometry was applied to measure the grey matter volume (GMV). A linear regression model was applied to examine the associations between WMH and GMV, and mediation analyses was performed to determine the mediating role of regional GMV in the effect of WMH on cognitive function.
Results: Compared to the HC group, AD group have 8 fiber tract fractional anisotropy (FA) decreased and 16 fiber tract mean diffusivity (MD) increased. Compared to AD without WMH, AD with high WMH had 9 fiber tracts FA decreased and 13 fiber tracts MD increased. High WMH volume was negatively correlated with GMV in the frontal–parietal region. Low WMH volume was also negatively correlated with GMV except for the three regions (right angular gyrus, right superior frontal gyrus and right middle/inferior parietal gyrus), where GMV was positively correlated. Mediation analysis showed that the association between WMH and executive function or episodic memory were mediated by GMV in the frontal–parietal region.
Conclusion: Damage to white matter integrity was more severe in AD with WMH. Differential changes in DTI metrics may be caused by progressive myelin and axonal damage. There was a negative correlation between WMH and grey matter atrophy in frontal–parietal regions in a volume-dependent manner. This study indicates the correspondence between WMH volume and GMV in cognition, and GMV being a key modulator between WMH and cognition in AD. This result will contribute to understanding the progression of the disease process and applying targeted therapeutic intervention in the earlier stage to delay neurodegenerative changes in frontal–parietal regions to achieve better treatment outcomes and affordability.
Highlights
• Damage to white matter integrity was more severe in Alzheimer's disease (AD) with white matter hyperintensities (WMH), and mean diffusivity may be an earlier marker than fractional anisotropy in white matter regions.
• WMH is associated with global grey matter volume (GMV), especially frontal-parietal cortical atrophy.
• There were differential effects of WMH on grey matter atrophy in frontal-parietal regions in a volume-dependent manner. Low WMH volume had an unstable relationship with GMV, positively in the following regions (right angular gyrus, right superior frontal gyrus, and right middle and inferior parietal gyrus), but negatively in other frontal and parietal regions.
• We demonstrate the relationship between the interaction of WMH volume with GMV and cognition, with GMV being a key modulator of WMH and cognition in AD.
1 Introduction
Alzheimer’s disease (AD) is a progressive neurodegenerative disease associated with the accumulation of neurofibrillary tangles and amyloid-β (Aβ) deposition in the brain parenchyma and blood vessel walls (Salminen et al., 2015), resulting in neuronal damage (Frisoni et al., 2010). AD has commonly been considered a purely neurodegenerative alteration, but there is increasing evidence that this is too restrictive to explain the complex underlying pathological processes (De La Torre, 2002). In addition, vascular factors also put an individual with normal cognition at increased risk of progression along the AD spectrum (Leritz et al., 2011) and there have been links shown between vascular factors and pathological features of AD on autopsy (Erten-Lyons et al., 2013).
White matter hyperintensities (WMH) have been regarded as an important symptom of cerebral small vessel disease (Buckley et al., 2020). WMH is frequently observed in AD and other diseases, such as in the multiple sclerosis patients (Zhou, 2017). Previously, the vascular mechanisms of white matter hyperintensities and the pathological changes in Aβ were considered two different and independent pathways to AD (Benedictus et al., 2013). However, in studies of cerebral small vessel disease, high WMH volume has been associated with an increased risk of progression to medial temporal lobe atrophy and AD-related cognitive decline (Rizvi et al., 2018). WMH severity is intimately associated with substantial Aβ and amyloid precursor protein deposition at the molecular level, and not with traditional degenerative vascular disease such as atherosclerosis or small arteriosclerosis (Chalmers et al., 2005). These pathological changes are characteristic of AD. It is also found that WMH was associated with atrophy of AD pathologically susceptible brain regions, as well as with neuronal functional impairment reflected (Brickman et al., 2012). These findings emphasise the role of WMH in the pathological process of AD and suggest that WMH may be an important indicator for early diagnosis and therapeutic monitoring of AD (Kuller et al., 2003).
Furthermore, higher WMH is associated with reduced network-based grey matter volume (GMV), reduced local efficiency of brain networks (Reijmer et al., 2013) and reduced functional connectivity involving default mode and executive control networks (Tuladhar et al., 2015). Meanwhile, a decreased GMV is an important hallmark of the pathological process of AD, and it is strongly associated with cognitive decline. In pathological states of AD, WMH maybe related to regional GMV reduction, particularly in frontal and parietal regions (Ha et al., 2012). This also hypothesizes a correspondence between WMH and grey matter atrophy in AD. These pathologic processes certainly co-occur but may operate in different brain region.
Diffusion tensor imaging (DTI) is currently the only non-invasive method that can effectively observe and track the white matter (WM) fiber tracts in the human brain in vivo (Zhao et al., 2019) to observe WM microstructure and assess WM integrity. These parameters include anisotropy fraction (FA), mean diffusivity (MD), axial diffusivity and radial diffusivity. These changes in these indices are associated with pathological processes such as myelin formation, cell death, axonal damage and demyelination (Garnier-Crussard et al., 2022). The correlation between WM structural connectivity measured with FA. Moreover, the FA measure at baseline predicted longitudinal functional coordination measured with functional magnetic resonance imaging (MRI), indicating a possible initial WM inflammatory factor to the subsequent neurodegenerative processes (Zhou, 2017). Voxel-based morphometry is widely used for quantitative measurements of GMV to measure small volume changes. The greater WMH volume is associated with decreased GMV in some cognition-related brain regions and that decreased GMV is correlated with lower levels of cognitive domains such as episodic memory (Wang et al., 2020; Brugulat-Serrat et al., 2020). These findings suggest that the mechanisms through which WMH results in cognitive disorders might be associated with attenuated conduction in the fasciculus due to the impairment of white matter integrity or brain atrophy due to decreased GMV.
Current research has only focused on the effects of WM fiber tracts or cortical atrophy single factors on cognition. We consider cognition as a broad, multidimensional concept. It is not dependent on single regions but on the connectivity between different regions and their networks (Reijmer et al., 2013). The underlying mechanisms mediating the association between WMH and GMV on cognitive function also need to be further investigated. In the current study, we first examined the relationships between cognitive function as measured by a range of cognitive domains, WMH volume, the integrity of white matter tracts, and grey matter volume in patients with AD. We then investigated whether the extent of white matter integrity or grey matter atrophy played roles in the influence of WMH on cognitive function. Therefore, we used mediation models to test the hypothesis that GMV mediates the potential associations between WMH and cognitive function.
2 Methods
2.1 Participants
This study group consisted of 102 right-handed participants: 74 AD and 28 healthy controls (HC) devoid of cognitive impairments and with Minimum Mental State Examination (MMSE) scores ≥28. Additionally, all AD participants were recruited from inpatients or Dementia & Memory Disorders Clinic, whereas the HC individuals were selected from the general population of the same geographical region as the AD individuals. Our research underwent ethical approval by the Medical Research Ethics Committee, and all participating individuals or their representatives provided written informed consent. Participants diagnosed with AD met both the National Institute of Neurological and Communication Disorders and Stroke/Alzheimer’s Disease and Related Disorders Association (NINCDS-ADRDA) probable AD criteria (McKhann et al., 2011) and Diagnostic and Statistical Manual of Mental Disorders (Fourth Edition, DSM-IV) criteria for dementia (American Psychiatric Association, 2000). AD participants were categorized into three groups: AD-nonWMH (AD with non WMH, Fazekas scale 0, n = 29), AD-miWMH (AD with mild WMH, Fazekas scale 1–2, n = 25), and AD-moWMH (AD with moderate WMH, Fazekas scale 3–4, n = 20), based on neuromaging features and Fazekas scale (Fazekas et al., 1987).
Exclusion criteria included: (Salminen et al., 2015) Fazekas scale score ≥ 5 was used to exclude severe WMH; (Frisoni et al., 2010) Hachinski Ischemic Scale score ≥ 4 was used to exclude vascular dementia (Hachinski et al., 1975); (De La Torre, 2002) individuals with secondary causes of white matter lesions, such as demyelinating (multiple sclerosis, neuromyelitis optica spectrum disorders, etc.), metabolic (hypothyroidism, vitamin B12 deficiency, etc.), immunological, toxic, infectious, radiological and other causes; (Leritz et al., 2011) individuals with abnormal brain MRI findings such as head trauma, hemorrhage, infarction (except lacunes), seizures and other space-occupying lesions; (Erten-Lyons et al., 2013) individuals with intracranial/ extracranial artery stenosis >50%; (Buckley et al., 2020) evidence of intracranial calcification in the deep grey matter structures, hydrocephalus, subdural effusion; (Zhou, 2017) history of psychiatric disorders such as severe anxiety or depression (Hamilton anxiety scale ≥7 or Hamilton depression scale ≥8) (Hamilton, 1959; Hamilton, 1960); (Benedictus et al., 2013) individuals with visual or auditory impairments that interfere neuropsychological testing; (Rizvi et al., 2018) individuals with medication, drug dependence or abuse that possible impair cognition; (Chalmers et al., 2005) individuals who were unable to cooperate MRI test.
2.2 Neuropsychological measurement
All participants were assessed on standardized scales performed by an experienced neuropsychologist who evaluated global cognition as well as specific cognitive domains. Global cognition was assessed using the MMSE (Folstein et al., 1975) and Montreal Cognitive Assessment (MoCA-BJ) (Nasreddine et al., 2005). Cognitive information collected examined domains of (1) episodic memory, assessed using Wechsler Memory Scale Visual Reproduction-delayed recall (Wechsler, 2009) and auditory verbal learning test-delayed recall (Zhao et al., 2012); (2) executive function and processing speed, assessed using Stroop color and word tests (SCWT) (Weintraub et al., 2012) and trail making test (TMT) (Dubois et al., 2000), whereby SCWT was divided into three parts A, B and C (Stroop A, B, and C), and TMT was divided into two parts A and B (TMT-A and TMT-B); (3) language, assessed using categorical verbal fluency (Zhou et al., 2019) and Boston naming test (Ivanova et al., 2013); (4) visuospatial function, assessed using the Alzheimer’s Disease Assessment Scale-Cognitive constructional praxis test (Skinner et al., 2012) and block design test (Weintraub et al., 2012); (5) attention, assessed using coding (Joy et al., 2004) and digit span forward tests (Weintraub et al., 2012). Performance on the individual tasks was transformed into z-scores based on normative scores (Lee et al., 2012). In addition, the SCWT and TMT results were time-based, and the values were reverse-transformed to maintain the consistency of trends.
2.3 MRI scanning
All participants were examined on a multi-model Philip 3.0 T-MRI (Philips Medical Systems) with the parallel baseline scan from genu of corpus callosum to splenium, covering the whole brain. The scanning sequences included axial spin-echo T1-weighted imaging, T2-weighted imaging, fluid-attenuated inversion recovery (FLAIR). The acquisition parameters were as follows: FOV = 230 × 181, 230 × 230, 230 × 182 mm2; matrix = 340 × 201, 384 × 384, 352 × 136; slice thickness 6.5 mm, slice gap 1.2 mm, repetition time [TR] = 9,000 ms, echo time [TE] = 125 ms, interval time [TI] = 2,500 ms, in-plane spatial resolution of 0.4688 pixels/mm × 0.4688 pixels/mm. The DTI was performed with a single-shot spin-echo echo planar imaging sequence in 25 non-collinear directions (b = 1,000 s/mm2) and one additional image without diffusion weighting (b = 0 s/mm2). The acquisition parameters were as follows: TR = 9.154 ms, TE = 55 ms, flip angle = 15°. FOV = 224 mm × 224 mm, matrix = 112 × 112, voxel size 2 × 2 × 2.5 mm3, slice number = 65, slice thickness = 2 mm, and slice gap = 0 mm. The DTI scanning procedure lasted 5 min and 48 s.
2.3.1 WMH volume measure
The axial T2 FLAIR images which were checked with the phase images were processed for the quantification of WMH volume by BIANCA (Brain Intensity Abnormality Classification Algorithm) software (Griffanti et al., 2016). Then the segmented lesions were examined visually and corrected manually by two experienced neuroradiologists who were blinded to all other imaging and clinical data. The manual correction process included: (Salminen et al., 2015) WMH area not properly labeled as WMH or normal appearing white matter falsely labeled as WMH; (Frisoni et al., 2010) Correction of non-white matter area being labeled as WMH. Due to each individual’s intracranial volume (ICV) being different, we measured the corrected WMH (cWMH) for further analysis. The following formula: cWMH volume = (WMH volume x mean ICV)/ICV. Mean ICV is the average ICV of all patients (O’Sullivan et al., 2002).
2.3.2 DTI imaging measure
All DTI data was preprocessed with the FMRIB’s Software Library (Smith et al., 2004) (FSL 6.0; https://fsl.fmrib.ox.ac.uk/fsl/fslwiki/). The topup tool was applied to estimate the distortion of each diffusion-weighted image and b0 image, and the eddy tool was used to apply eddy current and head motion corrections to the images. The dtifit command was also applied to calculate the voxel maps of the tensor matrix and DTI metrics, including fractional anisotropy and mean diffusivity. Then, the voxel maps were registered to the FMRIB58_FA standard-space image in the Montreal Neurological Institute (MNI) standard space using FMRIB’s non-linear image registration tool.
Voxelwise statistical analysis of FA and MD datasets was carried out using tract-based spatial statistics (Smith et al., 2006) and created a mean FA image and a mean FA skeleton. Then, each participant’s aligned FA data was projected onto the mean FA skeleton as the target, and previously computed warps were successively applied to MD images, thereby transforming all images into MNI space for further analysis as above. Based on the WM atlas (i.e., JHU ICBM-DTI-81 WM labels and JHU White-Matter Tractography Atlas) (Mori et al., 2006), the DTI analysis were applied to assess WM fiber tracts parameters including: anterior thalamic radiation (ATR), corticospinal tract (CST), cingulum of the cingulate cortex (CC), cingulum of the hippocampus (CH), forceps major (FMa), forceps minor (FMi), inferior fronto-occipital fasciculus (IFOF), inferior longitudinal fasciculus (ILF), superior longitudinal fasciculus (SLF), uncinate fasciculus (UF) and superior longitudinal fasciculus-temporal part (tSLF). Shown was the relationship between WMH and fiber tracts, see Figure 1A.
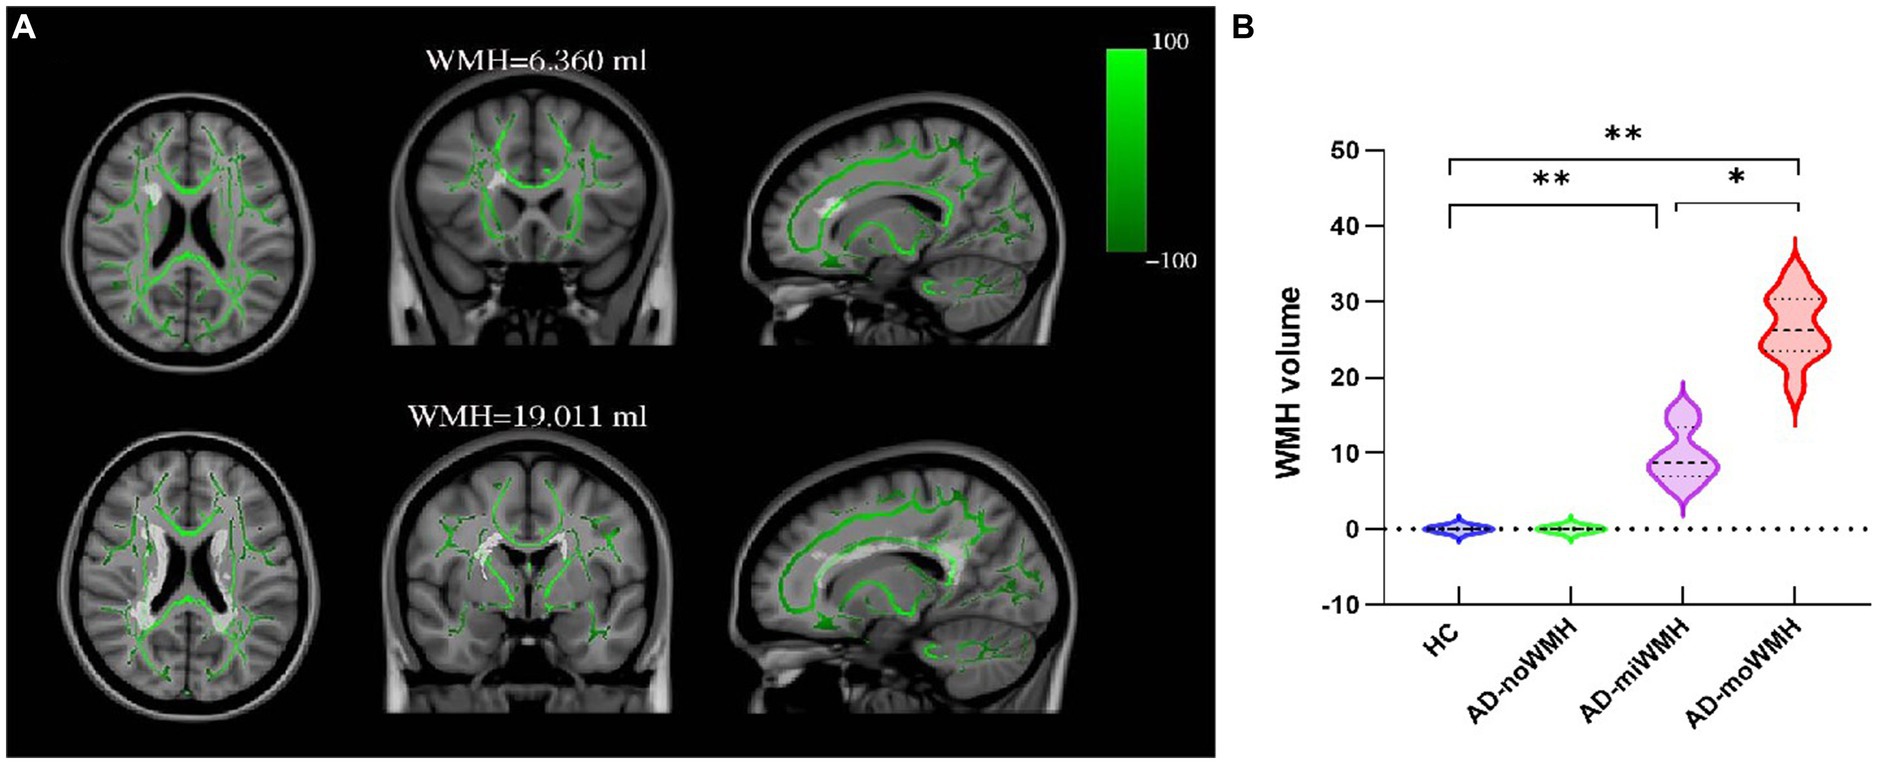
Figure 1. Show the position of WMH in relation to fiber tracts and the comparison of WMH volume in each group. (A) Shown was the relationship between WMH and white matter fiber tracts. WMH on FLAIR sequence WMH has superimposed on the TBSS-generated white matter skeleton (green) and the MNI152 1 mm standard space brain (horizontal, coronal and sagittal positions). (B) Shown was the alterations of global WMH volume for four groups. (* p < 0.05 or ** p < 0.001 was considered to indicate a significant difference). WMH, white matter hyperintensities; TBSS, tract-based spatial statistics; MNI, Montreal Neurological Institute.
2.3.3 Grey matter volume
Grey matter volume was measured using Voxel-based analysis (Douaud et al., 2007). First, the brain extraction tool and FMRIB’s automated segmentation tool acquired grey matter partial volume was estimated from images of the whole head. Next, all segmented grey matter images were registered to the MNI152 standard space and averaged, and the study-specific grey matter template was created. Then, registration to the study-specific templates were run for all participants’ grey matter images, and modulated by the warp field expansion. Subsequently, the images were combined into 4D images and statistics. Running the “randomise” command and displaying cluster-based thresholding results.
2.4 Statistical analysis
All statistical analyses were using SPSS26.0 software (SPSS, version 26.0; IBM, Chicago, IL, USA). Descriptive statistics were generated to illustrate the sample characteristics. Demographic and cognitive scale assessment data were compared using t-test, chi-square test, and one-way analysis of variance (ANOVA) to test for differences between groups. DTI indicators were compared for each WM fiber tracts and corrected for familywise error correction (FWE). We used t-test and non-parametric test to compare the differences of GMV in different brain regions between all groups. Analyses were corrected for voxel-wise multiple comparisons using threshold free cluster enhancement (TFCE) and FWE. p < 0.05 was considered statistically significant.
A mediation analysis was conducted to test whether regional GMV mediated the effect of WMH on cognition using SPSS PROCESS. Specifically, each model used log-transformed WMH volume as a predictor, regional GMV as a mediator, and cognitive test score as an outcome. All analyses were corrected for age and gender. The standard error parameters of the mediation models were bootstrapped. The effect size, bootstrap standard error, bootstrap lower limit of confidence interval, bootstrap upper limit of confidence interval, and the proportion of relative effects of the total effect, direct effect, and mediating effect were reported.
3 Results
3.1 Demographic and clinical characteristics
Demographic and clinical characteristics for the groups are provided in Table 1. There were no significant differences for age, gender, and years of education (p > 0.05). The AD subgroups showed poor performances on MMSE, MoCA-BJ and five domain-specific cognition scores (p < 0.05), as detailed in Table 1. The WMH volume in the AD-moWMH group was 26.67 ± 4.25 mL, and WMH volume in the AD-miWMH group was 9.81 ± 3.42 mL. The alterations of global WMH volume for four groups were shown in Figure 1B.
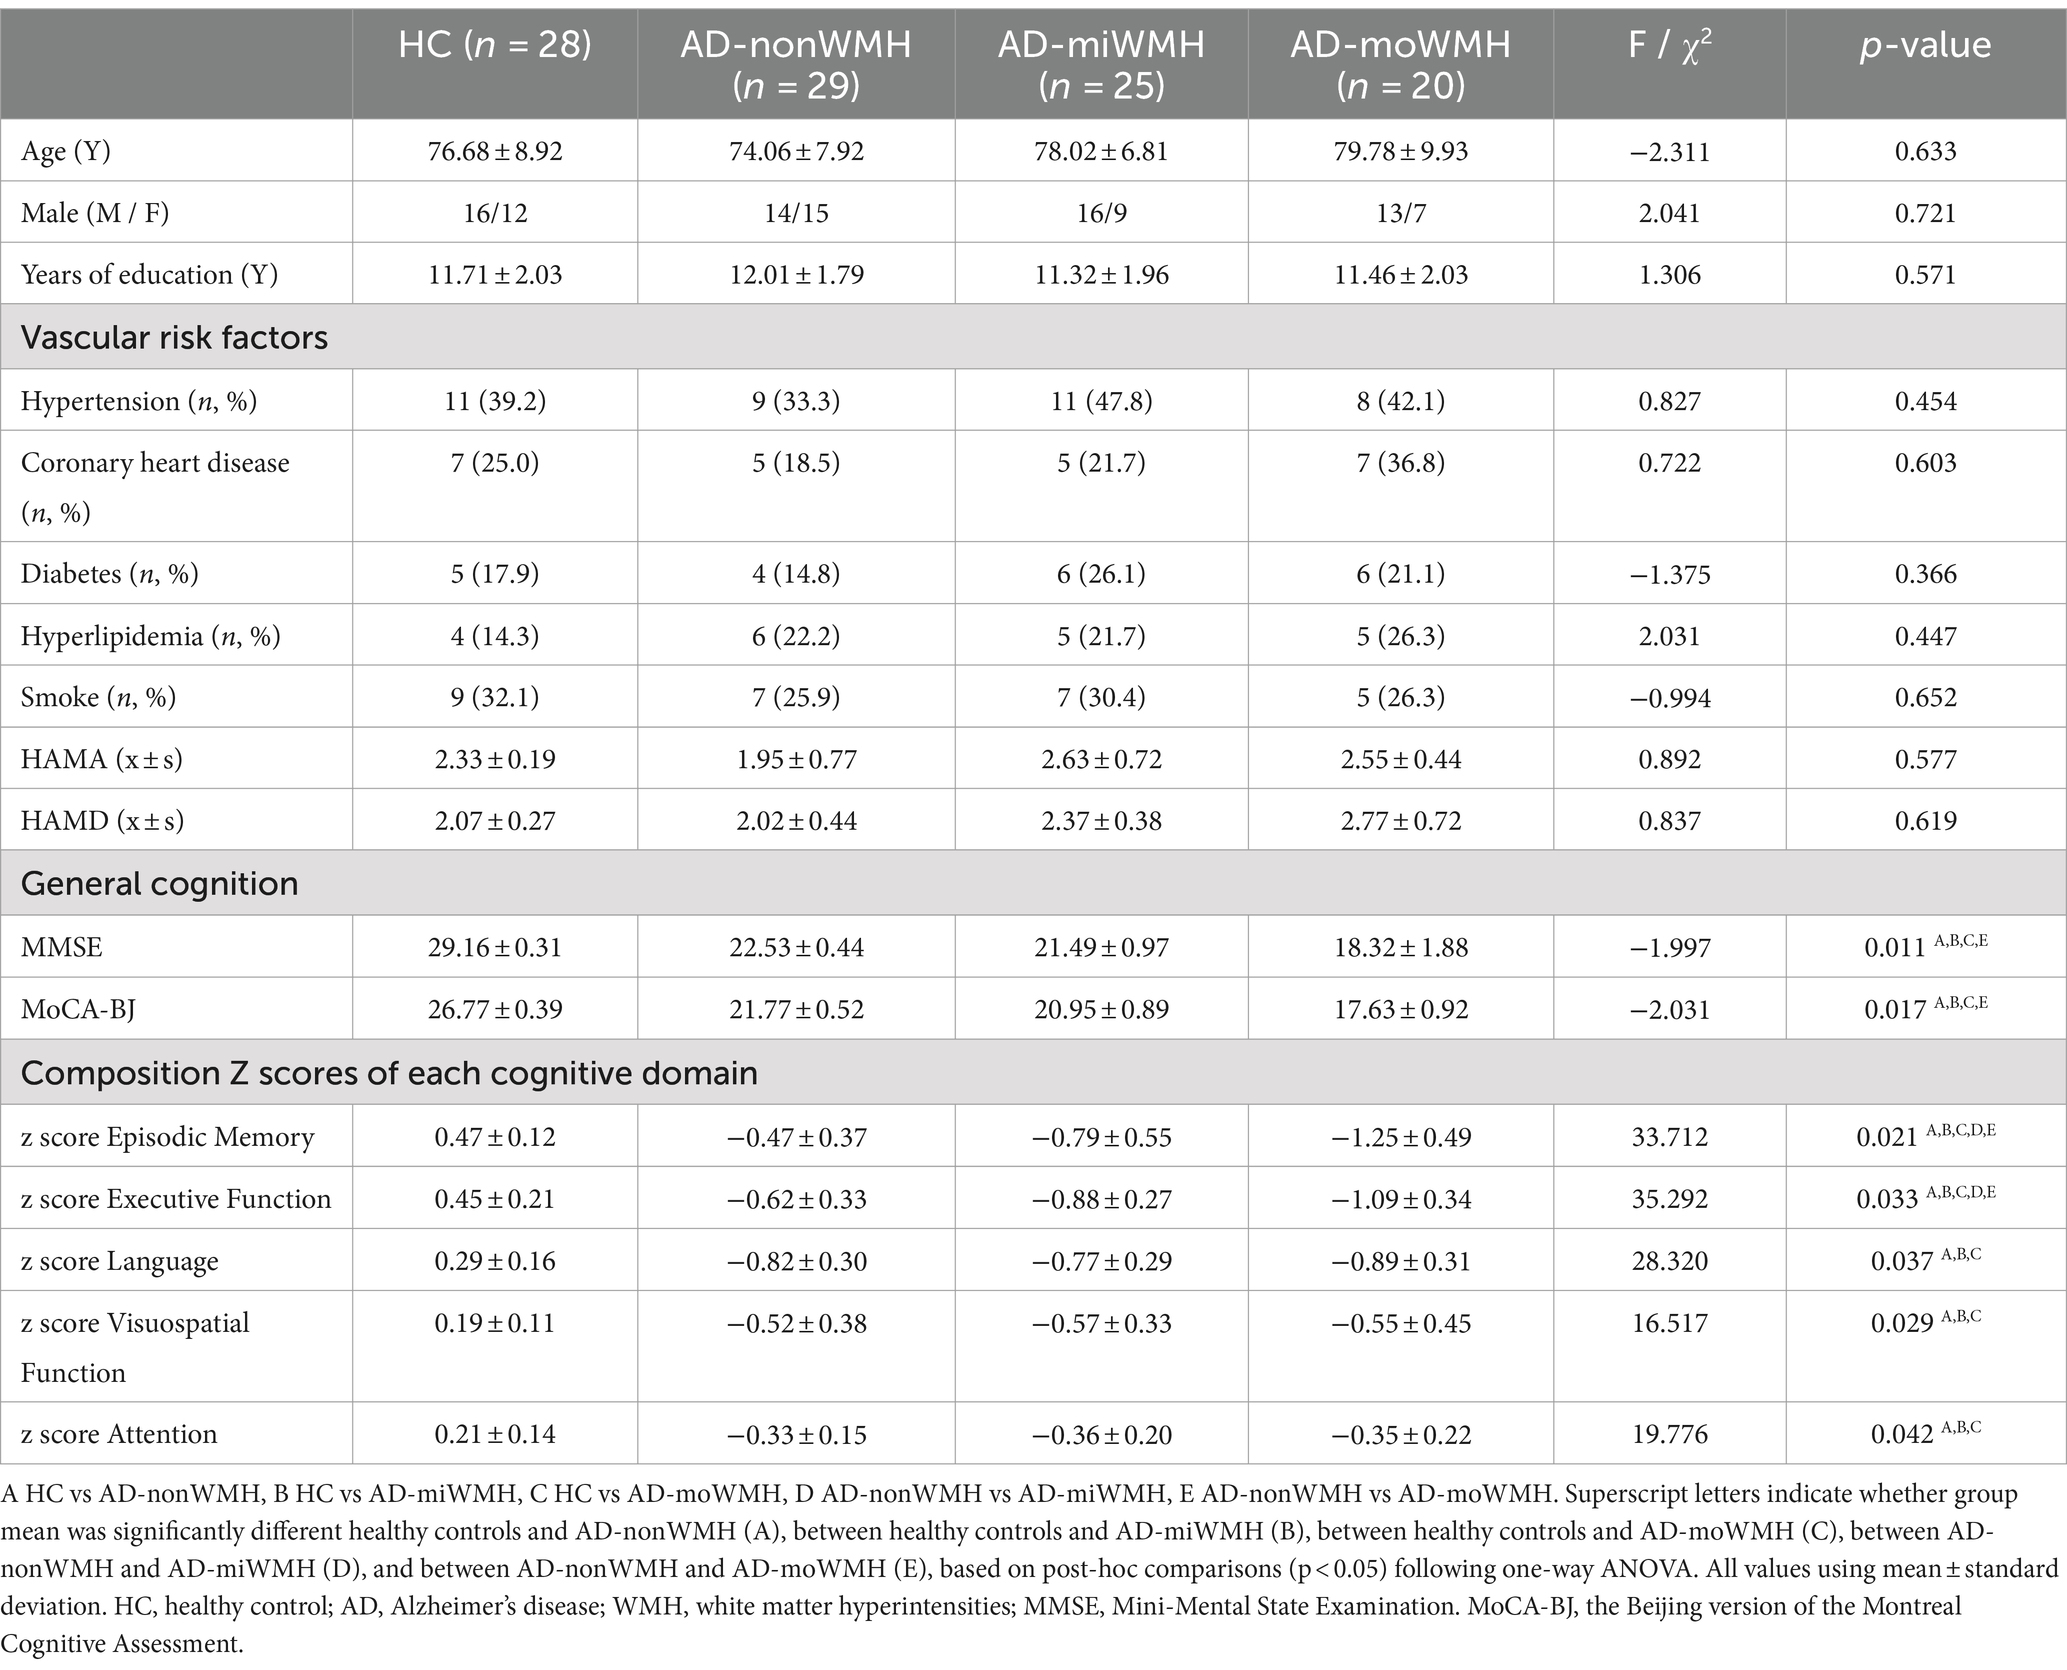
Table 1. Demographic and neuropsychological data.
3.2 Group difference in WM fiber tract DTI indicator
Analyses after FWE correction indicated that the AD group showed significantly decreased FA in 8 fiber tracts (bilateral ATR, bilateral CH, right CC, FMi, left IFOF, and left SLF) compared to the HC group. 4 fiber tracts (left ATR, left CH, and right ILF) in the AD-miWMH group had low FA compared to the AD-nonWMH group, whereas 9 fiber tracts (bilateral ATR, right CST, bilateral CH, right CC, FMa, FMi, and left tSLF) in the AD-moWMH group had low FA compared to the AD-nonWMH group (pFWE = 0.001), as shown in Figure 2. Similar to the FA, apart from the bilateral UF, FMa, and left ILF, the remaining WM fiber tracts exhibited significant differences between the AD group and the HC group. Compared to the AD-nonWMH group, the AD-miWMH group had significantly increased MD in 8 fiber tracts and the AD-moWMH group had significantly increased MD in 14 fiber tracts (FWE corrected, all p < 0.001), see Figure 3.
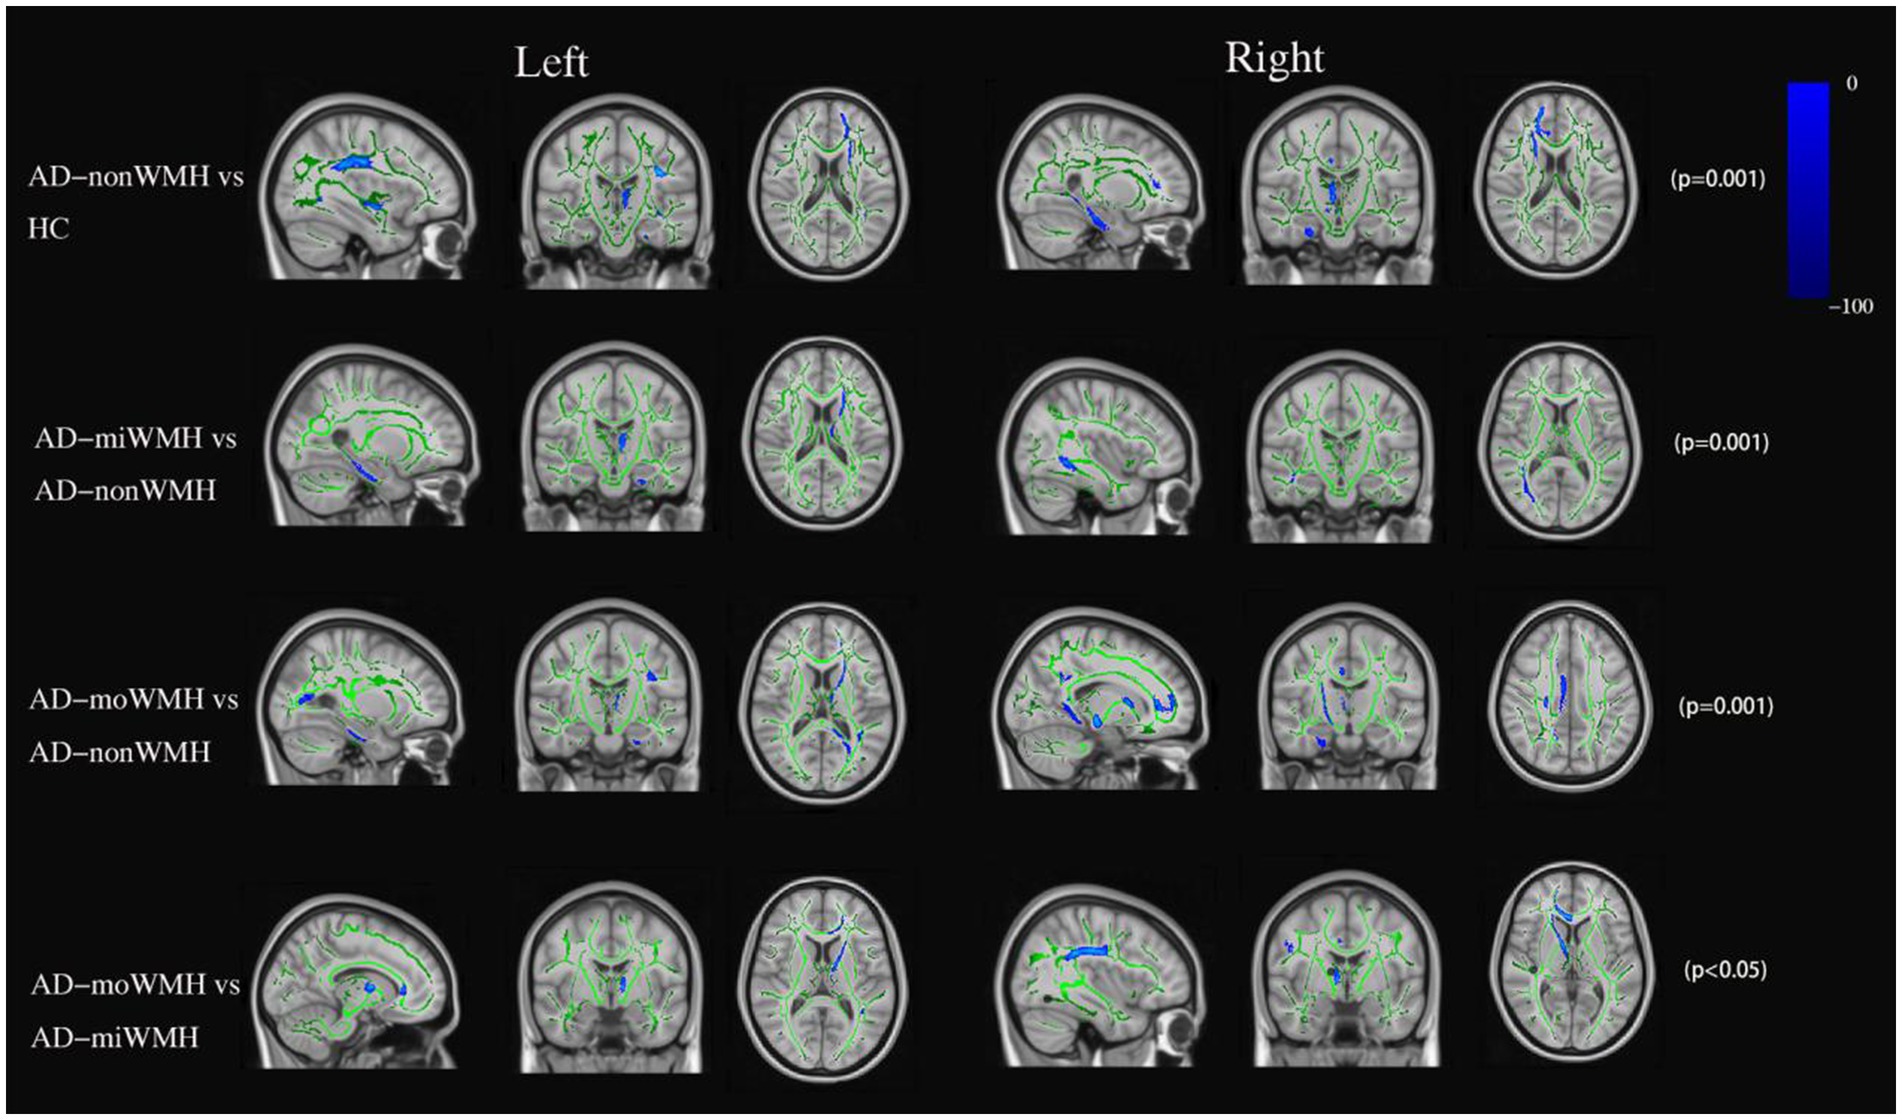
Figure 2. FA data are presented in radiological orientation and superimposed on the TBSS-generated white matter skeleton (green) and the MNI152 1 mm standard space brain. Shown are the results for analysis of the fractional anisotropy value declined (blue) in AD compared to HC and comparison among the AD subgroups using TBSS at pFWE <0.05. TBSS, tract-based spatial statistics; MNI, Montreal Neurological Institute; FWE, familywise error correction.
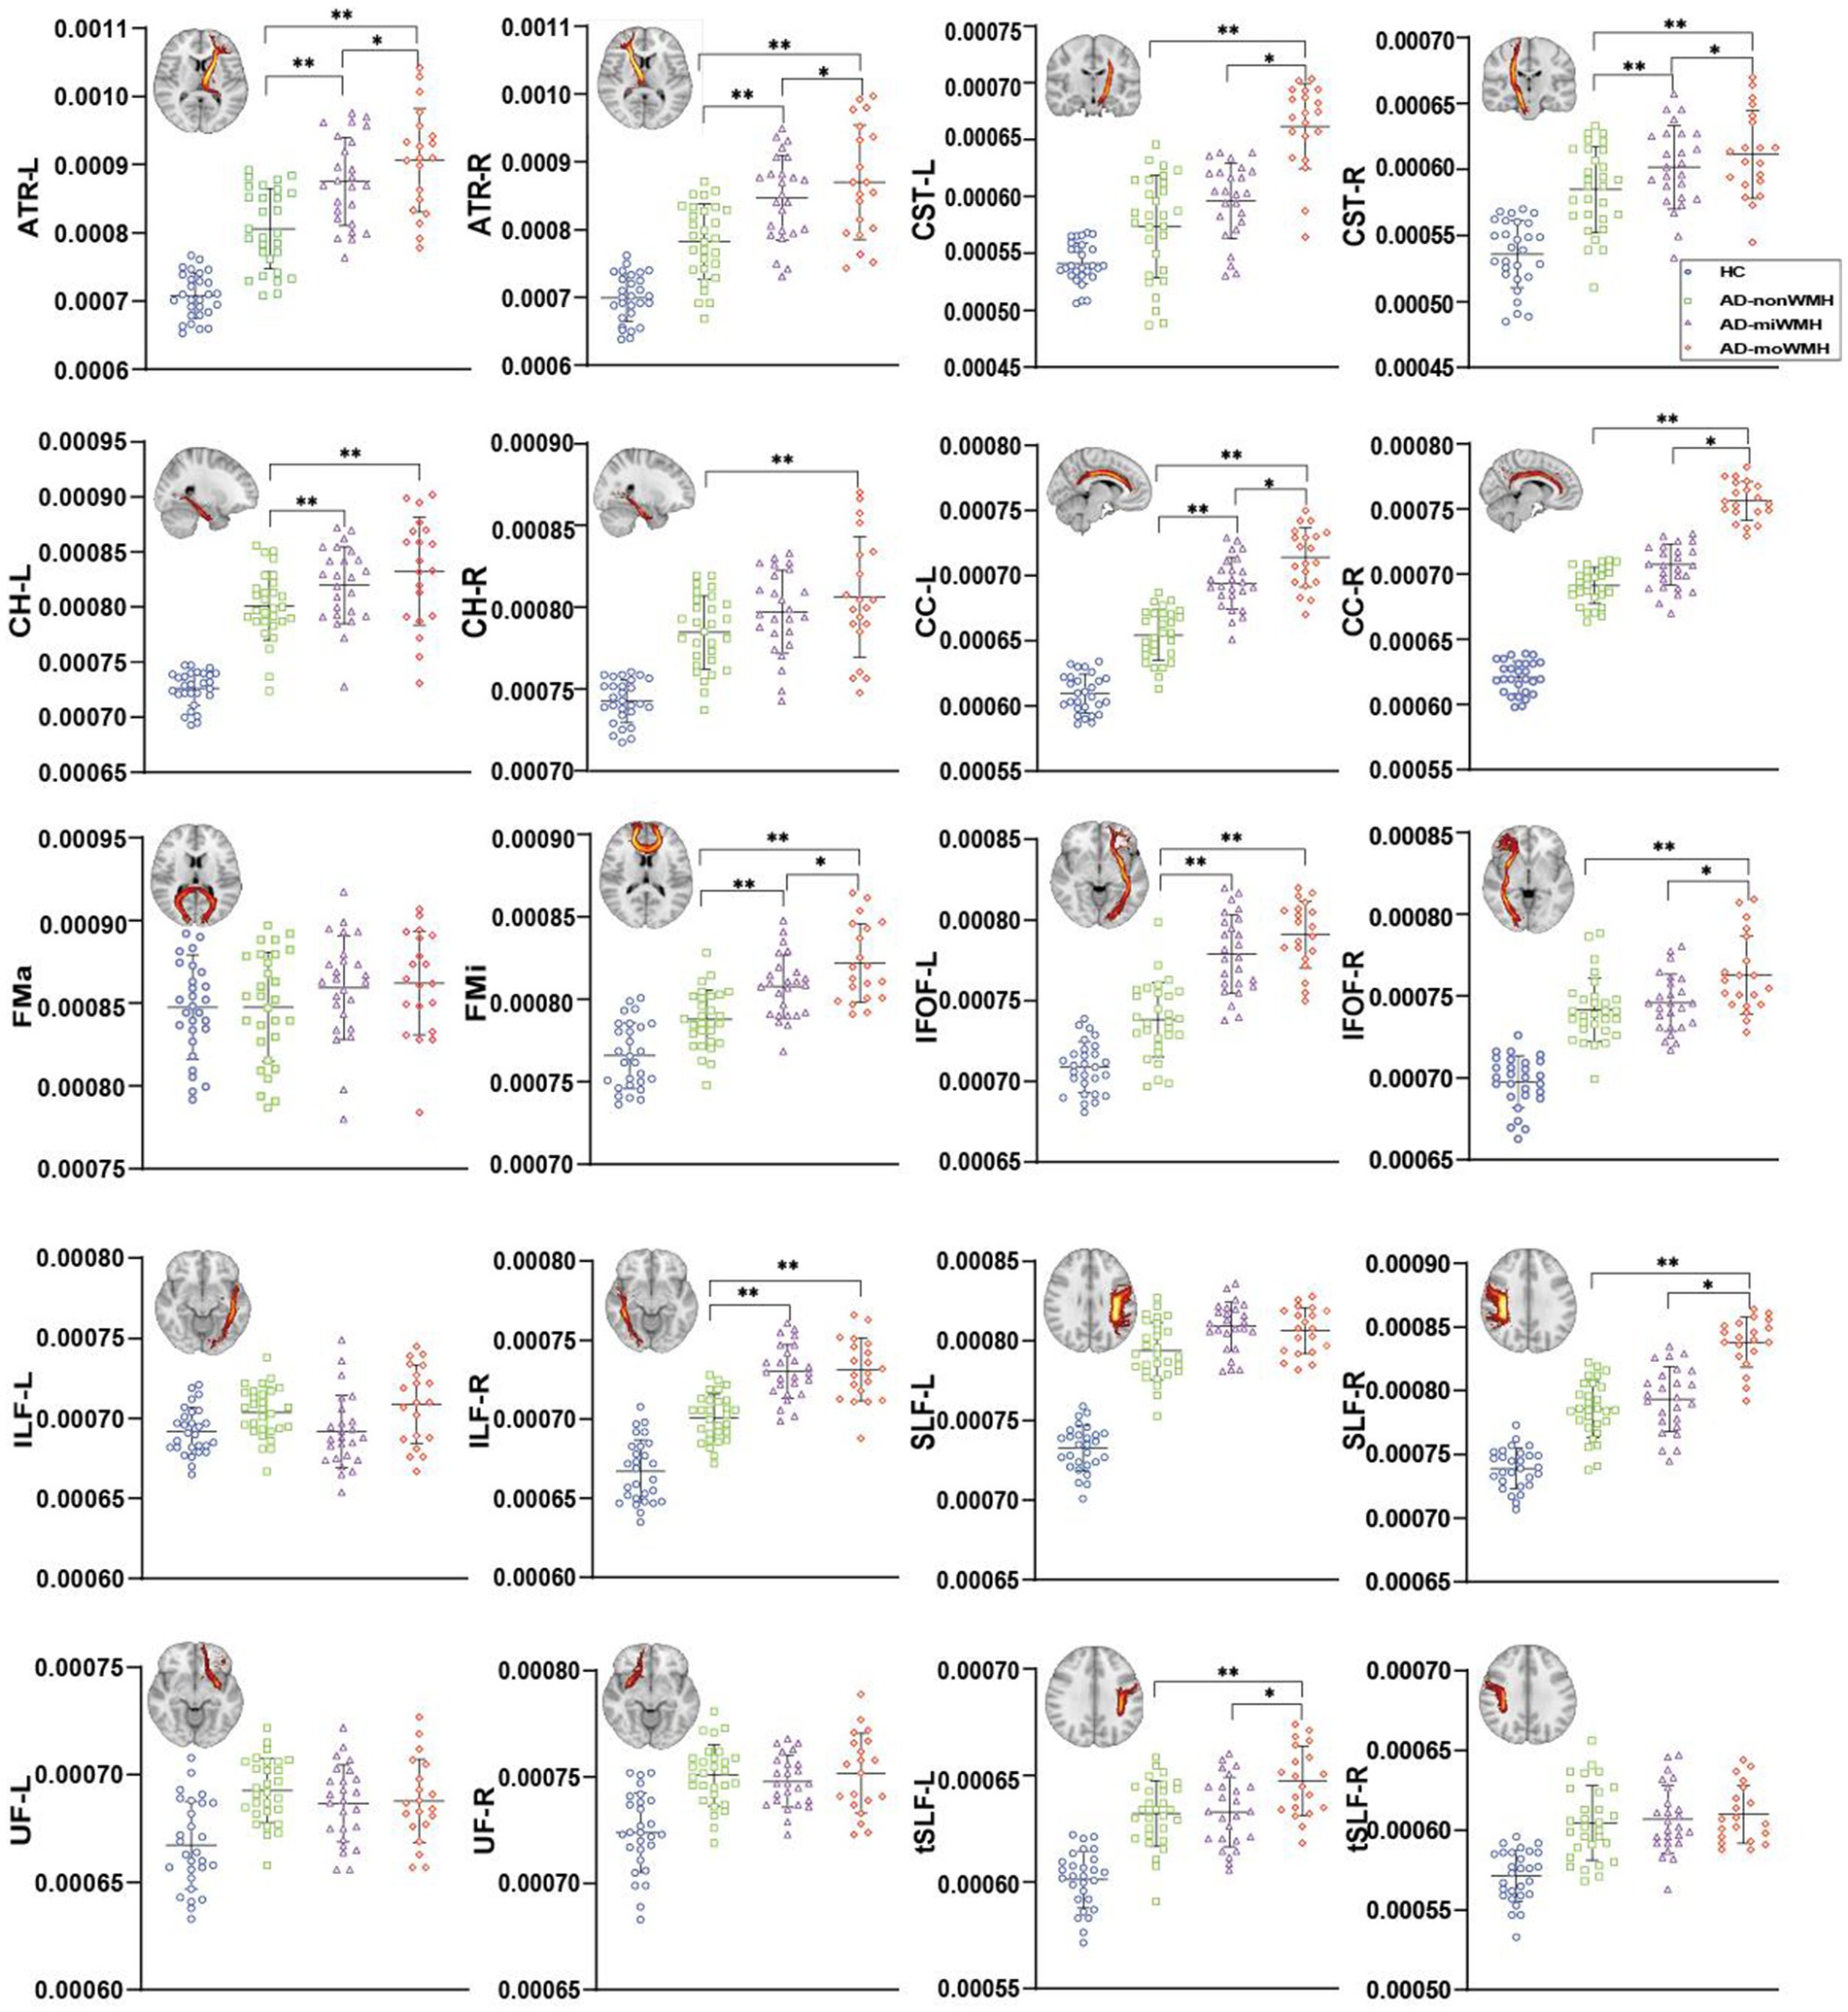
Figure 3. Graph was compared of MD values. Apart from the bilateral UF, FMa, and left ILF, the remaining WM fiber tracts exhibited significant differences between the AD group and the HC group (blue), p all <0.001. The results of comparing white matter fiber tracts in the AD groups are shown (*p < 0.05; **p < 0.001). ART: anterior thalamic radiation; CST: corticospinal tract; CH: cingulum of the hippocampus; CC: cingulum of the cingulate cortex; FMa: forceps major; FMi: forceps minor; IFOF: inferior fronto-occipital fasciculus; ILF: inferior longitudinal fasciculus; SLF: superior longitudinal fasciculus; UF: uncinate fasciculus; tSLF: superior longitudinal fasciculus-temporal part; L: left; R: right; MD, mean diffusivity; AD, Alzheimer’s disease; HC, healthy controls.
3.3 Comparison of regional grey matter volume
We demonstrate regions of change in grey matter atrophy in each group, see Figure 4. We showed the most widespread GMV decreases across the frontal and parietal regions in AD with low WMH volume while AD without WMH showed reduced grey matter volume mainly in temporal regions compared to HC after further controlling for age, gender and cognition (p < 0.05), see Table 2 and Figure 5.
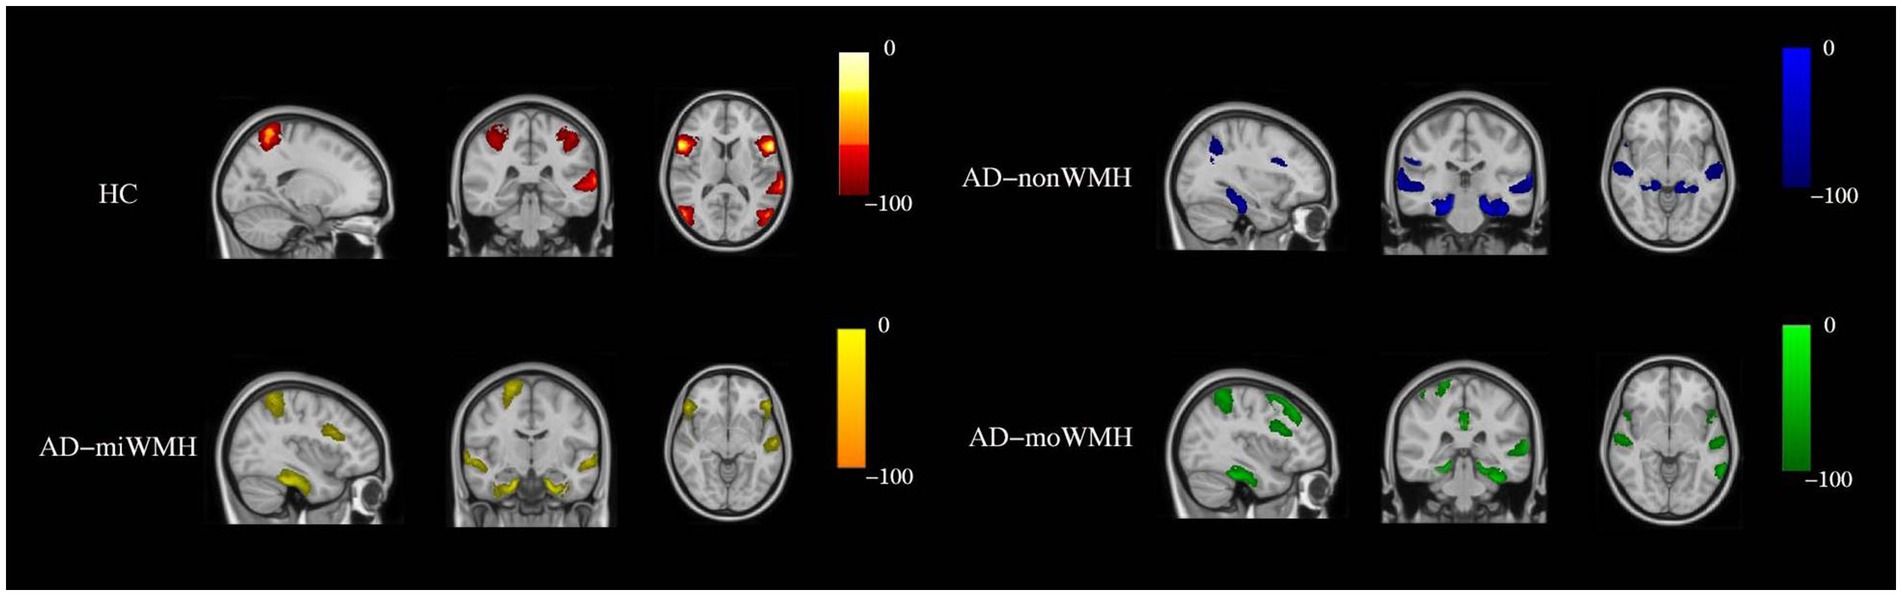
Figure 4. Show the sites of grey matter atrophy in each group. The results are presented in radiological orientation and superimposed on the MNI152 1 mm standard space brain (sagittal, coronal and horizontal positions). Grey matter atrophy was seen in the HC group (red-yellow) in the following regions - left inferior frontal gyrus, bilateral inferior inferior triangular frontal gyrus, left inferior temporal gyrus, bilateral superior parietal gyrus, and bilateral superior occipital gyrus. Grey matter atrophy was seen in the AD-nonWMH group (blue) in the following regions - right inferior frontal gyrus, left middle frontal gyrus, left angular gyrus, bilateral superior temporal gyrus, bilateral inferior temporal gyrus, and bilateral hippocampus. Grey matter atrophy was seen in the AD-miWMH group (yellow) in the following regions - right middle frontal gyrus, left superior frontal gyrus, right parietal gyrus, bilateral hippocampus and bilateral superior temporal gyrus. Grey matter atrophy was seen in the AD-moWMH group (green) in the following regions - right superior frontal gyrus, bilateral middle frontal gyrus, right superior parietal gyrus, left precuneus, bilateral middle temporal gyrus, left superior temporal gyrus, bilateral anterior cingulum and bilateral hippocampus. HC, healthy controls; AD-nonWMH, AD with non WMH; AD-miWMH, AD with mild WMH; AD-moWMH, AD with moderate WMH; MNI, Montreal Neurological Institute.
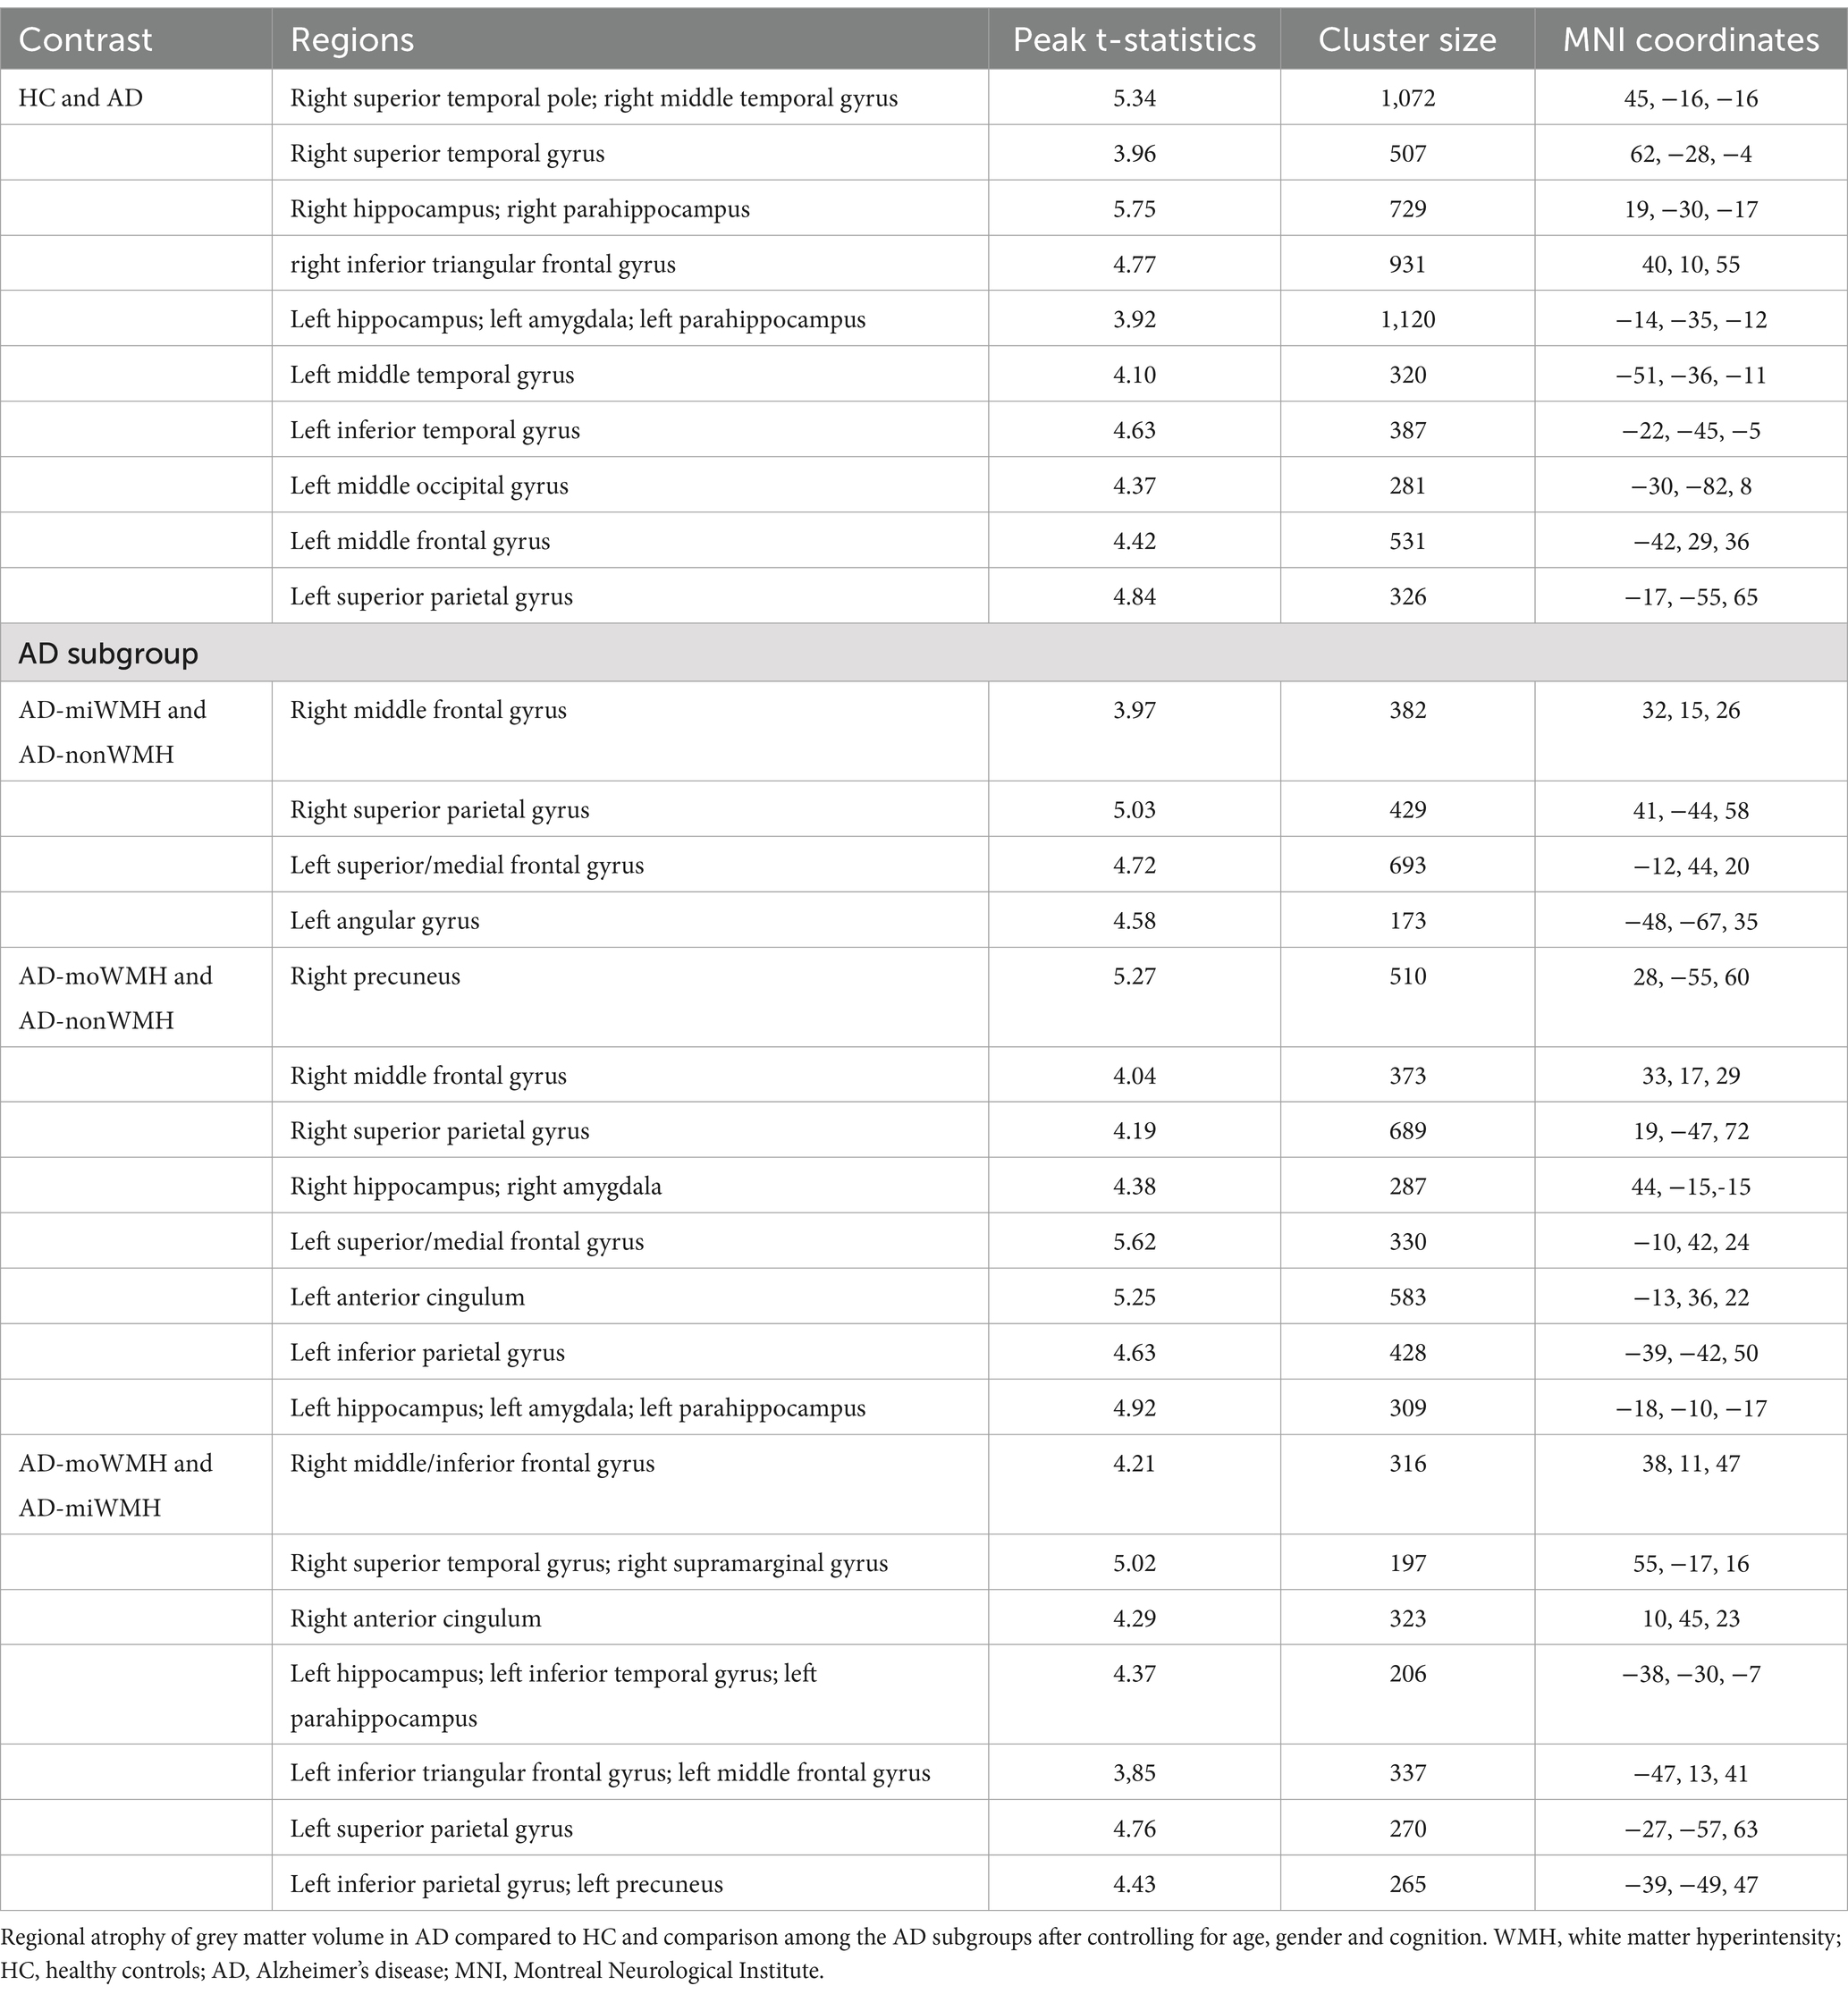
Table 2. Regions showing group differences in grey matter volume after controlling for age, gender and cognition.
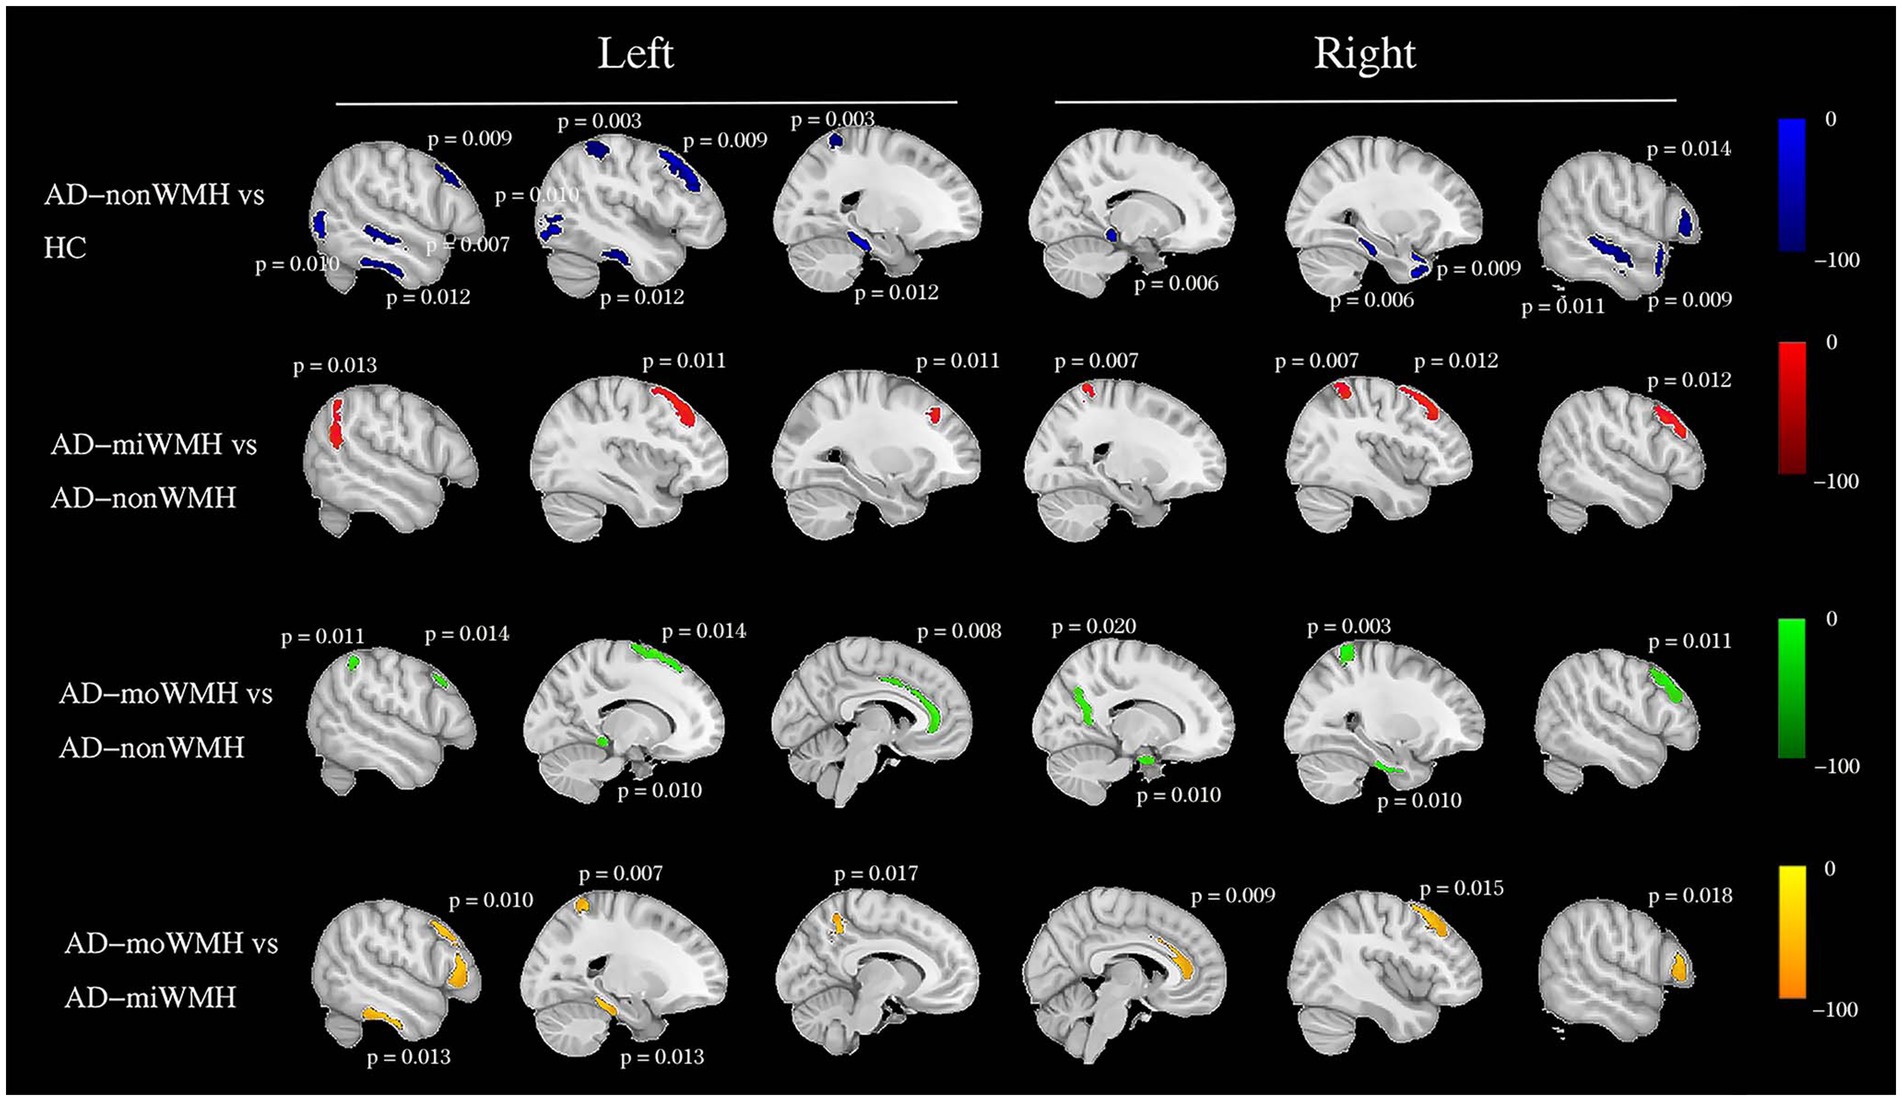
Figure 5. Group comparisons of grey matter volume using voxel-based morphometry. Schematic overview of the cerebral regions showing a statistically significant regional grey matter atrophy (blue) in AD with non WMH group compared to HC group after controlling for age, gender and cognition at pFWE <0.05. We showed a pairwise comparison between AD subgroups after controlling for age, gender, and cognition, with grey matter atrophy indicated in red (AD-miWMH vs. AD-nonWMH), green (AD-moWMH vs. AD-nonWMH) and yellow (AD-moWMH vs. AD-miWMH) respectively. The p values for the corresponding sites are marked in the figure (all pFWE <0.05). We showed the most widespread decreases in grey matter volume across the frontal and parietal regions in AD with low WMH volume while AD without WMH showed reduced grey matter volume mainly in temporal regions compared to HC. HC, healthy controls; AD, Alzheimer’s disease; WMH, white matter hyperintensities; FWE, familywise error correction; AD-nonWMH, AD with non WMH; AD-miWMH, AD with mild WMH; AD-moWMH, AD with moderate WMH.
3.4 Relationship between WMH volume and GMV
In a univariate analysis shown in Table 3, significant Spearman correlations were found between higher WMH volume and lower total GMV (r = −0.410, p = 0.031). WMH volume had a negative correlation with frontal and parietal GMV in AD patients (r = −0.422, −0.372; p = 0.022, 0.027; minimum cluster size = 100 voxels). WMH volume had no statistically different with temporal and occipital GMV in AD patients (r = −0.259, 0.520; p = 0.065, 0.113; minimum cluster size = 100 voxels).
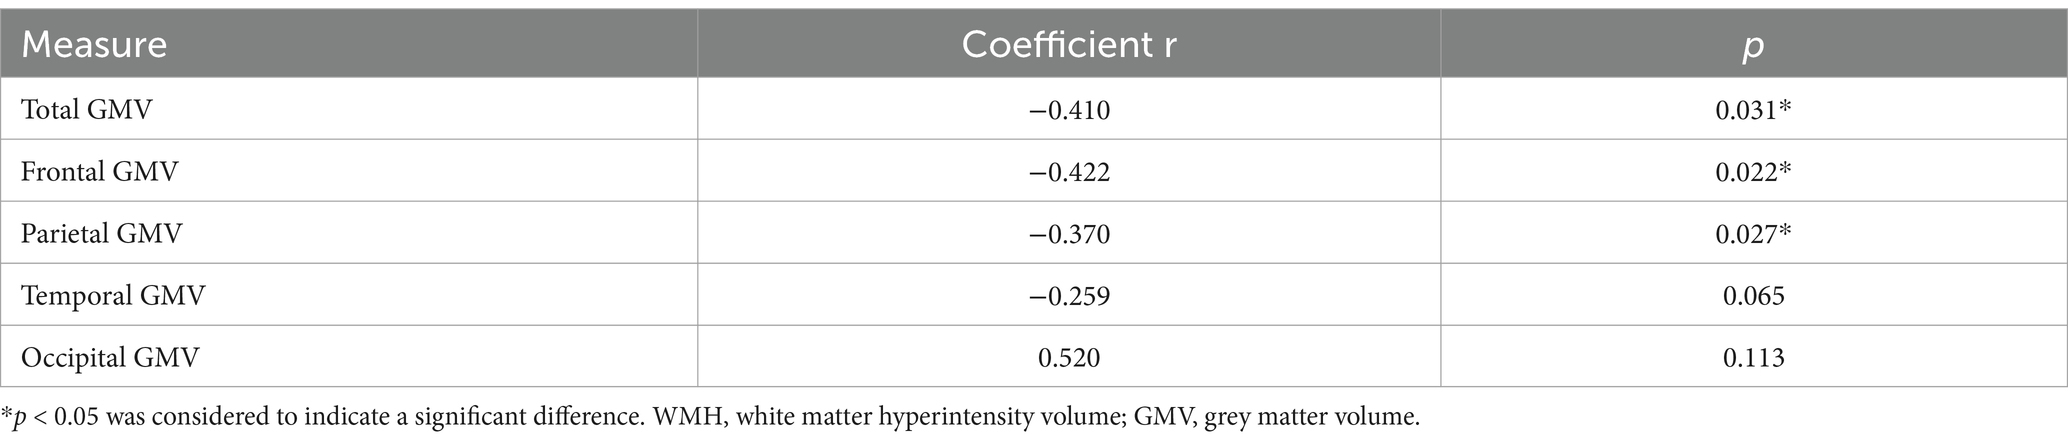
Table 3. Spearman correlations between WMH and voxel-wise GMV.
We further compared WMH volume with frontal and parietal GMV. Only in the AD-miWMH group was WMH volume associated with GMV in the following 3 regions: right angular gyrus, right superior frontal gyrus and right middle/inferior parietal gyrus (pFWE <0.01, minimum cluster size = 100 voxels), see Figure 6. Additionally, WMH volume was negatively associated with GMV primarily in 5 areas of frontoparietal regions involving left superior frontal gyrus, bilateral middle frontal gyrus, bilateral inferior frontal gyrus, left angular gyrus, and right superior parietal gyrus in the AD-miWMH group, as shown in Table 4. However, WMH volume was only negatively associated with GMV in frontoparietal regions in the AD-moWMH group (all pFWE <0.05, minimum cluster size = 100 voxels), as shown in Table 4.
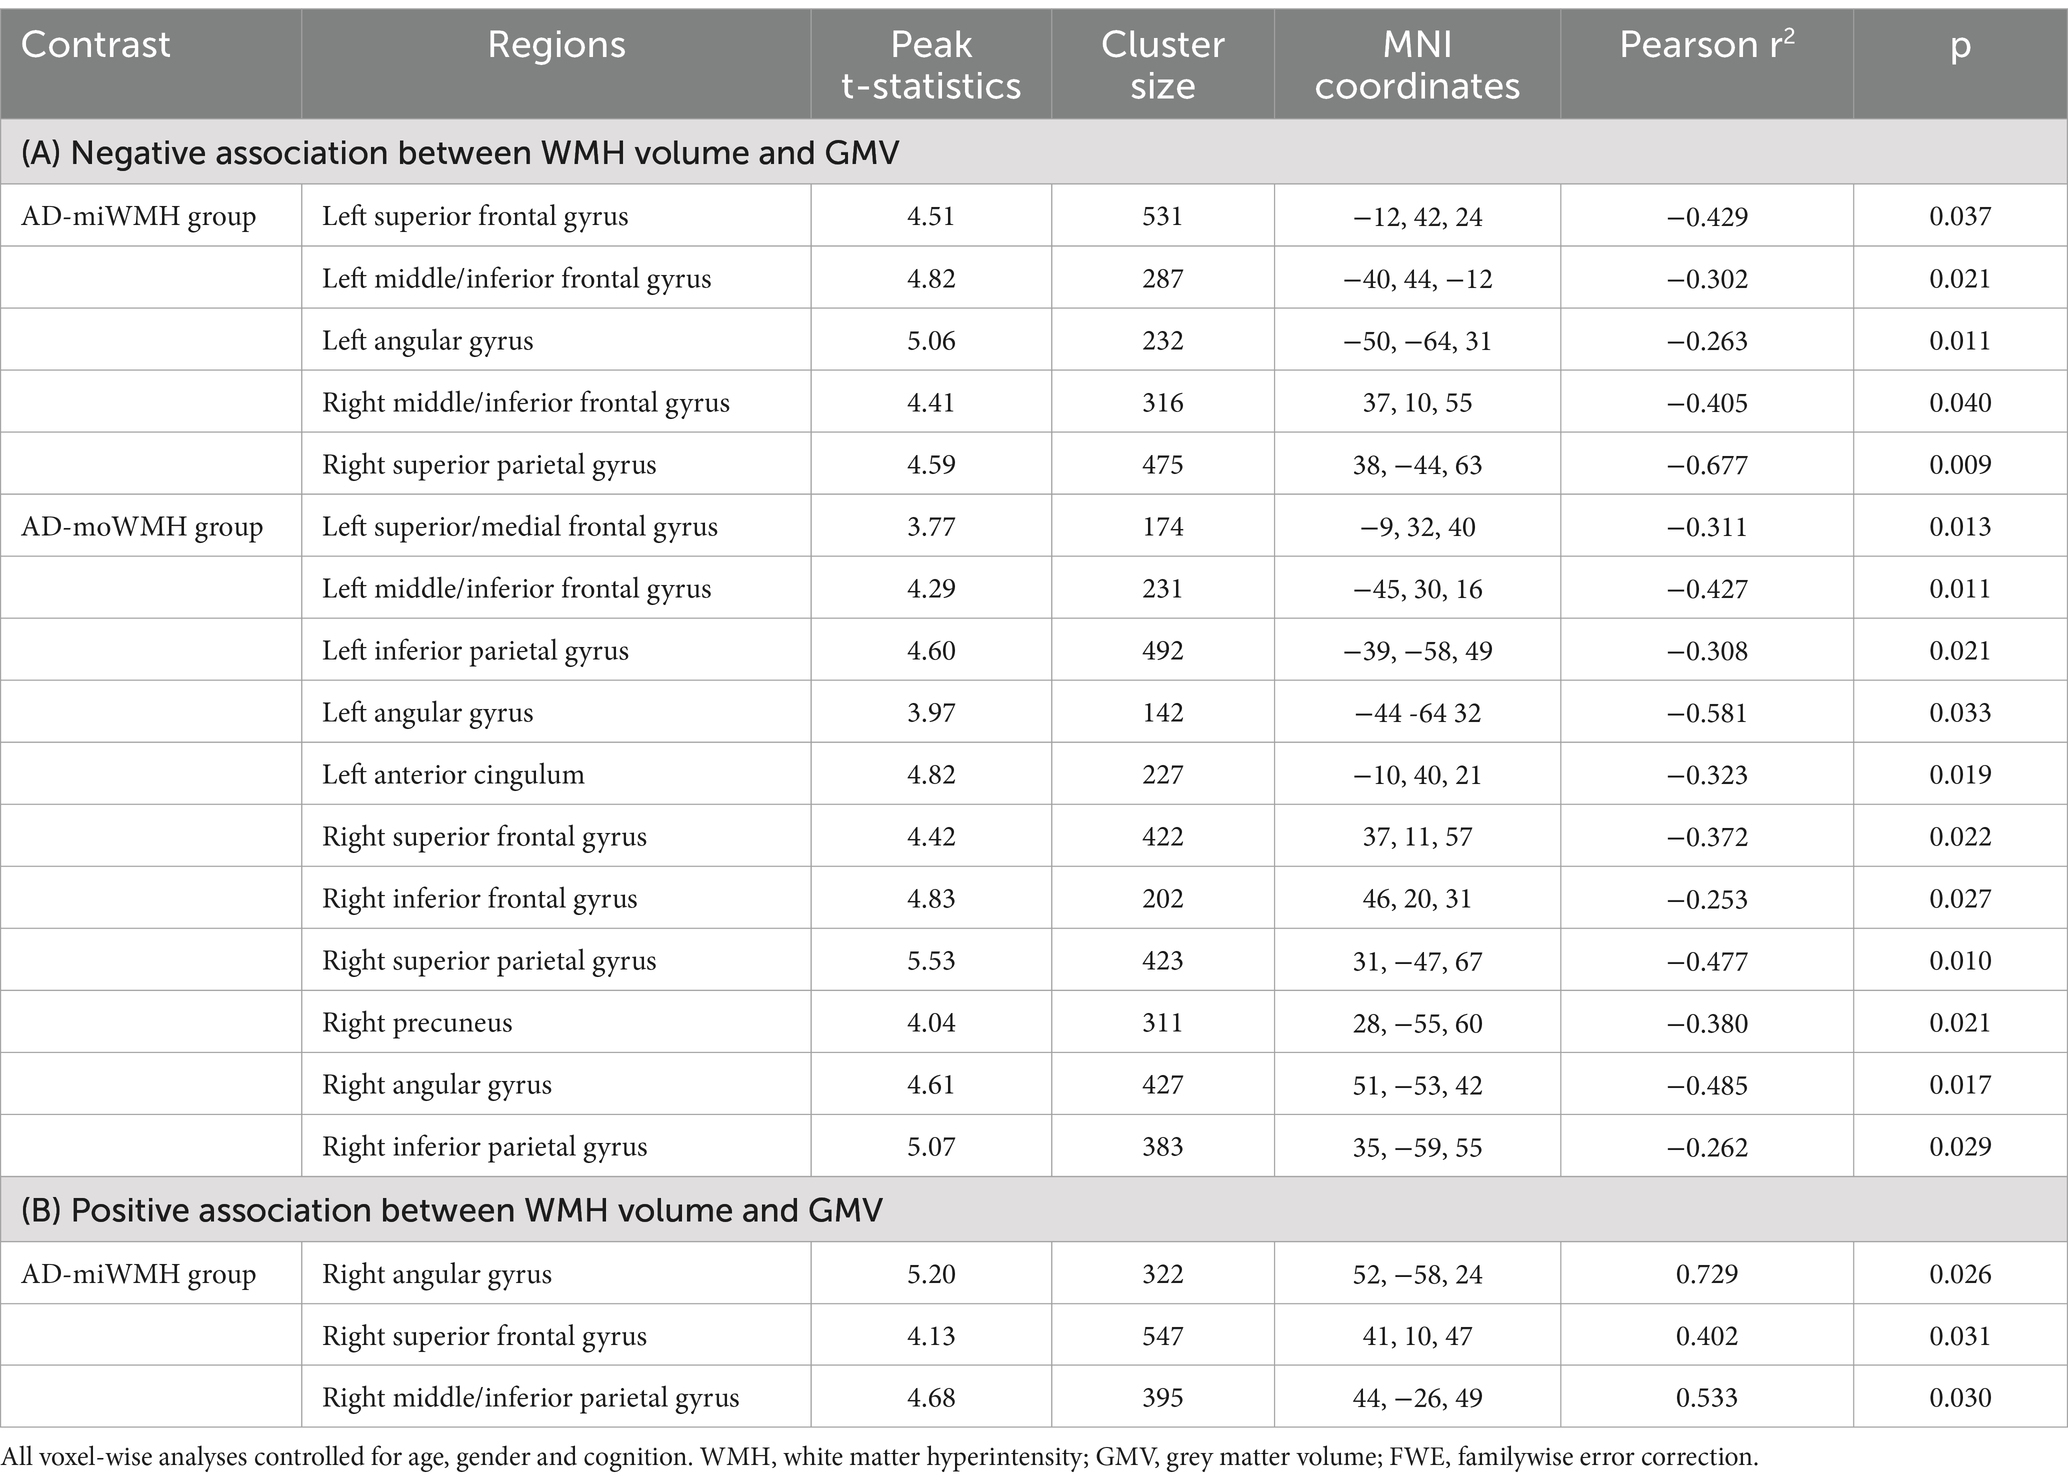
Table 4. Associations between WMH and voxel-wise regional GMV in AD groups by FWE correction.
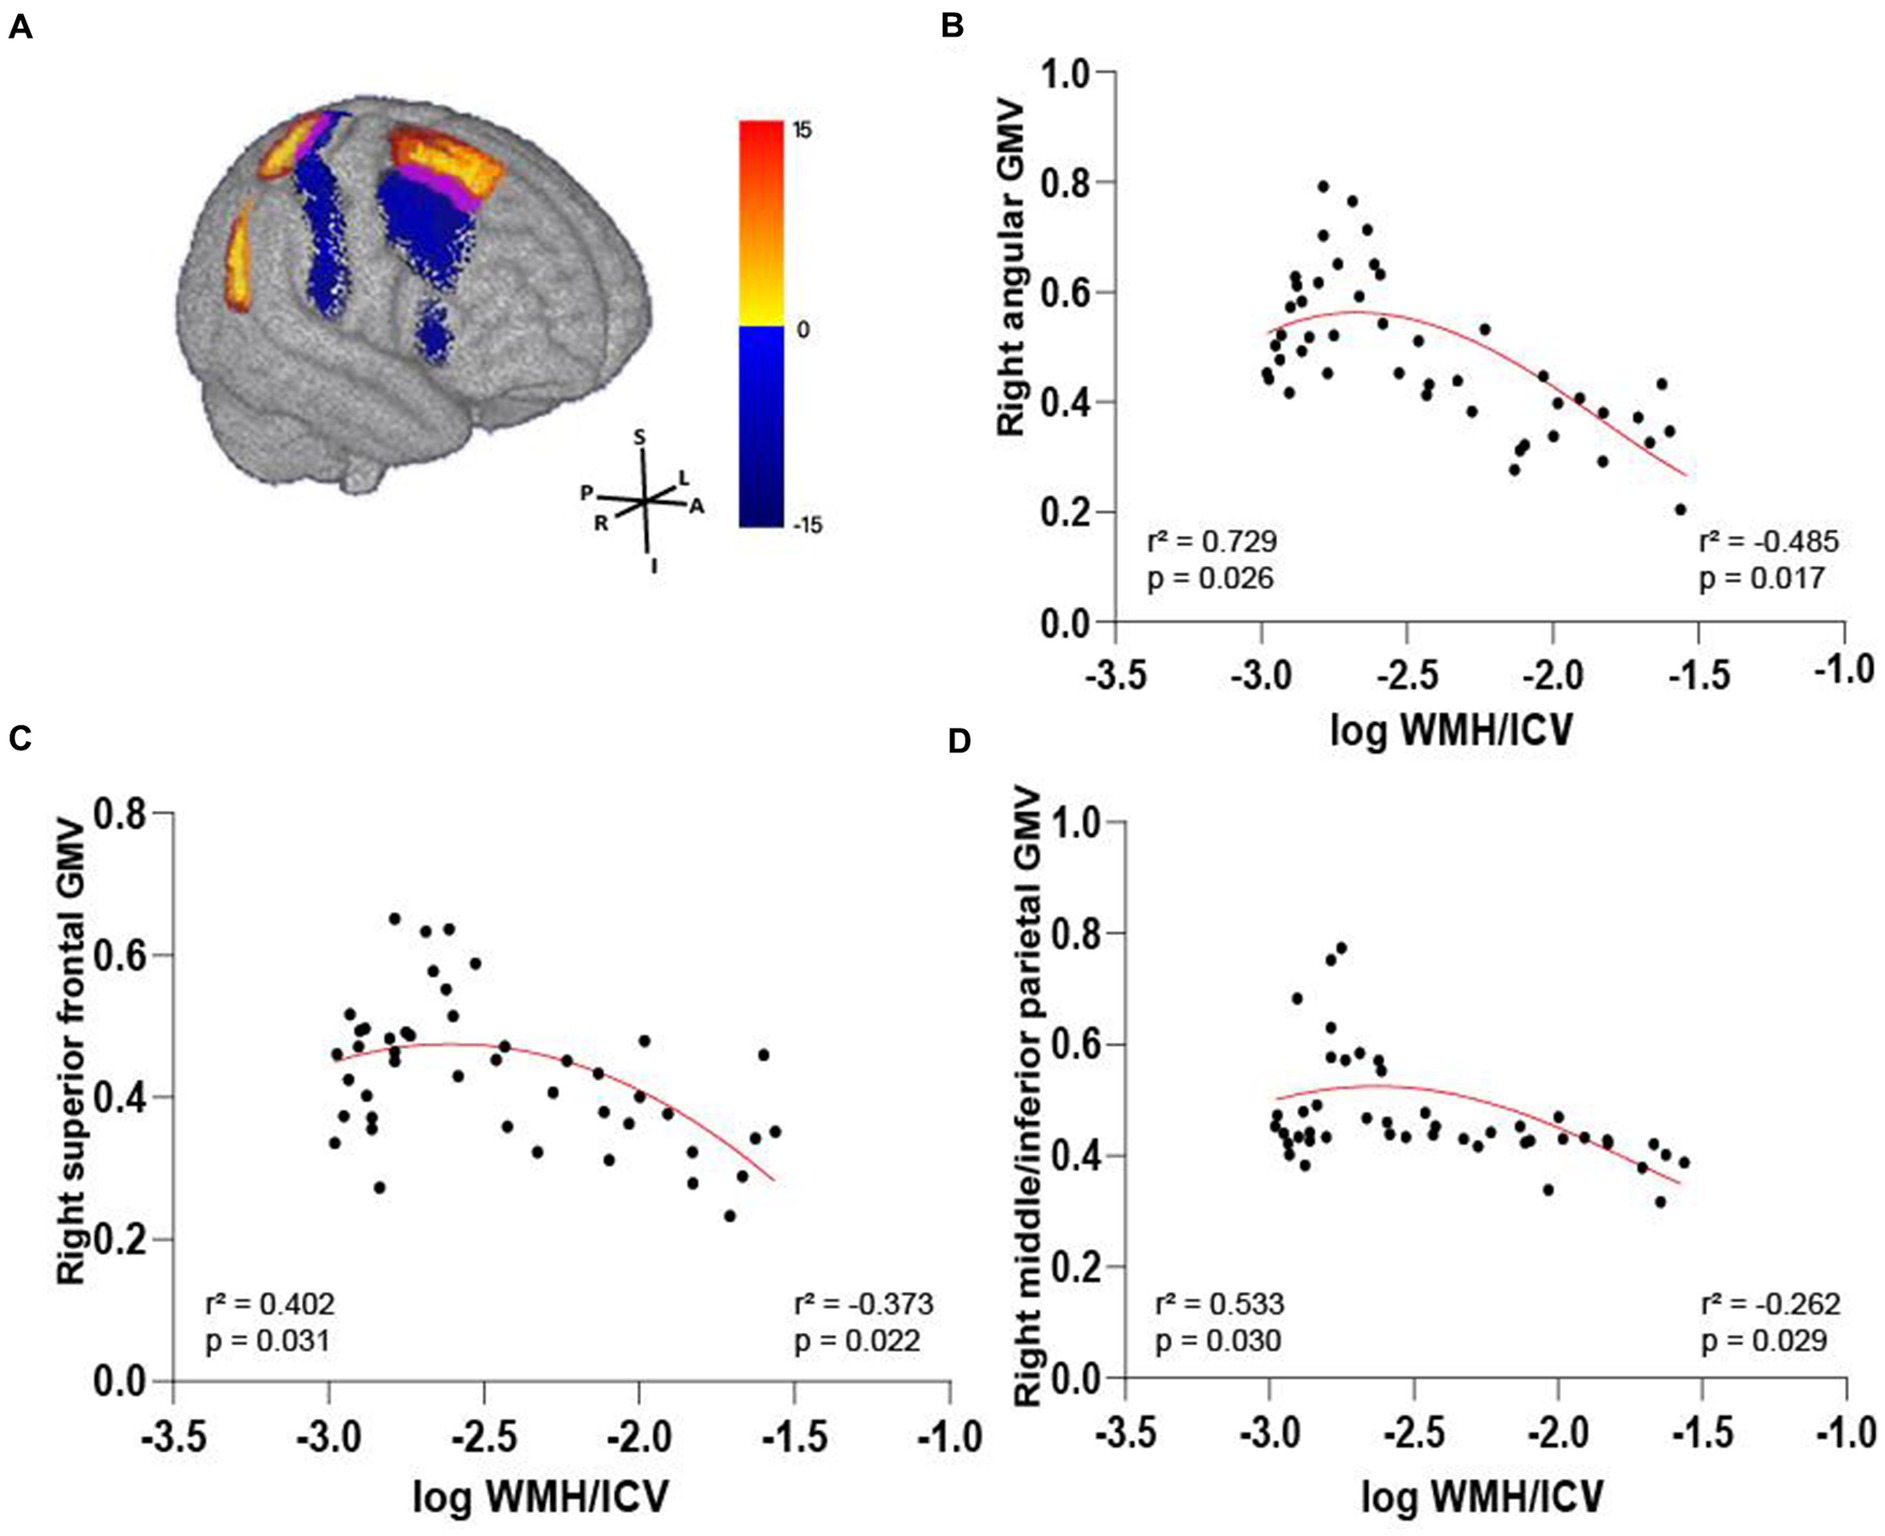
Figure 6. Volume-dependent differential relationship between grey matter and white matter hyperintensity in AD patients. (A) The 3D brain slice shows the positive association between voxel-wise GMV and WMH volume at AD patients with mild WMH in the right frontal–parietal cortex (red-yellow) at AD patients with mild WMH, whereas negative association in the right frontal–parietal cortex regions (blue). Overlapping regions are shown in purple. Results are shown on three dimensional renderings of the MNI template brain at pFWE <0.05. (B–D) GMV in the right angular cortex (B) was positively related to mild WMH volume. On the other hand, the inverse was observed, with increasing WMH volume relating to lower GMV. Similarly, this trend shows in the right superior frontal cortex (C) and the right middle/inferior parietal cortex (D). GMV, grey matter volume; WMH, white matter hyperintensity; ICV, intracranial volume; AD, Alzheimer’s disease; MNI, Montreal Neurological Institute; FWE, familywise error correction.
3.5 Regional GMV modulates the relationship between WMH and cognition
The pattern of mediating effects is illustrated in Figure 7. In the frontoparietal region, moderation analyses after correcting for age and gender revealed that increased WMH volume interaction with these regions of GMV reduction were associated with reduced executive function, i.e., left precuneus (effect size = −0.1638, proportion of relative effect = 66.40%), left inferior frontal triangular gyrus (effect size = −0.1356, proportion of relative effect = 54.96%), left angular gyrus (effect size = −0.1794, proportion of relative effect = 71.11%), right supramarginal gyrus (effect size = −0.1841, proportion of relative effect = 60.38%), and right superior parietal gyrus (effect size = −0.3397, proportion of relative effect = 54.26%), as shown in Figure 8. There were revealed significant moderating effects of these regions of GMV on the association between increased WMH volume and worse episodic memory involving the regions of GMV including: left middle frontal gyrus (effect size = −0.2827, proportion of relative effect = 54.37%), left inferior frontal triangular frontal gyrus (effect size = −0.7714, proportion of relative effect = 59.26%), right supramarginal gyrus (effect size = −0.3593, proportion of relative effect = 78.50%), and bilateral (left/right) posterior parietal cortex (effect size = −0.3121, −0.5237; proportion of relative effect = 56.82, 59.06%), see Figure 8. In comparison of the other cognitive domains, no statistical differences were found between the interaction of increased WMH volume with regional GMV and the cognitive domains. The detailed results of the mediation analysis were listed in Table 5.
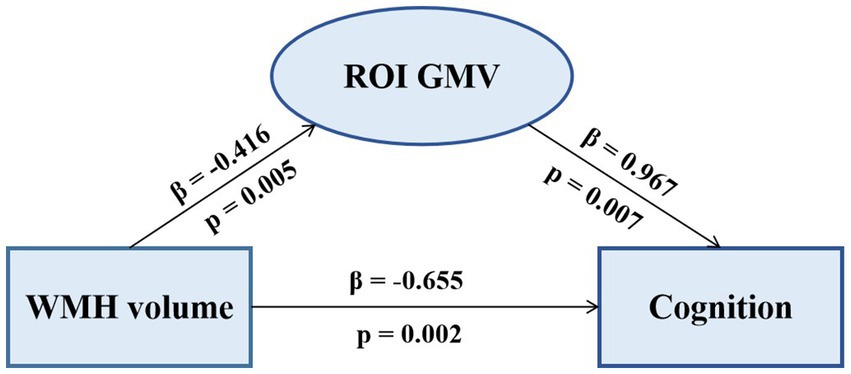
Figure 7. The mediating effect of ROI GMV on the association between WMH volume and cognition. Increased WMH volume was negatively correlated with decreased regional GMV and cognitive dysfunction. Decreased GMV was positively correlated with cognitive dysfunction. ROI, region of interest; GMV, grey matter volume; WMH, white matter hyperintensity.
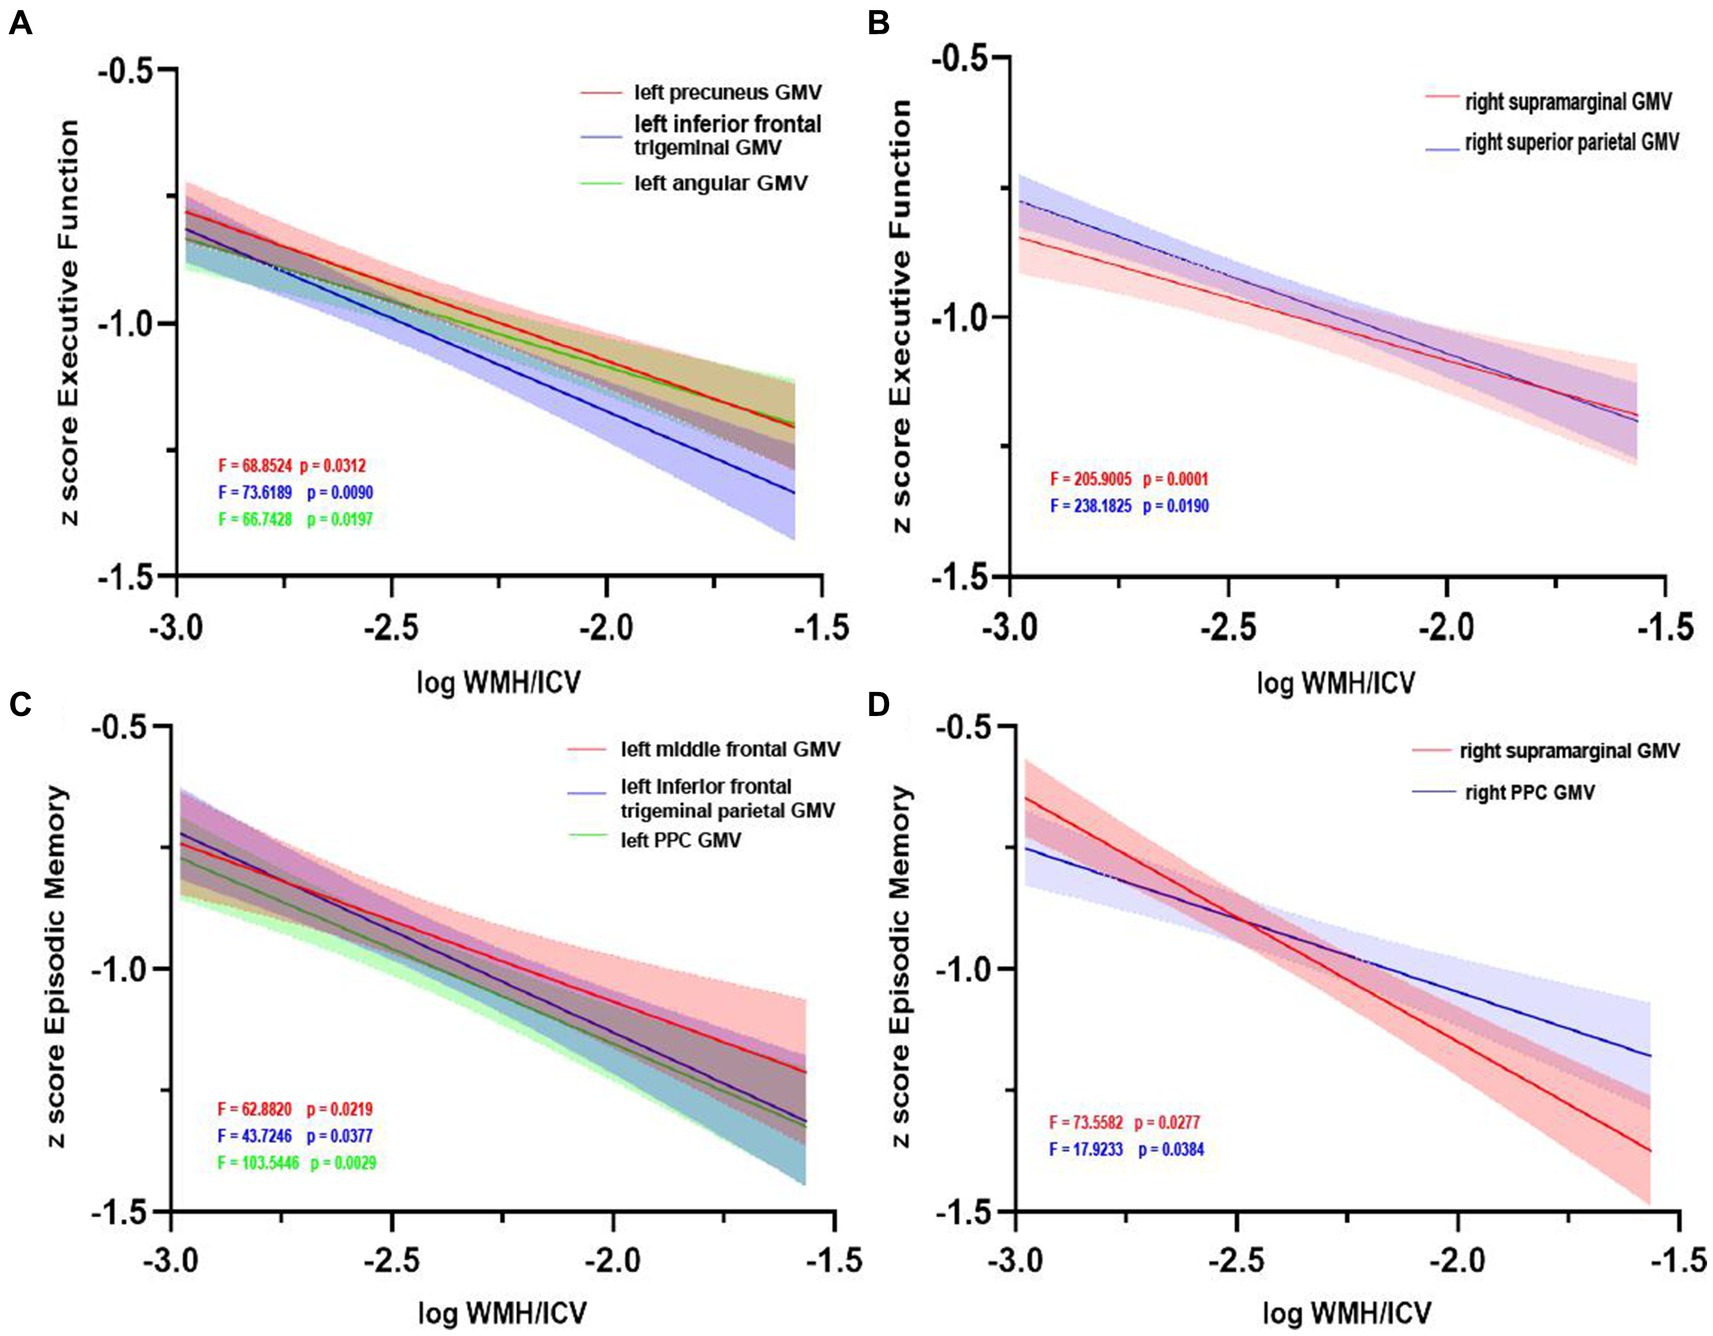
Figure 8. Grey matter volume moderates the relationship between white matter hyperintensity volume and cognition. Left (A) and right (B) regions of GMV modulated the relationship between executive function impairment and increasing WMH volume. Similarly, left (C) and right (D) regions of GMV modulated the relationship between episodic memory impairment and increasing WMH volume. GMV, grey matter volume; WMH, white matter hyperintensity; ICV, intracranial volume; PCC, posterior cingulate cortex.
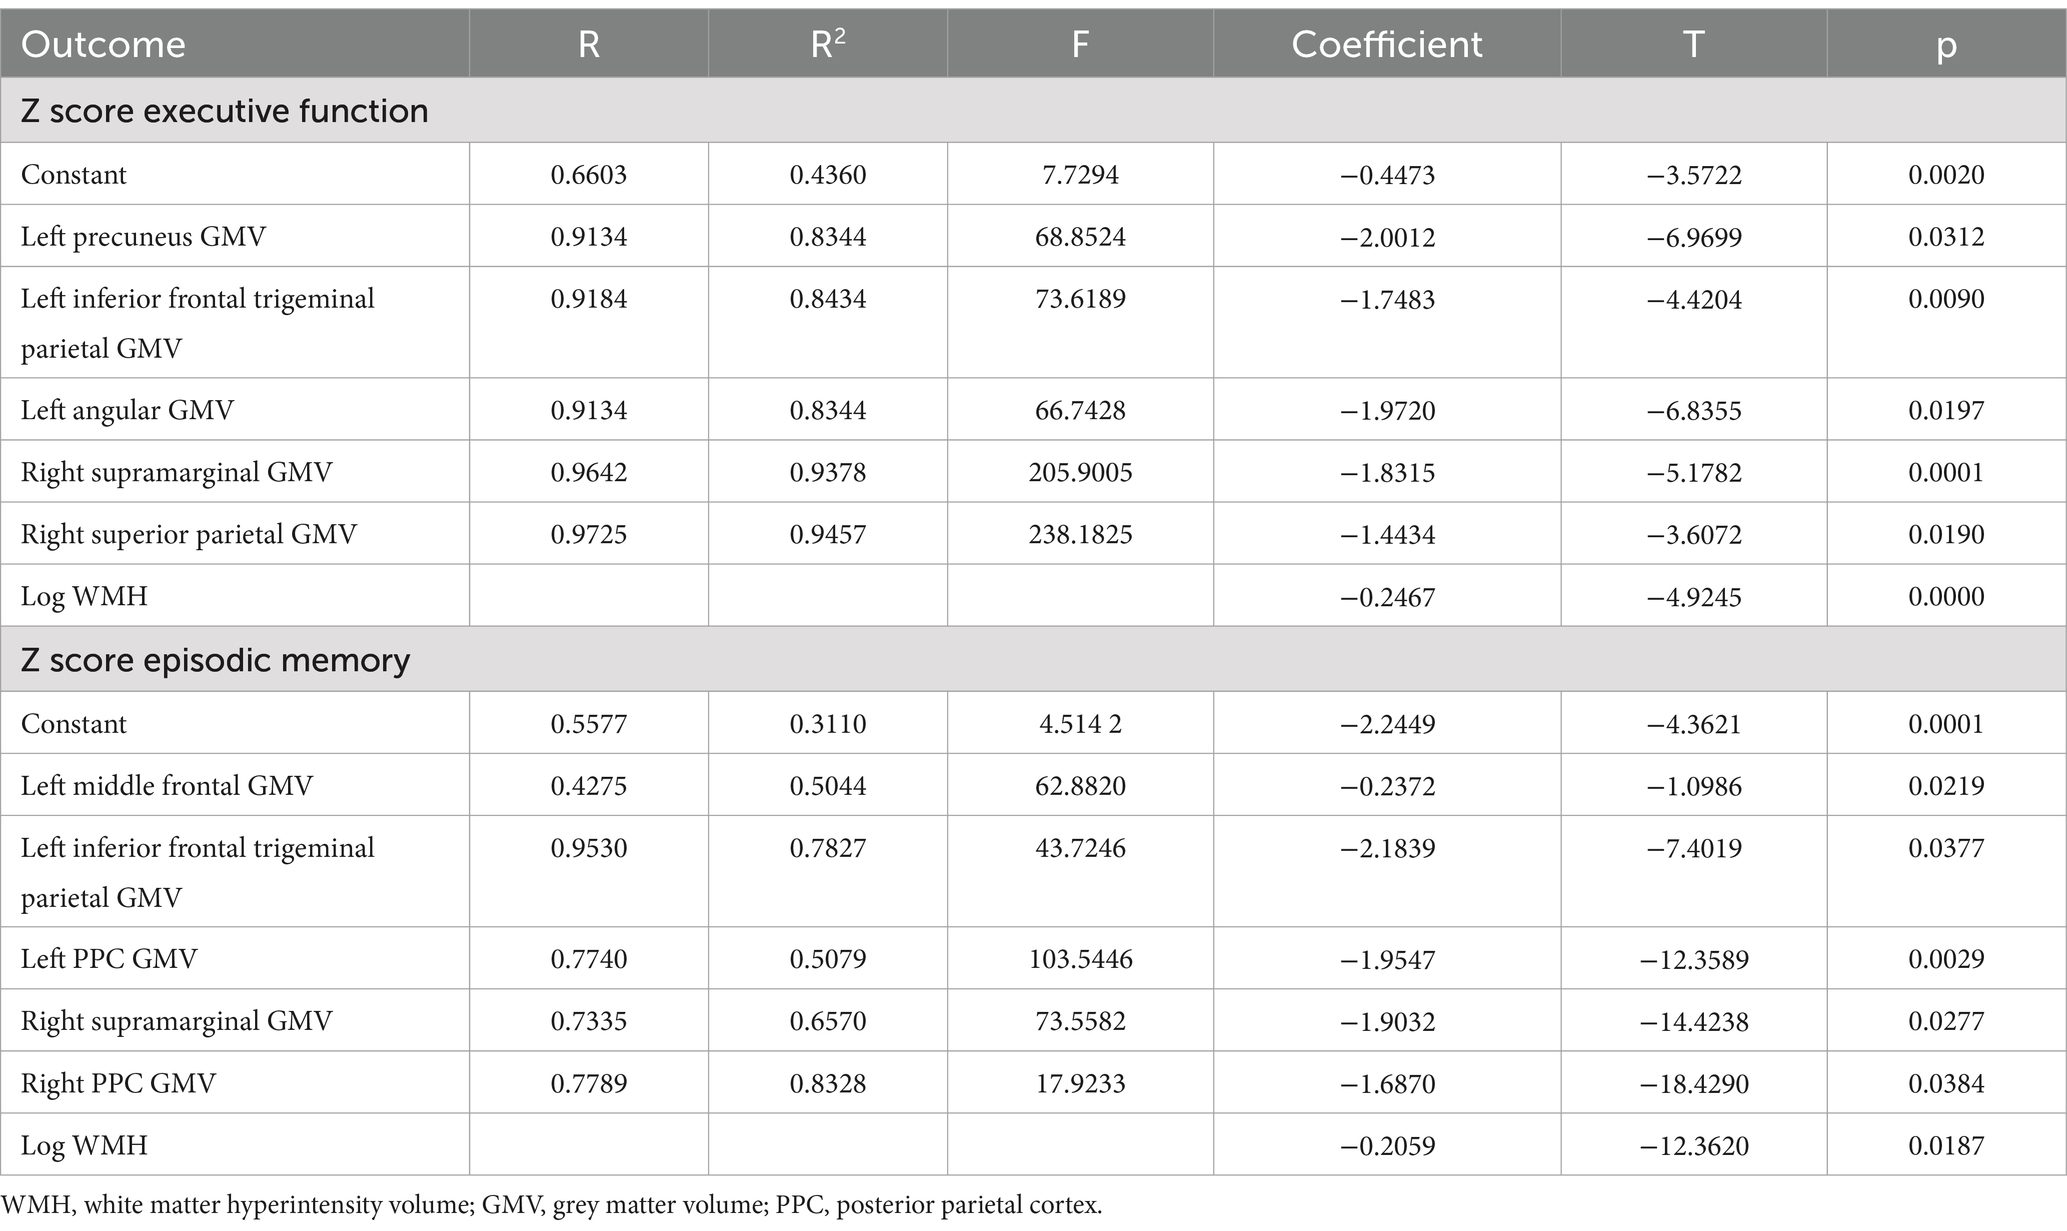
Table 5. The results of a mediating model test of WMH volume on Z score executive function or episodic memory.
4 Discussion
Our study demonstrates that WMH in Alzheimer’s disease presents with impairment of white matter integrity. The higher WMH volumes in AD indicate more severe damage to WM fiber tracts. We reveal a negative correlation between WMH and grey matter atrophy in frontal–parietal regions in a volume-dependent manner. However, low WMH volume was positively associated with partial regional GMV, and the relationship was not linear. We also demonstrate the correspondence between WMH volume and GMV in cognition. Specifically, the correspondence between increased WMH volume and regional GMV atrophy causes worse episodic memory and execution function. This may have important implications for global or domain-specific cognitive function in AD.
First, at the overall level of fiber bundles, decreased FA in 8 of 20 fiber tracts (bilateral ATR, bilateral CH, right CC, FMi, left IFOF, and left SLF) and 16 fiber tracts apart from the 4 fiber tracts (bilateral UF, FMa, and left ILF) exhibited significantly higher MD in AD patients compared with normal elderly populations. FA decreased in 9 fiber tracts (bilateral ATR, right CST, bilateral CH, right CC, FMa, FMi, and left tSLF) and MD increased in the 13 fiber tracts between AD with higher WMH and AD without WMH. These are predominantly association fiber. The DTI metrics abnormalities of fiber tracts reflect disruption of microstructural WM integrity. We consider WMH to be an external imaging manifestation of subtle microstructural WM tract degeneration. It may suggest the presence of histopathological changes in WM region such as demyelination, Wallerian degeneration, neuron loss, oligodendroglial apoptosis, and gliosis.
Moreover, we observe a mismatch between FA and MD values in the DTI metrics. This may be due to a decrease in tissue density and an increase in water diffusivity while maintaining underlying directional structure, and these outcomes cause an increase in MD when FA remains unchanged (Nir et al., 2013). Excessive accumulation of intracellular and extracellular fluid has been proposed as a possible explanation for the mismatch in DTI metrics changes (Pfefferbaum and Sullivan, 2005). This may be caused by progressive myelin and axonal damage, but also by glial or cellular reactions, for instance, during ongoing inflammatory processes (De et al., 2019). In addition, due to the lack of specificity, the measurement of DTI parameters may be affected by imaging techniques, data processing methods, and individual anatomical differences. Therefore, identifying the underlying neurobiological mechanisms that can explain changes producing differences between DTI metrics is challenging. Further studies are needed to clarify the biological underpinnings of the observations.
Previous studies indicate that total WMH volume was associated with reduced GMV in AD (Vipin et al., 2018). Similarly, we found that negative associations between WMH and GMV have been previously observed. After adjusting for covariates, regional GMV atrophy in the frontal and parietal lobes was observed in AD with combined WMH compared with AD without WMH, whereas hippocampus atrophy was seen in AD patients with higher WMH. This may be the majority of WMH occur in the frontal and parietal subcortical regions (Gouw et al., 2008), causing a reduction in regional grey matter atrophy, especially frontal and parietal-specific structural changes (Ha et al., 2012; Capizzano et al., 2004). We also confirmed that WMH volume was negatively correlated with frontal and parietal GMV and not statistically different with temporal and occipital GMV.
Our study also demonstrates that GMV is decreased in frontal–parietal regions with high WMH in AD, while low WMH volume had an unstable relationship with GMV, positively in the following regions (right angular gyrus, right superior frontal gyrus, and right middle and inferior parietal gyrus), but negatively in other frontal and parietal regions. This positive relationship could be merely stage-dependent, as has been observed not only in mild cognitive impairment patients (Vipin et al., 2021) but also in AD patients. This effect may be a continuous process. The stable and negative relationship between WMH and GMV was observed only after a certain threshold of WMH volume was reached. One possible explanation is that increased GMV indicates the presence of local plasticity (Vipin et al., 2021; Jacobs et al., 2014), i.e., WM damage leads to the WMH increase, which further induced a neuroplastic response by stimulating grey matter adaptations and functional connectivity increases. Wherein the early stage of cortical dysfunction is without no grey matter loss or neurodegeneration, but instead merely compensatory grey matter increase (Reid et al., 2010). Furthermore, increase in regional vasculature could be a compensatory mechanism for ischaemia and increase in the number of synapses comprising synaptogenesis might be a compensatory neuroprotective mechanism underlying increases in grey matter (Zatorre et al., 2012), and such alterations would help the cortex to maintain its function in the presence of cerebrovascular disease (Brickman et al., 2011).
However, there is a stable and widespread negative correlation between WMH and GMV in AD with high WMH volume, which aligns with findings obtained from other studies (Leritz et al., 2011; Tuladhar et al., 2015; Vipin et al., 2018; Habes et al., 2016). One possible mechanism is that on a background of anterograde degeneration (Du et al., 2005), the presence of subcortical WMH leads to structural alterations of the cortex as well as damage to specific white matter tracts connecting these regions (Glickstein and Berlucchi, 2008). Meanwhile, WMH leads to WMH increased impacts on brain structures through increased Aβ deposition or reduced amyloid-beta clearance (Zlokovic, 2011). On the other hand, neurodegenerative alternations such as cortical atrophy as well as tau and amyloid-deposition in the accumulation of WMH via Wallerian degeneration of anatomically connected WM bundles (McAleese et al., 2017; Scott et al., 2016). Our results provide evidence to differential volume-dependent relationships between WMH and brain structure. Thus, studies examining early stages and the disease progression of AD should take into account the presence and influence of WMH as well as their potential interaction with the pathology associated with Aβ deposition and clearance disorders. It may also be possible to track the pattern of cortical atrophy to differentiate between different pathological subtypes of AD (Whitwell et al., 2012).
The influence of WMH on cognition is predominantly considered negative. Previous studies would argue that there is no pair-wise correspondence between WMH and cognition, nor between GMV and cognition. We consider that WMH and GMV co-occur or successive appearance while participate together in the process of cognitive decline. This interaction significantly associated with executive function, and episodic memory. We did not find that WMH moderated effect on GMV existed in cognitive domain involving language, visuospatial, and attention. This effect of WMH on cognition is strengthened by GMV loss in frontoparietal regions (Vipin et al., 2021). Since this correspondence between GMV and WMH on cognition at both low and high WMH volume, GMV may likely be an important moderator. Additionally, the increased WMH volume may cause damage to cholinergic neurotransmitters and interfere with microvascular function due to Aβ deposition (Niwa et al., 2000), further inducing impaired Aβ clearance. The clinical relevance of our study may be that irreversible GMV loss begins when WMH exceeds a certain threshold, and clinical interventions aimed at mitigating GMV loss may be less beneficial. Therefore, monitoring the correspondence between WMH volume, regional GMV, and its impact on cognition during the whole course of AD, as it will provide a window of opportunity for interventions to delay the neurodegenerative process.
Our study has several limitations. First, our study was limited by the cross-sectional study design which prevented us from investigating the effect of WMH on the progression of atrophy patterns in AD progression. In the future, further validation of results using longitudinal datasets is needed. Secondly, we had no information regarding the amyloid and tau status and amyloid positron emission tomography imaging of our participants and were thus unable to assess the influence of these AD biomarkers on the relationship between WMH and brain structure, and between cortical atrophy and WMH volume. Third, due to our moderate sample size, the subjects in our cohort were limited to the elderly Chinese population, and future studies should focus on inclusion of more age groups and ethnicities to evaluate the impact of these variables on the relationship between WMH volume, GMV, and cognition. Fourth, we could only analyze the central portion of WM fibers, so we cannot exclude the possibility of the existence of other portions significantly associated with cognitive decline.
5 Conclusion
In conclusion, we confirm WM integrity damage is more in AD patients with higher WMH volume. Differential changes in DTI metrics may be caused by progressive myelin and axonal damage. This changes in DTI metrics need to be further studied. There was a negative correlation between WMH and grey matter atrophy in frontal–parietal regions in a volume-dependent manner. This study indicate the correspondence between WMH volume and GMV in cognition, and GMV being a key modulator between WMH and cognition in AD. Early determination of this relationship and the pattern of cortical atrophy provides an important opportunity to identify subtypes of AD and interventions to delay neurodegenerative changes.
Data availability statement
The original contributions presented in the study are included in the article/Supplementary material, further inquiries can be directed to the corresponding author.
Ethics statement
The studies involving humans were approved by the Institutional Ethics Committee of Jin Qiu Hospital of Liaoning Province. The studies were conducted in accordance with the local legislation and institutional requirements. All participating individuals or their representatives provided written informed consent.
Author contributions
FY: Writing – review & editing, Writing – original draft, Project administration, Investigation, Formal analysis, Data curation, Conceptualization. JW: Writing – original draft, Data curation. ML: Writing – review & editing, Formal analysis, Data curation. BL: Writing – original draft, Investigation, Data curation. SH: Writing – original draft, Investigation. SW: Writing – original draft, Project administration, Investigation, Formal analysis. YJ: Visualization, Writing – original draft, Formal analysis. NH: Writing – review & editing, Visualization, Methodology. YC: Writing – review & editing, Software, Formal analysis, Data curation. XS: Writing – review & editing, Writing – original draft, Funding acquisition, Formal analysis, Data curation.
Funding
The author(s) declare that financial support was received for the research, authorship, and/or publication of this article. This research was supported by grants from the National Natural Science Foundation of China (81100243, 81502181).
Conflict of interest
The authors declare that the research was conducted in the absence of any commercial or financial relationships that could be construed as a potential conflict of interest.
Publisher’s note
All claims expressed in this article are solely those of the authors and do not necessarily represent those of their affiliated organizations, or those of the publisher, the editors and the reviewers. Any product that may be evaluated in this article, or claim that may be made by its manufacturer, is not guaranteed or endorsed by the publisher.
Supplementary material
The Supplementary material for this article can be found online at: https://www.frontiersin.org/articles/10.3389/fnagi.2024.1429098/full#supplementary-material
References
American Psychiatric Association (2000). Diagnostic and statistical manual of mental disorders. Washington, DC: American Psychiatric Association.
Benedictus, M. R., Goos, J. D., Binnewijzend, M. A., Muller, M., Barkhof, F., Scheltens, P., et al. (2013). Specific risk factors for microbleeds and white matter hyperintensities in Alzheimer’s disease. Neurobiol. Aging 34, 2488–2494. doi: 10.1016/j.neurobiolaging.2013.04.023
Brickman, A. M., Provenzano, F. A., Muraskin, J., Manly, J. J., Blum, S., Apa, Z., et al. (2012). Regional white matter hyperintensity volume, not hippocampal atrophy, predicts incident Alzheimer disease in the community. Arch. Neurol. 69, 1621–1627. doi: 10.1001/archneurol.2012.1527
Brickman, A. M., Siedlecki, K. L., Muraskin, J., Manly, J. J., Luchsinger, J. A., Yeung, L. K., et al. (2011). White matter hyperintensities and cognition: testing the reserve hypothesis. Neurobiol. Aging 32, 1588–1598. doi: 10.1016/j.neurobiolaging.2009.10.013
Brugulat-Serrat, A., Salvado, G., Operto, G., Cacciaglia, R., Sudre, C. H., Grau-Rivera, O., et al. (2020). White matter hyperintensities mediate gray matter volume and processing speed relationship in cognitively unimpaired participants. Hum. Brain Mapp. 41, 1309–1322. doi: 10.1002/hbm.24877. Epub 2019 Nov 28
Buckley, A., Carey, D., Meaney, J. M., Kenny, R., and Harbison, J. (2020). Is there an association between orthostatic hypotension and cerebral white matter hyperintensities in older people? The Irish longitudinal study on ageing. JRSM Cardiovasc. Dis. 9:204800402095462. doi: 10.1177/2048004020954628
Capizzano, A. A., Ación, L., Bekinschtein, T., Furman, M., Gomila, H., Martínez, A., et al. (2004). White matter hyperintensities are significantly associated with cortical atrophy in Alzheimer’s disease. J. Neurol. Neurosurg. Psychiatry 75, 822–827. doi: 10.1136/jnnp.2003.019273
Chalmers, K., Wilcock, G., and Love, S. (2005). Contributors to white matter damage in the frontal lobe in Alzheimer’s disease. Neuropathol. Appl. Neurobiol. 31, 623–631. doi: 10.1111/j.1365-2990.2005.00678.x
De, S. S., Bach, P., Pérez-Cervera, L., Cosa-Linan, A., Weil, G., Vollstädt-Klein, S., et al. (2019). Microstructural white matter alterations in men with alcohol use disorder and rats with excessive alcohol consumption during early abstinence. JAMA Psychiatry 76, 749–758. doi: 10.1001/jamapsychiatry.2019.0318
De La Torre, J. C. (2002). Alzheimer disease as a vascular disorder: Nosological evidence. Stroke 33, 1152–1162. doi: 10.1161/01.str.0000014421.15948.67
Douaud, G., Smith, S., Jenkinson, M., Behrens, T., Johansen-Berg, H., Vickers, J., et al. (2007). Anatomically related grey and white matter abnormalities in adolescent-onset schizophrenia. Brain 130, 2375–2386. doi: 10.1093/brain/awm184
Du, A. T., Schuff, N., Chao, L. L., Kornak, J., Ezekiel, F., Jagust, W. J., et al. (2005). White matter lesions are associated with cortical atrophy more than entorhinal and hippocampal atrophy. Neurobiol. Aging 26, 553–559. doi: 10.1016/j.neurobiolaging.2004.05.002
Dubois, B., Slachevsky, A., Litvan, I., and Pillon, B. (2000). The FAB: a frontal assessment battery at bedside. Neurology 55, 1621–1626. doi: 10.1212/wnl.55.11.1621
Erten-Lyons, D., Woltjer, R., Kayex, J., Mattek, N., Dodge, H. H., Green, S., et al. (2013). Neuropathologic basis of white matter hyperintensity accumulation with advanced age. Neurology 81, 977–983. doi: 10.1212/WNL.0b013e3182a43e45
Fazekas, F., Chawluk, J. B., Alavi, A., Hurtig, H. I., and Zimmerman, R. A. (1987). MR signal abnormalities at 1.5 T in Alzheimer's dementia and normal aging. Am. J. Neuroradiol. 149, 351–356. doi: 10.2214/ajr.149.2.351
Folstein, M. F., Folstein, S. E., and McHugh, P. R. (1975). “Mini-mental state”. A practical method for grading the cognitive state of patients for the clinician. J. Psychiatr. Res. 12, 189–198. doi: 10.1016/0022-3956(75)90026-6
Frisoni, G. B., Fox, N. C., Jr, J. C. R., Scheltens, P., and Thompson, P. M. (2010). The clinical use of structural MRI in Alzheimer disease. Nat. Rev. Neurol. 6, 67–77. doi: 10.1038/nrneurol.2009.215
Garnier-Crussard, A., Bougacha, S., Wirth, M., Dautricourt, S., Sherif, S., Landeau, B., et al. (2022). White matter hyperintensity topography in Alzheimer's disease and links to cognition. Alzheimers Dement. 18, 422–433. doi: 10.1002/alz.12410. Epub 2021 Jul 28
Glickstein, M., and Berlucchi, G. (2008). Classical disconnection studies of the corpus callosum. Cortex 44, 914–927. doi: 10.1016/j.cortex.2008.04.001
Gouw, A. A., Van Der Flier, W. M., Fazekas, F., Van Straaten, E. C., Pantoni, L., Poggesi, A., et al. (2008). Progression of white matter hyperintensities and incidence of new lacunes over a 3-year period: the Leukoaraiosis and disability study. Stroke 39, 1414–1420. doi: 10.1161/STROKEAHA.107.498535
Griffanti, L., Zamboni, G., Khan, A., Li, L., Bonifacio, G., Sundaresan, V., et al. (2016). BIANCA (brain intensity AbNormality classification algorithm): a new tool for automated segmentation of white matter hyperintensities. NeuroImage 141, 191–205. doi: 10.1016/j.neuroimage.2016.07.018
Ha, S. Y., Youn, Y. C., Kim, S., Hsiung, G. Y., Ahn, S. W., Shin, H. W., et al. (2012). A voxel-based morphometric study of cortical gray matter volume changes in Alzheimer’s disease with white matter hyperintensities. J. Clin. Neurosci. 19, 1506–1510. doi: 10.1016/j.jocn.2011.11.041
Habes, M., Erus, G., Toledo, J. B., Zhang, T., Bryan, N., Launer, L. J., et al. (2016). White matter hyperintensities and imaging patterns of brain ageing in the general population. Brain 139, 1164–1179. doi: 10.1093/brain/aww008
Hachinski, V. C., Iliff, L. D., Zilhka, E., Du Boulay, G. H., McAllister, V. L., Marshall, J., et al. (1975). Cerebral blood flow in dementia. Arch. Neurol. 32, 632–637. doi: 10.1001/archneur.1975.00490510088009
Hamilton, M. (1959). The assessment of anxiety states by rating. Br. J. Med. Psychol. 32, 50–55. doi: 10.1111/j.2044-8341.1959.tb00467.x
Hamilton, M. (1960). A rating scale for depression. Neurol. Neurosurg. Psychiatry 23, 56–62. doi: 10.1136/jnnp.23.1.56
Ivanova, I., Salmon, D. P., and Gollan, T. H. (2013). The multilingual naming test in Alzheimer’s disease: clues to the origin of naming impairments. J. Int. Neuropsychol. Soc. 19, 272–283. doi: 10.1017/S1355617712001282
Jacobs, H. I., Clerx, L., Gronenschild, E. H., Aalten, P., and Verhey, F. R. (2014). White matter hyperintensities are positively associated with cortical thickness in Alzheimer’s disease. J. Alzheimers Dis. 39, 409–422. doi: 10.3233/JAD-131232
Joy, S., Kaplan, E., and Fein, D. (2004) Speed and memory in the WAIS-III Digit Symbol–Coding subtest across the adult lifespan. Arch. Clin. Neuropsychol. 19, 759–767.doi: 10.1016/j.acn.2003.09.009, Speed and memory in the WAIS-III digit symbol?Coding subtest across the adult lifespan
Kuller, L. H., Lopez, O. L., Newman, A., Beauchamp, N. J., Burke, G., Dulberg, C., et al. (2003). Risk factors for dementia in the cardiovascular health cognition study. Neuroepidemiology 22, 13–22. doi: 10.1159/000067109
Lee, C. K., Collinson, S. L., Feng, L., and Ng, T. P. (2012). Preliminary normative neuropsychological data for an elderly Chinese population. Clin. Neuropsychol. 26, 321–334. doi: 10.1080/13854046.2011.652180
Leritz, E. C., McGlinchey, R. E., Kellison, I., Rudolph, J. L., and Milberg, W. P. (2011). Cardiovascular disease risk factors and cognition in the elderly. Curr. Cardiovasc. Risk Rep. 5, 407–412. doi: 10.1007/s12170-011-0189-x
McAleese, K. E., Walker, L., Graham, S., Moya, E. L. J., Johnson, M., Erskine, D., et al. (2017). Parietal white matter lesions in Alzheimer’s disease are associated with cortical neurodegenerative pathology, but not with small vessel disease. Acta Neuropathol. 134, 459–473. doi: 10.1007/s00401-017-1738-2
McKhann, G. M., Knopman, D. S., Chertkow, H., Hyman, B. T., Jack, C. R. Jr., Kawas, C. H., et al. (2011). The diagnosis of dementia due to Alzheimer's disease: recommendations from the National Institute on Aging-Alzheimer's Association workgroups on diagnostic guidelines for Alzheimer's disease. Alzheimers Dement. 7, 263–269. doi: 10.1016/j.jalz.2011.03.005
Mori, S., Oishi, K., Jiang, H., Jiang, L., Li, X., Akhter, K., et al. (2006). Stereotaxic white matter atlas based on diffusion tensor imaging in an ICBM template. NeuroImage 40, 570–582. doi: 10.1016/j.neuroimage.2007.12.035
Nasreddine, Z. S., Phillips, N. A., Bedirian, V., Charbonneau, S., Whitehead, V., Collin, I., et al. (2005). The Montreal cognitive assessment, MoCA: a brief screening tool for mild cognitive impairment. J. Am. Geriatr. Soc. 53, 695–699. doi: 10.1111/j.1532-5415.2005.53221.x
Nir, T. M., Jahanshad, N., Villalon-Reina, J. E., Toga, A. W., Jack, C. R., Weiner, M. W., et al. (2013). Effectiveness of regional DTI measures in distinguishing Alzheimer's disease, MCI, and normal aging. Neuroimage Clin. 3, 180–195. doi: 10.1016/j.nicl.2013.07.006
Niwa, K., Carlson, G. A., and Iadecola, C. (2000). Exogenous a beta1–40 reproduces cerebrovascular alterations resulting from amyloid precursor protein overexpression in mice. J. Cereb. Blood Flow Metab. 20, 1659–1668. doi: 10.1097/00004647-200012000-00005
O’Sullivan, M., Lythgoe, D. J., Pereira, A. C., Summers, P. E., Jarosz, J. M., Williams, S. C., et al. (2002). Patterns of cerebral blood flow reduction in patients with schemic leukoaraiosis. Neurology 59, 321–326. doi: 10.1212/wnl.59.3.321
Pfefferbaum, A., and Sullivan, E. V. (2005). Disruption of brain white matter microstructure by excessive intracellular and extracellular fluid in alcoholism: evidence from diffusion tensor imaging. Neuropsychopharmacology 30, 423–432. doi: 10.1038/sj.npp.1300623
Reid, A. T., Van Norden, A. G., De, L. K. F., Van Oudheusden, L. J., Zwiers, M. P., Evans, A. C., et al. (2010). Patterns of cortical degeneration in an elderly cohort with cerebral small vessel disease. Hum. Brain Mapp. 31, 1983–1992. doi: 10.1002/hbm.20994
Reijmer, Y. D., Leemans, A., Caeyenberghs, K., Heringa, S. M., Koek, H. L., Biessels, G. J., et al. (2013). Disruption of cerebral networks and cognitive impairment in Alzheimer’s disease. Neurology 80, 1370–1377. doi: 10.1212/WNL.0b013e31828c2ee5
Rizvi, B., Narkhede, A., Last, B. S., Budge, M., Tosto, G., Manly, J. J., et al. (2018). The effect of white matter hyperintensities on cognition is mediated by cortical atrophy. Neurobiol. Aging 64, 25–32. doi: 10.1016/j.neurobiolaging.2017.12.006
Salminen, A., Haapasalo, A., Kauppinen, A., Kaarniranta, K., Soininen, H., and Hiltunen, M. (2015). Impaired mitochondrial energy metabolism in Alzheimer's disease: impact on pathogenesis via disturbed epigenetic regulation of chromatin landscape. Prog. Neurobiol. 131, 1–20. doi: 10.1016/j.pneurobio.2015.05.001
Scott, J. A., Braskie, M. N., Tosun, D., Maillard, P., Thompson, P. M., Weiner, M., et al. (2016). Cerebral amyloid is associated with greater white-matter hyperintensity accrual in cognitively normal older adults. Neurobiol. Aging 48, 48–52. doi: 10.1016/j.neurobiolaging.2016.08.014
Skinner, J., Carvalho, J. O., Potter, G. G., Thames, A., Zelinski, E., Crane, P. K., et al. (2012). The Alzheimer’s disease assessment scale-cognitive-plus (ADAS-cog-plus): an expansion of the ADAS-cog to improve responsiveness in MCI. Brain Imaging Behav. 6, 489–501. doi: 10.1007/s11682-012-9166-3
Smith, S. M., Jenkinson, M., Johansen-Berg, H., Rueckert, D., Nichols, T. E., Mackay, C. E., et al. (2006). Tract-based spatial statistics: voxelwise analysis of multi-subject diffusion data. NeuroImage 31, 1487–1505. doi: 10.1016/j.neuroimage.2006.02.024
Smith, S. M., Jenkinson, M., Woolrich, M. W., Beckmann, C. F., Behrens, T. E., Johansen-Berg, H., et al. (2004). Advances in functional and structural MR image analysis and implementation as FSL. NeuroImage 23, S208–S219. doi: 10.1016/j.neuroimage.2004.07.051
Tuladhar, A. M., Reid, A. T., Shumskaya, E., De Laat, K. F., Van Norden, A. G., Van Dijk, E. J., et al. (2015). Relationship between white matter hyperintensities, cortical thickness, and cognition. Stroke 46, 425–432. doi: 10.1161/STROKEAHA.114.007146
Vipin, A., Foo, H. J., Lim, J. K., Chander, R. J., Yong, T. T., Ng, A. S. L., et al. (2018). Regional white matter Hyperintensity influences Grey matter atrophy in mild cognitive impairment. J. Alzheimers Dis. 66, 533–549. doi: 10.3233/JAD-180280
Vipin, A., Wong, B. Y. X., Kumar, D., Low, A., Ng, K. P., and Kandiah, N. (2021). Association between white matter hyperintensity load and grey matter atrophy in mild cognitive impairment is not unidirectional. Aging (Albany NY) 13, 10973–10988. doi: 10.18632/aging.202977
Wang, Y., Yang, Y., Wang, T., Nie, S., Yin, H., and Liu, J. (2020). Correlation between white matter hyperintensities related gray matter volume and cognition in cerebral small vessel disease. J. Stroke Cerebrovasc. Dis. 29:105275. doi: 10.1016/j.jstrokecerebrovasdis.2020.105275 Epub 2020 Sep 6
Weintraub, S., Wicklund, A. H., and Salmon, D. P. (2012). The neuropsychological profile of Alzheimer disease. Cold Spring Harb. Perspect. Med. 2:a006171. doi: 10.1101/cshperspect.a006171
Whitwell, J. L., Dickson, D. W., Murray, M. E., Weigand, S. D., Tosakulwong, N., Senjem, M. L., et al. (2012). Neuroimaging correlates of pathologically-defined atypical Alzhefimer’s disease: a case-control study. Lancet Neurol. 11, 868–877. doi: 10.1016/S1474-4422(12)70200-4
Zatorre, R. J., Fields, R. D., and Johansen-Berg, H. (2012). Plasticity in gray and white: neuroimaging changes in brain structure during learning. Nat. Neurosci. 15, 528–536. doi: 10.1038/nn.3045
Zhao, Q., Lv, Y., Zhou, Y., Hong, Z., and Guo, Q. (2012). Short-term delayed recall of auditory verbal learning test is equivalent to long-term delayed recall for identifying amnestic mild cognitive impairment. PLoS One 7:e51157. doi: 10.1371/journal.pone.0051157
Zhao, D. Q., Wang, Z. W., Cheng, Y., Yuan, Z., Rene, F., Liu, H., et al. (2019). A DTI study of leukoaraiosis and the differential diagnosis between leukoaraiosis and acute lacunar infarction. CNS Neurosci. Ther. 25, 1064–1067. doi: 10.1111/cns.13191. Epub 2019 Jul 11
Zhou, B., Zhao, Q., Kojima, S., Ding, D., Higashide, S., Nagai, Y., et al. (2019). One-year outcome of Shanghai mild cognitive impairment cohort study. Curr. Alzheimer Res. 16, 156–165. doi: 10.2174/1567205016666181128151144
Keywords: Alzheimer’s disease, white matter fiber tracts, white matter hyperintensity, grey matter atrophy, cognition
Citation: Yi F, Wang J, Lin M, Li B, Han S, Wang S, Jin Y, Hu N, Chen Y and Shang X (2024) Correspondence between white matter hyperintensities and regional grey matter volumes in Alzheimer's disease. Front. Aging Neurosci. 16:1429098. doi: 10.3389/fnagi.2024.1429098
Edited by:
Vijay Venkatraman, The University of Melbourne, AustraliaReviewed by:
Jose Bernal, Otto von Guericke University Magdeburg, GermanyYongxia Zhou, University of Southern California, United States
Copyright © 2024 Yi, Wang, Lin, Li, Han, Wang, Jin, Hu, Chen and Shang. This is an open-access article distributed under the terms of the Creative Commons Attribution License (CC BY). The use, distribution or reproduction in other forums is permitted, provided the original author(s) and the copyright owner(s) are credited and that the original publication in this journal is cited, in accordance with accepted academic practice. No use, distribution or reproduction is permitted which does not comply with these terms.
*Correspondence: Xiuli Shang, Znl5aWppYW5vMjAyMEAxNjMuY29t