
94% of researchers rate our articles as excellent or good
Learn more about the work of our research integrity team to safeguard the quality of each article we publish.
Find out more
ORIGINAL RESEARCH article
Front. Aging Neurosci., 30 August 2023
Sec. Cellular and Molecular Mechanisms of Brain-aging
Volume 15 - 2023 | https://doi.org/10.3389/fnagi.2023.1214932
This article is part of the Research TopicMulti-Omics Studies on Aging and Age-related DiseasesView all 5 articles
 Ruocheng Dong1
 Qiongshi Lu2
 Hyunseung Kang2Ivonne Suridjan3Gwendlyn Kollmorgen4
 Norbert Wild4
 Yuetiva Deming1,5,6Carol A. Van Hulle5,6Rozalyn M. Anderson5,7
 Henrik Zetterberg8,9,10,11,12
 Kaj Blennow8,9
 Cynthia M. Carlsson5,6,7
 Sanjay Asthana5,6,7
 Sterling C. Johnson5,6,7,13Corinne D. Engelman1,6,13*
Introduction: Metabolomics technology facilitates studying associations between small molecules and disease processes. Correlating metabolites in cerebrospinal fluid (CSF) with Alzheimer’s disease (AD) CSF biomarkers may elucidate additional changes that are associated with early AD pathology and enhance our knowledge of the disease.
Methods: The relative abundance of untargeted metabolites was assessed in 161 individuals from the Wisconsin Registry for Alzheimer’s Prevention. A metabolome-wide association study (MWAS) was conducted between 269 CSF metabolites and protein biomarkers reflecting brain amyloidosis, tau pathology, neuronal and synaptic degeneration, and astrocyte or microglial activation and neuroinflammation. Linear mixed-effects regression analyses were performed with random intercepts for sample relatedness and repeated measurements and fixed effects for age, sex, and years of education. The metabolome-wide significance was determined by a false discovery rate threshold of 0.05. The significant metabolites were replicated in 154 independent individuals from then Wisconsin Alzheimer’s Disease Research Center. Mendelian randomization was performed using genome-wide significant single nucleotide polymorphisms from a CSF metabolites genome-wide association study.
Results: Metabolome-wide association study results showed several significantly associated metabolites for all the biomarkers except Aβ42/40 and IL-6. Genetic variants associated with metabolites and Mendelian randomization analysis provided evidence for a causal association of metabolites for soluble triggering receptor expressed on myeloid cells 2 (sTREM2), amyloid β (Aβ40), α-synuclein, total tau, phosphorylated tau, and neurogranin, for example, palmitoyl sphingomyelin (d18:1/16:0) for sTREM2, and erythritol for Aβ40 and α-synuclein.
Discussion: This study provides evidence that CSF metabolites are associated with AD-related pathology, and many of these associations may be causal.
The neuropathological changes of Alzheimer’s disease (AD) consist of extracellular amyloid-β (Aβ) plaques and intracellular neurofibrillary tangles of hyperphosphorylated tau proteins in the brain (Anoop et al., 2010). Well-established core biomarkers that reflect AD pathology and show promising performance in evaluating AD risk and diagnosing AD are the 42 amino acid form Aβ (Aβ42), the ratio of Aβ42/40, phosphorylated tau (P-tau), and total tau (T-tau) in the cerebrospinal fluid (CSF) (Blennow et al., 2012). However, it has been suggested that other pathophysiology such as neuroinflammation through glial activation and neuronal and synaptic degeneration also contribute to symptomatic AD, and CSF biomarkers of these may provide valuable information about disease progression (Blennow et al., 2012). Thus, the NeuroToolKit (NTK), a panel of automated CSF immunoassays, was introduced to complement the established core AD biomarkers (Hulle et al., 2021). The NTK panel includes S100 calcium-binding protein B (S100b), chitinase-3-like protein 1 (YKL-40), and glial fibrillary acidic protein (GFAP) as markers of astrocyte activation; soluble triggering receptor expressed on myeloid cells 2 (sTREM2) and interleukin-6 (IL-6) as markers of microglial activation and inflammation; and neurofilament light (NfL), neurogranin, and α-synuclein as markers of axonal injury and synaptic dysfunction (ALZFORUM, 2019).
Untargeted metabolomics technology is a promising approach that can simultaneously identify and quantify a large number of small molecules (<1,500 Da, e.g., lipids) in a biological sample (Hasin et al., 2017). Previous research has evaluated the potential application of metabolites as biomarkers for AD and shown that metabolomic changes in the human brain and CSF were associated with AD status and AD pathological alterations (Koal et al., 2015; Jacobs et al., 2019; van der Velpen et al., 2019; Morrow et al., 2021; Dong et al., 2022; Liang et al., 2022). For example, Koal et al. (2015) identified eight metabolites that were significantly increased in the CSF samples with AD-like pathology including an acylcarnitine (C3), two sphingomyelins [SM (d18:1/18:0) and SM (d18:1/18:1)], and five glycerophospholipids (PC aa C32:0, PC aa C34:1, PC aa C36:1, PC aa C38:4, and PC aa C38:6). Recent studies focused on 12 CSF sphingomyelin metabolites (SM) (Morrow et al., 2021) or derived principal components from 308 CSF metabolites (Dong et al., 2022) also suggested evidence of an association between CSF metabolites and AD biomarkers, e.g., SM (d18:1/14:0, d16:1/16:0) and p-tau, NFL, and α -synuclein. However, no studies have examined associations between the full untargeted CSF metabolome and a broad panel of biomarkers such as the NTK panel. Thus, our study aims to link CSF metabolites with established and developing AD biomarkers with the goals of (1) identifying CSF metabolites that are individually associated with the CSF NTK biomarkers and (2) conducting Mendelian randomization (MR) to determine if the CSF metabolites significantly associated with NTK biomarkers are likely to be in the causal pathway instead of simply changing with, or as a result of, AD biomarker changes.
The Wisconsin Registry for Alzheimer’s Prevention (WRAP) began recruitment in 2001 as a prospective cohort study, with initial follow-up 4 years after baseline and subsequent ongoing follow-up every 2 years. WRAP is comprised of initially cognitively-unimpaired, asymptomatic, middle-aged (between 40 and 65) adults enriched for parental history of clinical AD (Johnson et al., 2018). At each visit, the participants undergo comprehensive medical and cognitive evaluations. Additional details of the study design and methods of WRAP have been described previously (Johnson et al., 2018). From the WRAP cohort, we identified 161 self-reported non-Hispanic white individuals with both longitudinal CSF biomarker and metabolomic data available from 2010 to 2017. The sample size for other racial/ethnic groups was too small (n < 10) to include in the analyses.
The Wisconsin Alzheimer’s Disease Research Center’s (ADRC) clinical core cohorts started in 2009 and are comprised of well-characterized participants who undergo cognitive testing and physical exams every 2 years (Bettcher et al., 2018). The Wisconsin ADRC has a cohort of initially cognitively-unimpaired, asymptomatic middle-aged (between 45 and 65) adults with a similar study design to WRAP [the Investigating Memory in Preclinical AD-Causes and Treatments (IMPACT) cohort] (Racine et al., 2016; Darst et al., 2017; Vogt et al., 2018). From the IMPACT cohort, we identified 154 self-reported non-Hispanic white participants with cross-sectional CSF biomarker and metabolomic data available between 2010 to 2017. As with WRAP, the sample size for other racial/ethnic groups was too small (n < 10) to include in the analyses.
This study was conducted with the approval of the University of Wisconsin Institutional Review Board, and all participants provided signed informed consent before participation.
Fasting CSF samples were collected via lumbar puncture using a Sprotte 25- or 24-gauge spinal needle at the L3/4 or L4/5 interspace with gentle extraction into polypropylene syringes. More details can be found in the previous study (Darst et al., 2017). The CSF collection for WRAP and the Wisconsin ADRC followed the same protocol, and the lumbar puncture for both studies was performed by the same group of well-trained individuals.
All CSF samples were batched together and assayed for the NTK biomarkers at the Clinical Neurochemistry Laboratory, University of Gothenburg, using the same lot of reagents, under strict quality control procedures. The immunoassays of Elecsys® Aβ(1–42), P-tau(181P), and T-tau, as well as S100b and IL-6, were performed on a cobas e 601 analyzer (Hulle et al., 2021). The remaining NTK panel was assayed on a cobas e 411 analyzer including Aβ(1–40), α-synuclein, GFAP, YKL-40, sTREM2, NfL, and neurogranin (Hulle et al., 2021).
Cerebrospinal fluid metabolomic analyses and quantification were performed in one batch by Metabolon (Durham, NC) using an untargeted approach, based on Ultrahigh Performance Liquid Chromatography-Tandem Mass Spectrometry platform (UPLC-MS/MS) (Evans et al., 2014). Details of the metabolomic profiling regarding sample preparation, metabolite extraction, derivatization, separation and detection, and raw data processing were described in an earlier study (Darst et al., 2019).
A total of 412 CSF metabolites were identified and quality control procedures were performed. First, 46 metabolites missing for at least 80% of the individuals were excluded. Then the values for each of the remaining metabolites were scaled so that the median equaled 1. Two metabolites with an interquartile range (IQR) of zero were excluded and no metabolites had zero variability between individuals. Log10 transformation was applied to normalize the data. After quality control, 269 metabolites with known biochemical names remained for this investigation. The missing percentage of each metabolite in WRAP and Wisconsin ADRC is available in Supplementary Table 1.
In the WRAP participants, DNA was extracted from whole blood using the PUREGENE® DNA Isolation Kit, and the concentrations were quantified using the Invitrogen™ Quant-iT™ PicoGreen™ dsDNA Assay Kit. More details can be found in the previous study (Darst et al., 2019). Genotyping data were generated by the University of Wisconsin Biotechnology Center using the Illumina Multi-Ethnic Genotyping Array for 1,340 individuals originally. Quality control procedures have been described previously (Darst et al., 2019). Briefly, samples and variants with missingness >5% and samples with inconsistent genetic and self-reported sex were removed. The resulting 1,198 samples from European ancestry individuals and 898,220 variants were then imputed using the Michigan Imputation Server and the HRC reference panel. Variants with a low imputation quality score (R2 < 0.8), with a low minor allele frequency (MAF) (<0.001), or out of HWE were removed. The genetic ancestry was assessed by using Principal Components Analysis in Related Samples (PC-AiR) because of the sibling relationships present in the WRAP cohort.
Genetic data in the Wisconsin ADRC were generated from DNA extracted from blood samples at baseline and genotyped with either the Infinium OmniExpressExome-8 Kit or the Infinium Global Screening Array-24 Kit. Genetic data for the Wisconsin ADRC underwent the same quality control (QC) and imputation as the WRAP data except samples and SNPs missing in >2% were excluded and HWE threshold was p < 1e-6 due to differences in sample sizes and the number of SNPs between the two cohorts.
A metabolome-wide association study (MWAS) was conducted in the WRAP cohort between 269 individual CSF metabolites and 13 CSF NTK biomarkers using linear mixed-effects regression models with random intercepts to account for repeated measures and family relationships (10 families with two or more siblings) and fixed effects for age at CSF collection, sex, and years of education. Replication of each CSF metabolite significantly associated with one or more biomarkers in WRAP was then conducted in the Wisconsin ADRC cohort using linear regression adjusting for the same covariates. Both Bonferroni and false discovery rate (FDR) methods were used to correct the p-values for multiple testing; the FDR corrected q value was used to determine statistical significance in each analysis. Potential functional pathways of the replicated significant metabolites were identified by pathway analyses using the web-based software Metabo-analyst 5.0 (Pang et al., 2021) based on the Kyoto Encyclopedia of Genes and Genomes (KEGG) Homo sapiens pathway. The hypergeometric test and relative-betweenness centrality were employed to evaluate the pathway importance, and the pathways with an impact score ≥0.1 were selected.
The variance for each biomarker explained by its corresponding significant metabolites was evaluated using r2 in the combined and imputed cohorts of WRAP and the Wisconsin ADRC. For this analysis, we only included the first available measures of independent participants from WRAP. Since the number of significant metabolites for each biomarker was large and some of the metabolites were highly correlated, elastic net regression (Zou and Hastie, 2005) was employed to select the important independent metabolites. Then the r2 of elastic net-selected metabolites was re-calculated. For each biomarker, we fit three types of models, the (1) base model, which only included the demographics of age, sex, years of education, and indicator of cohort, (2) metabolite model, which included the demographics in the base model plus all the replicated significant metabolites, and (3) elastic net-selected metabolite model, which contained the demographics and elastic-net-selected metabolites.
In our analysis, we employed Mendelian randomization (MR) (Sanderson et al., 2022) which uses genetic variation as an instrumental variable to assess the causal relationship about whether metabolites influence the CSF NTK biomarkers. The genome-wide significant SNPs (p < 5 × 10⁻⁸) from a previous genome-wide meta-analysis of CSF metabolites (Panyard et al., 2021) were extracted for each elastic net-selected metabolite (5,863 SNPs for 52 metabolites). These SNPs (or the top 100 SNPs if there were more than 100 genome-wide significant SNPs for a metabolite) were used as instrumental variables (IV) for the metabolite. Then we conducted one-sample MR analysis for each elastic net-selected metabolite-NTK biomarker association pair in the combined WRAP and Wisconsin ADRC cohort by using the summary statistics and individual-level genetic data of extracted SNPs. For each MR test, we first checked the strength of the IVs using F statistics. Typically, an IV with an F statistic greater than 10 is considered to be strong, while instruments with F statistics below 10 are considered to be weak (Stock et al., 2002). Next, the estimated (or less confounded) beta and p-values for the effect of the metabolite on the NTK biomarker were calculated using the two-stage least squares method if the IVs were strong and correlated, but using the limited information maximum likelihood (LIML) for correlated IVs that were relatively weak (Chao and Swanson, 2005; Wooldridge, 2010). The confidence intervals (CI) of the point estimates from both LIML and another conditional likelihood ratio (CLR) method, which is robust to weak IVs (Moreira, 2003), were compared and only significant results with CIs in the same direction and with a similar range of effect size between these two methods were considered as evidence of a causal effect. The Bonferroni corrected p-value < 0.05 based on the number of all MR tests performed was used to determine significance. The MR analysis was conducted using the R package “ivmodel” (Kang et al., 2021).
The genetic data have been uploaded to the National Institute on Aging Genetics of Alzheimer’s Disease Data Storage Site (NIAGADS) and metabolomic data are being uploaded to Accelerating Medicines Partnership Program for Alzheimer’s Disease (AMP-AD).
Characteristics of the WRAP and Wisconsin ADRC participants can be found in Table 1. In the WRAP cohort, just over one third of the participants had one CSF sample, almost one third had two CSF samples collected approximately 2 years apart, and just over one third had three CSF samples collected approximately every 2 years. The first available measures were used to calculate the summary participant characteristics. In the Wisconsin ADRC cohort, only one sample was available for each participant. In both studies, the CSF was collected between 2010 and 2017. Among 161 WRAP participants, the mean age and education level were 62.1 and 16.2 years, respectively. The mean age and years of education in the Wisconsin ADRC were 58.1 and 16.2, respectively. Females comprised 65.2% of WRAP participants and 68.8% of the Wisconsin ADRC. In the longitudinal WRAP cohort, 80.1, 16.8, and 3.1% of participants were cognitively unimpaired stable, unimpaired declining, or had clinical MCI, respectively. Four participants progressed from cognitively unimpaired stable to unimpaired declining by the last CSF collection 2–4 years later. All participants in the Wisconsin ADRC were cognitively unimpaired stable. The mean values of each biomarker are also listed in Table 1.
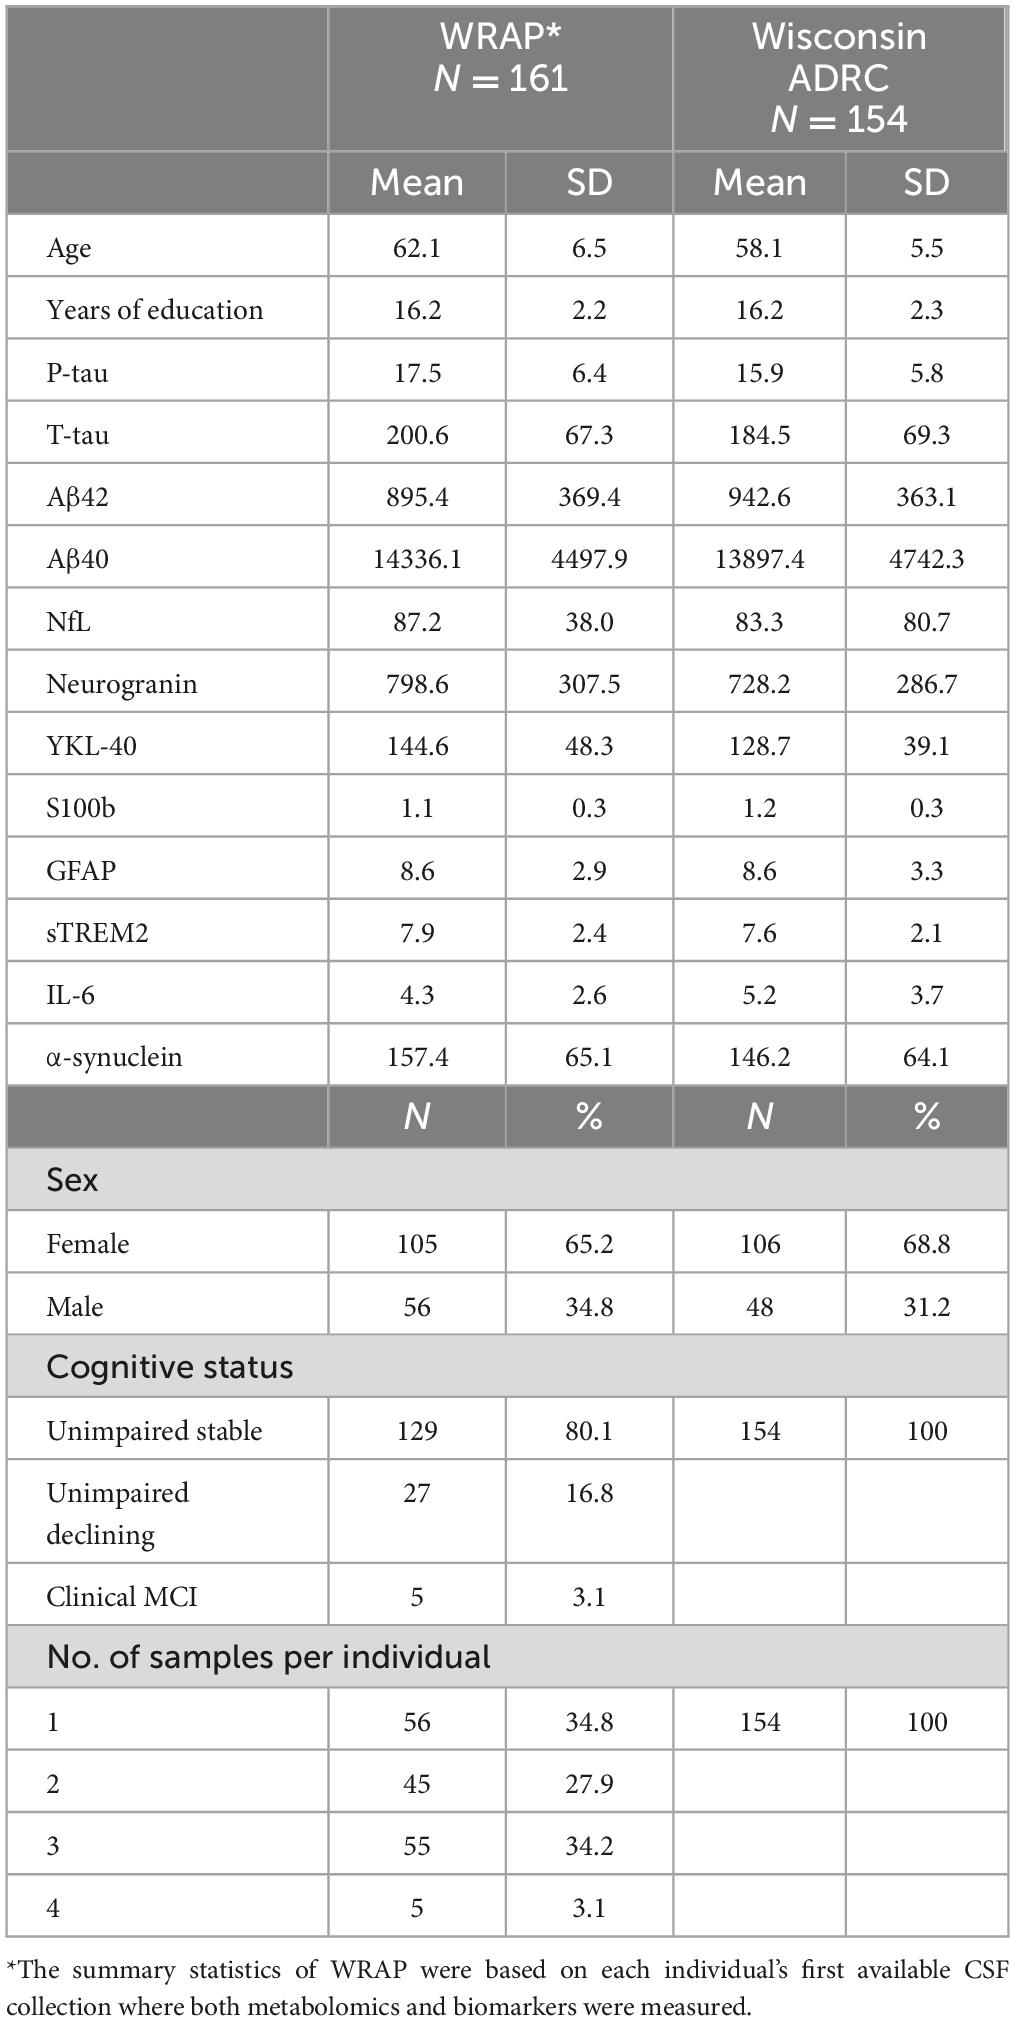
Table 1. Sample characteristics of WRAP and Wisconsin ADRC participants.
The significant MWAS results in WRAP and the Wisconsin ADRC are summarized in Figure 1. In WRAP, a large number of CSF metabolites reached the significance threshold after FDR correction (Figure 1A). 47 metabolites were associated with P-tau, 56 were associated with T-tau, 58 were associated with Aβ42, 80 were associated with Aβ40, 65 were associated with NfL, and 62 were associated with neurogranin. However, no metabolites were associated with the ratio of Aβ42/40 or IL-6. Many of the metabolites that were significant in WRAP were also significant in the Wisconsin ADRC (Figure 1B). For example, among 47 significant metabolites for P-tau in WRAP, 40 metabolites were also significant in the Wisconsin ADRC. Table 2 shows the replication results for the top 10 significant CSF metabolite-biomarker associations (if there were 10 or more significant metabolites) in the Wisconsin ADRC. For example, the top three metabolites associated with P-tau and T-tau were 1-palmitoyl-2-stearoyl-GPC (16:0/18:0), N-acetylneuraminate, and C-glycosyltryptophan. N-acetylneuraminate and 1,2-dipalmitoyl-GPC (16:0/16:0) were the top two metabolites associated with Aβ42 and Aβ40. The top three metabolites associated with NfL were N-acetylthreonine, N-acetylalanine, and beta-citrylglutamate. N-acetylneuraminate, C-glycosyltryptophan, and N6-succinyladenosine were the top three metabolites for neurogranin. N-acetylneuraminate, 1,2-dipalmitoyl-GPC (16:0/16:0), and stearoyl sphingomyelin (d18:1/18:0) were the top three metabolites for YKL40. Stearoyl sphingomyelin (d18:1/18:0), 1-stearoyl-2-docosahexaenoyl-GPC (18:0/22:6), and 1-palmitoyl-2-oleoyl-GPC (16:0/18:1) were the top three metabolites associated with S100b. Only six metabolites were associated with GFAP, and the top three were 1,2-dipalmitoyl-GPC (16:0/16:0), 1-palmitoyl-2-stearoyl-GPC (16:0/18:0), and beta-citrylglutamate. For sTREM2, the top metabolites were stearoyl sphingomyelin (d18:1/18:0), 1,2-dipalmitoyl-GPC (16:0/16:0), and palmitoyl sphingomyelin (d18:1/16:0). Finally, for α-synuclein, the top three metabolites were 1-palmitoyl-2-stearoyl-GPC (16:0/18:0), 1,2-dipalmitoyl-GPC (16:0/16:0), and N-acetylneuraminate. The full results of WRAP and the Wisconsin ADRC can be found in Supplementary Tables 2–25. The association patterns between significant CSF metabolites and NTK biomarkers are provided in the Figure 2. The summary of the number of significant associations and the name of NTK biomarkers that were replicated in the Wisconsin ADRC are presented in Supplementary Table 26. Most of the significant metabolites were lipids, amino acids, and carbohydrates. For example, the lipid, 1,2-dipalmitoyl-GPC (16:0/16:0), the amino acid, beta-citrylglutamate, and the carbohydrate N-acetylneuraminate were strongly associated with almost every CSF NTK biomarker of AD. On the contrary, amino acids like kynurenate and proline were only significantly associated with α-synuclein.
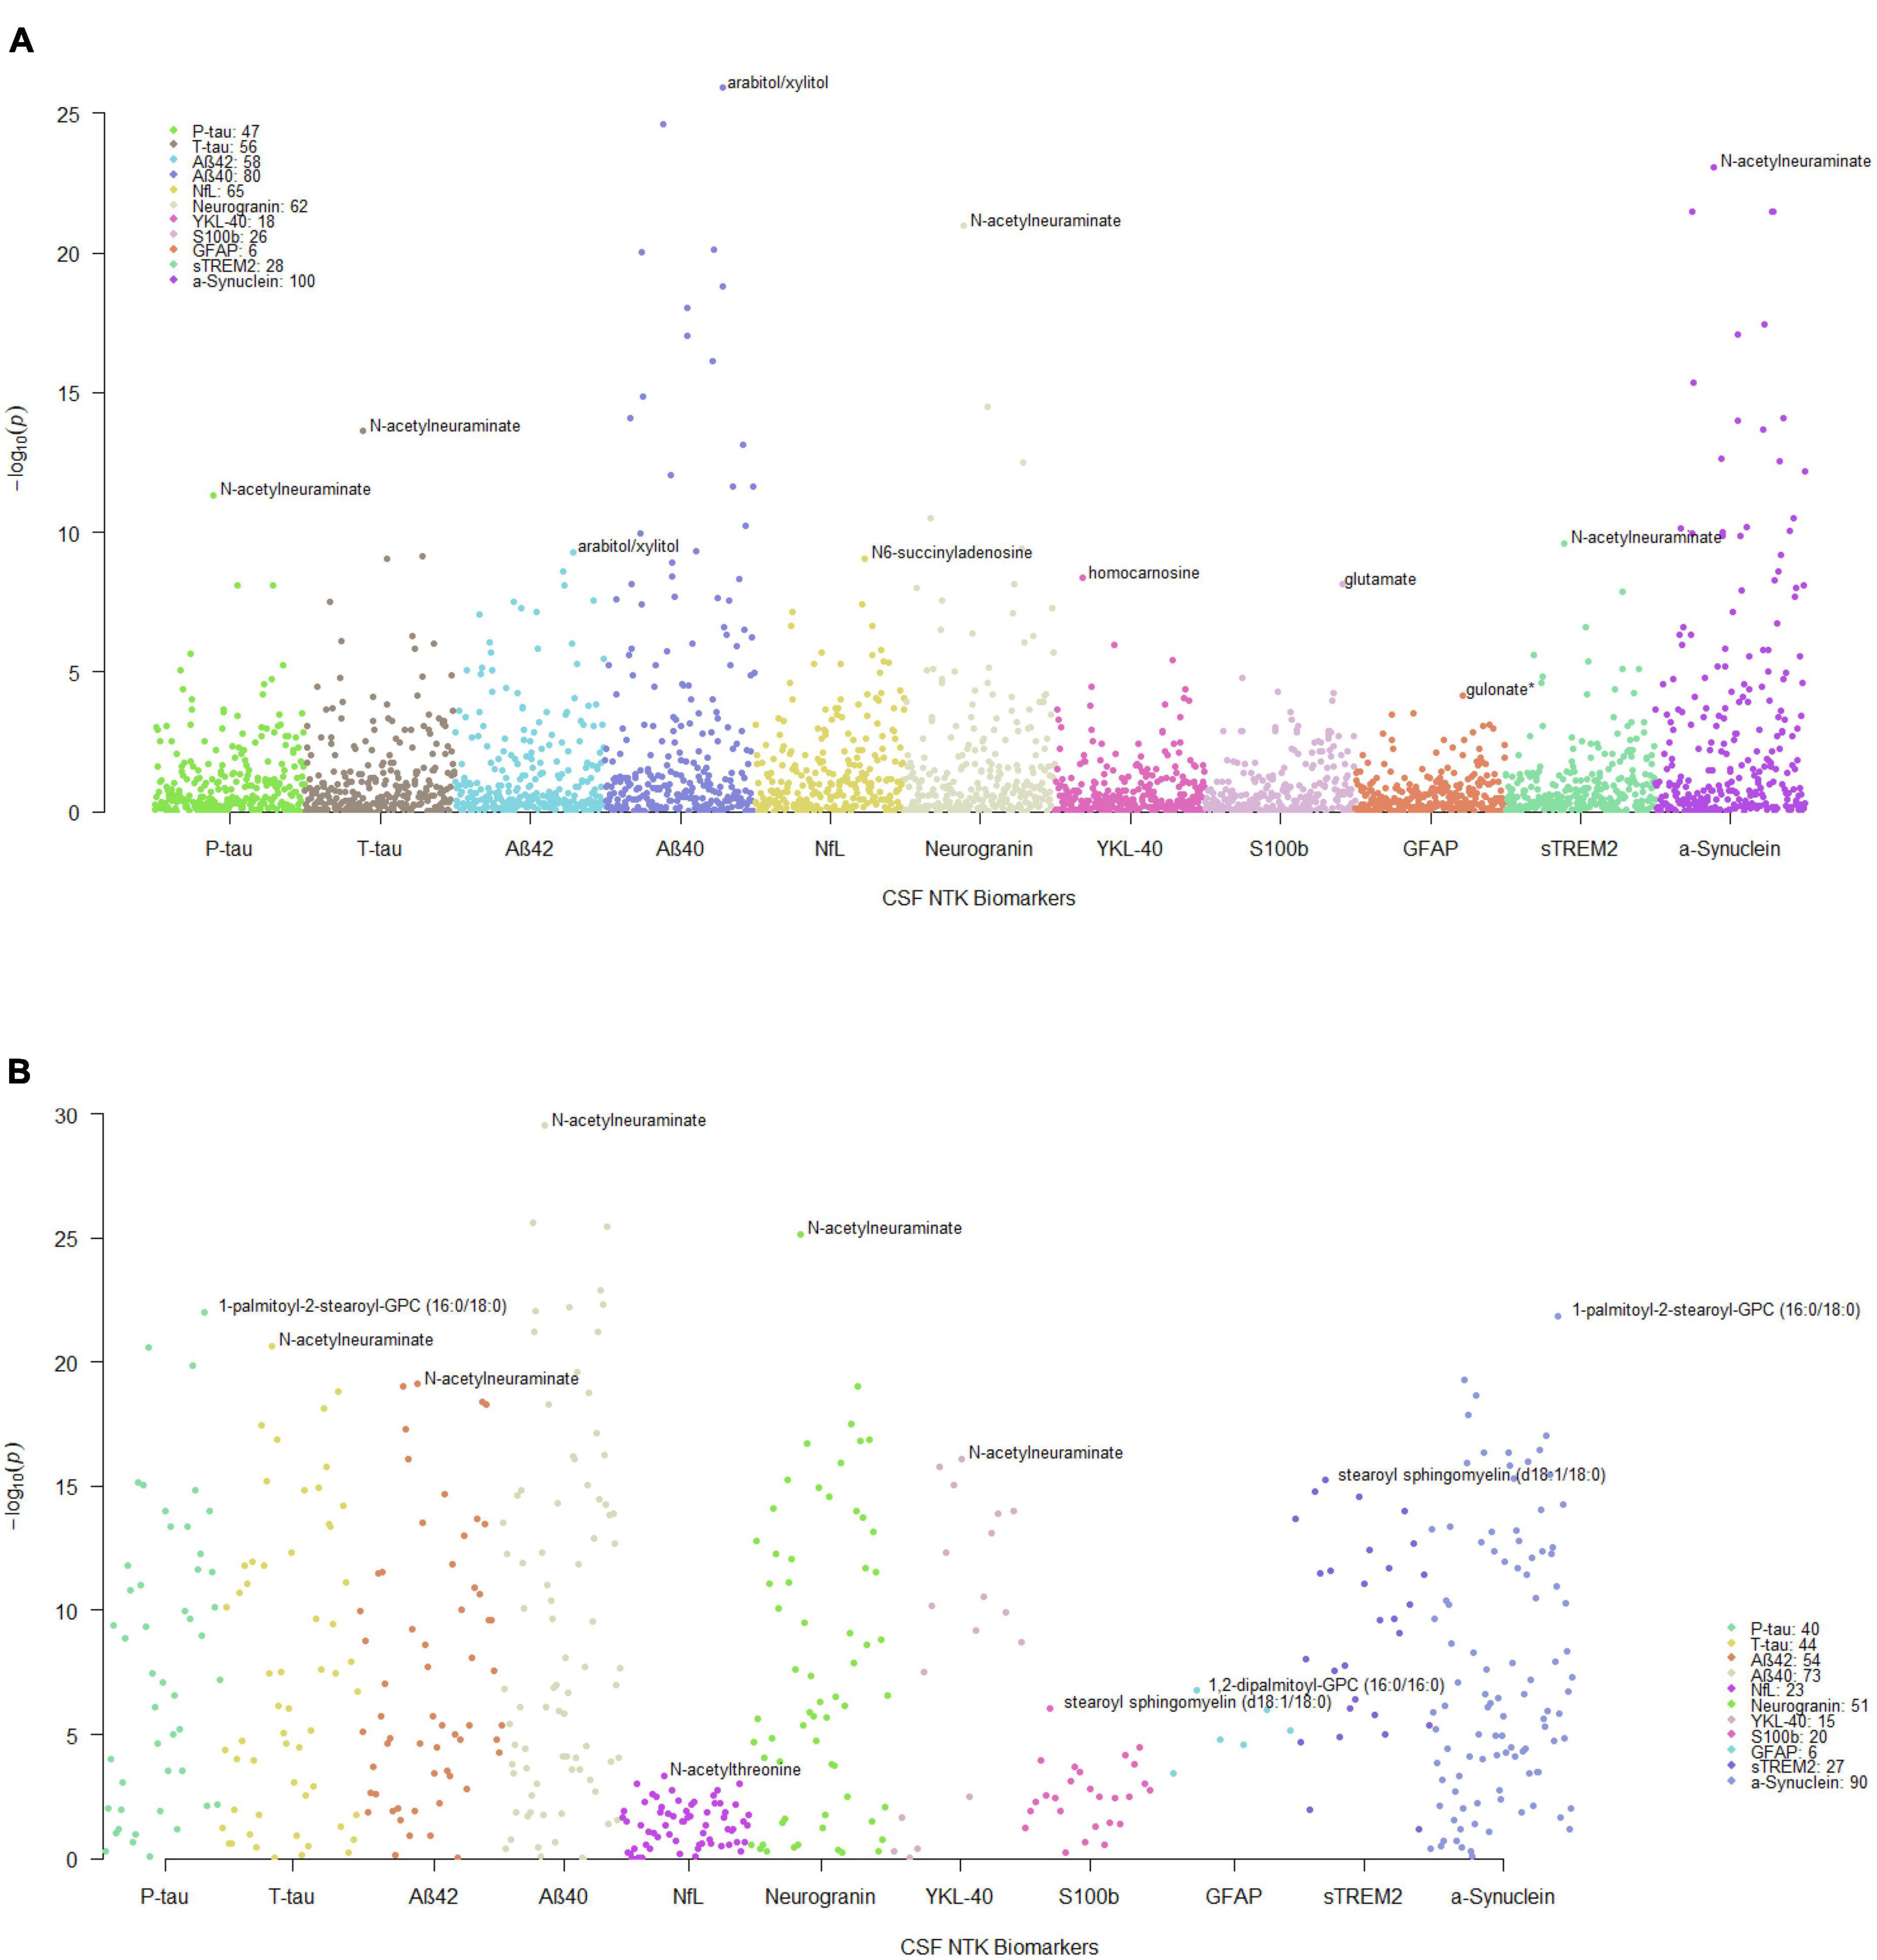
Figure 1. Manhattan plots of MWAS results between CSF metabolites and CSF NTK biomarkers. Each dot represents a metabolite and the different colors represent the CSF NTK biomarkers (x-axis) in (A) WRAP and (B) the Wisconsin ADRC (only significant metabolites after FDR correction in WRAP were included). The –log10(p-value) is shown on the y-axis. The legend box indicates the number of metabolites that were significant after FDR correction for each NTK biomarker. The annotated metabolites in the figures represent the most significant metabolite associated with each NTK biomarker.
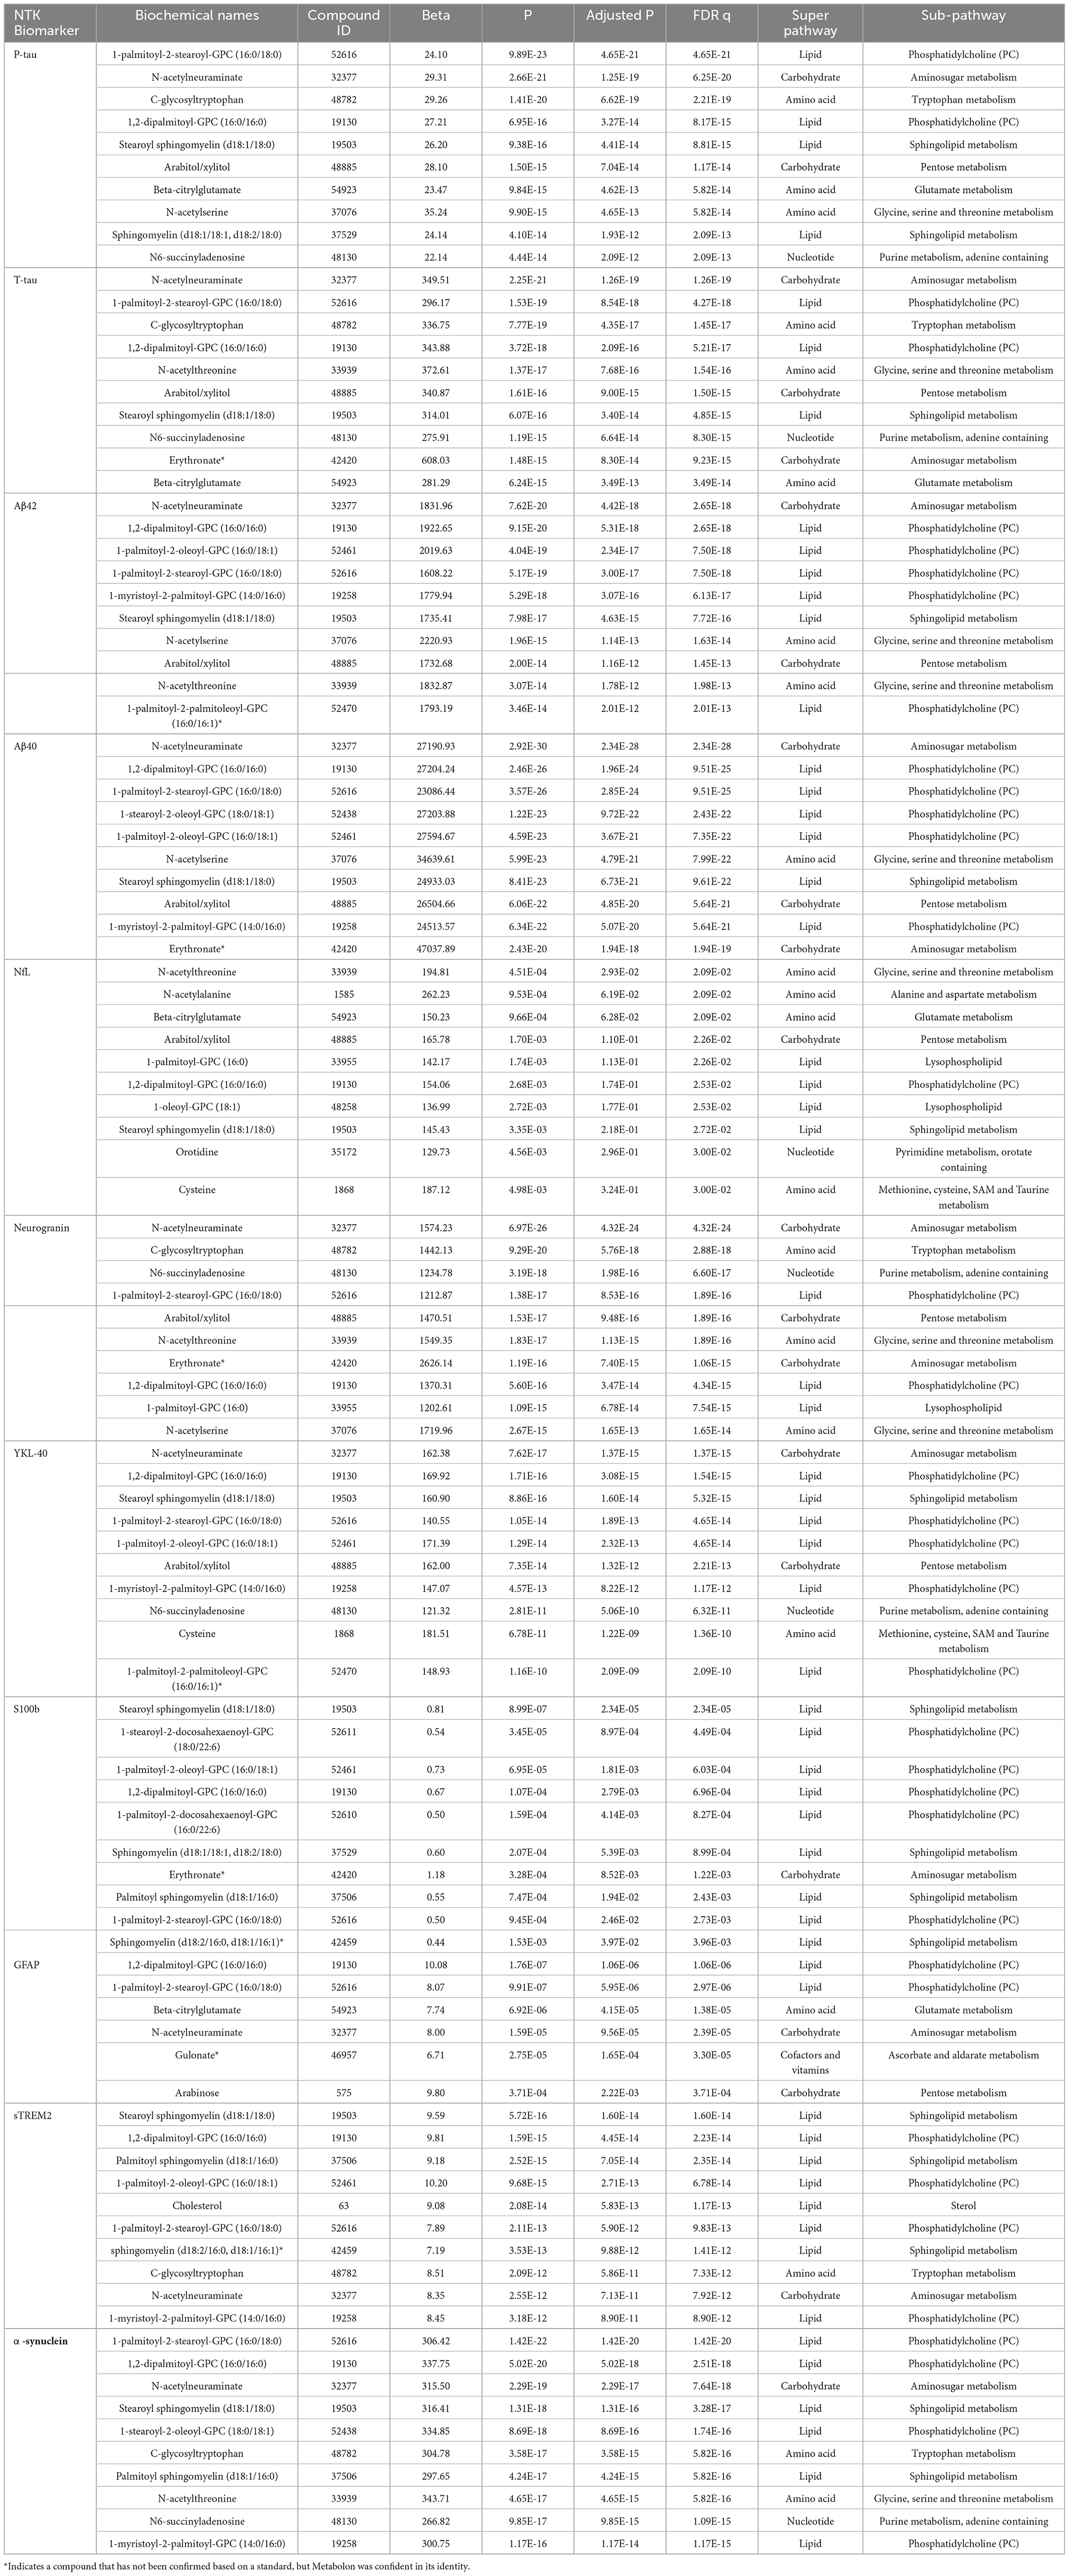
Table 2. Top 10 significant CSF metabolites associated with each NTK biomarker in WRAP and replicated in the Wisconsin ADRC.
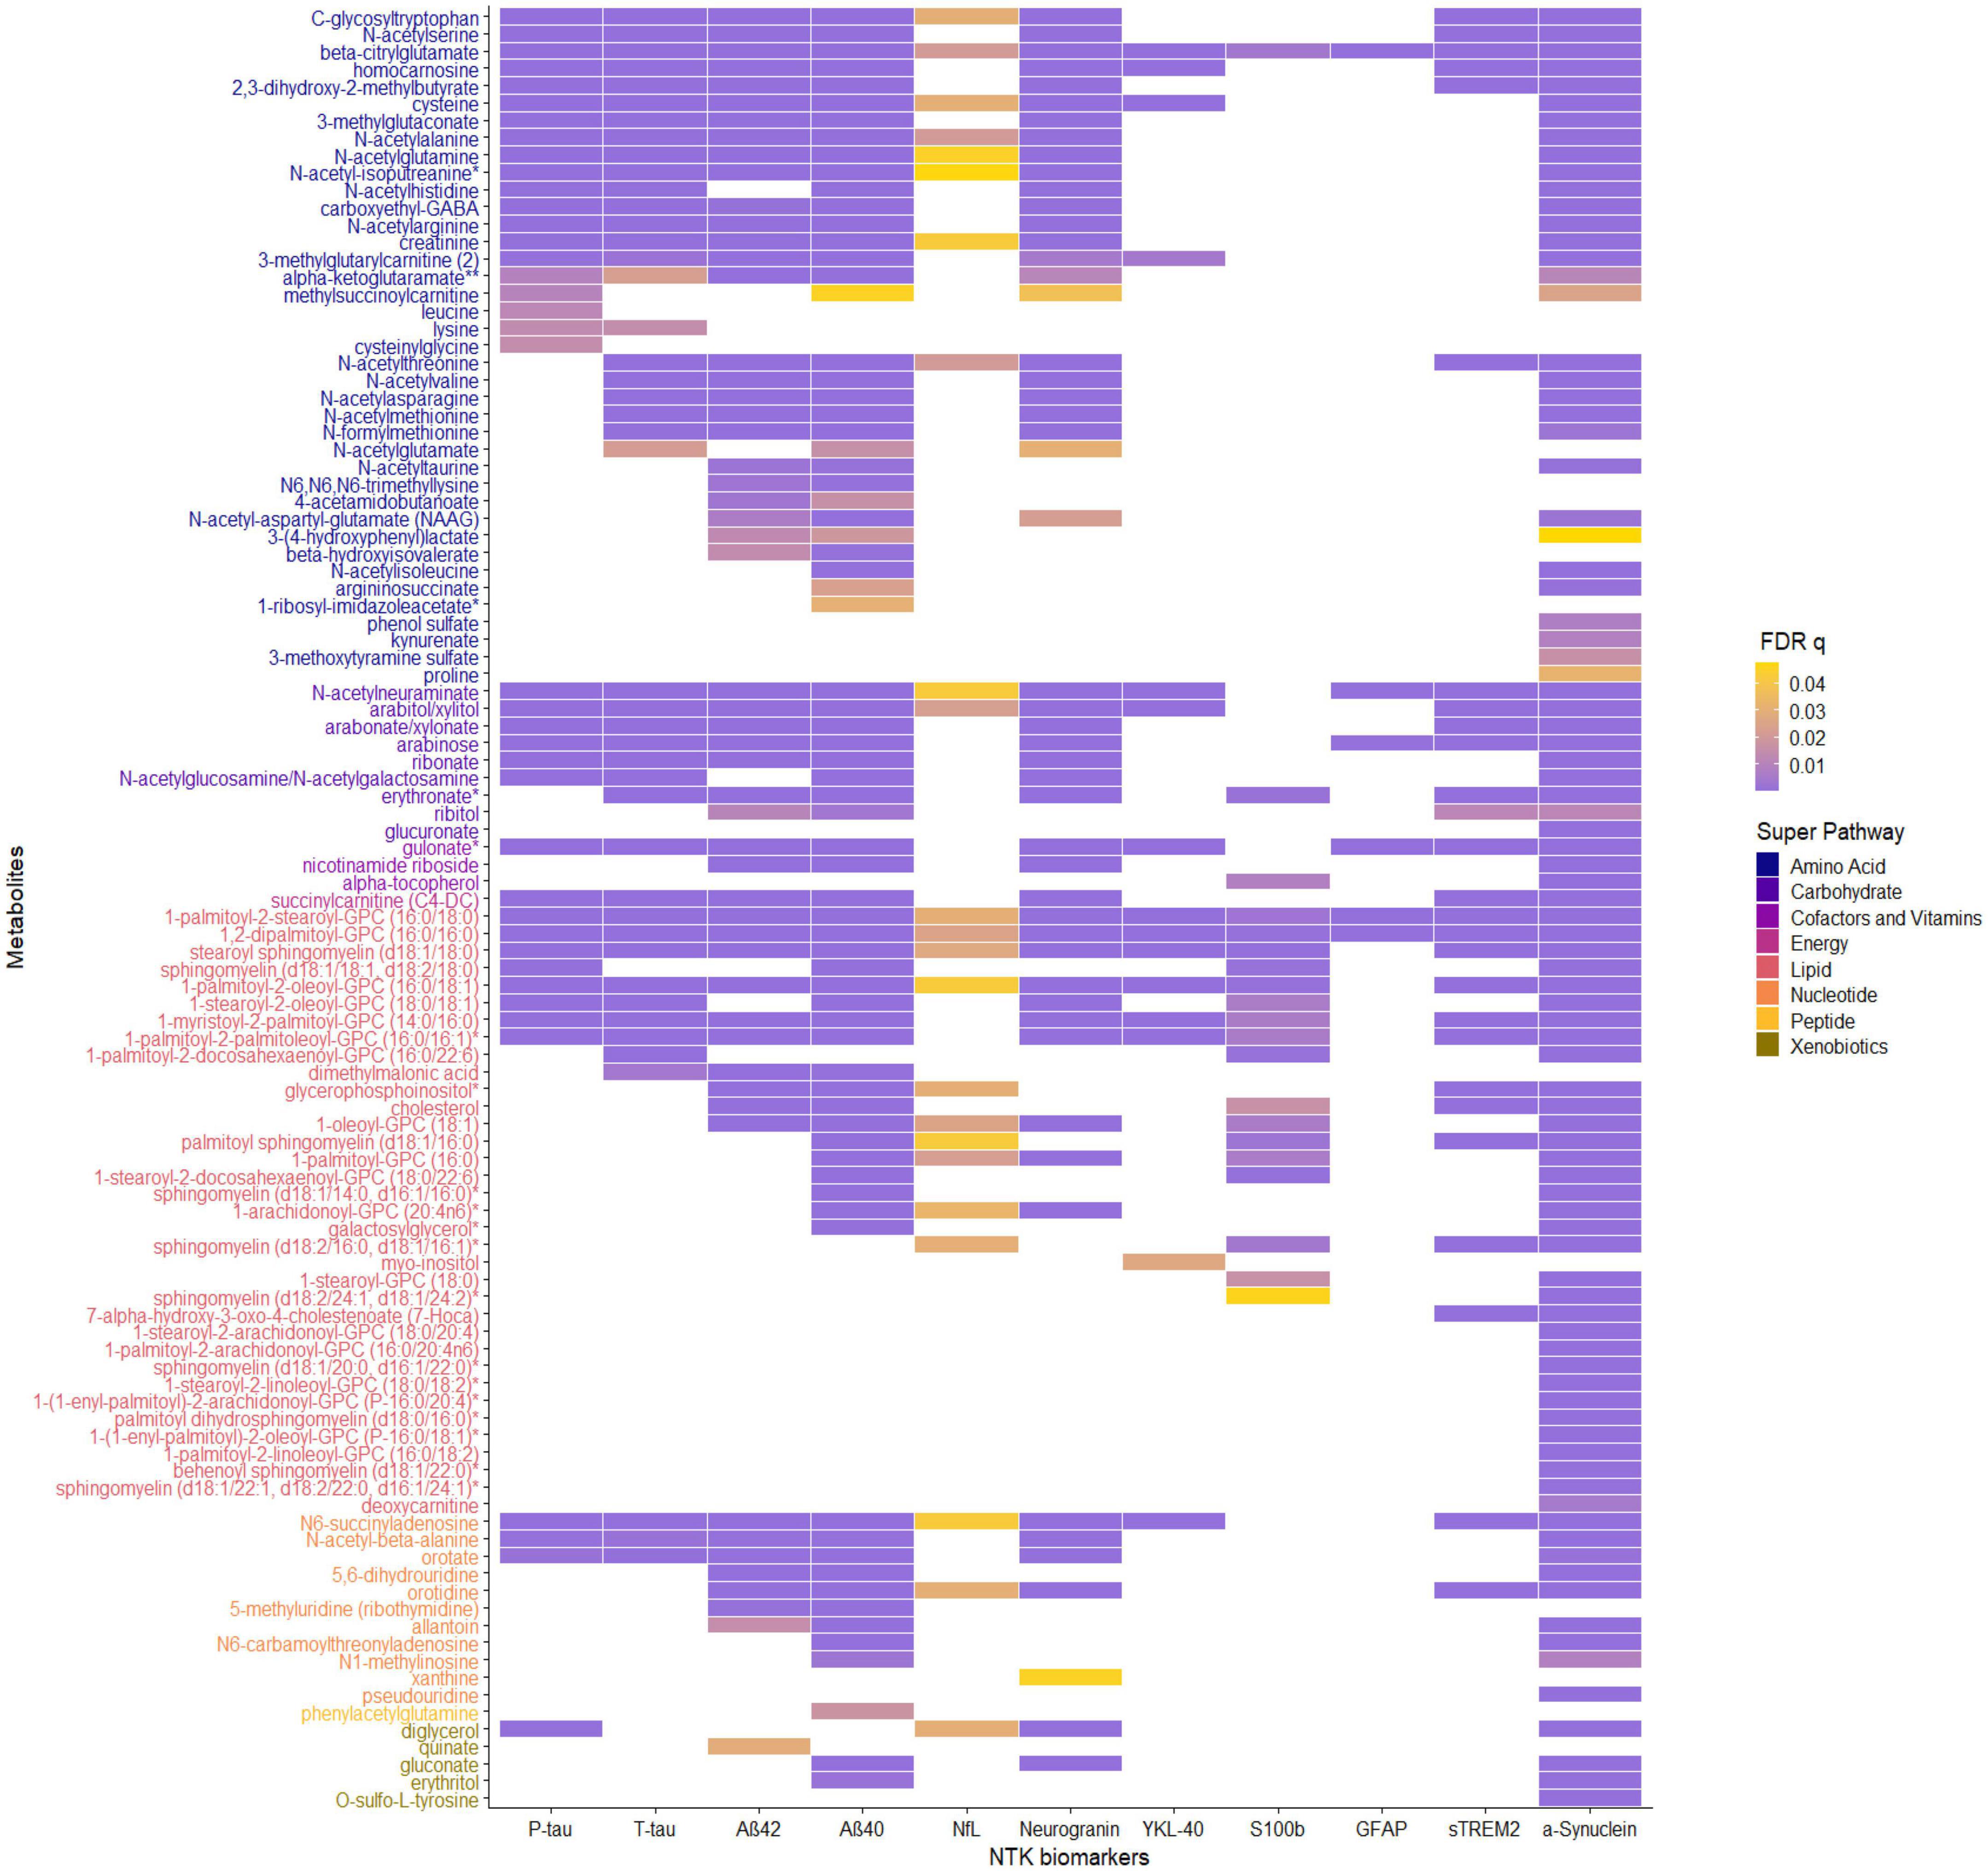
Figure 2. The association patterns between significant CSF metabolites and CSF NTK biomarkers in Wisconsin-ADRC. Each cell represents the association of a CSF metabolite with a biomarker. The color scale indicates the magnitude of the FDR q-values. The metabolites are also grouped and colored based on their super pathway.
The functional pathways for replicated significant metabolites with known human metabolome database (HMDB) IDs for each CSF NTK biomarker are shown in Supplementary Table 27. Two significant metabolites, 1,2-dipalmitoyl-GPC (16:0/16:0) and 1-oleoyl-GPC (18:1), were enriched in the glycerophospholipid metabolism pathway for most biomarkers. Other pathways such as pyrimidine metabolism (including orotate and orotidine), ascorbate and aldarate metabolism (including gulonate and glucuronate), arginine biosynthesis (including N-acetylglutamate and argininosuccinate), and pentose and glucuronate interconversions (also including gulonate and glucuronate) may also be of interest.
The prediction performance of replicated significant metabolites was measured by r2 and presented in Table 3. The r2 of the base models, which only included the demographic variables, ranged from 0.01 to 0.25. Adding the replicated significant metabolites increased the r2 substantially for each biomarker, ranging from 0.23 to 0.74. The elastic net regression further prioritized candidate metabolites associated with each biomarker. For example, 14 of the original 40 significant metabolites were selected by the elastic net as important independent metabolites for P-tau. Initially, 40 significant metabolites explained about 72% of the variance in P-tau; the 22 elastic net-selected metabolites still explained 67% of the variance.
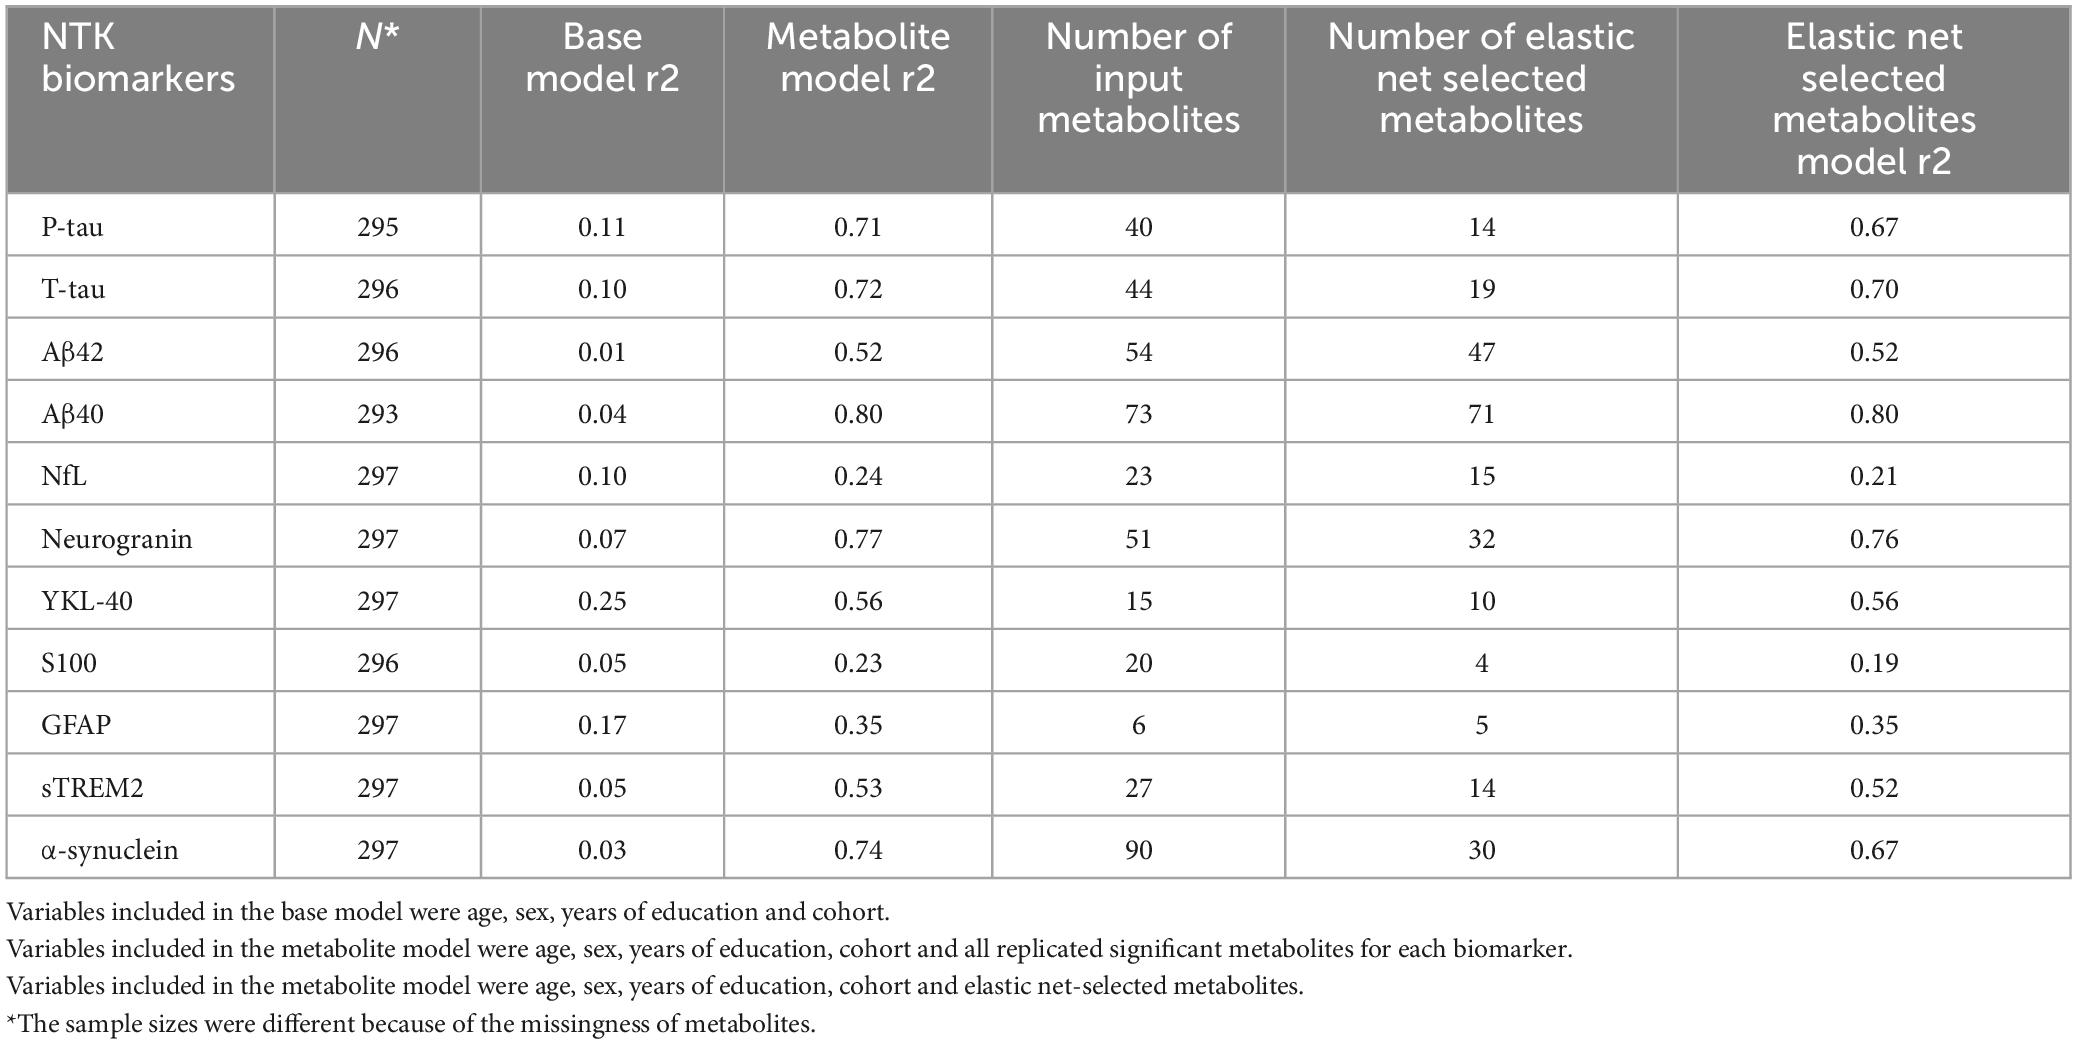
Table 3. Prediction performance (r2) of metabolites in the combined cohort of WRAP and Wisconsin ADRC.
According to the F statistics, we employed the LIML method for MR. The full results of the test statistics are provided in Supplementary Table 28. After checking for consistency of the CIs for the LIML and CLR methods, the significant and consistent MR results are displayed in Table 4, showing metabolites with a potential causal effect on the NTK biomarker based on instrumental variables formed by genome-wide significant SNPs. For example, we observed a positive causal association between palmitoyl sphingomyelin (d18:1/16:0) and sTREM2.
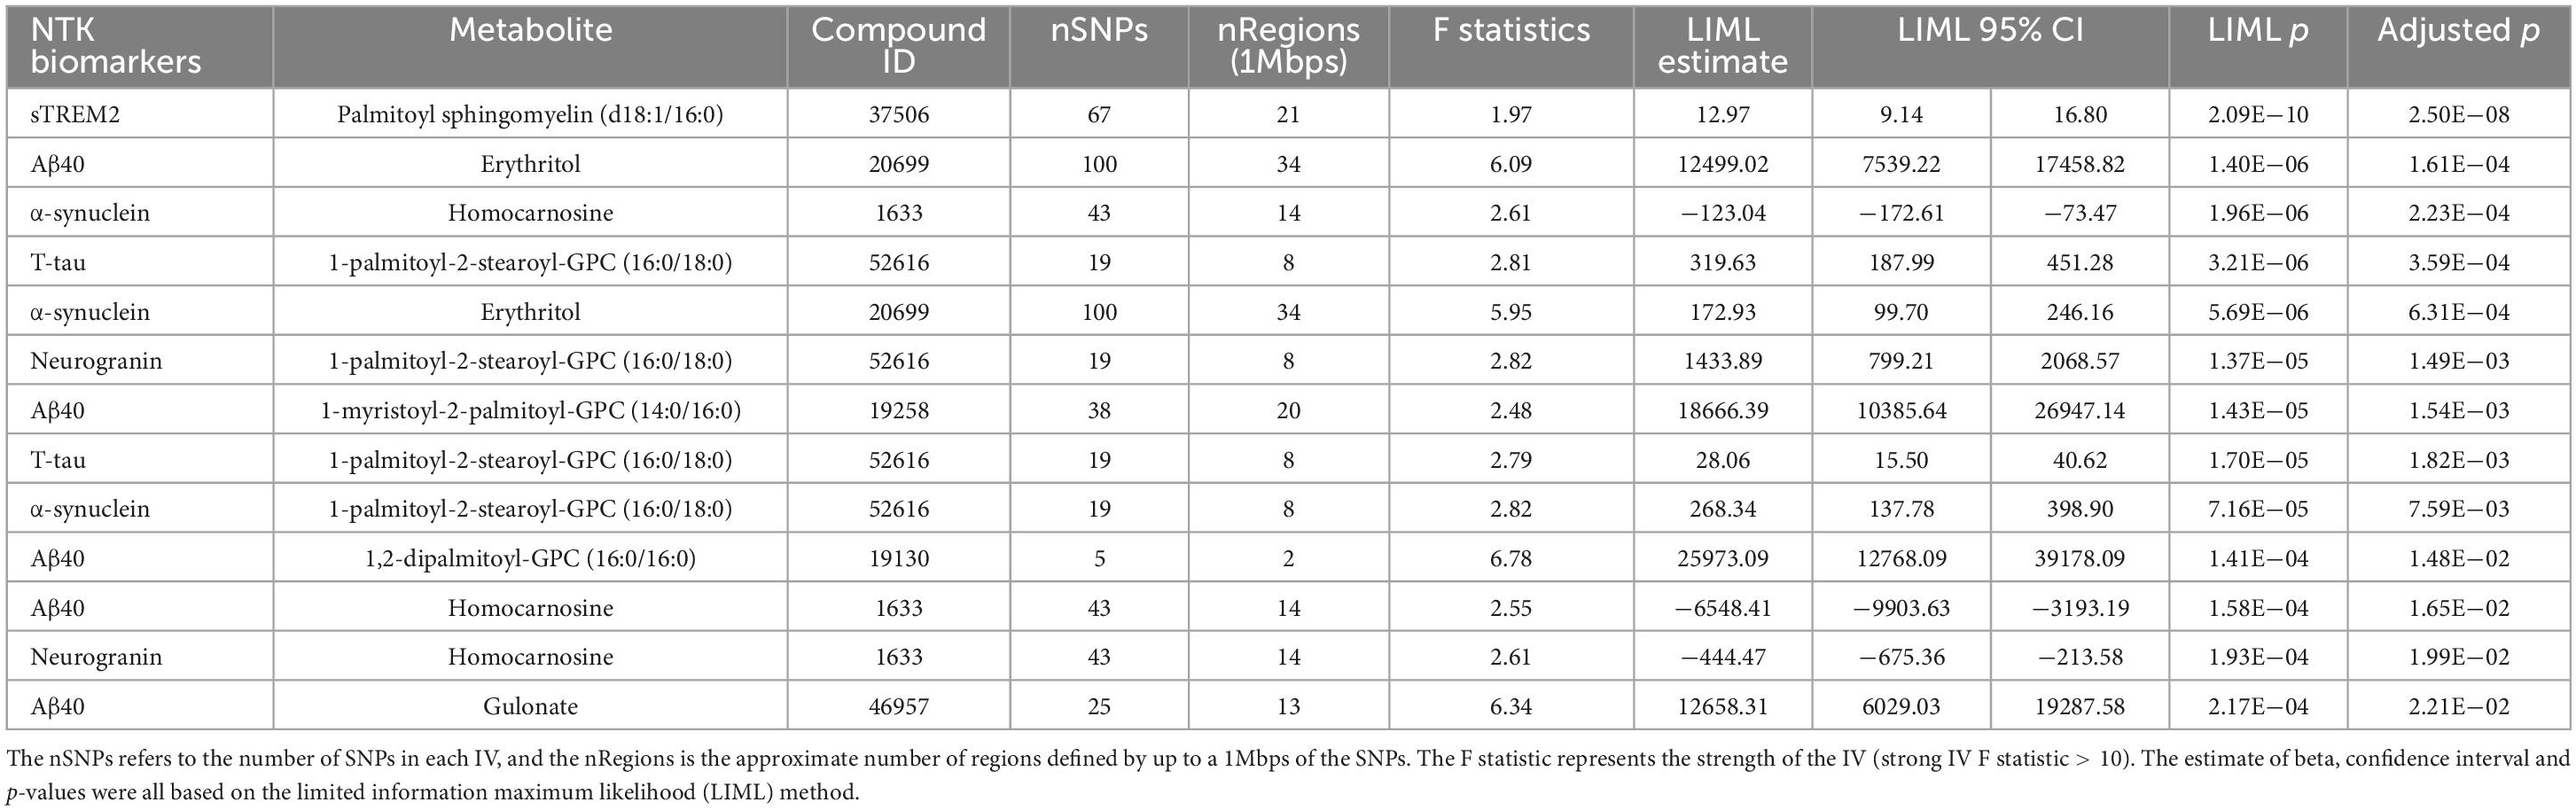
Table 4. Significant Mendelian randomization results after Bonferroni correction.
In this analysis, we tested the associations between CSF metabolites and CSF NTK biomarkers representing different pathologies of AD in initially cognitively-unimpaired individuals. Significant metabolites were identified in the WRAP cohort using linear mixed effects regression and most of the metabolites were replicated in the Wisconsin ADRC cohort. The elastic net regression method reduced the number of CSF metabolites by selecting the important and independent metabolites for each CSF biomarker. This provides a smaller, more practical set of metabolites to focus on in future research. The results of the MR analyses suggested several metabolites that may play a causal role in AD pathology. A detailed look into these associations, such as the contributing genes and their corresponding functions, is worth exploring.
We have identified and replicated multiple CSF metabolites that were associated with CSF NTK biomarkers for AD pathology; most of these CSF metabolites were lipids, particularly sphingolipids, phosphatidylcholines, and lysophospholipids, which are all types of phospholipids. Phospholipids are a class of lipids that construct the cellular membranes and are involved in many complex activities of membrane proteins, receptors, enzymes, and ion channels in the cell or at the cell surface (Kosicek and Hecimovic, 2013). In the neurodegenerative brain, e.g., in the AD brain, which has suffered extensive damage, the compromise of the membrane functions is expected, explaining how phospholipids may be involved in AD pathology (Wong et al., 2017). Previous studies have demonstrated that various phospholipids such as phosphatidylcholines, sphingolipids, glycerophospholipids, and lysophospholipids have changed in the AD patient’s brain, CSF and blood when compared to healthy controls (Kosicek and Hecimovic, 2013; González-Domínguez et al., 2014; Kao et al., 2020). For example, a serum metabolomics study conducted by González-Domínguez et al. (2014) showed that the concentration of numerous phosphatidyl lipids, like 1,2-dipalmitoyl-GPC (16:0/16:0), 1-palmitoyl-2-linoleoyl-GPC (16:0/18:2), and 1-palmitoyl-2-oleoyl-GPC (16:0/18:1), and lysophosphatidylcholines, like 1-palmitoyl-GPC (16:0) and 1-stearoyl-GPC (18:0), were different in AD versus healthy controls. The 1,2-dipalmitoyl-GPC (16:0/16:0) phosphatidylcholine has also been suggested as one of three serum metabolites to predict AD development in MCI individuals (Orešič et al., 2011). Another brain metabolomics study found that higher levels of palmitoyl sphingomyelin (d18:1/16:0) and sphingomyelin (d18:1/18:1, d18:2/18:0) were associated with the severity of AD pathology at autopsy and AD progression across prodromal and preclinical stages (Varma et al., 2018). The stearoyl sphingomyelin (d18:1/18:0) was also significantly changed in the CSF with “AD-like pathology” that was dichotomized by Aβ42, T-tau, and P-tau levels (Koal et al., 2015). In summary, our results confirmed the importance of the previously identified lipids but also provided novel lipid findings for AD pathologies beyond the major established ones.
Another class of metabolites that are of potential interest are several carbohydrates like N-acetylneuraminate, arabitol/xylitol, arabinose, and erythronate. Among them, N-acetylneuraminate, also known as sialic acid, had a significant effect on most NTK biomarkers. In addition to our study, a previous study conducted by Nagata et al. (2018) in 2018 also showed that CSF N-acetylneuraminate was significantly increased in AD when compared to patients with idiopathic normal pressure hydrocephalus and was positively correlated with CSF P-tau (r = 0.55), as it was in our study. N-acetylneuraminate is an acetyl derivative of the amino sugar neuraminic acid, which occurs in many glycoproteins, glycolipids, and polysaccharides. Specifically, it is a functional and structural component of gangliosides, which are found predominantly in the nervous system and are abundant in the brain, especially in the grey matter (Palmano et al., 2015). Studies have shown that gangliosides play important roles in AD. For example, it has been suggested that GM1-ganglioside binds to Aß, and the resulted GAß has the capability to accelerate Aß assembly (Yanagisawa et al., 1995) and is the endogenous seed for amyloid fibral in the AD brain (Hayashi et al., 2004). The gangliosides also have important roles in organizing the lipid rafts, which integrate numerous types of lipid proteins involved in cell signaling, cell-cell adhesion, and intracellular vesicular trafficking (Nagata et al., 2018) and contain many AD-associated proteins such as amyloid precursor protein (APP) (Ehehalt et al., 2003). Furthermore, the gene CD33, which belongs to the sialic-acid-binding immunoglobulin-like lectin family, has been reported as a strong genetic locus associated with AD by GWASs (Bertram et al., 2008; Hollingworth et al., 2011; Naj et al., 2011) and has been suggested to impair the microglia-mediated Aβ clearance (Bradshaw et al., 2013; Griciuc et al., 2013; Jiang et al., 2014). Erythronate (erythronic acid) was previously identified as the main hallmark of pentose–phosphate pathway defects (Engelke et al., 2010), and consistent with abnormal function of pentose–phosphate pathway in certain regions of the AD-brain (Xu et al., 2016), and the upregulation of the pentose–phosphate pathway was reported in a previous study of mild cognitive impairment (MCI) participants that later progressed to AD (Orešič et al., 2011).
As mentioned above, a couple of metabolites were common to most of the AD pathologies defined by the CSF NTK biomarkers. On the contrary, some metabolites were unique to specific NTK biomarkers. For example, lipids like 1-palmitoyl-2-linoleoyl-GPC (16:0/18:2), 1-stearoyl-2-arachidonoyl-GPC (18:0/20:4), sphingomyelin (d18:1/20:0, d16:1/22:0) and sphingomyelin (d18:1/22:1, d18:2/22:0, d16:1/24:1) were only associated with α-synuclein. These metabolites may be helpful to study synaptic dysfunction and could potentially be used as biomarkers to differentiate AD pathologies.
The significant associations between a number of metabolites and both Aβ42 and Aβ40, but not with Aβ42/40 may indicate that the metabolites associated with Aβ42 and Aβ40 only influence the production of amyloid in general versus clearance of the pathological form, Aβ42. Our analysis also suggested that no metabolites were associated with IL-6, consistent with two other studies in the WRAP and Wisconsin ADRC cohorts that found no associations between twelve SM metabolites and IL-6 (Morrow et al., 2021), and no associations between a proteomic analysis of 915 proteins and IL-6 after multiple-testing correction (Johnson et al., 2020).
By utilizing Mendelian randomization, we found causal evidence for several of the associations between CSF metabolites and CSF NTK biomarkers. Among these metabolites, most of them were lipids, with some amino acids and cofactors/vitamins, and a xenobiotic metabolite, erythritol. Another metabolite of interest, homocarnosine, is an inhibitory neuromodulator synthesized in the neuron from gamma-aminobutyric acid (GABA) and histidine (Gujar et al., 2005). The level of human CSF homocarnosine declines drastically with age (Jansen et al., 2006) and was suggested to be related to AD through CSF protein glycation (Hipkiss, 2007). At the same time, GABA also plays an important role in the brain and may be related to AD (Govindpani et al., 2017).
This study has some limitations. First, the analysis only included non-Hispanic white individuals, so the results may not extrapolate to other racial/ethnic groups. Second, the sample sizes of both the WRAP and Wisconsin ADRC cohorts were relatively small and will need to be replicated in a larger independent sample. Although we excluded the metabolites with very high missingness (>80%), there were 10 metabolites with missing values in over 50% of individuals in WRAP and/or the Wisconsin ADRC (Supplementary Table 1). The missingness of these metabolites reduced the power and may have resulted in a failure to detect the association between them and biomarkers. The validation of these top hits using a targeted approach, more sophisticated statistical methods, and experiments in vitro are necessary for these results to be clinically relevant. Our analysis also excluded several metabolites with unknown biochemical names, but due to the development of Metabolon’s library and rapidly increasing studies in this area, it would be worthwhile to re-examine these metabolites when we have more knowledge. Finally, the MR conclusion can be nullified if the underlying assumptions are violated. For example, our conclusions may be sensitive to the presence of invalid IVs due to potential pleiotropy of metabolites. In general, the research confirmed that several novel metabolites changed along with AD CSF biomarkers and extended several developing and understudied AD pathologies, e.g., synaptic dysfunction, based on untargeted CSF metabolomics and will expand our knowledge of the biological mechanisms behind AD.
The genetic data presented in the study are deposited in the National Institute on Aging Genetics of Alzheimer’s Disease Data Storage Site (NIAGADS, https://www.niagads.org/home), accession number: NG00067. The metabolomic data presented in the study are deposited in Synapse (https://www.synapse.org/), project SynID: syn52222896.
The studies involving human participants were reviewed and approved by the University of Wisconsin Institutional Review Board. The patients/participants provided their written informed consent to participate in this study.
RD conceived and designed the analysis, contributed data or analysis tools, performed the analysis, and wrote the manuscript. QL, HK, YD, and CV contributed data or analysis tools, modified the manuscript, and provided suggestion. IS, GK, NW, HZ, and KB collected the data, modified the manuscript, and provided suggestion. RA modified the manuscript and provided suggestion. CC, SA, and SJ collected the data. CE conceived and designed the analysis, collected the data, wrote the manuscript, and provided suggestion. All authors contributed to the article and approved the submitted version.
This study was supported by the National Institutes of Health (NIH) grants [R01AG27161 (Wisconsin Registry for Alzheimer Prevention: Biomarkers of Preclinical AD), R01AG054047 (Genomic and Metabolomic Data Integration in a Longitudinal Cohort at Risk for Alzheimer’s Disease), R01AG037639 (White Matter Degeneration: Biomarkers in Preclinical Alzheimer’s Disease), R21AG067092 (Identifying Metabolomic Risk Factors in Plasma and Cerebrospinal Fluid for Alzheimer’s Disease), and P30AG062715 (Wisconsin Alzheimer’s Disease Research Center Grant)], the Helen Bader Foundation, Northwestern Mutual Foundation, Extendicare Foundation, State of Wisconsin, the Clinical and Translational Science Award (CTSA) program through the NIH National Center for Advancing Translational Sciences (NCATS) grant (UL1TR000427), and the University of Wisconsin-Madison Office of the Vice Chancellor for Research and Graduate Education with funding from the Wisconsin Alumni Research Foundation. Computational resources were supported by core grants to the Center for Demography and Ecology (P2CHD047873) and the Center for Demography of Health and Aging (P30AG017266). HZ was a Wallenberg Scholar supported by grants from the Swedish Research Council (#2018-02532), the European Research Council (#681712), Swedish State Support for Clinical Research (#ALFGBG-720931), the Alzheimer Drug Discovery Foundation (ADDF), USA (#201809-2016862), the AD Strategic Fund and the Alzheimer’s Association (#ADSF-21-831376-C, #ADSF-21-831381-C, and #ADSF-21-831377-C), the Olav Thon Foundation, the Erling-Persson Family Foundation, Stiftelsen för Gamla Tjänarinnor, Hjärnfonden, Sweden (#FO2019-0228), the European Union’s Horizon 2020 Research and Innovation Programme under the Marie Skłodowska-Curie grant agreement No. 860197 (MIRIADE), European Union Joint Program for Neurodegenerative Disorders (JPND2021-00694), and the UK Dementia Research Institute at UCL. KB was supported by the Swedish Research Council (#2017-00915), ADDF, USA (#RDAPB-201809-2016615), the Swedish Alzheimer Foundation (#AF-742881), Hjärnfonden, Sweden (#FO2017-0243), the Swedish state under the agreement between the Swedish government and the County Councils, the ALF-agreement (#ALFGBG-715986), and European Union Joint Program for Neurodegenerative Disorders (JPND2019-466-236), and the Alzheimer’s Association 2021 Zenith Award (ZEN-21-848495).
We especially thank the WRAP and Wisconsin ADRC participants and staff for their contributions to the studies. Without their efforts, this research would not be possible. We also thank the University of Wisconsin Madison Biotechnology Center Gene Expression Center for providing Illumina Infinium genotyping services and Roche for providing the NTK kits for this study. COBAS, COBAS E and ELECSYS are trademarks of Roche.
HZ has served at scientific advisory boards and/or as a consultant for Abbvie, Alector, Annexon, Artery Therapeutics, AZTherapies, CogRx, Denali, Eisai, Nervgen, Pinteon Therapeutics, Red Abbey Labs, Passage Bio, Roche, Samumed, Siemens Healthineers, Triplet Therapeutics, and Wave, has given lectures in symposia sponsored by Cellectricon, Fujirebio, Alzecure, Biogen, and Roche, and is a co-founder of Brain Biomarker Solutions in Gothenburg AB (BBS), which is a part of the GU Ventures Incubator Program (outside submitted work). KB has served as a consultant, at advisory boards, or at data monitoring committees for Abcam, Axon, Biogen, JOMDD/Shimadzu. Julius Clinical, Lilly, MagQu, Novartis, Pharmatrophix, Prothena, Roche Diagnostics, and Siemens Healthineers, and is a co-founder of Brain Biomarker Solutions in Gothenburg AB (BBS), which is a part of the GU Ventures Incubator Program, all unrelated to the work presented in this manuscript. GK and NW were full-time employees of Roche Diagnostics GmbH. IS was a full-time employee of Roche Diagnostics International Ltd. and holds non-voting equities in F. Hoffmann-La Roche.
The remaining authors declare that the research was conducted in the absence of any commercial or financial relationships that could be construed as a potential conflict of interest.
All claims expressed in this article are solely those of the authors and do not necessarily represent those of their affiliated organizations, or those of the publisher, the editors and the reviewers. Any product that may be evaluated in this article, or claim that may be made by its manufacturer, is not guaranteed or endorsed by the publisher.
The Supplementary Material for this article can be found online at: https://www.frontiersin.org/articles/10.3389/fnagi.2023.1214932/full#supplementary-material
ALZFORUM (2019). Fluid AD biomarkers link P-Tau to synapses, inflammation. Available online at: https://www.alzforum.org/news/conference-coverage/fluid-ad-biomarkers-link-p-tau-synapses-inflammation (accessed June 5, 2021).
Anoop, A., Singh, P. K., Jacob, R. S., and Maji, S. K. (2010). CSF biomarkers for Alzheimer’s disease diagnosis. Int. J. Alzheimers Dis. 2010:606802. doi: 10.4061/2010/606802
Bertram, L., Lange, C., Mullin, K., Parkinson, M., Hsiao, M., Hogan, M. F., et al. (2008). Genome-wide association analysis reveals putative Alzheimer’s disease susceptibility loci in addition to APOE. Am. J. Hum. Genet. 83, 623–632. doi: 10.1016/j.ajhg.2008.10.008
Bettcher, B. M., Johnson, S. C., Fitch, R., Casaletto, K. B., Heffernan, K. S., Asthana, S., et al. (2018). Cerebrospinal fluid and plasma levels of inflammation differentially relate to CNS markers of Alzheimer’s disease pathology and neuronal damage. J. Alzheimers Dis. 62, 385–397. doi: 10.3233/JAD-170602
Blennow, K., Zetterberg, H., and Fagan, A. M. (2012). Fluid biomarkers in alzheimer disease. Cold Spring Harb. Perspect. Med. 2:a006221. doi: 10.1101/cshperspect.a006221
Bradshaw, E. M., Chibnik, L. B., Keenan, B. T., Ottoboni, L., Raj, T., Tang, A., et al. (2013). CD33 Alzheimer’s disease locus: Altered monocyte function and amyloid biology. Nat. Neurosci. 16, 848–850. doi: 10.1038/nn.3435
Chao, J. C., and Swanson, N. R. (2005). Consistent estimation with a large number of weak instruments. Econometrica 73, 1673–1692.
Darst, B. F., Koscik, R. L., Racine, A. M., Oh, J. M., Krause, R. A., Carlsson, C. M., et al. (2017). Pathway-specific polygenic risk scores as predictors of β-amyloid deposition and cognitive function in a sample at increased risk for Alzheimer’s disease. J. Alzheimers Dis. JAD. 55, 473–484. doi: 10.3233/JAD-160195
Darst, B. F., Lu, Q., Johnson, S. C., and Engelman, C. D. (2019). Integrated analysis of genomics, longitudinal metabolomics, and Alzheimer’s risk factors among 1,111 cohort participants. Genet. Epidemiol. 43, 657–674. doi: 10.1002/gepi.22211
Dong, R., Denier-Fields, D. N., Lu, Q., Suridjan, I., Kollmorgen, G., Wild, N., et al. (2022). Principal components from untargeted cerebrospinal fluid metabolomics associated with Alzheimer’s disease biomarkers. Neurobiol. Aging. 117, 12–23. doi: 10.1016/j.neurobiolaging.2022.04.009
Ehehalt, R., Keller, P., Haass, C., Thiele, C., and Simons, K. (2003). Amyloidogenic processing of the Alzheimer β-amyloid precursor protein depends on lipid rafts. J. Cell Biol. 160, 113–123. doi: 10.1083/jcb.200207113
Engelke, U. F. H., Zijlstra, F. S. M., Mochel, F., Valayannopoulos, V., Rabier, D., Kluijtmans, L. A., et al. (2010). Mitochondrial involvement and erythronic acid as a novel biomarker in transaldolase deficiency. Biochim. Biophys. Acta BBA Mol. Basis Dis. 1802, 1028–1035. doi: 10.1016/j.bbadis.2010.06.007
Evans, A. M., Bridgewater, B. R., Liu, Q., Mitchell, M. W., Robinson, R. J., Dai, H., et al. (2014). High resolution mass spectrometry improves data quantity and quality as compared to unit mass resolution mass spectrometry in high-throughput profiling metabolomics. Metabolomics 4, 1–7. doi: 10.4172/2153?0769.1000132
González-Domínguez, R., García-Barrera, T., and Gómez-Ariza, J. L. (2014). Combination of metabolomic and phospholipid-profiling approaches for the study of Alzheimer’s disease. J. Proteomics 104, 37–47. doi: 10.1016/j.jprot.2014.01.014
Govindpani, K., Calvo-Flores Guzmán, B., Vinnakota, C., Waldvogel, H. J., Faull, R. L., and Kwakowsky, A. (2017). Towards a better understanding of GABAergic remodeling in Alzheimer’s disease. Int. J. Mol. Sci. 18:1813. doi: 10.3390/ijms18081813
Griciuc, A., Serrano-Pozo, A., Parrado, A. R., Lesinski, A. N., Asselin, C. N., Mullin, K., et al. (2013). Alzheimer’s disease risk gene CD33 inhibits microglial uptake of amyloid beta. Neuron 78, 631–643. doi: 10.1016/j.neuron.2013.04.014
Gujar, S. K., Maheshwari, S., Björkman-Burtscher, I., and Sundgren, P. C. (2005). Magnetic resonance spectroscopy. J. Neuroophthalmol. 25, 217–226. doi: 10.1097/01.wno.0000177307.21081.81
Hasin, Y., Seldin, M., and Lusis, A. (2017). Multi-omics approaches to disease. Genome Biol. 18:83. doi: 10.1186/s13059-017-1215-1
Hayashi, H., Kimura, N., Yamaguchi, H., Hasegawa, K., Yokoseki, T., Shibata, M., et al. (2004). A Seed for alzheimer amyloid in the brain. J. Neurosci. 24, 4894–4902. doi: 10.1523/JNEUROSCI.0861-04.2004
Hipkiss, A. R. (2007). Could carnosine or related structures suppress Alzheimer’s disease? J. Alzheimers Dis. 11, 229–240. doi: 10.3233/JAD-2007-11210
Hollingworth, P., Harold, D., Sims, R., Gerrish, A., Lambert, J. C., Carrasquillo, M. M., et al. (2011). Common variants at ABCA7, MS4A6A/MS4A4E, EPHA1, CD33 and CD2AP are associated with Alzheimer’s disease. Nat. Genet. 43, 429–435. doi: 10.1038/ng.803
Hulle, C. V., Jonaitis, E. M., Betthauser, T. J., Batrla, R., Wild, N., Kollmorgen, G., et al. (2021). An examination of a novel multipanel of CSF biomarkers in the Alzheimer’s disease clinical and pathological continuum. Alzheimers Dement. 17, 431–445. doi: 10.1002/alz.12204
Jacobs, K. R., Lim, C. K., Blennow, K., Zetterberg, H., Chatterjee, P., Martins, R. N., et al. (2019). Correlation between plasma and CSF concentrations of kynurenine pathway metabolites in Alzheimer’s disease and relationship to amyloid-β and tau. Neurobiol. Aging 80, 11–20. doi: 10.1016/j.neurobiolaging.2019.03.015
Jansen, E. E. W., Gibson, K. M., Shigematsu, Y., Jakobs, C., and Verhoeven, N. M. (2006). A novel, quantitative assay for homocarnosine in cerebrospinal fluid using stable-isotope dilution liquid chromatography–tandem mass spectrometry. J. Chromatogr. B Analyt. Technol. Biomed. Life Sci. 830, 196–200. doi: 10.1016/j.jchromb.2005.10.053
Jiang, T., Yu, J. T., Hu, N., Tan, M. S., Zhu, X. C., and Tan, L. (2014). CD33 in Alzheimer’s disease. Mol. Neurobiol. 49, 529–535. doi: 10.1007/s12035-013-8536-1
Johnson, E. C. B., Dammer, E. B., Duong, D. M., Ping, L., Zhou, M., Yin, L., et al. (2020). Large-scale proteomic analysis of Alzheimer’s disease brain and cerebrospinal fluid reveals early changes in energy metabolism associated with microglia and astrocyte activation. Nat. Med. 26, 769–780. doi: 10.1038/s41591-020-0815-6
Johnson, S. C., Koscik, R. L., Jonaitis, E. M., Clark, L. R., Mueller, K. D., Berman, S. E., et al. (2018). The wisconsin registry for Alzheimer’s prevention: A review of findings and current directions. Alzheimers Dement. Diagn. Assess. Dis. Monit. 10, 130–142. doi: 10.1016/j.dadm.2017.11.007
Kang, H., Jiang, Y., Zhao, Q., and Small, D. S. (2021). Ivmodel: an R package for inference and sensitivity analysis of instrumental variables models with one endogenous variable. Observ. Stud. 7, 1–24. doi: 10.1353/obs.2021.0029
Kao, Y. C., Ho, P. C., Tu, Y. K., Jou, I. M., and Tsai, K. J. (2020). Lipids and Alzheimer’s disease. Int. J. Mol. Sci. 21:1505. doi: 10.3390/ijms21041505
Koal, T., Klavins, K., Seppi, D., Kemmler, G., and Humpel, C. (2015). Sphingomyelin SM(d18:1/18:0) is significantly enhanced in cerebrospinal fluid samples dichotomized by pathological amyloid-β 42, Tau, and Phospho-Tau-181 levels. J. Alzheimers Dis. 44, 1193–1201. doi: 10.3233/JAD-142319
Kosicek, M., and Hecimovic, S. (2013). Phospholipids and Alzheimer’s disease: Alterations, mechanisms and potential biomarkers. Int. J. Mol. Sci. 14, 1310–1322. doi: 10.3390/ijms14011310
Liang, Y., Xie, S., He, Y., Xu, M., Qiao, X., Zhu, Y., et al. (2022). Kynurenine pathway metabolites as biomarkers in Alzheimer’s disease. Dis. Markers 2022:e9484217. doi: 10.1155/2022/9484217
Moreira, M. J. A. (2003). Conditional likelihood ratio test for structural models. Econometrica 71, 1027–1048. doi: 10.1111/1468-0262.00438
Morrow, A. R., Panyard, D. J., Deming, Y., Jonaitis, E. M., Dong, R., Vasiljevic, E., et al. (2021). CSF sphingomyelin metabolites in Alzheimer’s disease, neurodegeneration, and neuroinflammation. Alzheimers Dement. 17:e052290. doi: 10.1002/alz.052290
Nagata, Y., Hirayama, A., Ikeda, S., Shirahata, A., Shoji, F., Maruyama, M., et al. (2018). Comparative analysis of cerebrospinal fluid metabolites in Alzheimer’s disease and idiopathic normal pressure hydrocephalus in a Japanese cohort. Biomark. Res. 6:5. doi: 10.1186/s40364-018-0119-x
Naj, A. C., Jun, G., Beecham, G. W., Wang, L. S., Vardarajan, B. N., Buros, J., et al. (2011). Common variants at MS4A4/MS4A6E, CD2AP, CD33 and EPHA1 are associated with late-onset Alzheimer’s disease. Nat. Genet. 43, 436–441. doi: 10.1038/ng.801
Orešič, M., Hyötyläinen, T., Herukka, S. K., Sysi-Aho, M., Mattila, I., Seppänan-Laakso, T., et al. (2011). Metabolome in progression to Alzheimer’s disease. Transl. Psychiatry 1, e57–e57. doi: 10.1038/tp.2011.55
Palmano, K., Rowan, A., Guillermo, R., Guan, J., and Mc Jarrow, P. (2015). The Role of Gangliosides in Neurodevelopment. Nutrients 7, 3891–3913. doi: 10.3390/nu7053891
Pang, Z., Chong, J., Zhou, G., Morais, D. A., Chang, L., Barrette, M., et al. (2021). MetaboAnalyst 5.0: Narrowing the gap between raw spectra and functional insights. Nucleic Acids Res. 49, W388–W396. doi: 10.1093/nar/gkab382
Panyard, D. J., Kim, K. M., Darst, B. F., Deming, Y. K., Zhong, X., Wu, Y., et al. (2021). Cerebrospinal fluid metabolomics identifies 19 brain-related phenotype associations. Commun. Biol. 4:63. doi: 10.1038/s42003-020-01583-z
Racine, A. M., Koscik, R. L., Berman, S. E., Nicholas, C. R., Clark, L. R., Okonkwo, O. C., et al. (2016). Biomarker clusters are differentially associated with longitudinal cognitive decline in late midlife. Brain 139, 2261–2274. doi: 10.1093/brain/aww142
Sanderson, E., Glymour, M. M., Holmes, M. V., Kang, H., Morrison, J., Munafò, M. R., et al. (2022). Mendelian randomization. Nat. Rev. Methods Primers 2:6. doi: 10.1038/s43586-021-00092-5
Stock, J. H., Wright, J. H., and Yogo, M. A. (2002). Survey of weak instruments and weak identification in generalized method of moments. J. Bus. Econ. Stat. 20, 518–529. doi: 10.1198/073500102288618658
van der Velpen, V., Teav, T., Gallart-Ayala, H., Mehl, F., Konz, I., Clark, C., et al. (2019). Systemic and central nervous system metabolic alterations in Alzheimer’s disease. Alzheimers Res. Ther. 11:93. doi: 10.1186/s13195-019-0551-7
Varma, V. R., Oommen, A. M., Varma, S., Casanova, R., An, Y., Andrews, R. M., et al. (2018). Brain and blood metabolite signatures of pathology and progression in Alzheimer disease: A targeted metabolomics study. PLoS Med. 15:e1002482. doi: 10.1371/journal.pmed.1002482
Vogt, N. M., Romano, K. A., Darst, B. F., Engelman, C. D., Johnson, S. C., Carlsson, C. M., et al. (2018). The gut microbiota-derived metabolite trimethylamine N-oxide is elevated in Alzheimer’s disease. Alzheimers Res. Ther. 10:124. doi: 10.1186/s13195-018-0451-2
Wong, M. W., Braidy, N., Poljak, A., Pickford, R., Thambisetty, M., and Sachdev, P. S. (2017). Dysregulation of lipids in Alzheimer’s disease and their role as potential biomarkers. Alzheimers Dement. 13, 810–827. doi: 10.1016/j.jalz.2017.01.008
Wooldridge, J. M. (2010). Econometric analysis of cross section and panel data, Second Edn. Cambridge, MA: MIT Press.
Xu, J., Begley, P., Church, S. J., Patassini, S., Hollywood, K. A., Jüllig, M., et al. (2016). Graded perturbations of metabolism in multiple regions of human brain in Alzheimer’s disease: Snapshot of a pervasive metabolic disorder. Biochim. Biophys. Acta BBA Mol. Basis Dis. 1862, 1084–1092. doi: 10.1016/j.bbadis.2016.03.001
Yanagisawa, K., Odaka, A., Suzuki, N., and Ihara, Y. (1995). GM1 ganglioside–bound amyloid β–protein (Aβ): A possible form of preamyloid in Alzheimer’s disease. Nat. Med. 1, 1062–1066. doi: 10.1038/nm1095-1062
Keywords: Alzheimer’s disease, metabolomics, CSF NeuroToolKit biomarkers, metabolome-wide association, Mendelian randomization
Citation: Dong R, Lu Q, Kang H, Suridjan I, Kollmorgen G, Wild N, Deming Y, Van Hulle CA, Anderson RM, Zetterberg H, Blennow K, Carlsson CM, Asthana S, Johnson SC and Engelman CD (2023) CSF metabolites associated with biomarkers of Alzheimer’s disease pathology. Front. Aging Neurosci. 15:1214932. doi: 10.3389/fnagi.2023.1214932
Received: 30 April 2023; Accepted: 17 July 2023;
Published: 30 August 2023.
Edited by:
Nathan Basisty, National Institute on Aging (NIH), United StatesReviewed by:
Rebecca A. Baillie, Rosa Drug Development Advisors, United StatesCopyright © 2023 Dong, Lu, Kang, Suridjan, Kollmorgen, Wild, Deming, Van Hulle, Anderson, Zetterberg, Blennow, Carlsson, Asthana, Johnson and Engelman. This is an open-access article distributed under the terms of the Creative Commons Attribution License (CC BY). The use, distribution or reproduction in other forums is permitted, provided the original author(s) and the copyright owner(s) are credited and that the original publication in this journal is cited, in accordance with accepted academic practice. No use, distribution or reproduction is permitted which does not comply with these terms.
*Correspondence: Corinne D. Engelman, Y2VuZ2VsbWFuQHdpc2MuZWR1
Disclaimer: All claims expressed in this article are solely those of the authors and do not necessarily represent those of their affiliated organizations, or those of the publisher, the editors and the reviewers. Any product that may be evaluated in this article or claim that may be made by its manufacturer is not guaranteed or endorsed by the publisher.
Research integrity at Frontiers
Learn more about the work of our research integrity team to safeguard the quality of each article we publish.