 Dongling Zhang1,2,3Junye Yao4Junyan Sun1,2,3Junling Wang1,2,3Lili Chen1,2,3Hongjian He4,5*Tao Wu1,2,3*
- 1Center for Movement Disorders, Department of Neurology, Beijing Tiantan Hospital, Capital Medical University, Beijing, China
- 2China National Clinical Research Center for Neurological Diseases, Beijing, China
- 3Parkinson's Disease Center, Beijing Institute for Brain Disorders, Capital Medical University, Beijing, China
- 4Center for Brain Imaging Science and Technology, College of Biomedical Engineering and Instrument Science, Zhejiang University, Hangzhou, Zhejiang, China
- 5School of Physics, Zhejiang University, Hangzhou, Zhejiang, China
Introduction: The ventral tegmental area (VTA) is less affected compared to substantia nigra pars compacta (SNc) in Parkinson's disease (PD). This study aimed to quantitatively evaluate iron content in the VTA across different stages of PD in order to help explain the selective loss of dopamine neurons in PD.
Methods: Quantitative susceptibility mapping (QSM) data were obtained from 101 PD patients, 35 idiopathic rapid eye movement sleep behavior disorder (RBD) patients, and 62 healthy controls (HCs). The mean QSM values in the VTA and SNc were calculated and compared among the groups.
Results: Both RBD and PD patients had increased iron values in the bilateral SNc compared with HCs. RBD and PD patients in the Hoehn–Yahr (H & Y) stage 1 did not show elevated iron values in the VTA, while PD patients with more than 1.5 H & Y staging had increased iron values in bilateral VTA compared to HCs.
Discussion: This study shows that there is no increased iron accumulation in the VTA during the prodromal and early clinical stages of PD, but iron deposition increases significantly as the disease becomes more severe.
1. Introduction
The dopamine (DA) neurons in the ventral tegmental area (VTA) principally project to the nucleus accumbens in the ventral striatum, as well as the amygdala and prefrontal cortex, as part of the mesocorticolimbic pathway, whereas the DA neurons in the substantia nigra pars compacta (SNc) mainly project to the dorsal striatum, as part of the nigrostriatal pathway. The mesocorticolimbic pathway involves a variety of behaviors and psychopathological states, such as depression, anxiety, feeding, and reward-related and goal-directed behaviors (Alberico et al., 2015). In Parkinson's disease (PD), an impaired dopaminergic mesocorticolimbic system is considered the leading cause of neuropsychiatric symptoms (Castrioto et al., 2016). In PD, degeneration of the DA neurons in the SNc is the most prominent symptom; in contrast, the DA neurons in the VTA are less affected (Ropper et al., 2019). Although some theories have been suggested, such as the variety of neurons found in the VTA (Nair-Roberts et al., 2008), lower expression of the dopamine transporters (Lammel et al., 2008), differences in calcium channel expression (Mosharov et al., 2009), levels of cytosolic DA, and the presence of α-synuclein (Mosharov et al., 2009; Pan and Ryan, 2012), it remains unclear why the VTA is relatively spared in PD.
It has been demonstrated that abnormal iron deposition may contribute to the damage of DA neurons in PD (Hare and Double, 2016). Quantitative susceptibility mapping (QSM) is more sensitive and can better detect increased iron in PD than R2 and R2* mapping (Barbosa et al., 2015). Using QSM, several research studies have shown that iron accumulation was both cross-sectionally and longitudinally increased in the substantia nigra (SN) in PD patients, and iron levels were correlated with clinical manifestations, using QSM (Bergsland et al., 2019; Sun et al., 2020; Uchida et al., 2020). In contrast, our knowledge of iron accumulation in the VTA in PD remains limited. A study on chronic 1-methyl-4-phenyl-1,2,3,6-tetrahydropyridine (MPTP)-treated PD mice detected an increased iron level in the SNc, but not in the VTA, and suggested that difference in iron deposition might be a reason contributing to the selective degeneration of DA neurons (Lv et al., 2011). So far, only one imaging study has investigated iron accumulation in the VTA in PD patients and found increased iron content (Ahmadi et al., 2020). However, as the primary purpose was to use transcranial sonography and QSM to localize the SN, the previous study did not investigate the iron levels at prodromal and different clinical stages of PD or the relationship between iron levels and clinical characteristics.
Thus, it is still unclear if increased iron deposition occurs in the VTA during the prodromal and early clinical stage of PD, whether iron accumulation increases as the disease becomes more severe, and whether iron deposition in the VTA correlates with clinical manifestations. Therefore, this study aimed to quantitatively evaluate iron contents in the VTA across the prodromal and different clinical stages of PD. Idiopathic rapid eye movement sleep behavior disorder (RBD) patients were included in the current study to evaluate iron content in the prodromal stage. RBD is considered a prodromal stage of α-synucleinopathies since RBD patients have a high rate of conversion to neurodegenerative disorders, especially α-synucleinopathies, such as PD, dementia with Lewy bodies, and multiple system atrophy (Schenck et al., 2013). We hypothesized that iron content in the VTA is not elevated in the early stage of PD but gradually increased as the disease becomes more severe. This study will help to clarify the pattern of iron deposition in the VTA and may provide an explanation of the selective damage of DA neurons in PD.
2. Materials and methods
2.1. Participants
This experiment was performed in accordance with the Declaration of Helsinki and was approved by the Institutional Review Board of Xuanwu Hospital of Capital Medical University. All participants (35 RBD patients, 101 PD patients, and 62 HCs) provided written consent before the experiment and were recruited from the Movement Disorders Clinic of the Xuanwu Hospital of Capital Medical University. The RBD patients were screened by the International Classification of Sleep Disorder-Third Edition diagnostic criteria (American Academy of Sleep Medicine, 2014) and were confirmed by polysomnography. PD patients were diagnosed by the MDS Clinical Diagnostic Criteria (Andrew et al., 1992). The inclusion criteria for HCs were (1) no family history of movement disorders, (2) no neurological or psychiatric diseases, and (3) no obvious cerebral lesions on structural images in magnetic resonance imaging (MRI).
The PD patients were evaluated using the Movement Disorder Society (MDS) Unified Parkinson's Disease Rating Scale, Part III (MDS-UPDRS III) and Hoehn and Yahr (H & Y) stage while off their anti-parkinsonian medicine for 12 h. The RBD patients were assessed by the Rapid Eye Movement Sleep Behavior Disorder Questionnaire–Hong Kong (RBDQ-HK) and the MDS-UPDRS III. In addition, all participants were evaluated using the Hamilton Depression Scale (HAMD), Montreal Cognitive Assessment (Chinese version; C-MoCA), Non-Motor Symptoms Scale for Parkinson's Disease (NMSS), Brief Smell Identification Test (BSIT), Epworth Sleepiness Scale (ESS), Pittsburgh Sleep Quality Index (PSQI), and Apathy Scale (AS). Demographic information is summarized in Table 1.
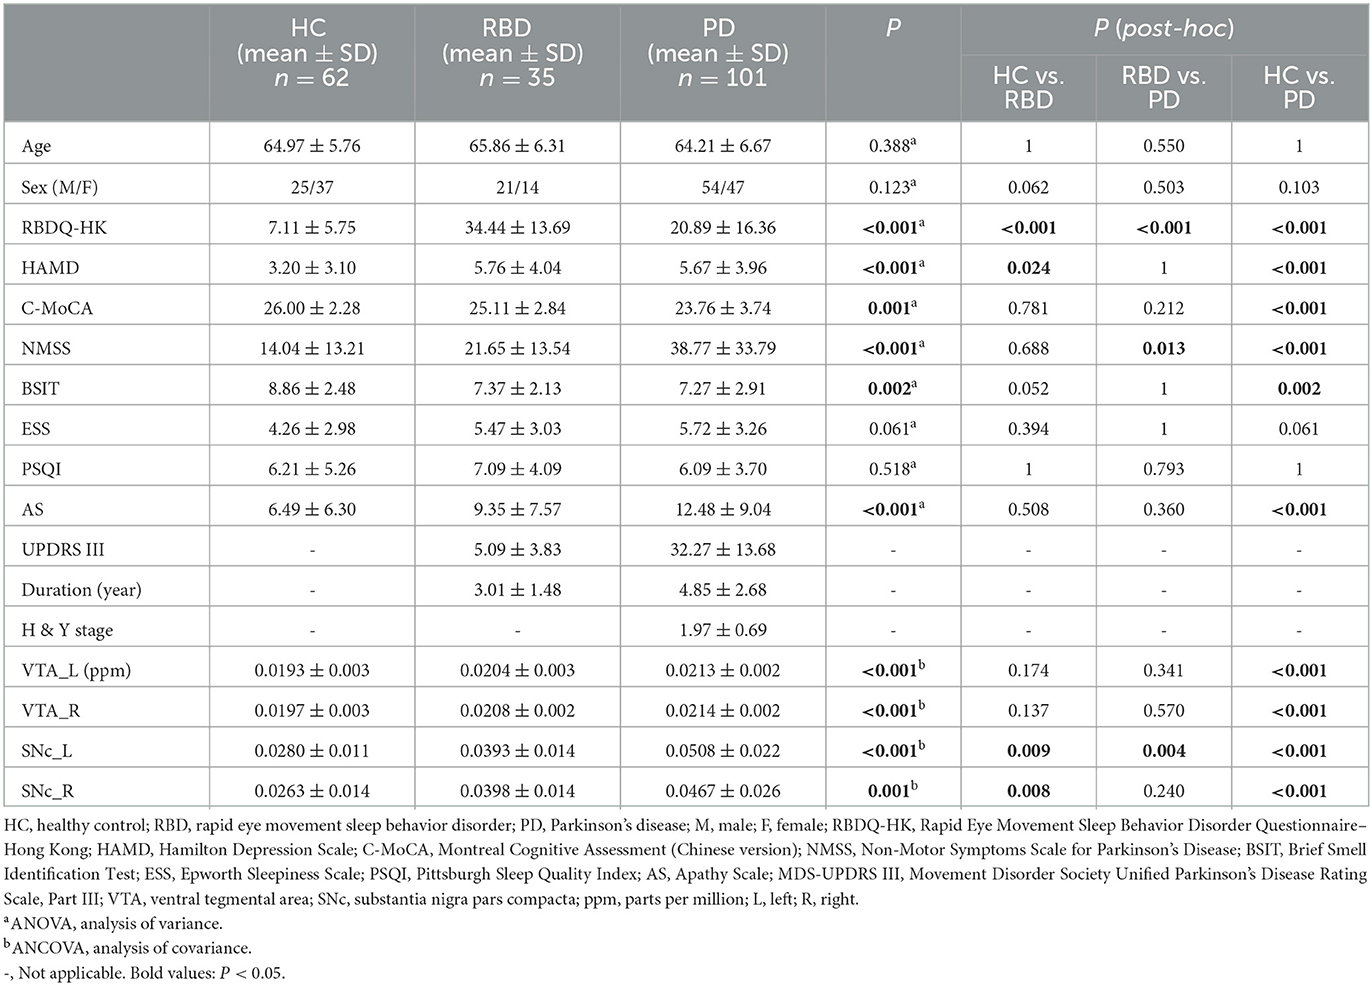
Table 1. Demographic and clinical data of participants and the QSM values in ROIs.
2.2. MRI data collection
MRI data were collected on a 3T MAGNETOM Skyra scanner (Siemens, Erlangen, Germany) using a 20-channel head coil. The signals from different coils were combined by the sum of squares method. A single-echo 3-dimensional (3-D) gradient echo (GRE) sequence was collected with the following parameters: voxel size = 0.667 × 0.667 × 1.5 mm3, repetition time (TR) = 25 ms, echo time (TE) = 17.5 ms, slice thickness = 1.5 mm, flip angle = 15°, field of view (FoV) = 256 × 192 mm2, and scanning time = 5 min 6 s. A whole-brain sagittal 3-D T1 magnetization-prepared rapid gradient echo (MP-RAGE) imaging was performed with the following parameter: voxel size = 1 × 1 × 1 mm3, TR = 2,530 ms, TE = 2.98 ms, TI = 1,100 ms; slice thickness = 1 mm, flip angle = 7°, FoV = 256 × 224 mm2, and scanning time = 5 min 13 s.
2.3. Image analysis
The QSM reconstruction was performed using MATLAB 2017b based STI Suite.1 The phase images were unwrapped using a Laplacian-based algorithm method (Wu et al., 2012). The unwrapped phase images were used to remove the background field using the V-SHARP method (Li et al., 2014). The magnetic susceptibility was determined using streaking artifact reduction for QSM (STAR-QSM; Wei et al., 2015).
Image registration was performed using FMRIB Software Library (FSL) v6.0.2 Individual 3D-T1 images were first skull stripped and registered to a standard space [Montreal Neurological Institute (MNI) 152] using FSL's FLIRT and FNIRT tools. The inverted warping field from standard to native space was then obtained by inverting the warping field. Thereafter, the individual 3D-T1 image was also registered to GRE's magnitude image using the FLIRT tool to get a second warping field. Both warping fields were combined to converted to obtain warping fields covert MNI152 so that it was well-coregistered with individual's susceptibility map.
The VTA and SNc were defined by the California Institute of Technology (CIT) 168 atlas of subcortical nuclei (Pauli et al., 2018), with a threshold of 0.25. The CIT168 atlas divides the VTA into the parabrachial pigmented nucleus (PBP) and VTA nucleus. Using FSL, we merged the VTA nucleus and PBP into a whole VTA for two reasons: (1) there is little evidence that the VTA component nuclei represent neural populations specialized and distinct in function (Trutti et al., 2019) and (2) as a probabilistic atlas (Pauli et al., 2018), there is some overlap between the VTA nucleus and PBP. The bilateral SNc and merged VTA were used as the ROIs in the current study (Figure 1). The ROIs in standard MNI152 space were normalized to individual magnitude space using the above-mentioned warping fields using FSL. Finally, the individual ROIs were obtained in order to calculate QSM values.
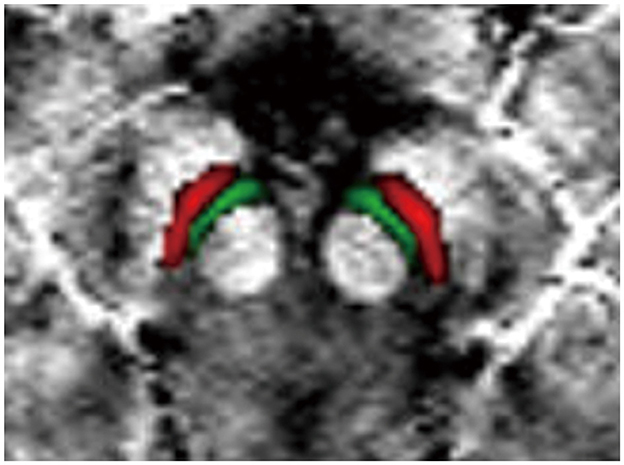
Figure 1. Definition of regions of interest (ROIs). The ROIs include the VTA (green) and SNc (red). VTA, ventral tegmental area; SNc, substantia nigra pars compacta.
2.4. Statistical analyses
The demographic and clinical characteristics of HC, RBD, and PD groups were compared using the analysis of variance (ANOVA). Post-hoc tests with Bonferroni correction were used for intergroup comparisons. The Pearson chi-square test was applied for sex frequency among the groups.
The normal distribution of QSM values was confirmed using the one-sample Kolmogorov–Smirnov test. The differences in QSM values among the three groups in each ROI were analyzed using the analysis of covariance (ANCOVA) with age and sex as covariables. Post-hoc tests with Bonferroni correction were used for intergroup comparisons (P < 0.05). In order to reveal the iron levels in different stages of PD, we further divided our PD patients into three subgroups according to the H & Y stage: 26 PD patients with H & Y stage 1 (PD-H&Y1), 43 PD patients with H & Y stage 1.5 and 2 (PD-H&Y2, including four patients with H & Y stage 1.5), and 32 PD patients with H & Y stage 2.5 and 3 (PD-H&Y3, including 14 patients with H & Y stage 2.5). The differences in QSM values among the HCs and three PD subgroups in each ROI were also analyzed using ANCOVA. Post-hoc tests with Bonferroni correction were used for intergroup comparisons (P < 0.05).
In addition, we calculated the mean QSM values of the bilateral VTA, as well as the differences in mean QSM values between the groups and the different H & Y stages.
Correlations between QSM values and clinical assessments in RBD and PD patients were performed using Pearson's correlation analysis, while Spearman's correlation analysis was used to analyze the correlation between H & Y stage and QSM values in PD patients. Statistical analyses were performed using IBM SPSS Statistics (version 20, IBM Corp, Armonk, NY, USA).
3. Results
No significant differences were observed among the three groups in age, sex, and PSQI (ANOVA, P > 0.05), while there were significant differences in RBDQ-HK, HAMD, C-MoCA, NMSS, BSIT, ESS, and AS scores (ANOVA, P < 0.05; Table 1).
There were significant differences in QSM values in the bilateral VTA and SNc among the HC, RBD, and PD groups (ANCOVA, P < 0.001). The RBD group did not show enhanced iron values in the bilateral VTA (post-hoc test, P > 0.05, Bonferroni corrected), but had increased iron values in the bilateral SNc (post-hoc test, P < 0.01, Bonferroni corrected) compared with HCs. PD patients had increased iron values in the bilateral VTA and SNc compared with HCs (post-hoc test, P < 0.001, Bonferroni corrected) and had enhanced iron values in the left SNc compared with RBD patients (post-hoc test, P < 0.01, Bonferroni corrected; Table 1 and Figures 2A–D).
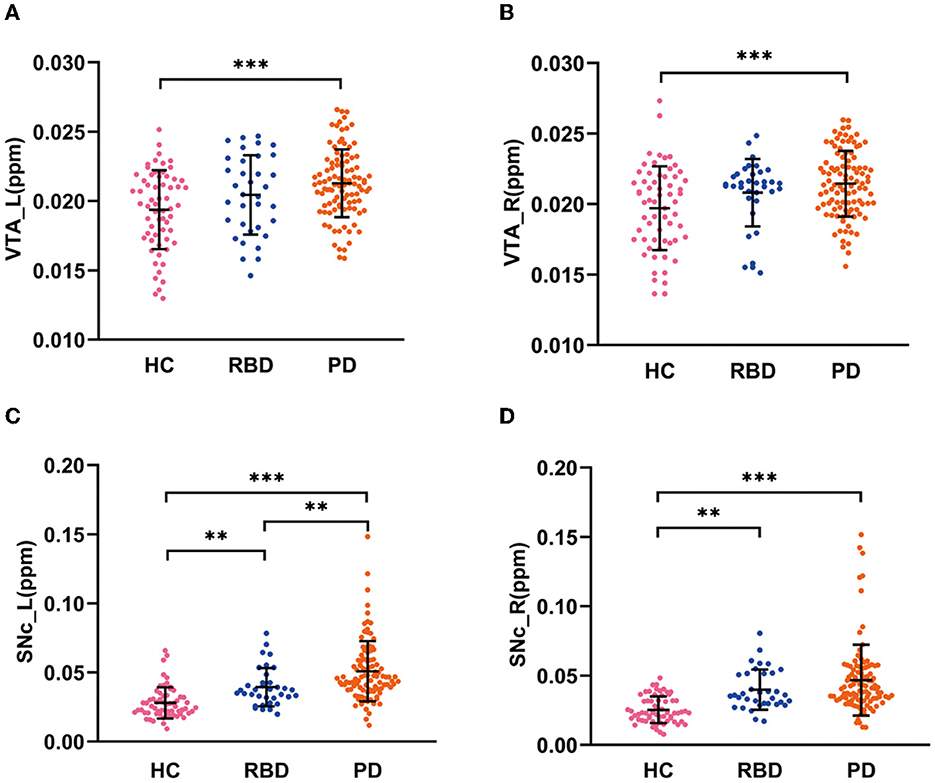
Figure 2. QSM values in the VTA and SNc in three groups. (A, B) QSM values in the VTA in HC, RBD, and PD groups. (C, D) QSM values in the SNc in HC, RBD, and PD groups. HC, healthy control; RBD, idiopathic rapid eye movement sleep behavior disorder; PD, Parkinson's disease. VTA, ventral tegmental area; SNc, substantia nigra pars compacta; ppm, parts per million; L, left; R, right. ***P < 0.001; **P < 0.01.
The QSM values had significant differences among the HCs and three PD subgroups in the bilateral VTA and SNc (ANCOVA, P < 0.001). In the bilateral VTA, the PD-H&Y1 group did not show significantly higher iron values than the HC group (post-hoc test, P > 0.05, Bonferroni corrected), while the PD-H&Y2 and PD-H&Y3 groups showed higher values (post-hoc test, P < 0.01, Bonferroni corrected). In the left VTA, the PD-H&Y3 group had increased iron values compared with the PD-H&Y1 and PD-H&Y2 groups (post-hoc test, P < 0.001, Bonferroni corrected), while the PD-H&Y2 group also had an increase of iron values compared with the PD-H&Y1 group (post-hoc test, P < 0.05, Bonferroni corrected). In comparison to HCs, all three PD subgroups showed higher iron values in the bilateral SNc (post-hoc test, P < 0.05, Bonferroni corrected). The PD-H&Y3 group had increased iron values in the left SNc compared with the PD-H&Y1 and PD-H&Y2 groups (post-hoc test, P < 0.001, Bonferroni corrected) and had elevated iron values in the right SNc compared with the PD-H&Y1 group (post-hoc test, P < 0.05, Bonferroni corrected; Table 2 and Figures 3A, B).
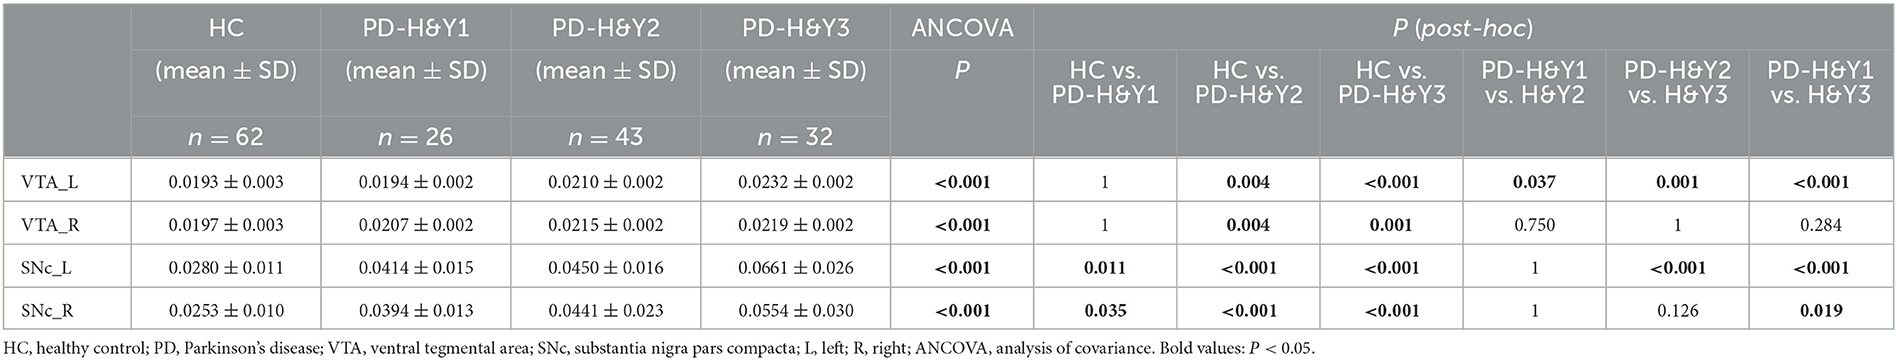
Table 2. QSM values of HC and PD patients with different H & Y stages in ROIs.
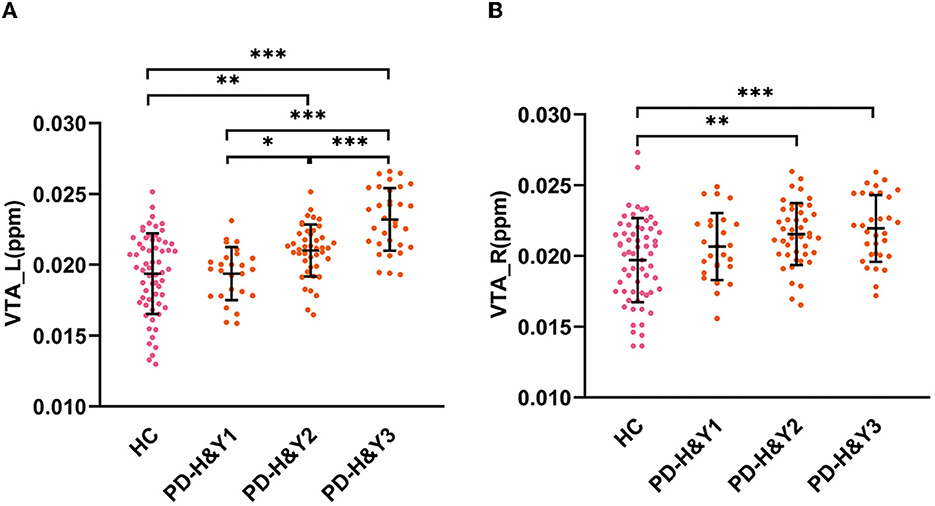
Figure 3. QSM values in the VTA in HCs and PD patients with different H & Y stages. (A) The QSM values in the left VTA; (B) the QSM values in the right VTA; HC, healthy control; PD, Parkinson's disease; H & Y stage, Hoehn and Yahr stage; VTA, ventral tegmental area; ppm, parts per million; L, left; R, right. ***P < 0.001; **P < 0.01; *P < 0.05.
We found significant differences in mean VTA QSM values between the groups and at different stages, which was similar to the results of the left and right VTA QSM values (Supplementary Tables 1, 2).
In PD patients, the QSM values in the left VTA were positively correlated with H & Y stage (r = 0.543, p < 0.001, Figure 4A), HAMD scores (r = 0.275, p = 0.007, Figure 4B), and NMSS (r = 0.238, p = 0.027, Figure 4C). In RBD patients, QSM values in the left SNc were positively correlated with disease duration (r = 0.356, p = 0.045) and RBDQ-HK scores (r = 0.388, p = 0.023), while QSM values in the right SNc were negatively correlated with BSIT scores (r = −0.496, p = 0.008). The QSM values in the bilateral SNc were positively correlated with disease duration (left: r = 0.306, p = 0.002; right: r = 0.211, p = 0.034). In addition, the QSM values in the left SNc were positively correlated with the H & Y stage (r = 0.462, p < 0.001), MDS-UPDRS III (r = 0.250, p = 0.013), and HAMD scores (r = 0.233, p = 0.022), while the QSM values in the right SNc were positively correlated with the AS scores (r = 0.226, p = 0.045) in PD patients.
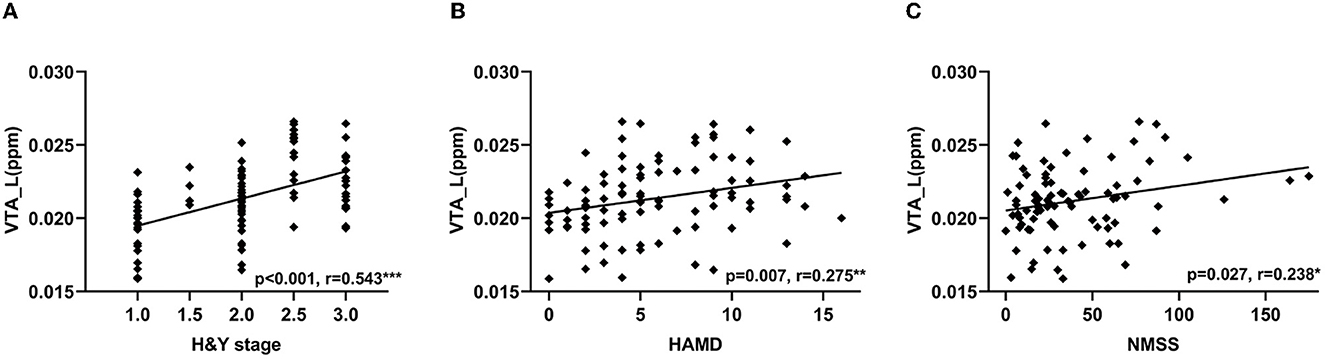
Figure 4. Correlations between QSM values in the VTA and clinical features in PD patients. Correlation between QSM values in the left VTA and H & Y stage (A), HAMD (B), and NMSS scores (C). VTA, ventral tegmental area; QSM, quantitative susceptibility mapping; PD, Parkinson's disease; H & Y stage, Hoehn and Yahr stage; HAMD, Hamilton Depression Scale; NMSS, Non-Motor Symptoms Scale for Parkinson's Disease. ***P < 0.001; **P < 0.01; *P < 0.05.
4. Discussion
In the current study, we investigated iron accumulation in the VTA across different stages of PD. The novel finding is that iron contents are not increased in the RBD patients and PD patients at H & Y stage 1. The iron accumulation in the VTA becomes significant in PD patients at mid stages and advanced stages. QSM values in the left VTA positively correlate with the H & Y stage, NMSS, and HAMD scores in PD patients.
We found that both RBD and PD patients had enhanced iron contents in the bilateral SNc, which is consistent with previous reports (Guan et al., 2017; Sun et al., 2020). In contrast, there was no increased iron content in the VTA in RBD patients and PD patients at H & Y stage 1. Age-related iron accumulation might be an important factor contributing to neurodegeneration, as aging processes might compromise the iron homoeostatic system, leading to an excess of iron that is not efficiently chelated by storage proteins or other molecules (Killilea et al., 2004; Ward et al., 2014). An elevated level of iron deposition in PD may result from increased iron influx (Moos et al., 2007), loss of intracellular homeostasis (Zucca et al., 2017), or impaired iron efflux (Bonaccorsi di Patti et al., 2018). The interaction between excess iron and DA can produce neurotoxic intermediate or end-products, leading to the formation of DNA adducts, lipid peroxidation, loss of membrane integrity, and induction of apoptosis (Blum et al., 2001; Hare and Double, 2016). It has been approved that α-synuclein could form toxic aggregates in the presence of iron, which is considered to contribute to the formation of Lewy bodies in DA neurons via oxidative stress (Ostrerova-Golts et al., 2000). It has been proposed that the vulnerability of DA neurons requires redox load from a combination of relatively high iron and dopamine together (Hare et al., 2014). Therefore, increased iron deposition is believed to mediate the death of SNc dopaminergic neurons (Hare and Double, 2016). Previous studies have suggested that several reasons may relate to less damaged DA neurons in the VTA compared with SNc, such as the variety of neurons found in the VTA (Nair-Roberts et al., 2008), lower expression of the dopamine transporter (Lammel et al., 2008), differences in calcium channel expression and the presence of α-synuclein (Mosharov et al., 2009), differences in vesicular monoamine transporter-2 and neuromelanin (Liang et al., 2004), less degree of oxidative stress and more inducible copper-zinc superoxide dismutase activities (Hung and Lee, 1998), and more brain-derived neurotrophic factor mRNA gene expression (Hung and Lee, 1996). According to our findings, less accumulation of iron is also a likely reason contributing to the relatively spared DA neurons in the VTA during the prodromal and early clinical stages of PD.
The underlying reasons contributing to the less accumulation of iron in the VTA compared with SNc remain unclear. Previous studies on chronic MPTP-treated mice have suggested that misregulation of iron transporters, such as increased expression of divalent metal transporter 1 and decreased expression of ferroportin 1, might correlate with nigral iron accumulation. However, this pattern of misregulation of iron transporters was not detected in the VTA (Lv et al., 2011). These selective changes in iron transporters may help explain the differential iron accumulation in the SNc and VTA in PD.
Our PD patients at more than 1.5 H & Y staging had enhanced iron deposition in the VTA. This finding is consistent with a previous report (Ahmadi et al., 2020), in which PD patients with an average of 1.97 H & Y staging showed increased iron accumulation in the VTA compared with HC. In addition, the QSM values in the left VTA were positively correlated with the H & Y stage. These observations suggest that as the disease becomes more severe, iron deposition in the VTA becomes more significant, and may induce the death of DA neurons at the mid-stage and advanced stage of PD. Studies on the post-mortem brain of PD patients have proved that there was a 40–77% loss of DA neurons in the VTA (Alberico et al., 2015).
The neurons in the VTA project to extensive brain regions, including the nucleus accumbens, amygdala, prefrontal cortex, hippocampus, ventral pallidum, periaqueductal gray, bed nucleus of the stria terminalis, olfactory tubercle, and locus coeruleus, which are related to the various non-motor symptoms (Alberico et al., 2015; Morales and Margolis, 2017). However, only a small number of imaging studies have focused on the relationship between physiological changes in the VTA and clinical phenotypes of PD. The VTA showed an attenuated neural response to reward outcomes in PD patients (van der Vegt et al., 2013). Increased functional coupling between the VTA and default mode network has been reported in PD patients with freezing of gait (Steidel et al., 2021). In addition, increased functional connectivity between the VTA and anterior cingulate cortex was related to depression in PD (Wei et al., 2018). We found that the QSM values in the left VTA were positively correlated with NMSS and HAMD scores, which provides further support that damaged VTA is a reason contributing to non-motor symptoms, especially depression, in PD patients.
We found that only the iron contents of left VTA, not right VTA, were significantly correlated with clinical symptoms in PD patients. This phenomenon is likely due to the asymmetry of motor symptoms as most of our PD patients had right-side onset (65 of 101 patients). As our RBD patients did not show significant motor symptoms, we could not define the more- and less-affected sides in RBD patients. Thus, we only performed between-group comparisons of QSM values on the left and right sides.
In RBD patients, the QSM values in the SNc were positively correlated with disease duration, which is consistent with our previous report (Sun et al., 2020) and indicates that iron deposition in the SNc increases with the progression of RBD. In addition, the QSM values in the SNc correlated with RBDQ-HK and BSIT scores. Olfactory dysfunction is associated with an increased risk of developing PD, and RBD patients with hyposmia are at high risk for converting to PD (Lyu et al., 2021). These results suggest that iron accumulation in the SNc is associated with the severity of RBD and may have the potential to predict the conversion to α-synucleinopathies, which needs to be proved in future longitudinal studies.
In the bilateral SNc, PD patients had significantly enhanced iron contents, which is consistent with previous studies (He et al., 2015; Guan et al., 2017; Bergsland et al., 2019; Ahmadi et al., 2020; Sun et al., 2020; Fu et al., 2021), and the QSM values were positively correlated with disease duration and the H & Y stage (Du et al., 2016; Fu et al., 2021). The QSM values were positively correlated with the MDS-UPDRS III and HAMD scores in the left SNc (He et al., 2015; Fu et al., 2021) as well as the AS scores in the right SNc. The enhanced iron might aggravate the dysfunction of the nigrostriatal pathway with disease progression and severity (Hare and Double, 2016), which exacerbates the motor and non-motor symptoms. These findings suggest that the QSM technique has the potential to be a neuroimaging marker of disease progression, which needs to be examined in future longitudinal studies.
There are some limitations in our study. First, this is a cross-sectional study, and longitudinal studies are needed to reveal the progress of iron deposition in the VTA and its relationship with clinical progression. Second, as we only had a small number of patients at the H & Y stage 4, the iron accumulation in the VTA in more advanced PD patients was not investigated in the current study.
5. Conclusion
Using the QSM, we demonstrate that the iron content in the VTA is not enhanced in the prodromal and early clinical stage of PD but becomes significantly increased as the disorder becomes more severe. Moreover, the iron deposition in the VTA is associated with the non-motor symptoms in PD. Our findings may help to understand the iron deposition in the VTA at different stages of PD and its relationship with clinical manifestations of PD.
Data availability statement
The raw data supporting the conclusions of this article will be made available by the authors, without undue reservation.
Ethics statement
The studies involving human participants were reviewed and approved by Institutional Review Board of Xuanwu Hospital of Capital Medical University (2011-27). The patients/participants provided their written informed consent to participate in this study.
Author contributions
DZ and JY contributed to the organization and execution of the research project. DZ drafted the manuscript. DZ, JY, JS, JW, and LC contributed to the acquisition, post-processing, and analysis of the data. TW and HH revised the manuscript. All authors contributed to the article and approved the submitted version.
Funding
This research was supported by the National Natural Science Foundation of China (82071423), the Fundamental Research Funds for the Central Universities (226-2023-00095), and the Open Research Fund of the State Key Laboratory of Cognitive Neuroscience and Learning.
Acknowledgments
The authors would like to thank the participants who have contributed to this research.
Conflict of interest
The authors declare that the research was conducted in the absence of any commercial or financial relationships that could be construed as a potential conflict of interest.
Publisher's note
All claims expressed in this article are solely those of the authors and do not necessarily represent those of their affiliated organizations, or those of the publisher, the editors and the reviewers. Any product that may be evaluated in this article, or claim that may be made by its manufacturer, is not guaranteed or endorsed by the publisher.
Supplementary material
The Supplementary Material for this article can be found online at: https://www.frontiersin.org/articles/10.3389/fnagi.2023.1187684/full#supplementary-material
Footnotes
References
Ahmadi, S. A., Botzel, K., Levin, J., Maiostre, J., Klein, T., Wein, W., et al. (2020). Analyzing the co-localization of substantia nigra hyper-echogenicities and iron accumulation in Parkinson's disease: a multi-modal atlas study with transcranial ultrasound and MRI. Neuroimage Clin. 26, 102185. doi: 10.1016/j.nicl.2020.102185
Alberico, S. L., Cassell, M. D., and Narayanan, N. S. (2015). The vulnerable ventral tegmental area in Parkinson's disease. Basal Ganglia 5, 51–55. doi: 10.1016/j.baga.2015.06.001
American Academy of Sleep Medicine (2014). International Classification of Sleep Disorders, 3rd Edn. Darien, IL: American Academy of Sleep Medicine.
Andrew, J. H., Susan, E. D., Linda, K., and Andrew, J. L. (1992). Accuracy of clinical diagnosis of idiopathic Parkinson's disease: a clinico-pathological study of 100 cases. J. Neurol. Neurosurg. Psychiatry 55, 181–184. doi: 10.1136/jnnp.55.3.181
Barbosa, J. H., Santos, A. C., Tumas, V., Liu, M., Zheng, W., Haacke, E. M., et al. (2015). Quantifying brain iron deposition in patients with Parkinson's disease using quantitative susceptibility mapping, R2 and R2. Magn. Reson. Imag. 33, 559–565. doi: 10.1016/j.mri.2015.02.021
Bergsland, N., Zivadinov, R., Schweser, F., Hagemeier, J., Lichter, D., and Guttuso, T. Jr. (2019). Ventral posterior substantia nigra iron increases over 3 years in Parkinson's disease. Mov. Disord. 34, 1006–1013. doi: 10.1002/mds.27730
Blum, D., Torch, S., Lambeng, N., Nissou, M.-F., Benabid, A.-L., Sadoul, R., et al. (2001). Molecular pathways involved in the neurotoxicity of 6-OHDA, dopamine and MPTP: contribution to the apoptotic theory in Parkinson's disease. Prog. Neurobiol. 65, 135–172. doi: 10.1016/S0301-0082(01)00003-X
Bonaccorsi di Patti, M. C., Cutone, A., Polticelli, F., Rosa, L., Lepanto, M. S., Valenti, P., et al. (2018). The ferroportin-ceruloplasmin system and the mammalian iron homeostasis machine: regulatory pathways and the role of lactoferrin. Biometals 31, 399–414. doi: 10.1007/s10534-018-0087-5
Castrioto, A., Thobois, S., Carnicella, S., Maillet, A., and Krack, P. (2016). Emotional manifestations of PD: neurobiological basis. Mov. Disord. 31, 1103–1113. doi: 10.1002/mds.26587
Du, G., Liu, T., Lewis, M. M., Kong, L., Wang, Y., Connor, J., et al. (2016). Quantitative susceptibility mapping of the midbrain in Parkinson's disease. Mov. Disord. 31, 317–324. doi: 10.1002/mds.26417
Fu, X., Deng, W., Cui, X., Zhou, X., Song, W., Pan, M., et al. (2021). Time-specific pattern of iron deposition in different regions in Parkinson's disease measured by quantitative susceptibility mapping. Front. Neurol. 12, 631210. doi: 10.3389/fneur.2021.631210
Guan, X., Xuan, M., Gu, Q., Huang, P., Liu, C., Wang, N., et al. (2017). Regionally progressive accumulation of iron in Parkinson's disease as measured by quantitative susceptibility mapping. NMR Biomed. 30, 3489. doi: 10.1002/nbm.3489
Hare, L. P., Ayton, S., Roberts, B. R., Grimm, R., George, J. L., Bishop, D. P., et al. (2014). An iron–dopamine index predicts risk of parkinsonian neurodegeneration in the substantia nigra pars compacta. Chem. Sci. 5, 2160–2169. doi: 10.1039/C3SC53461H
Hare, L. P., and Double, K. L. (2016). Iron and dopamine: a toxic couple. Brain 139, 1026–1035. doi: 10.1093/brain/aww022
He, N., Ling, H., Ding, B., Huang, J., Zhang, Y., Zhang, Z., et al. (2015). Region-specific disturbed iron distribution in early idiopathic Parkinson's disease measured by quantitative susceptibility mapping. Hum. Brain Mapp. 36, 4407–4420. doi: 10.1002/hbm.22928
Hung, H. C., and Lee, E. (1996). The mesolimbic dopaminergic pathway is more resistant than the nigrostriatal dopaminergic pathway to MPTP and MPP+ toxicity: role of BDNF gene expression. Mol. Brain Res. 41, 16–26. doi: 10.1016/0169-328X(96)00062-9
Hung, H. C., and Lee, E. (1998). MPTP produces differential oxidative stress and antioxidative responses in the nigrostriatal and mesolimbic dopaminergic pathways. Free Radic. Biol. Med. 24, 76–84. doi: 10.1016/S0891-5849(97)00206-2
Killilea, D., Wong, S., Cahaya, H., Atamna, H., and Ames, B. (2004). Iron accumulation during cellular senescence. Ann. N. Y. Acad. Sci. 1019, 365–367. doi: 10.1196/annals.1297.063
Lammel, S., Hetzel, A., Hackel, O., Jones, I., Liss, B., and Roeper, J. (2008). Unique properties of mesoprefrontal neurons within a dual mesocorticolimbic dopamine system. Neuron 57, 760–773. doi: 10.1016/j.neuron.2008.01.022
Li, W., Wu, B., Batrachenko, A., Bancroft-Wu, V., Morey, R. A., Shashi, V., et al. (2014). Differential developmental trajectories of magnetic susceptibility in human brain gray and white matter over the lifespan. Hum. Brain Mapp. 35, 2698–2713. doi: 10.1002/hbm.22360
Liang, C. L., Nelson, O., Yazdani, U., Pasbakhsh, P., and German, D. C. (2004). Inverse relationship between the contents of neuromelanin pigment and the vesicular monoamine transporter-2: human midbrain dopamine neurons. J. Comp. Neurol. 473, 97–106. doi: 10.1002/cne.20098
Lv, Z., Jiang, H., Xu, H., Song, N., and Xie, J. (2011). Increased iron levels correlate with the selective nigral dopaminergic neuron degeneration in Parkinson's disease. J. Neural Transm. 118, 361–369. doi: 10.1007/s00702-010-0434-3
Lyu, Z., Zheng, S., Zhang, X., Mai, Y., Pan, J., Hummel, T., et al. (2021). Olfactory impairment as an early marker of Parkinson's disease in REM sleep behaviour disorder: a systematic review and meta-analysis. J. Neurol. Neurosurg. Psychiatry 92, 271–281. doi: 10.1136/jnnp-2020-325361
Moos, T., Nielsen, T. R., Skjorringe, T., and Morgan, E. H. (2007). Iron trafficking inside the brain. J. Neurochem. 103, 1730–1740. doi: 10.1111/j.1471-4159.2007.04976.x
Morales, M., and Margolis, E. B. (2017). Ventral tegmental area: cellular heterogeneity, connectivity and behaviour. Nat. Rev. Neurosci. 18, 73–85. doi: 10.1038/nrn.2016.165
Mosharov, E. V., Larsen, K. E., Kanter, E., Phillips, K. A., Wilson, K., Schmitz, Y., et al. (2009). Interplay between cytosolic dopamine, calcium, and alpha-synuclein causes selective death of substantia nigra neurons. Neuron 62, 218–229. doi: 10.1016/j.neuron.2009.01.033
Nair-Roberts, R. G., Chatelain-Badie, S. D., Benson, E., White-Cooper, H., Bolam, J. P., and Ungless, M. A. (2008). Stereological estimates of dopaminergic, GABAergic and glutamatergic neurons in the ventral tegmental area, substantia nigra and retrorubral field in the rat. Neuroscience 152, 1024–1031. doi: 10.1016/j.neuroscience.2008.01.046
Ostrerova-Golts, N., Petrucelli, L., Hardy, J., Lee, J., Farer, M., and Wolozin, B. (2000). The A53T a-synuclein mutation increases iron-dependent aggregation and toxicity. J. Neurosci. 20, 6048–6054. doi: 10.1523/JNEUROSCI.20-16-06048.2000
Pan, P. Y., and Ryan, T. A. (2012). Calbindin controls release probability in ventral tegmental area dopamine neurons. Nat. Neurosci. 15, 813–815. doi: 10.1038/nn.3099
Pauli, W. M., Nili, A. N., and Tyszka, J. M. (2018). A high-resolution probabilistic in vivo atlas of human subcortical brain nuclei. Sci. Data 5, 180063. doi: 10.1038/sdata.2018.63
Ropper, A. H., Samuels, M. A., Klein, J., and Prasad, S. (2019). Adams And Victor's Principles Of Neurology. 11th Edn. New York, NY: McGraw-Hill Education Medical.
Schenck, C. H., Boeve, B. F., and Mahowald, M. W. (2013). Delayed emergence of a parkinsonian disorder or dementia in 81% of older men initially diagnosed with idiopathic rapid eye movement sleep behavior disorder: a 16-year update on a previously reported series. Sleep Med. 14, 744–748. doi: 10.1016/j.sleep.2012.10.009
Steidel, K., Ruppert, M. C., Palaghia, I., Greuel, A., Tahmasian, M., Maier, F., et al. (2021). Dopaminergic pathways and resting-state functional connectivity in Parkinson's disease with freezing of gait. Neuroimage Clin. 32, 102899. doi: 10.1016/j.nicl.2021.102899
Sun, J., Lai, Z., Ma, J., Gao, L., Chen, M., Chen, J., et al. (2020). Quantitative evaluation of iron content in idiopathic rapid eye movement sleep behavior disorder. Mov. Disord. 35, 478–485. doi: 10.1002/mds.27929
Trutti, A. C., Mulder, M. J., Hommel, B., and Forstmann, B. U. (2019). Functional neuroanatomical review of the ventral tegmental area. Neuroimage 191, 258–268. doi: 10.1016/j.neuroimage.2019.01.062
Uchida, Y., Kan, H., Sakurai, K., Inui, S., Kobayashi, S., Akagawa, Y., et al. (2020). Magnetic susceptibility associates with dopaminergic deficits and cognition in Parkinson's disease. Mov. Disord. 35, 1396–1405. doi: 10.1002/mds.28077
van der Vegt, J. P., Hulme, O. J., Zittel, S., Madsen, K. H., Weiss, M. M., Buhmann, C., et al. (2013). Attenuated neural response to gamble outcomes in drug-naive patients with Parkinson's disease. Brain 136, 1192–1203. doi: 10.1093/brain/awt027
Ward, R. J., Zucca, F. A., Duyn, J. H., Crichton, R. R., and Zecca, L. (2014). The role of iron in brain ageing and neurodegenerative disorders. Lancet Neurol. 13, 1045–1060. doi: 10.1016/S1474-4422(14)70117-6
Wei, H., Dibb, R., Zhou, Y., Sun, Y., Xu, J., Wang, N., et al. (2015). Streaking artifact reduction for quantitative susceptibility mapping of sources with large dynamic range. NMR Biomed. 28, 1294–1303. doi: 10.1002/nbm.3383
Wei, L., Hu, X., Yuan, Y., Liu, W., and Chen, H. (2018). Abnormal ventral tegmental area-anterior cingulate cortex connectivity in Parkinson's disease with depression. Behav. Brain Res. 347, 132–139. doi: 10.1016/j.bbr.2018.03.011
Wu, B., Li, W., Guidon, A., and Liu, C. (2012). Whole brain susceptibility mapping using compressed sensing. Magn. Reson. Med. 67, 137–147. doi: 10.1002/mrm.23000
Keywords: Parkinson's disease, ventral tegmental area (VTA), idiopathic rapid eye movement sleep behavior disorder (RBD), iron deposition, quantitative susceptibility mapping
Citation: Zhang D, Yao J, Sun J, Wang J, Chen L, He H and Wu T (2023) Iron accumulation in the ventral tegmental area in Parkinson's disease. Front. Aging Neurosci. 15:1187684. doi: 10.3389/fnagi.2023.1187684
Received: 16 March 2023; Accepted: 09 June 2023;
Published: 28 June 2023.
Edited by:
Muthuraman Muthuraman, University Hospital Würzburg, GermanyReviewed by:
Jifeng Guo, Central South University, ChinaMahmoud Iravani, University of Hertfordshire, United Kingdom
Copyright © 2023 Zhang, Yao, Sun, Wang, Chen, He and Wu. This is an open-access article distributed under the terms of the Creative Commons Attribution License (CC BY). The use, distribution or reproduction in other forums is permitted, provided the original author(s) and the copyright owner(s) are credited and that the original publication in this journal is cited, in accordance with accepted academic practice. No use, distribution or reproduction is permitted which does not comply with these terms.
*Correspondence: Tao Wu, wutao69@163.com; Hongjian He, hhezju@zju.edu.cn