 Tyson Dawson
 Uzma Rentia1†
 Carlos Cruchaga
 John S. K. Kauwe
 Keith A. Crandall
- 1Computational Biology Institute, The George Washington University, Washington, DC, United States
- 2Department of Biostatistics and Bioinformatics, Milken Institute School of Public Health, The George Washington University, Washington, DC, United States
- 3Department of Psychiatry, Washington University School of Medicine, St. Louis, MO, United States
- 4Department of Biology, Brigham Young University, Provo, UT, United States
Introduction: Human endogenous retroviruses (HERVs) are transcriptionally-active remnants of ancient retroviral infections that may play a role in Alzheimer’s disease.
Methods: We combined two, publicly available RNA-Seq datasets with a third, novel dataset for a total cohort of 103 patients with Alzheimer’s disease and 45 healthy controls. We use telescope to perform HERV quantification for these samples and simultaneously perform gene expression analysis.
Results: We identify differentially expressed genes and differentially expressed HERVs in Alzheimer’s disease patients. Differentially expressed HERVs are scattered throughout the genome; many of them are members of the HERV-K superfamily. A number of HERVs are correlated with the expression of dysregulated genes in Alzheimer’s and are physically proximal to genes which drive disease pathways.
Discussion: Dysregulated expression of ancient retroviral insertions in the human genome are present in Alzheimer’s disease and show localization patterns that may explain how these elements drive pathogenic gene expression.
1. Introduction
Alzheimer’s disease is a chronic neurodegenerative disease and the leading cause of dementia (Alzheimer’s Association, 2010); its precise pathogenesis is uncertain but involves neuroinflammation (Heneka et al., 2015), extracellular neuritic plaques comprised of misfolded amyloid-β peptides (Tiraboschi et al., 2004), and intracellular neurofibrillary tangles comprised of the microtubule-associated protein tau (Brion, 1998). Tau-mediated mechanisms have been associated with loss of genomic stability in affected neurons (Madabhushi et al., 2014) and with the activation of human endogenous retroviruses (HERVs) (Guo et al., 2018).
Human endogenous retroviruses (HERVs) are a constituent part of the human genome and comprise ∼8% of all human DNA sequences (Hoyt et al., 2022). HERV insertion and replication events have happened throughout evolutionary history (Bannert and Kurth, 2006; Feschotte and Gilbert, 2012). Though most HERVs remain largely neutralized from mutations and epigenetic control mechanisms (Groh and Schotta, 2017), they still retain transcriptional activity (Seifarth et al., 2005; Pehrsson et al., 2019) and serve cell-type-specific regulatory functions (Stauffer et al., 2004; Ohnuki et al., 2014; Buzdin et al., 2017). Indeed, among all the transposable elements, HERVs are the most enriched for apparent regulatory functions (Jacques et al., 2013; Sundaram et al., 2014). Systematic characterizations of the regulatory functions of HERVs are underway (Ito et al., 2017), but the regulatory relationships in particular diseases have yet to be robustly defined. HERV dysregulation has been observed in chronic inflammatory and neurodegenerative diseases including amyotrophic lateral sclerosis (Douville and Nath, 2014), multiple sclerosis (Perron et al., 1997; Mameli et al., 2012), and schizophrenia (Frank et al., 2005).
There are at least two ways in which tau-mediated HERV activation may play a role in the development of Alzheimer’s disease: through the upregulation of HERVs or via the mobilization of HERVs. Tau may be involved in chromatin remodeling around HERV sequences, making regions in which HERVs are found increasingly transcriptionally accessible (Sun et al., 2018). HERV-derived nucleic acids, especially double-stranded DNA — which is a highly immunogenic pathogen-associated molecular pattern — may trigger the activation of innate immunity, as may HERV-derived proteins such as env which share structural similarity to extant viral proteins. In multiple sclerosis, HERVs have been shown to trigger an immune response in vitro (Perron et al., 2001), perhaps, as has been suggested, through the production of proinflammatory cytokines via the engagement of CD14/TLR4. In amyotrophic lateral sclerosis, proinflammatory stimuli seem to activate HERVs which, in turn, produce additional pro-inflammatory stimuli, hinting at a possible positive feedback mechanism in which epigenetically de-repressed HERVs amplify abnormal immune responses. Not only might the transcription of HERVs themselves be involved in pathogenesis, but the corresponding accessibility of HERV sequences may allow for more frequent and persistent presence of transcriptomic machinery at these loci and facilitate the transcription of nearby genes. The structure of prototypical HERVs – in which long terminal repeat regions flank viral proteins gag, pro, pol and env – allow these sequences to serve as active promoters for flanking sequences. The constituent loss of homeostatic balance that arises from this upregulation of HERV-proximal genes may contribute in some way to the Alzheimer’s disease phenotype.
Recent studies have shed light on the possible role of the HERV-K and HERV-W env genes in neurodegenerative diseases, including Alzheimer’s disease (Antony et al., 2004; Perron et al., 2005; Li et al., 2015; Ibba et al., 2018). Human toll-like receptor (TLR) 8 is responsive to a GUUGUGU motif found within the env gene of some HERV-K(HML-2) elements. Activation of hTLR8 upon binding to the env gene induces the canonical TLR pathway, ultimately leading to neuronal apoptosis, increased microglia, and the release of proinflammatory molecules including interferon. Such a process could contribute to phenotypic changes characteristic of Alzheimer’s disease. Analysis of transcriptomic data from brain samples pointed to a correlation between upregulated HERV-K and TLR8 expression in the temporal cortex of Alzheimer’s disease patients compared to age-matched controls (Dembny et al., 2020).
The role of HERVs in Alzheimer’s disease has been explored at least since the early 2000’s (Johnston et al., 2001) but, until now, studies have failed to quantify HERVs in both a high-throughput and locus-specific manner. Telescope is a tool that uses Bayesian reassignment to accurately classify HERV expression from RNA-Seq data (Bendall et al., 2019). Critically, telescope differs from other tools because it is able to estimate expression at locus-specific insertions rather than at the broad, subfamily level. Such accuracy allows us, for the first time, to comprehensively probe the expression of HERVs in Alzheimer’s disease.
2. Materials and methods
2.1. RNA-Seq datasets
Here, we employ the use of three datasets. The first is from a heretofore unpublished cohort from Washington University, henceforth known as the WashU data. The study has been approved by the Institutional Review Board (Approval number: 201109148). Description of the data and raw data can be found at NIAGADS, dataset #00038.1 For this cohort RNA was extracted from the Parietal cortex and RNA-Seq was generated using a Ribo-zero library with 30 million 150 × 2 reads (Del-Aguila et al., 2019; Dube et al., 2019; Li et al., 2020).
Participants in this study have provided written consent for providing their samples and clinical and demographic metadata. The other two datasets are publicly available via SRA: PRJEB28518 and PRJNA670209 (Nativio et al., 2020). PRJEB28518 used samples collected from post-mortem human brain samples collected at Seoul National University. PRJNA670209 used samples from frozen postmortem brain tissue from the Center for Neurodegenerative Disease Research brain bank (at UPenn) from both young and old patients sequenced on a NextSeq 500 machine.
2.2. RNA-Seq HERV identification and expression
Here, we use telescope (Bendall et al., 2019) to perform locus specific HERV quantification from RNA-Seq data. Telescope deals with the ambiguous mapping of repetitive HERV sequences by employing a Bayesian mixture model and expectation-maximization algorithm to reassign ambiguously mapped RNA-Seq fragments to the most likely locus of origin, thereby facilitating accurate, locus-specific HERV quantification. Our software pipeline uses fastQC (Andrews, 2010) to check for sequence quality, Trimmomatic (Bolger et al., 2014) to trim reads, then Bowtie2 (Langmead and Salzberg, 2012) to align reads to the Hg38 reference genome (GRCh38_no_alt_analysis_set_GCA_000001405.15) using the very-sensitive-local setting and allowing for a maximum of 100 alignments per read (–very-sensitive-local -k 100 –score-min L, 0, 1.6). The alignment files generated by Bowtie2 are fed into telescope which then uses the aforementioned Bayesian reassignment using up to 200 iterations of an expectation-maximization algorithm which has been modified to identify transposable elements (TEs) (–max_iter 200 –theta_prior 200000). With telescope, TEs are inferred when the hallmark genomic signatures of such elements are identified, including 5′ and 3′ long terminal repeats (LTRs) with an open reading frame between, thus inferring a functional TE. A total of 14,968 HERVs have thus been identified in the human genome and their annotation can be found at https://github.com/mlbendall/telescope_annotation_db/tree/master/builds/retro.hg38.v1. The output generated by telescope is a table of TEs (labeled by chromosomal location) and their expression as count values which are used in subsequent, downstream analyses.
2.3. RNA-Seq host gene expression
Host gene expression analysis was performed using fastQC for quality control, Trimmomatic for trimming of adapters and low-quality sequences, STAR (Dobin et al., 2013) for alignment, and FeatureCounts (Liao et al., 2014) for enumeration of transcripts.
2.4. Integrated gene and HERV expression
Arboreto (Moerman et al., 2019) was used to identify gene regulatory networks; specifically, it was used to identify those transcripts which show a high degree of correlation to each other. Variance-stabilization transformed counts of gene and HERV transcripts were used as input to Arboreto. The output was filtered to show those associations that existed between genes and HERVs (excluding HERV-HERV associations and gene-gene associations). Top associations, ranked by feature importance, were visualized in R using ggplot2.
2.5. Differential expression analysis
To account for sex-specific variance, genes that map to the Y chromosome were removed from the raw data. Batch effects associated with the provenance of the three datasets were removed using the ComBat-Seq function of the sva package in R v3.42.0 (Leek et al., 2012). Elements with low and consistent expression (which likely generate an uninformative signal and inflate adjusted p-values) were removed with the R package HTS Filter v1.34.0 which uses a Jaccard index filter to dynamically derive cutoff values to screen out uninformative transcriptomic data (Rau et al., 2013). Differential expression analysis comparing Alzheimer’s data to normal samples was performed with DESeq2 v1.34.0 using a significance cutoff of p = 0.05 and condition (Alzheimer’s or normal brain tissue) as factors in the DESeq model (Love et al., 2014). The R package ggplot2 v3.3.5 (Wickham, 2016) was used to visualize volcano plots, and the circlize v0.4.14 (Gu et al., 2014) package was used to visualize circos plots of differential HERV expression.
2.6. Proximal gene set enrichment and pathway analysis
Human endogenous retroviruses (HERVs) have been proposed as regulators that act on proximally-located genes (Buzdin et al., 2006; Rebollo et al., 2012; Sundaram et al., 2014; Yu et al., 2023). With this in mind, we sought to perform gene set enrichment analysis of those genes which were in the genomic neighborhood of the differentially expressed HERVs that were revealed in our analysis. Genes which flank or are intersected by HERVs have been documented for our telescope HERV annotation, available here: https://github.com/liniguez/telescope_metaannotations. Using an R script, differentially expressed HERVs were programmatically mapped to their closest upstream, downstream, and, in relevant cases, intersecting genes. The coefficient values associated with HERVs were assigned to their flaking/intersecting genes and these values were used as an input to omePath,2 a generic tool for pathway enrichment analysis that allows users to calculate importance scores for omics features (i.e., expression of genes and HERVs) appropriate for their study design (e.g., adjusting for multivariable testing and confounding factors). Here, we use omePath with a gene ontology (GO) biological process reference database (The Gene Ontology Consortium, 2019) for mapping omics features to pathways. omePath identifies which pathways have significant associations with the underlying features by performing statistical tests using the feature scores in the pathways against all ranks to calculate a p-value and false discovery rate (FDR) for hypothesis testing.
3. Results
In this study, we use three datasets, two are publicly available and the third we publish as part of this paper (Table 1). We report that our samples had a median read count of ∼30 million and the median sample had 150,000 reads map to HERV sequences (Supplementary Figure 1). The HERV families with the most mapped reads were HERVL and ERVLE.
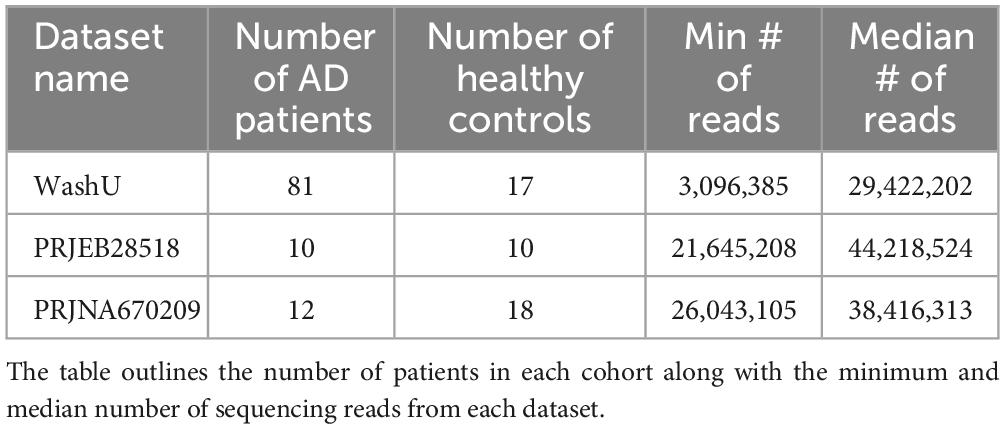
Table 1. Brief description of datasets.
Due to the different provenance of our three datasets, we first sought to perform batch effect correction using ComBat-Seq on the count values of our HERV expression matrices. An initial PCA (principal component analysis) was performed before batch effect correction and, as expected, samples were clearly separated–not only by disease status but, more worryingly, by provenance (Figures 1A–C). After performing batch effect correction, samples were re-analyzed using the same PCA method and data provenance was no longer such a prominent factor (Figures 1D–F). With our count values thus corrected across our three datasets, we proceeded to the next analysis step.
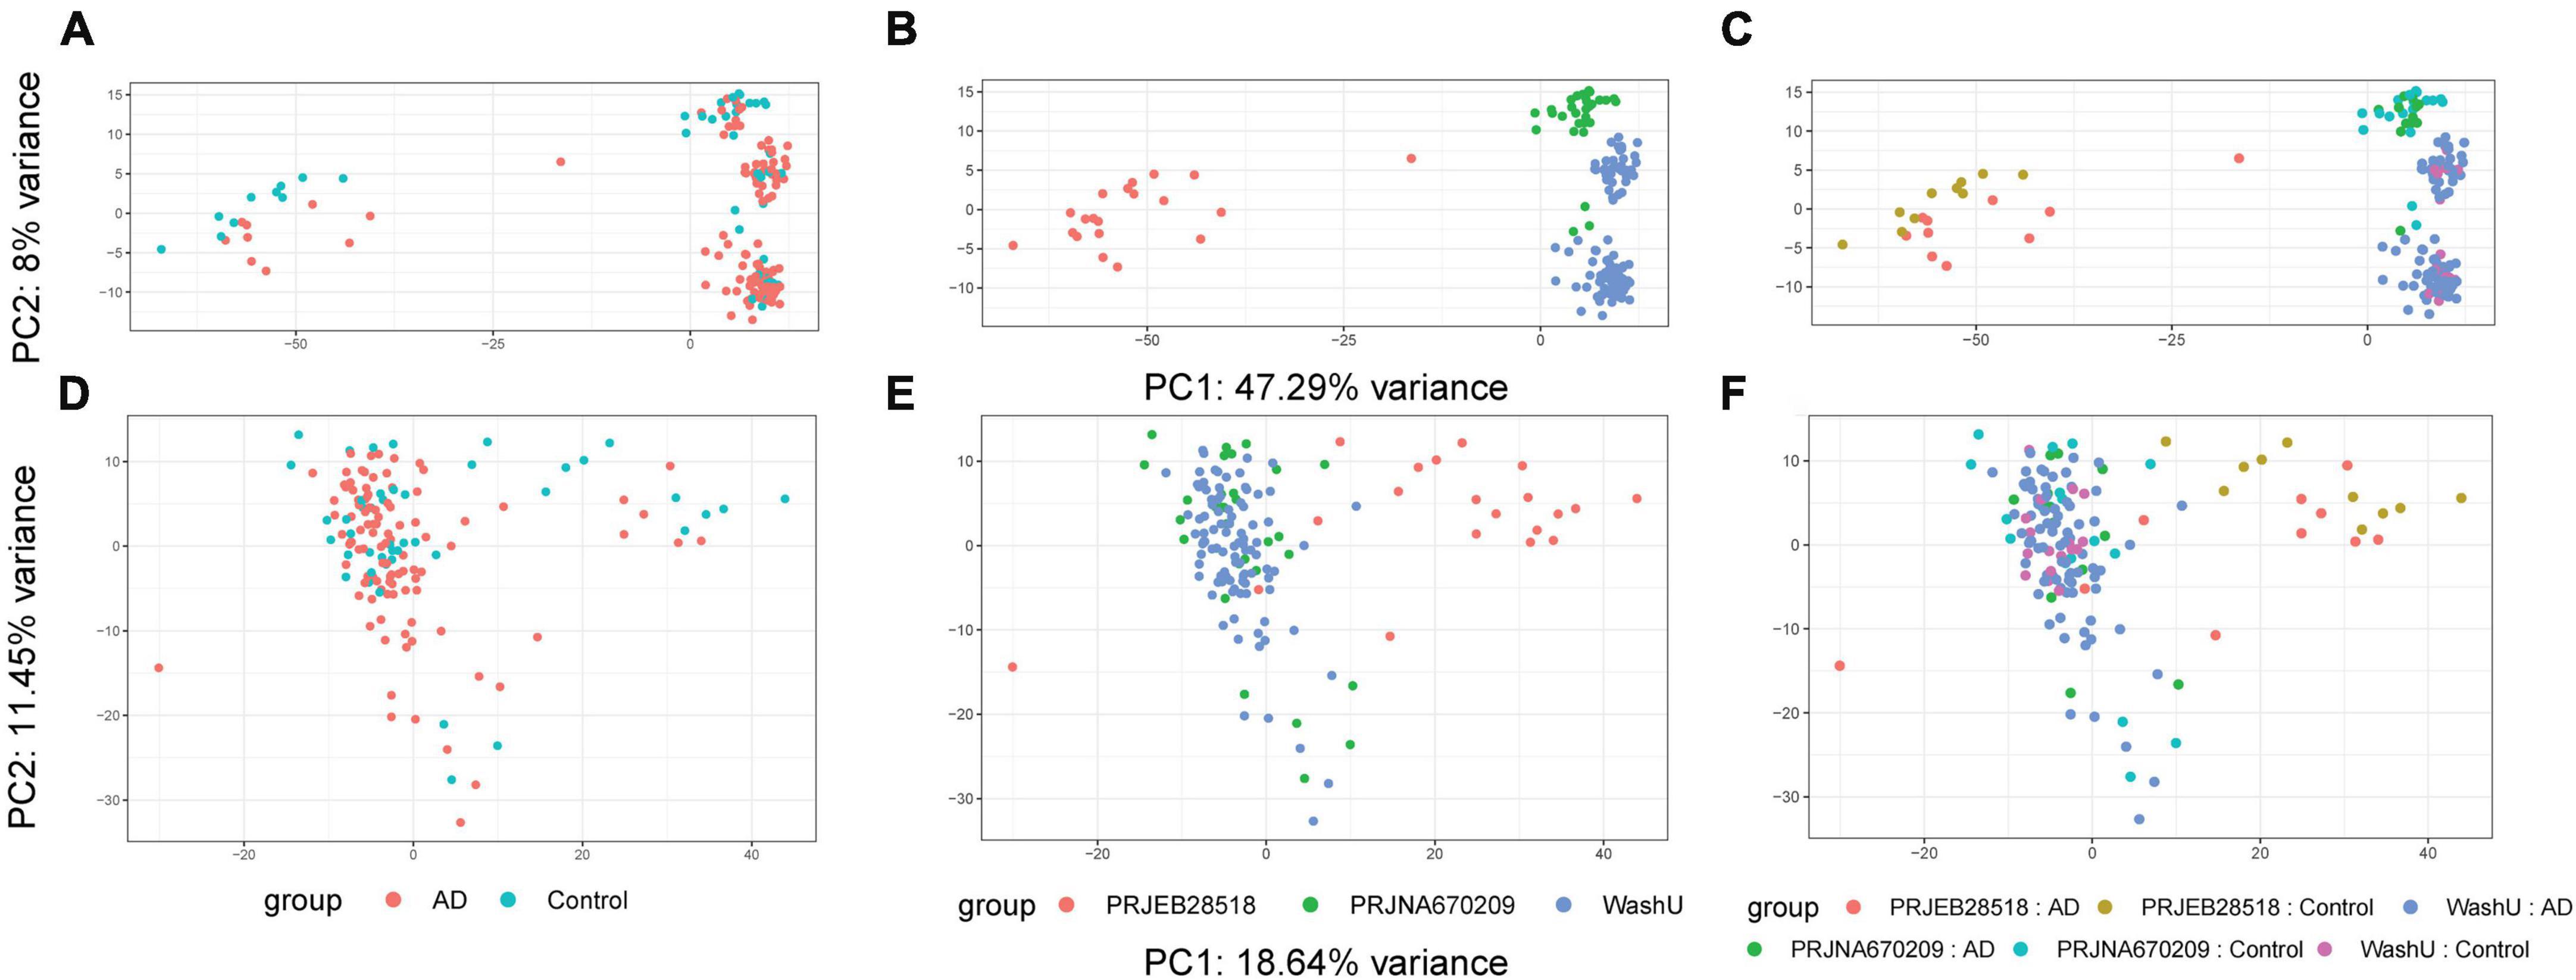
Figure 1. Results of batch effect correction on data structure shown via PCA. Before and after batch correction. Prior to batch correction using ComBat-Seq, much of the variance could be attributed to the provenance of the data sets. (A) PCA plot before batch effect correction colored by group. (B) PCA plot before batch effect correction colored by source. (C) PCA plot before batch effect correction colored by group and source. (D) PCA plot after batch effect correction colored by group. (E) PCA plot after batch effect correction colored by source. (F) PCA plot before batch effect correction colored by group and source.
Telescope quantified 13,666 distinct HERV loci expressed across the patients in our dataset. We performed differential expression using DESeq2 analysis on these HERVs between healthy and diseased patients. Doing so, we identified 698 HERVs that were differentially expressed (FDR adjusted p-value < 0.2) between Alzheimer’s and normal brain samples. Of the 698 elements, 187 were downregulated and 511 were upregulated (Figure 2).
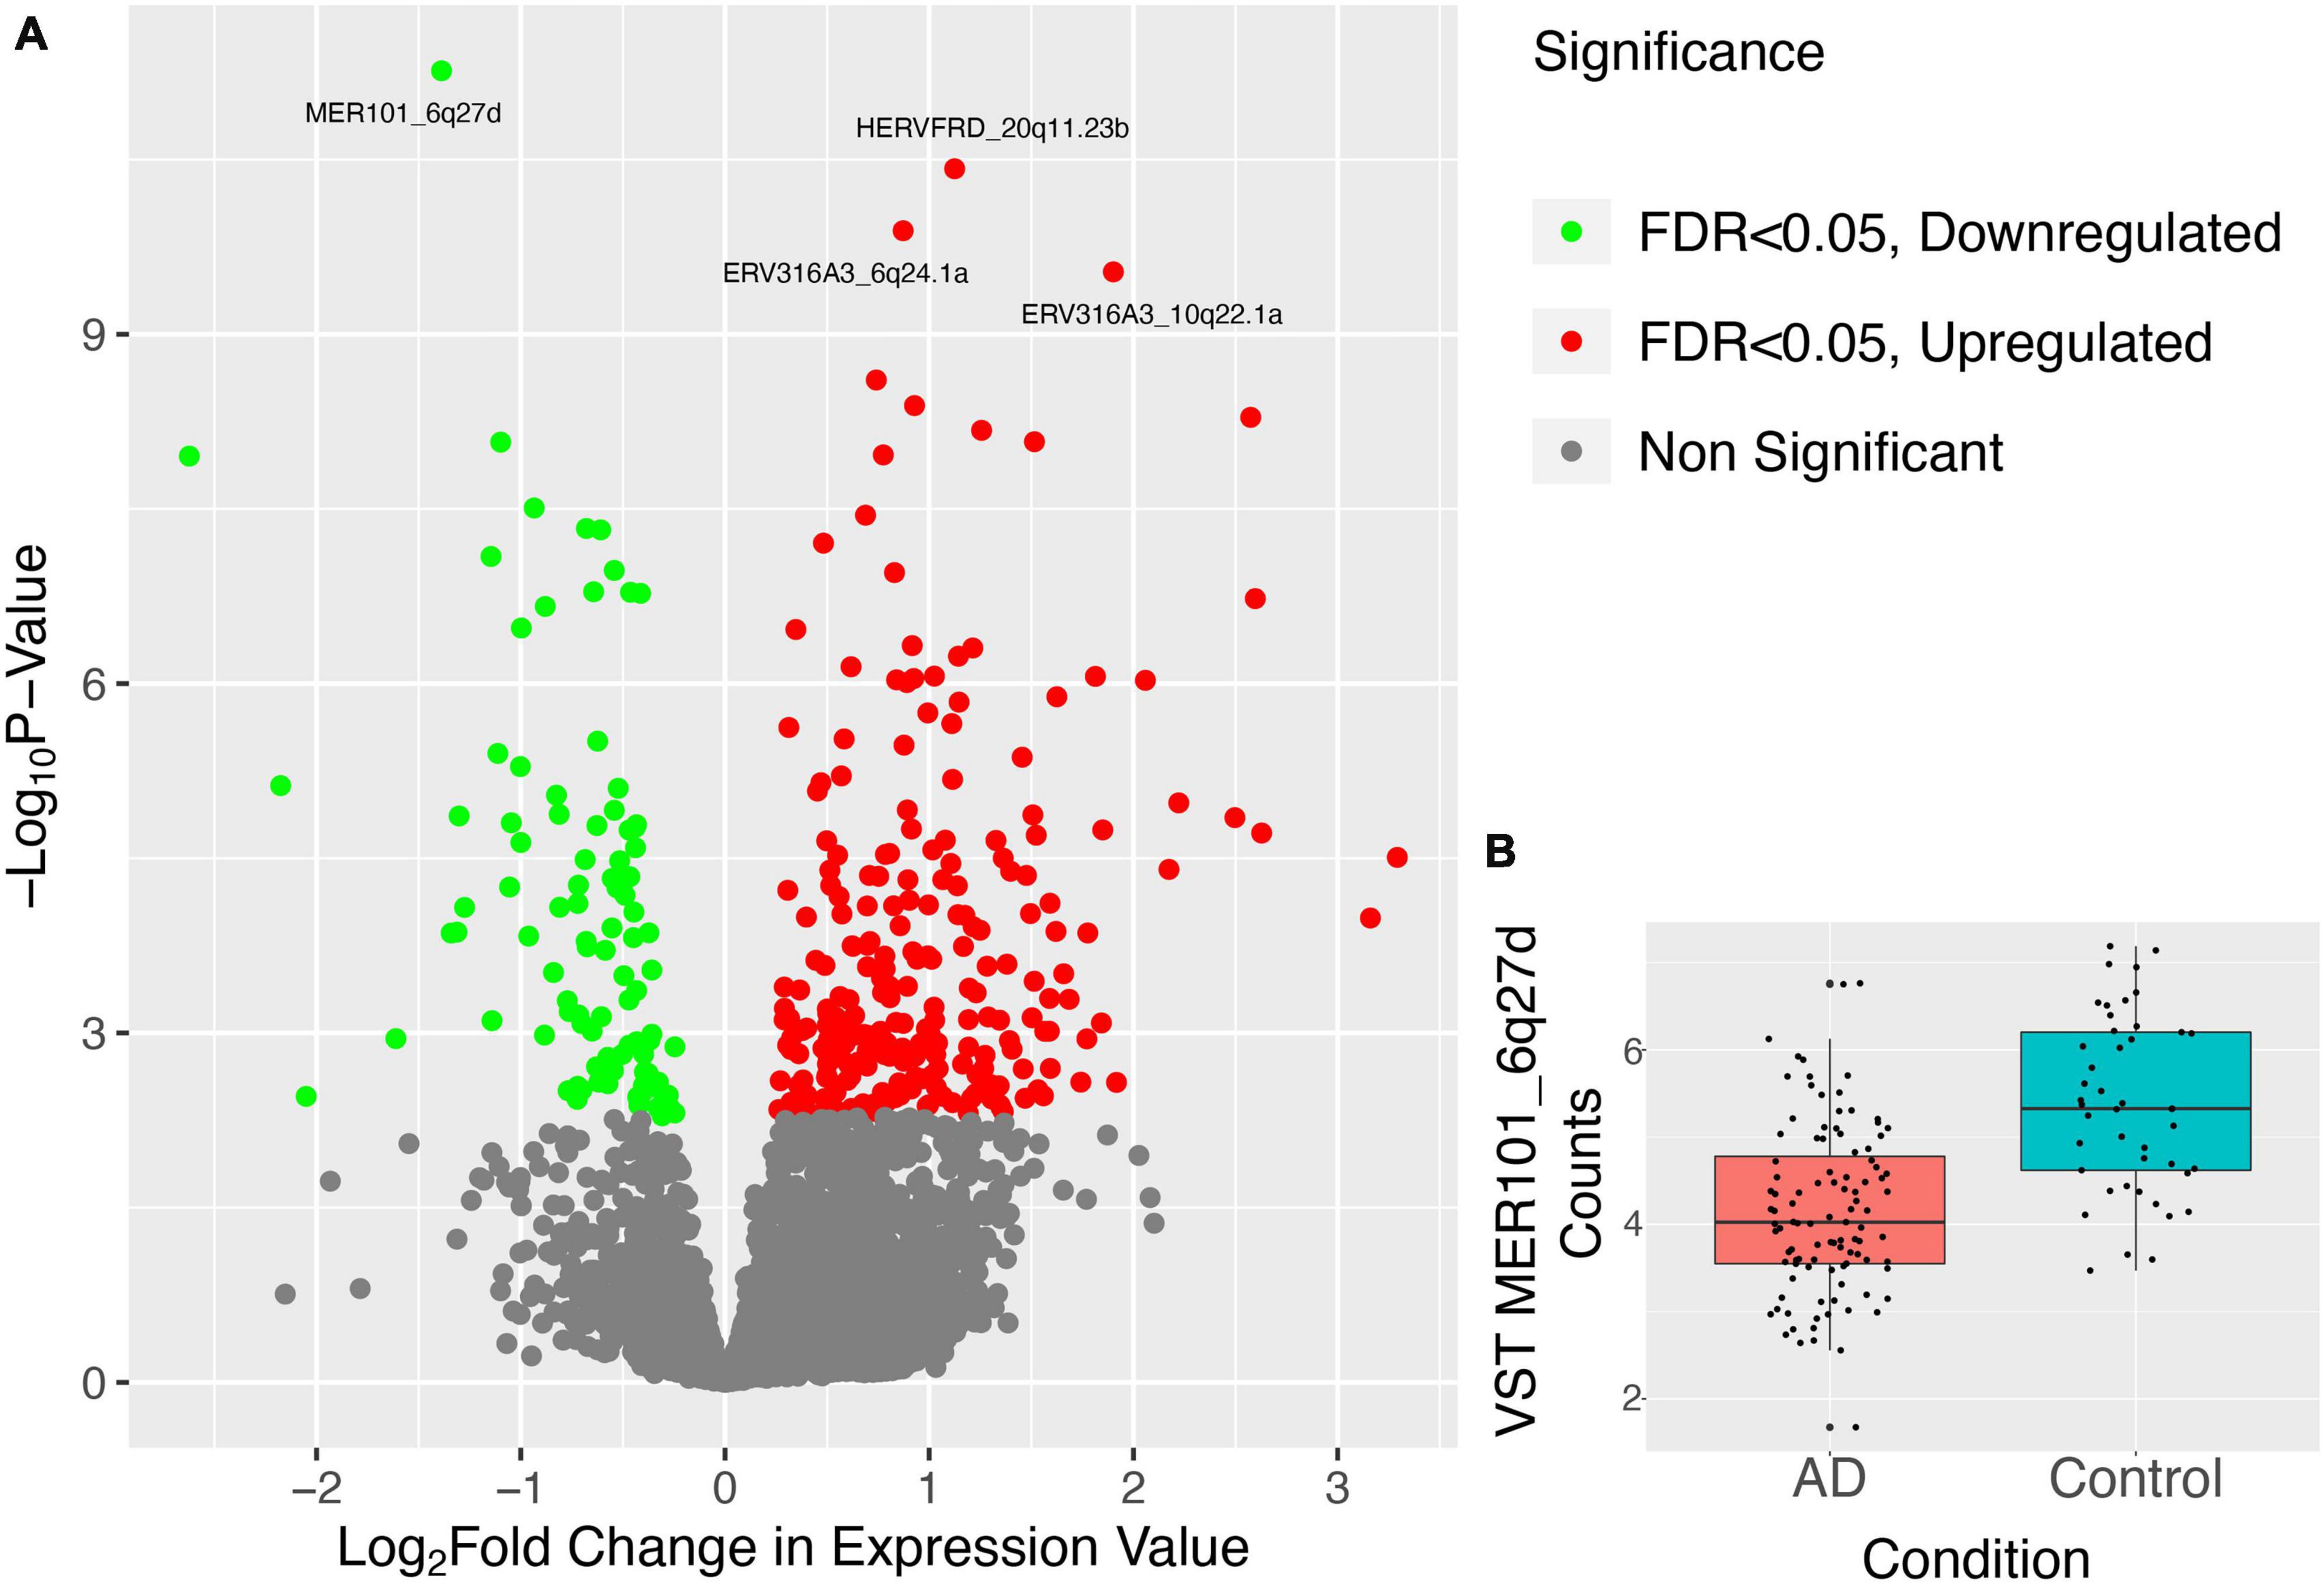
Figure 2. Results of differential expression analysis of HERVs in combined Alzheimer’s dataset. (A) Points in the volcano plot are individual HERV loci, their X-axis position represents their log2 fold change and their Y-axis position represents the –log10 of the p-value. Thus, HERVs higher on the plane and further to the edges represent more significantly aberrantly expressed HERVs where the bright green HERVs are those which have a FDR < 0.05 and are downregulated and the bright red HERVs are those which have a FDR < 0.05 and are upregulated. The top 4 most DE HERVs, ranked by p-value, are labeled. (B) Variance-stabilizing transformed counts of the most DE HERV, MER101_6q27d, are shown in box plots separated into two categories, AD patients and healthy controls.
As previously mentioned, HERVs can be divided into functional families. We sought to identify which families (if any) were disproportionately represented among the 698 significantly differentially expressed HERVs we identified. Indeed, members of HERV families including HML4, HARLEQUIN, HERVFC1, HERVK11D, HERVK11 are over-represented in the differentially expressed HERVs (Figure 3).
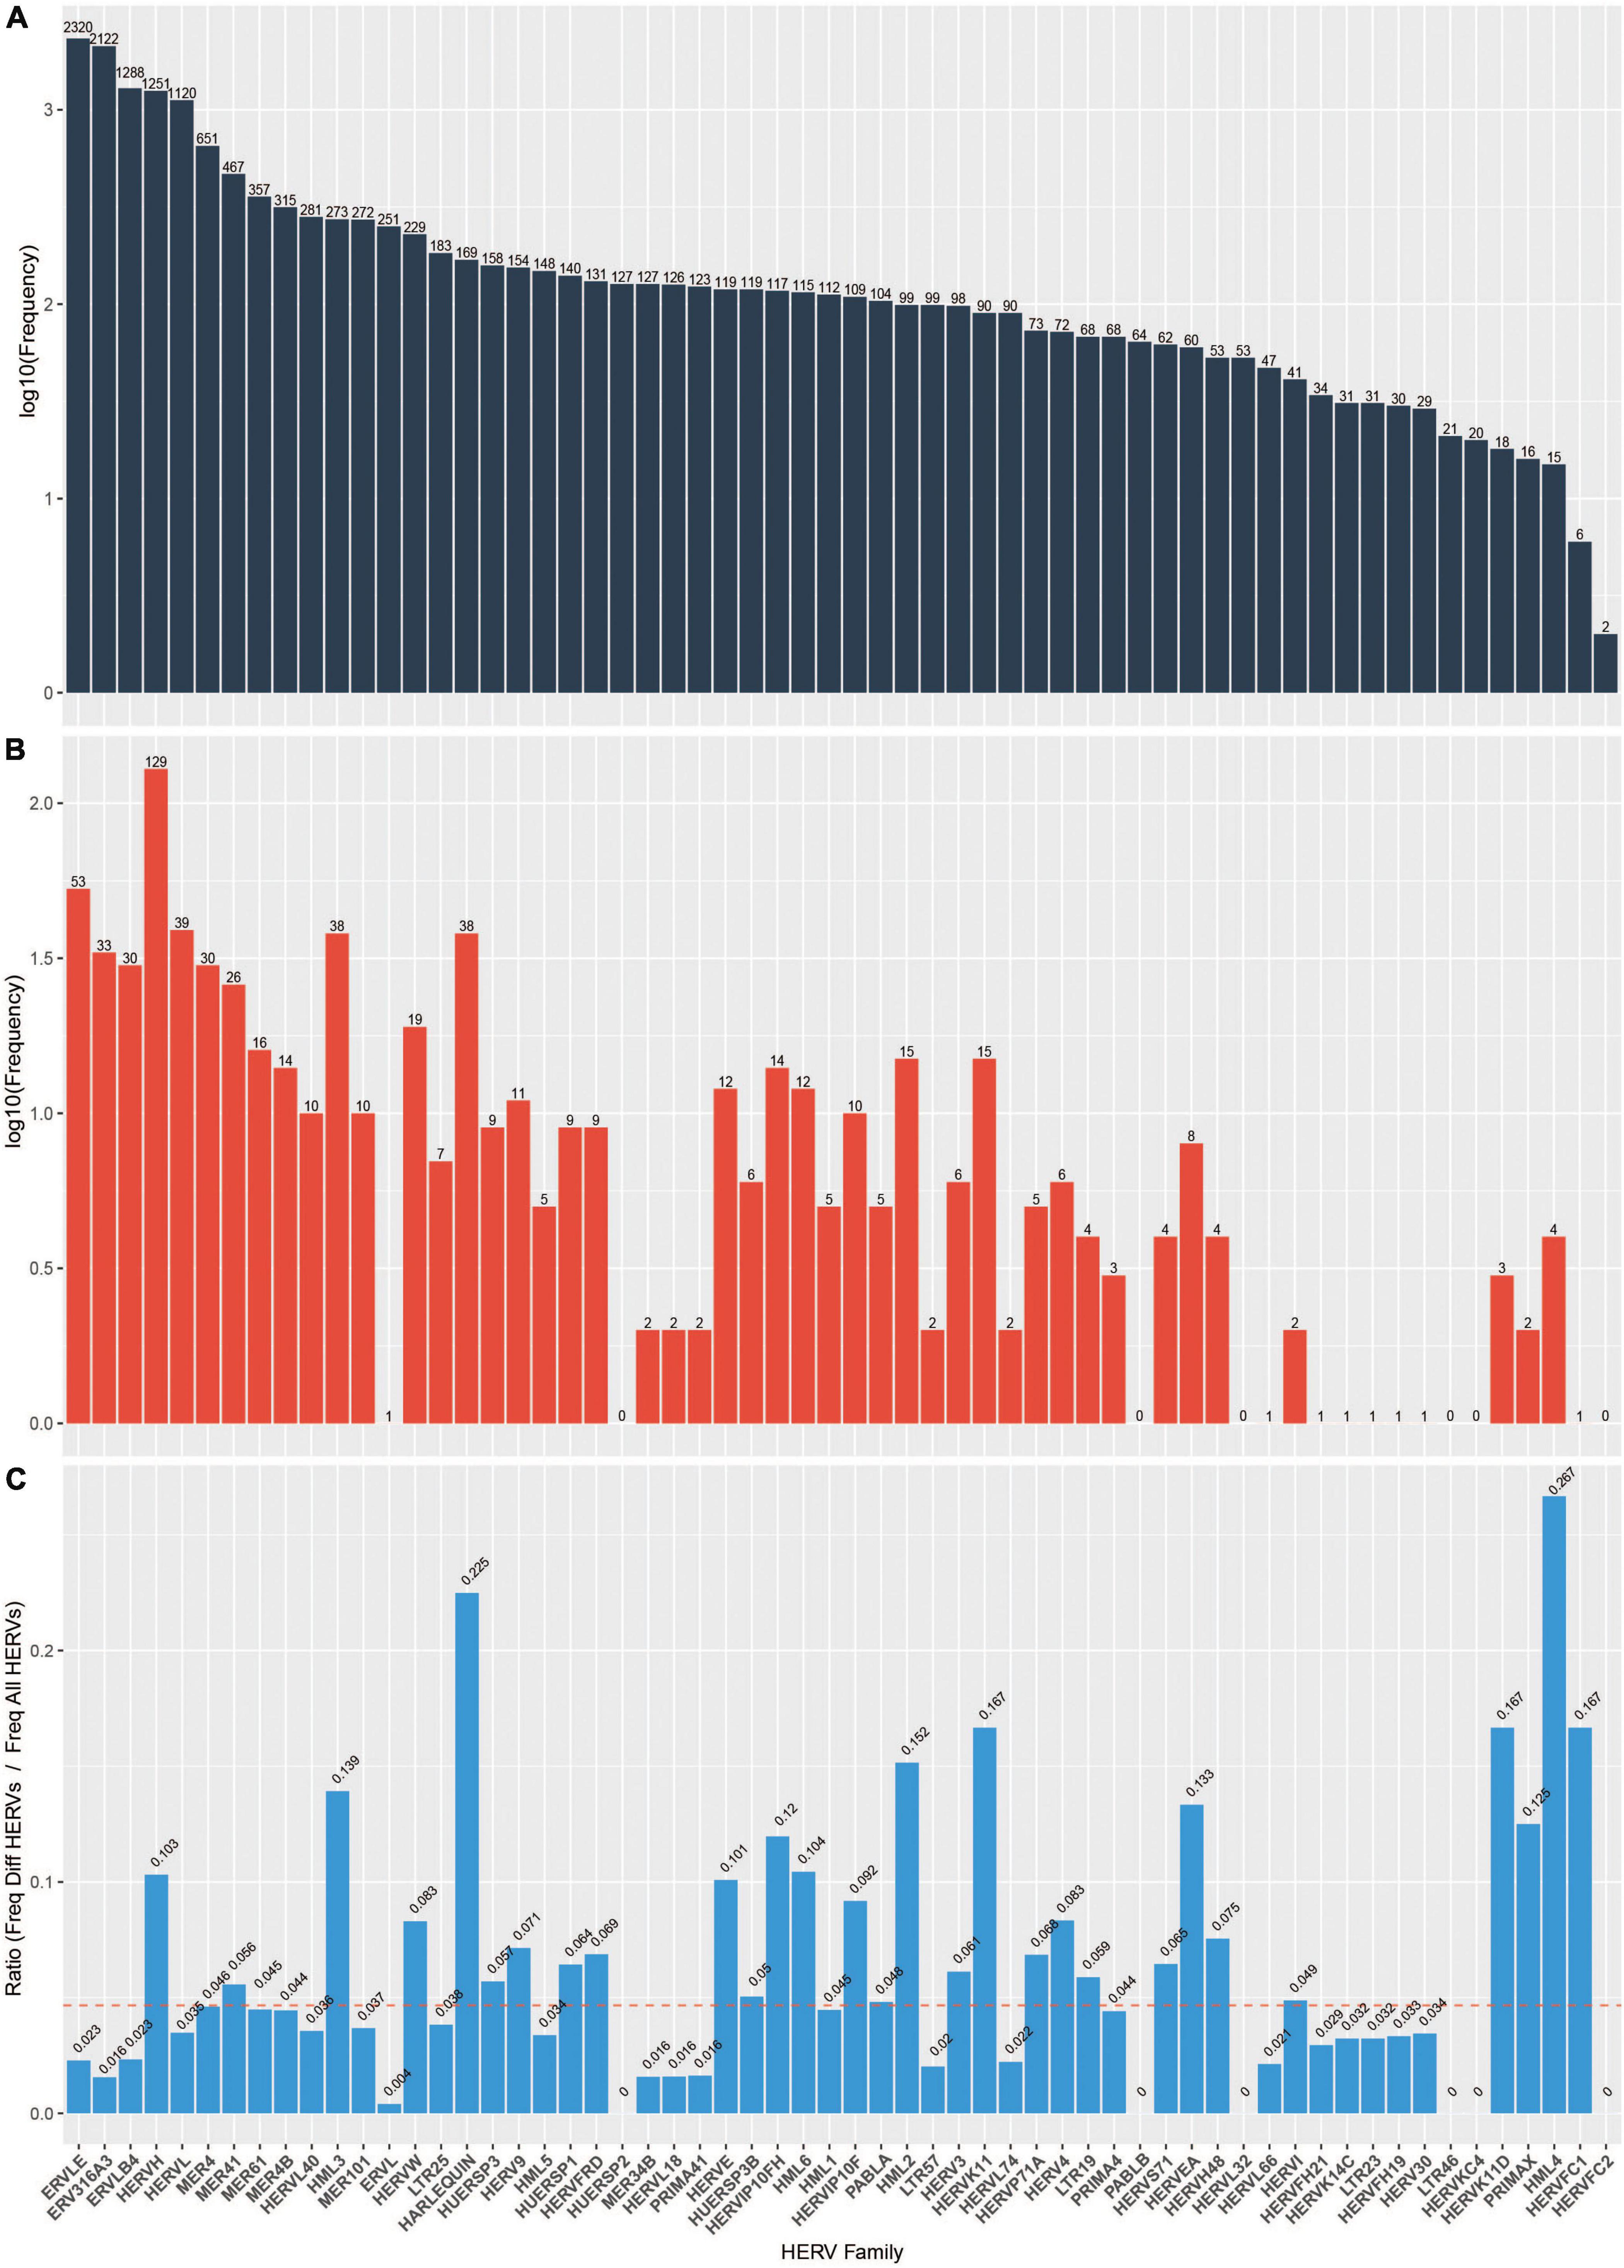
Figure 3. HERV frequency by family. (A) log10 frequency of HERV families in the database (B) log10 frequency of HERV families among the DE HERVs in our analysis (C) Ratio of frequency of DE HERVs in our analysis divided by frequency in the database. Dashed red line indicates the expected ratio (i.e., total number of HERVs in the database divided by total number of DE HERVs).
Because HERVs are dispersed throughout the human genome, we sought to identify whether particular genomic regions harbored a disproportionate number of differentially expressed HERVs. Significantly differentially expressed HERVs were scattered throughout the genome and showed no obvious pattern of chromosomal over-representation (Supplementary Figure 2).
Because HERVs are hypothesized to act as transcriptional regulators, especially for proximal genes, we chose to investigate whether HERVs play a role in activating genes that drive Alzheimer’s disease. We queried the role of neighboring genes using a gene enrichment analysis. We identify pathways that are significantly enriched using this set of genes proximal to dysregulated HERVs (Figure 4).
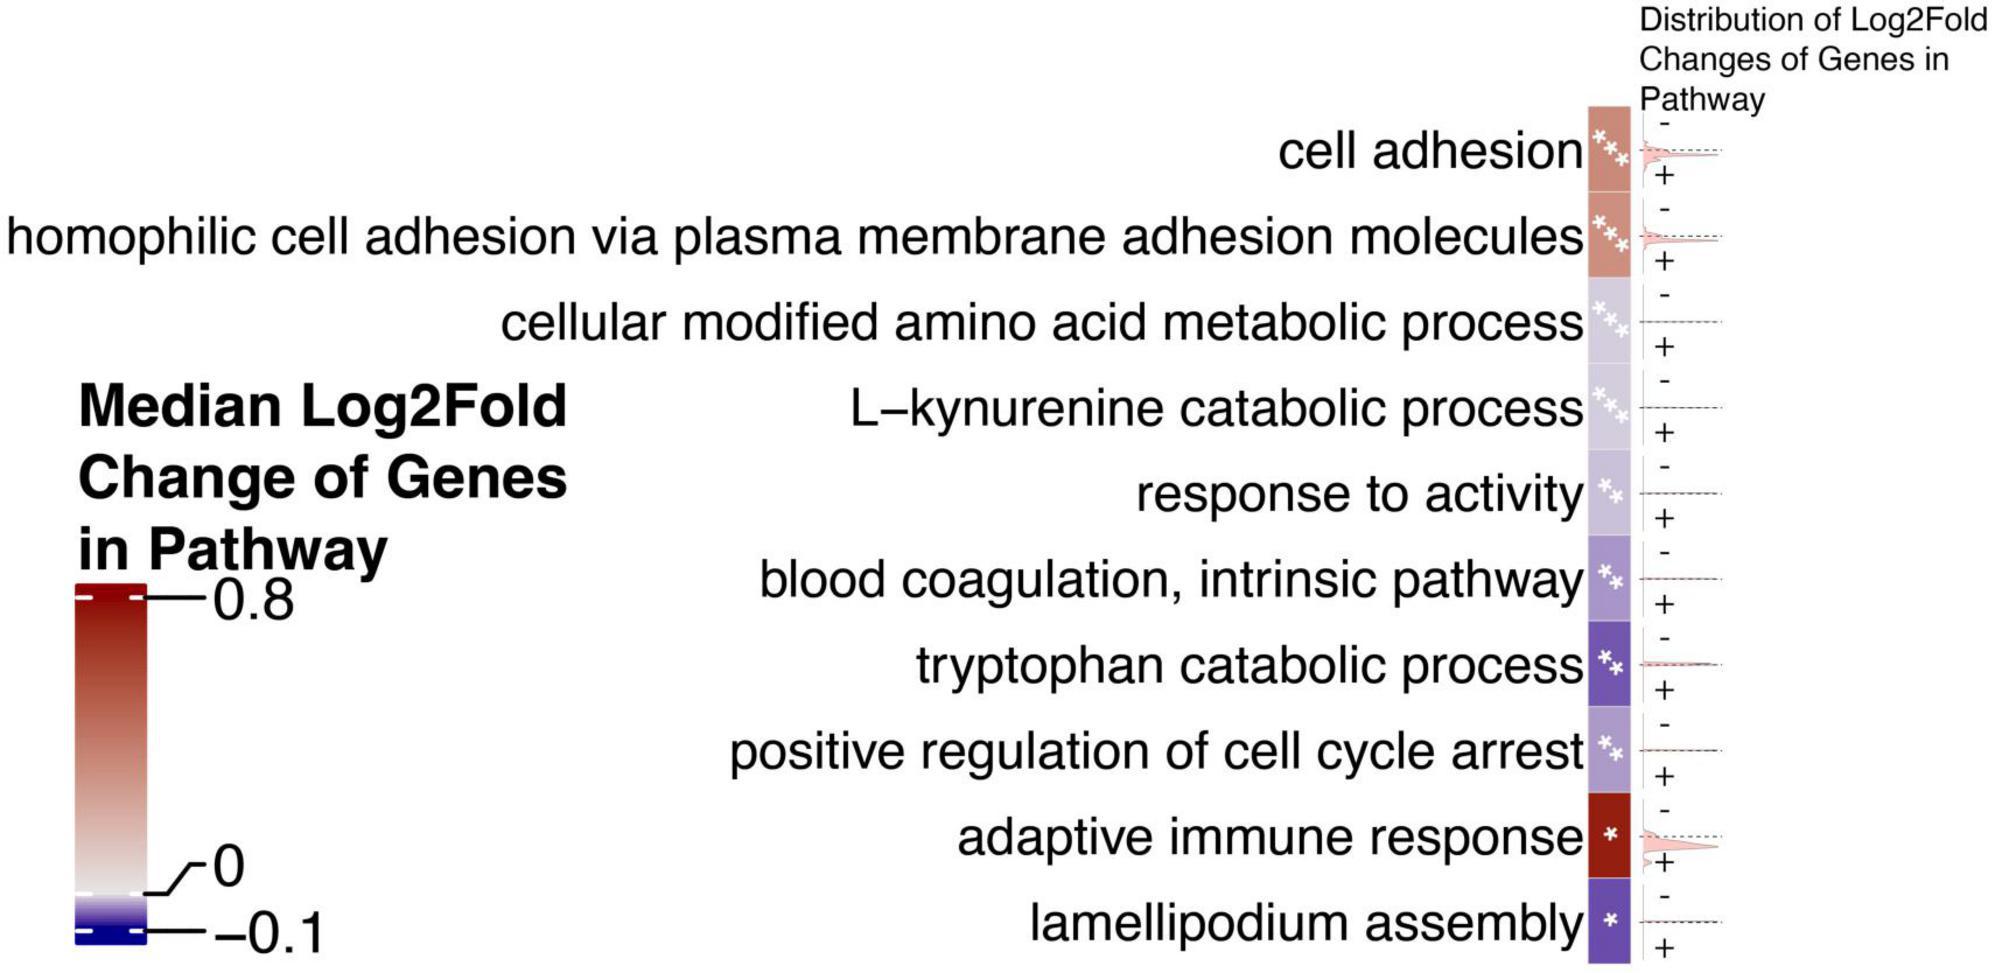
Figure 4. Gene set enrichment analysis of genes proximal to differentially expressed HERVs reveals dysregulated pathways that may be at play in AD. The top 10 most significant pathways, ranked by p-value are shown. Cells which contain one asterisk (*) represent pathways with p-values less than 0.05 but greater than 0.005. Cells which contain two asterisks (**) represent pathways with p-values less than 0.005 but greater than 0.001. Cells which contain three asterisks (***) represent pathways with p-values less than 0.001. Cells are annotated on the right with density plots showing the distribution of the log2 fold changes of genes in a given pathway. Cells are colored by the median log2 fold change of genes in the pathway to indicate the general directionality of the pathway in AD.
To further explore patterns identified in previous research that show HERVK molecules as playing a particularly important role in modulating biological processes in Alzheimer’s patients, we conducted a correlation analysis between the quantification of HERVK molecules and the expression of TLR-8 as well as the summed expression of genes that comprise an interferon signature (Catalina et al., 2019; Supplementary Table 2). We note that HERVK expression tends to positively correlate with expression of both TLR-8 and interferon signature genes (Figure 5) but that only a subset of HERVK loci are significantly correlated with either (Supplementary Figure 3). We also report that significant correlation patterns with TLR-8 and HERVK expression are absent at the family level. Specifically, the sum of neither HML1, HML2, HML3, HML4, HML5, HML6, HERVK11, HERVK11D, nor HERVKC4 elements, each families within the superfamily of HERVK, are significantly correlated with TLR-8 expression (Supplementary Figure 4).
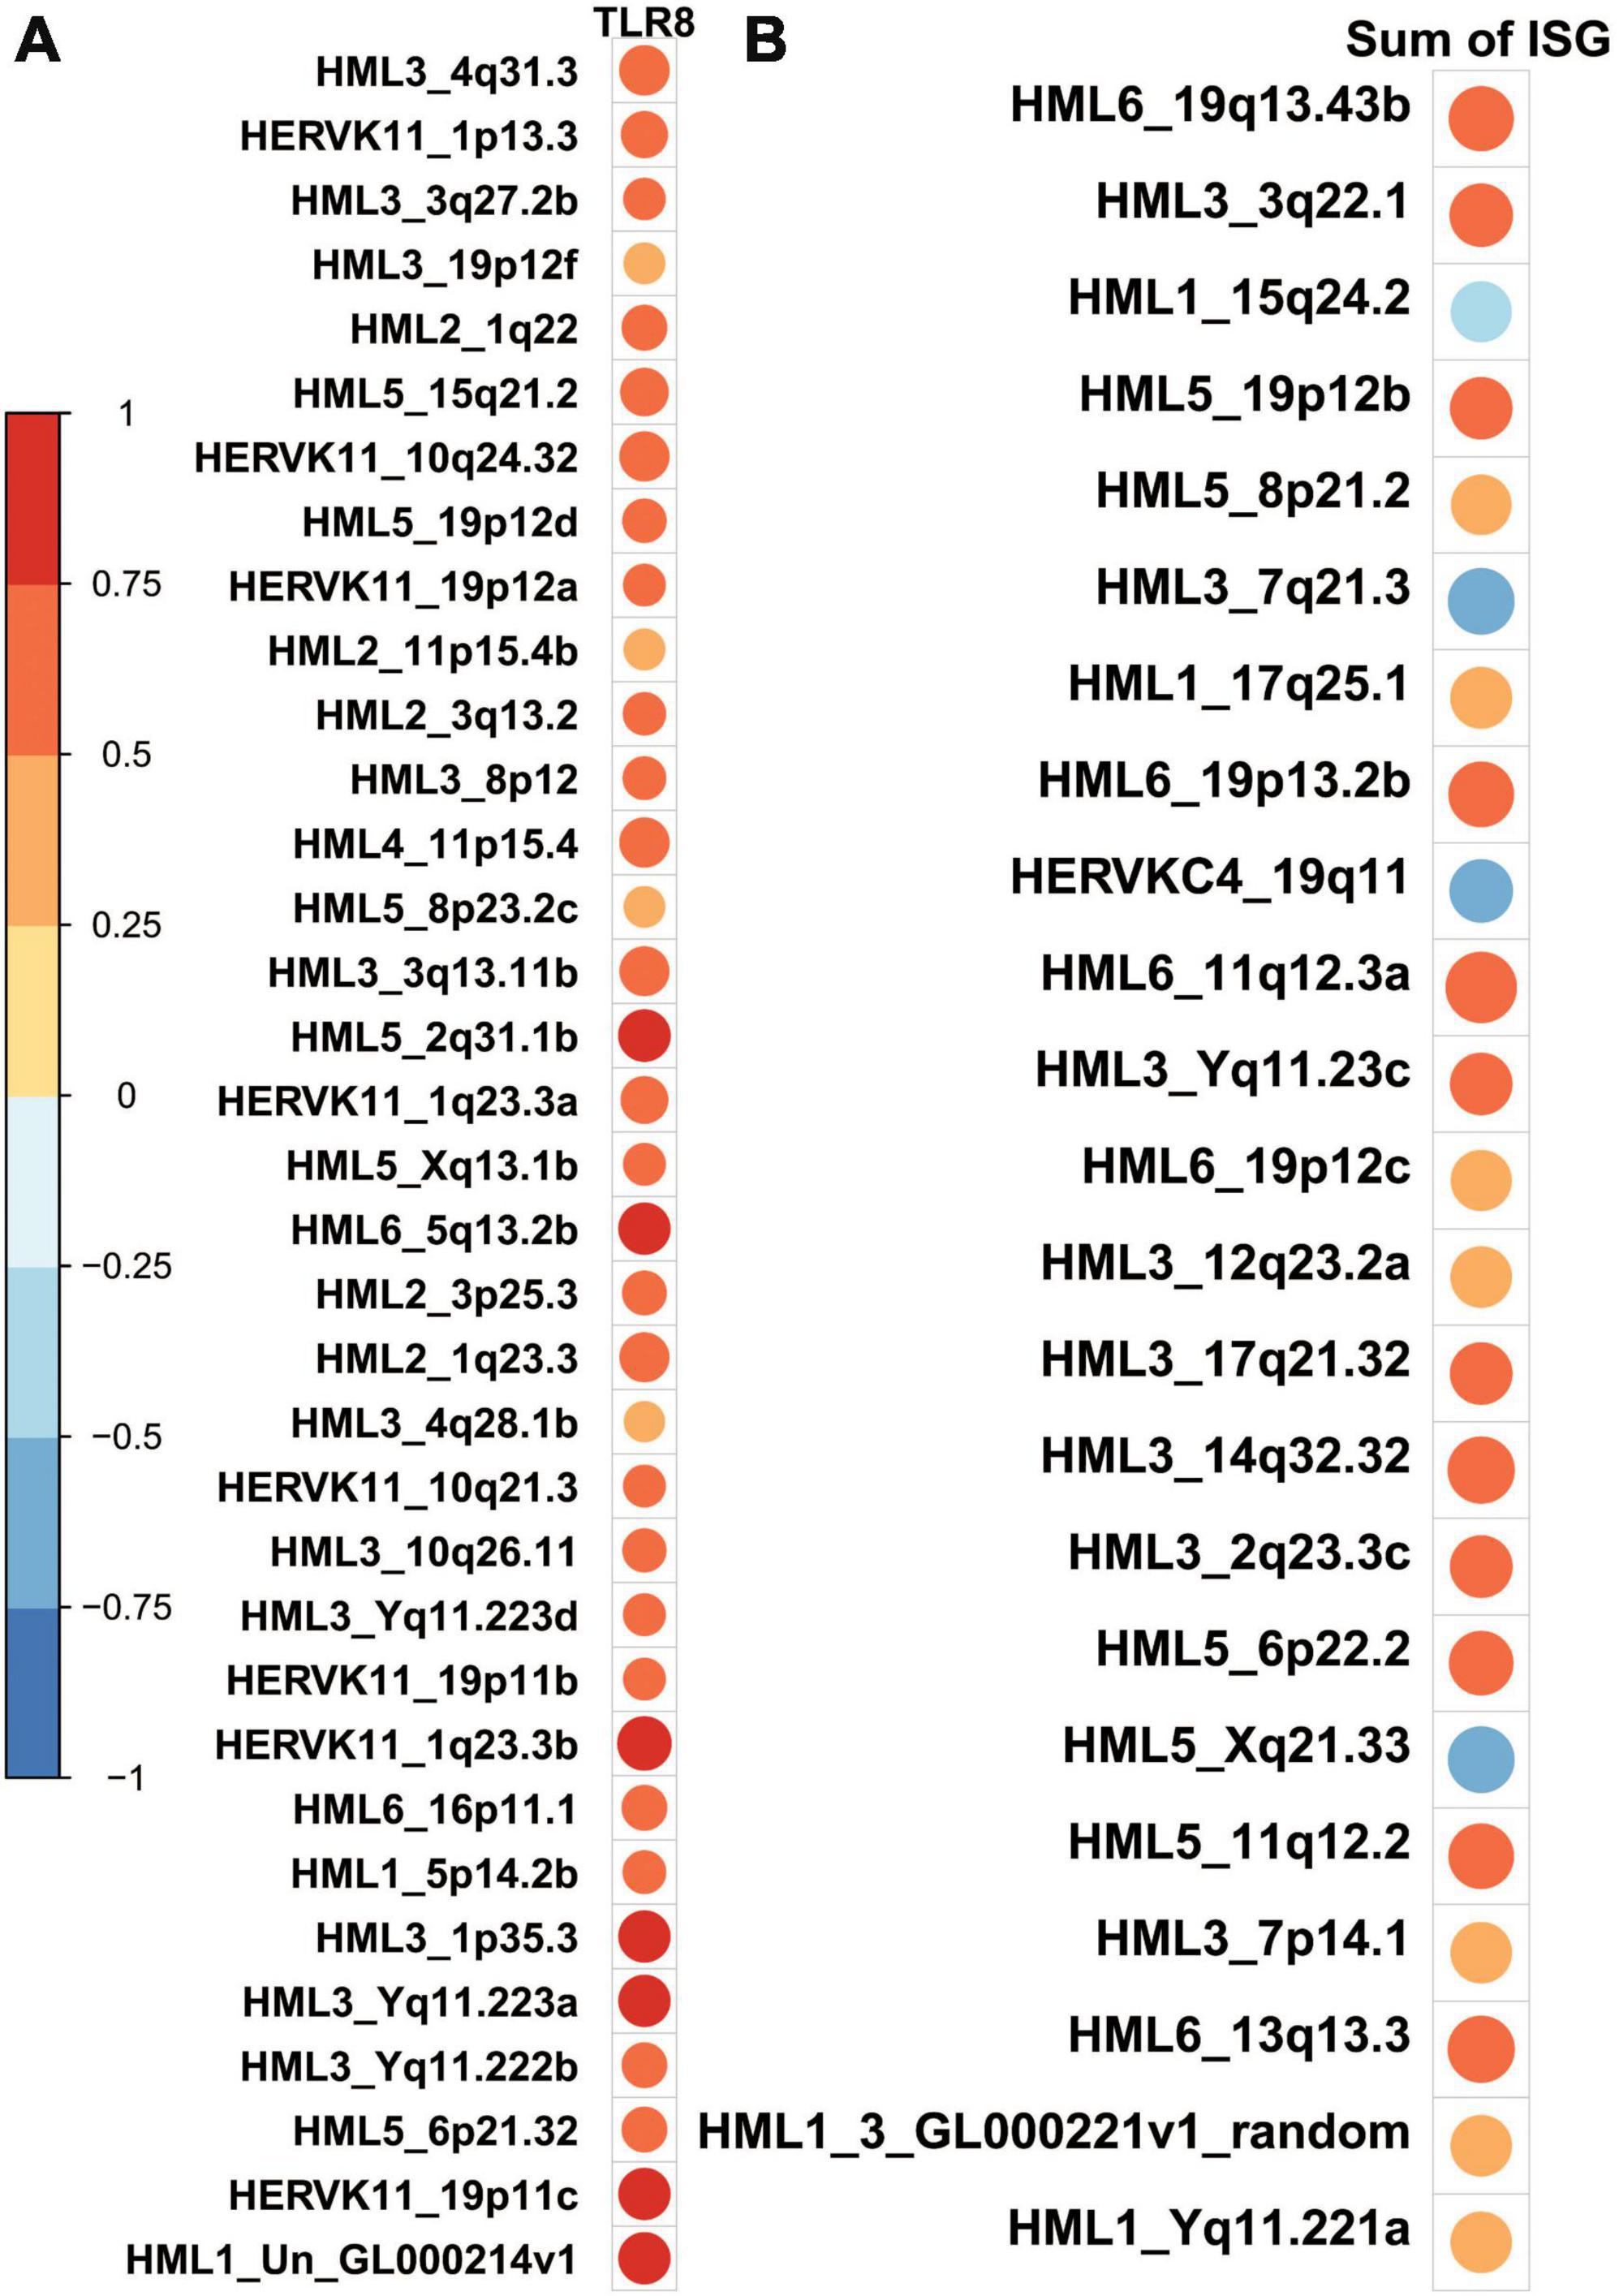
Figure 5. HERV-K loci which are significantly correlated with gene expression of interest tend to show positive correlations. Cells show circles whose size and color are indicative of the Pearson correlation coefficient associated with a correlation test between the transcript counts of the transcripts and HERV-K loci. Larger, redder circles indicate correlation coefficients that approach 1. Larger, bluer circles indicate correlation coefficients that approach –1. Only significant associations are shown in order to save space; a full depiction of the correlation between all HERV-K loci and TLR8 is given in the Supplementary material. (A) HERV-K loci which are significantly correlated with TLR8 expression all show a positive direction of such a correlation. (B) HERV-K loci which are significantly correlated with a sum of the expression of interferon-stimulated genes (ISG) mostly show a positive direction of such a correlation–19/23 correlation values are positive.
We also sought to characterize the gene expression of the samples from our WashU RNA-Seq dataset. We report 1,514 upregulated genes in AD (FDR < 0.05) and 685 downregulated genes in AD (FDR < 0.05) (Figure 6). In order to compare the differentially expressed genes in our study — in which tissue was collected from the parietal lobe — with the results of other studies conducted in AD across brain regions, we obtained log fold change values from genes presented in a recent study (Figure 7A). Additionally, we used Arboreto to find HERVs that show the highest associations with DE genes and present scatter plots of the 5 strongest associations, ranked by feature importance (Figures 7B–F).
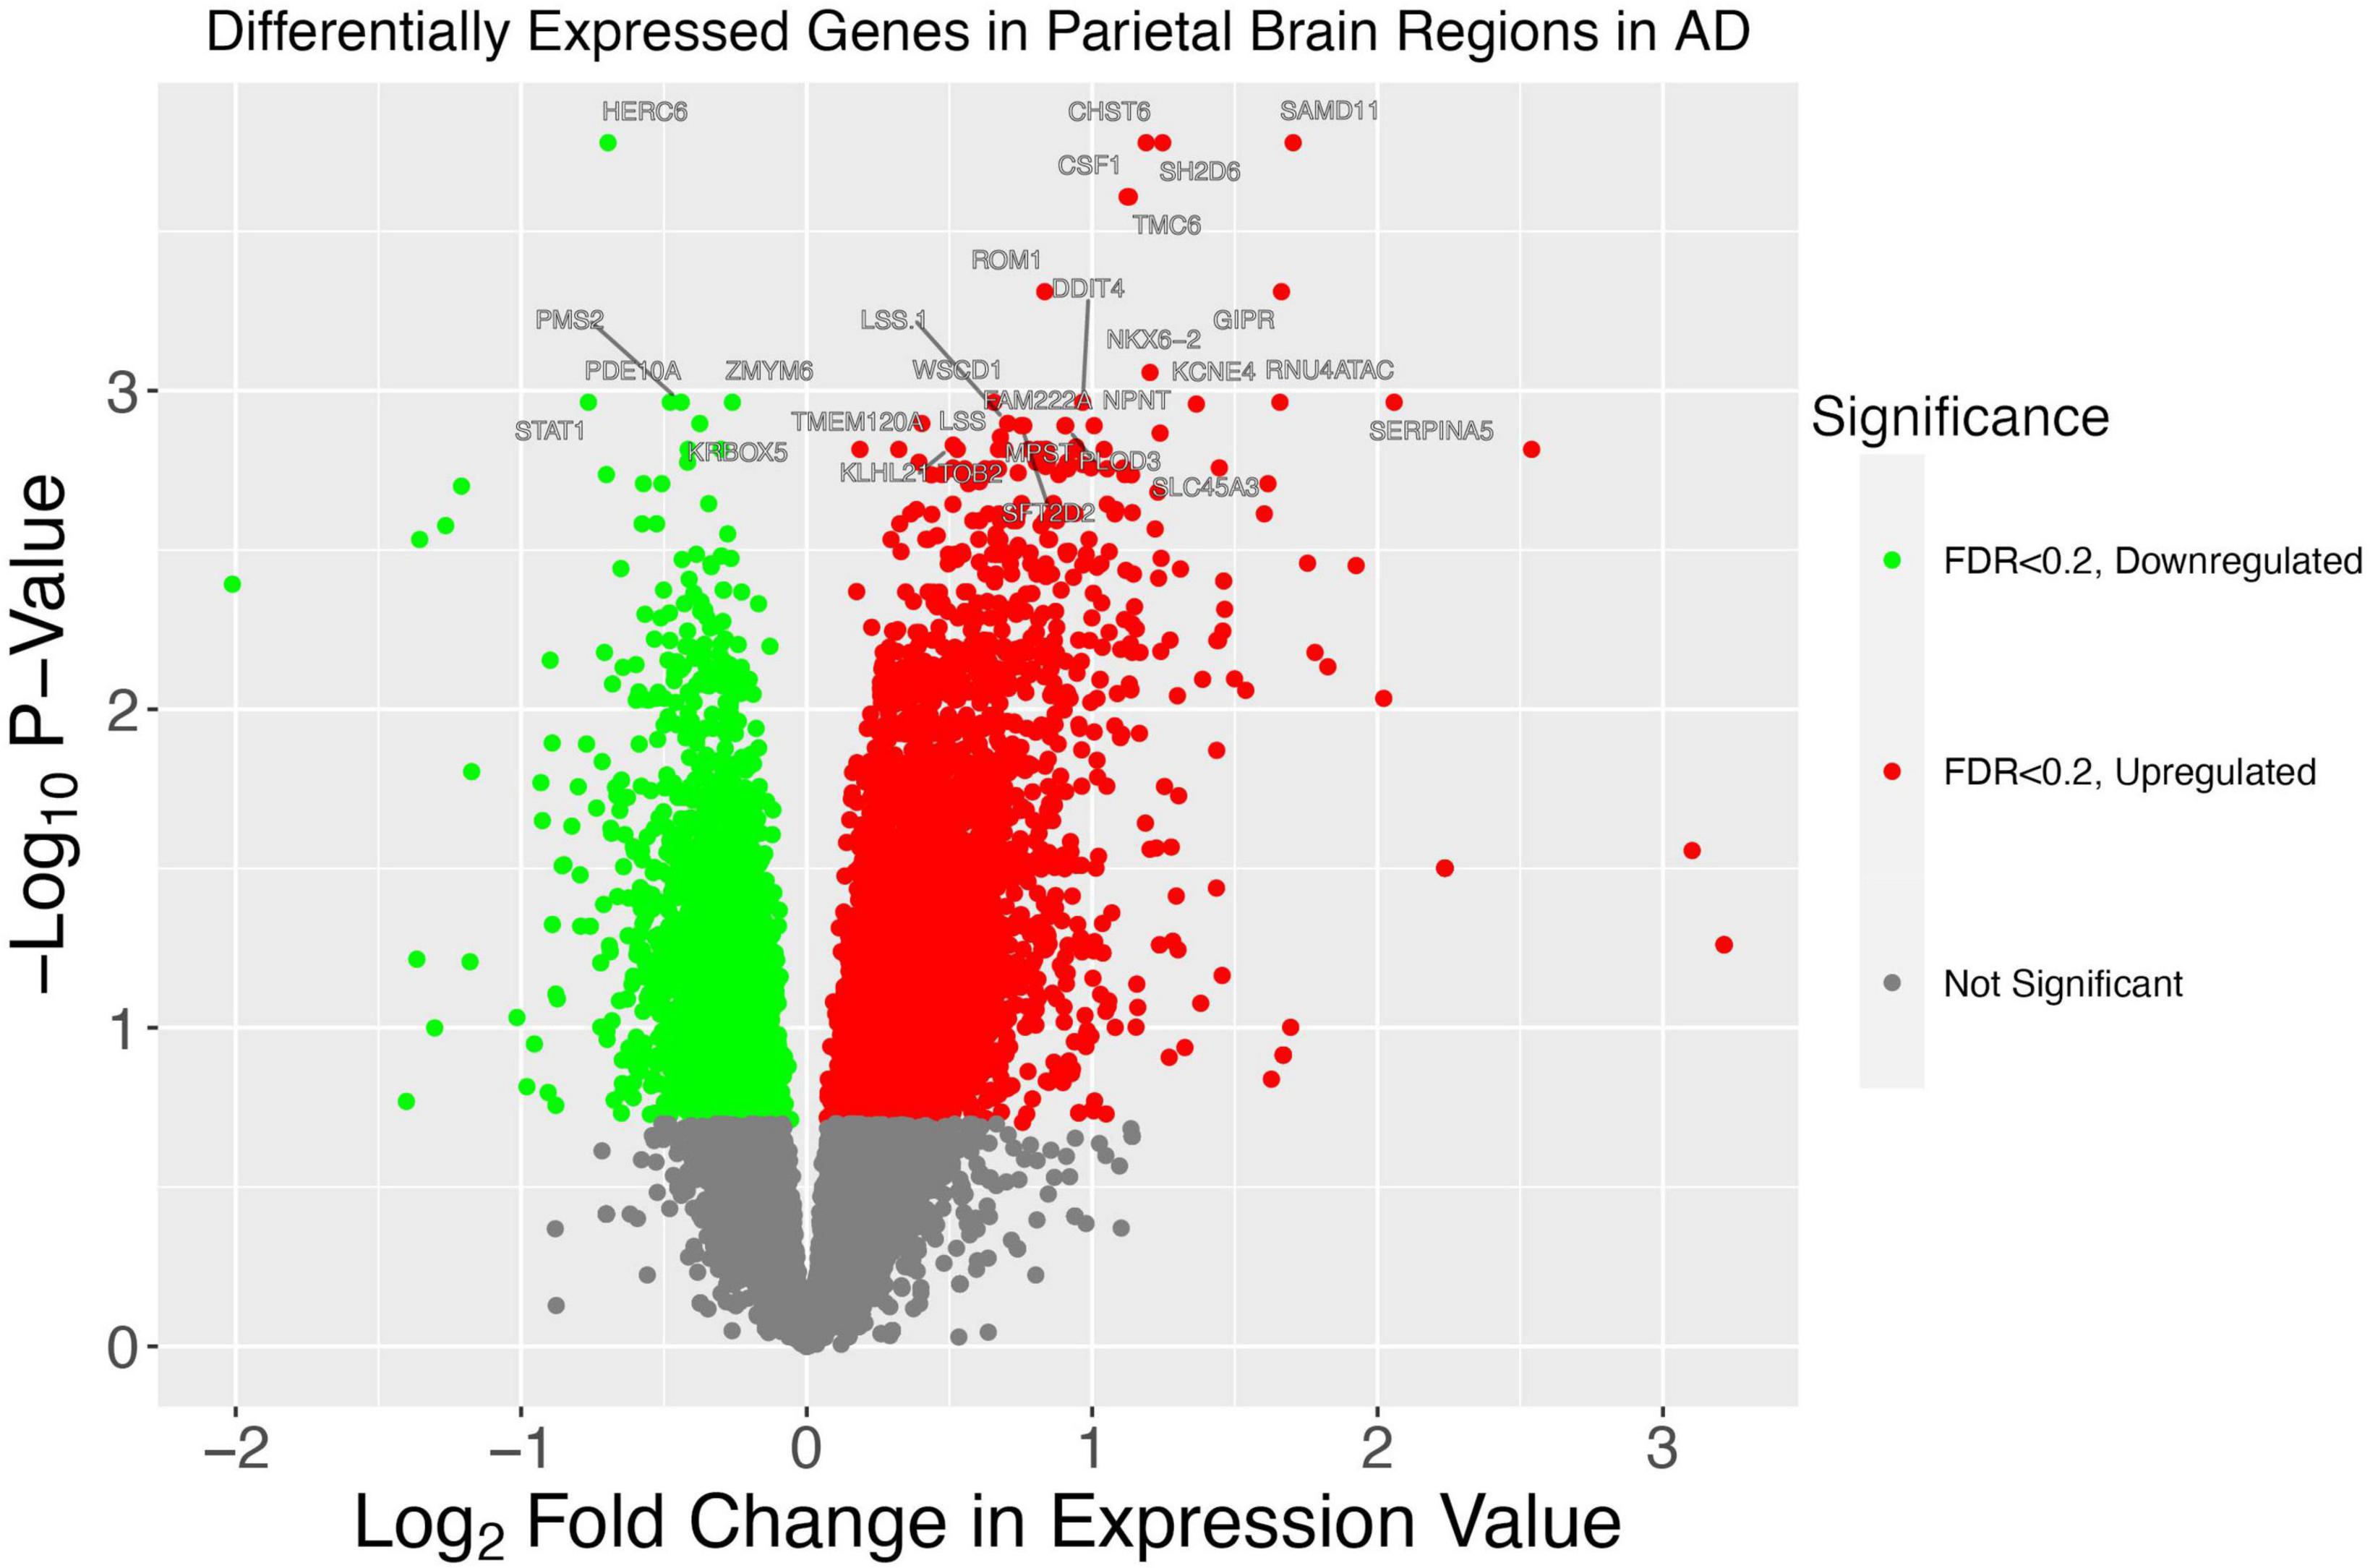
Figure 6. A volcano plot illustrates patterns of gene dysregulation in AD. On the y-axis the –log10P-value calculated using DESeq2 is shown. On the x-axis, the log2 fold change in expression value is shown. Each dot represents a gene. A handful of the genes with the most extreme p-values are shown. Red dots lie to the right of the x = 0 asymptote and represent genes with a greater expression in AD. Green dots lie to the left of the x = 0 asymptote and represent genes which have decreased expression in AD. All dots below the line of –log10(0.2) are colored gray and represent genes which have a statistically insignificant change between conditions.
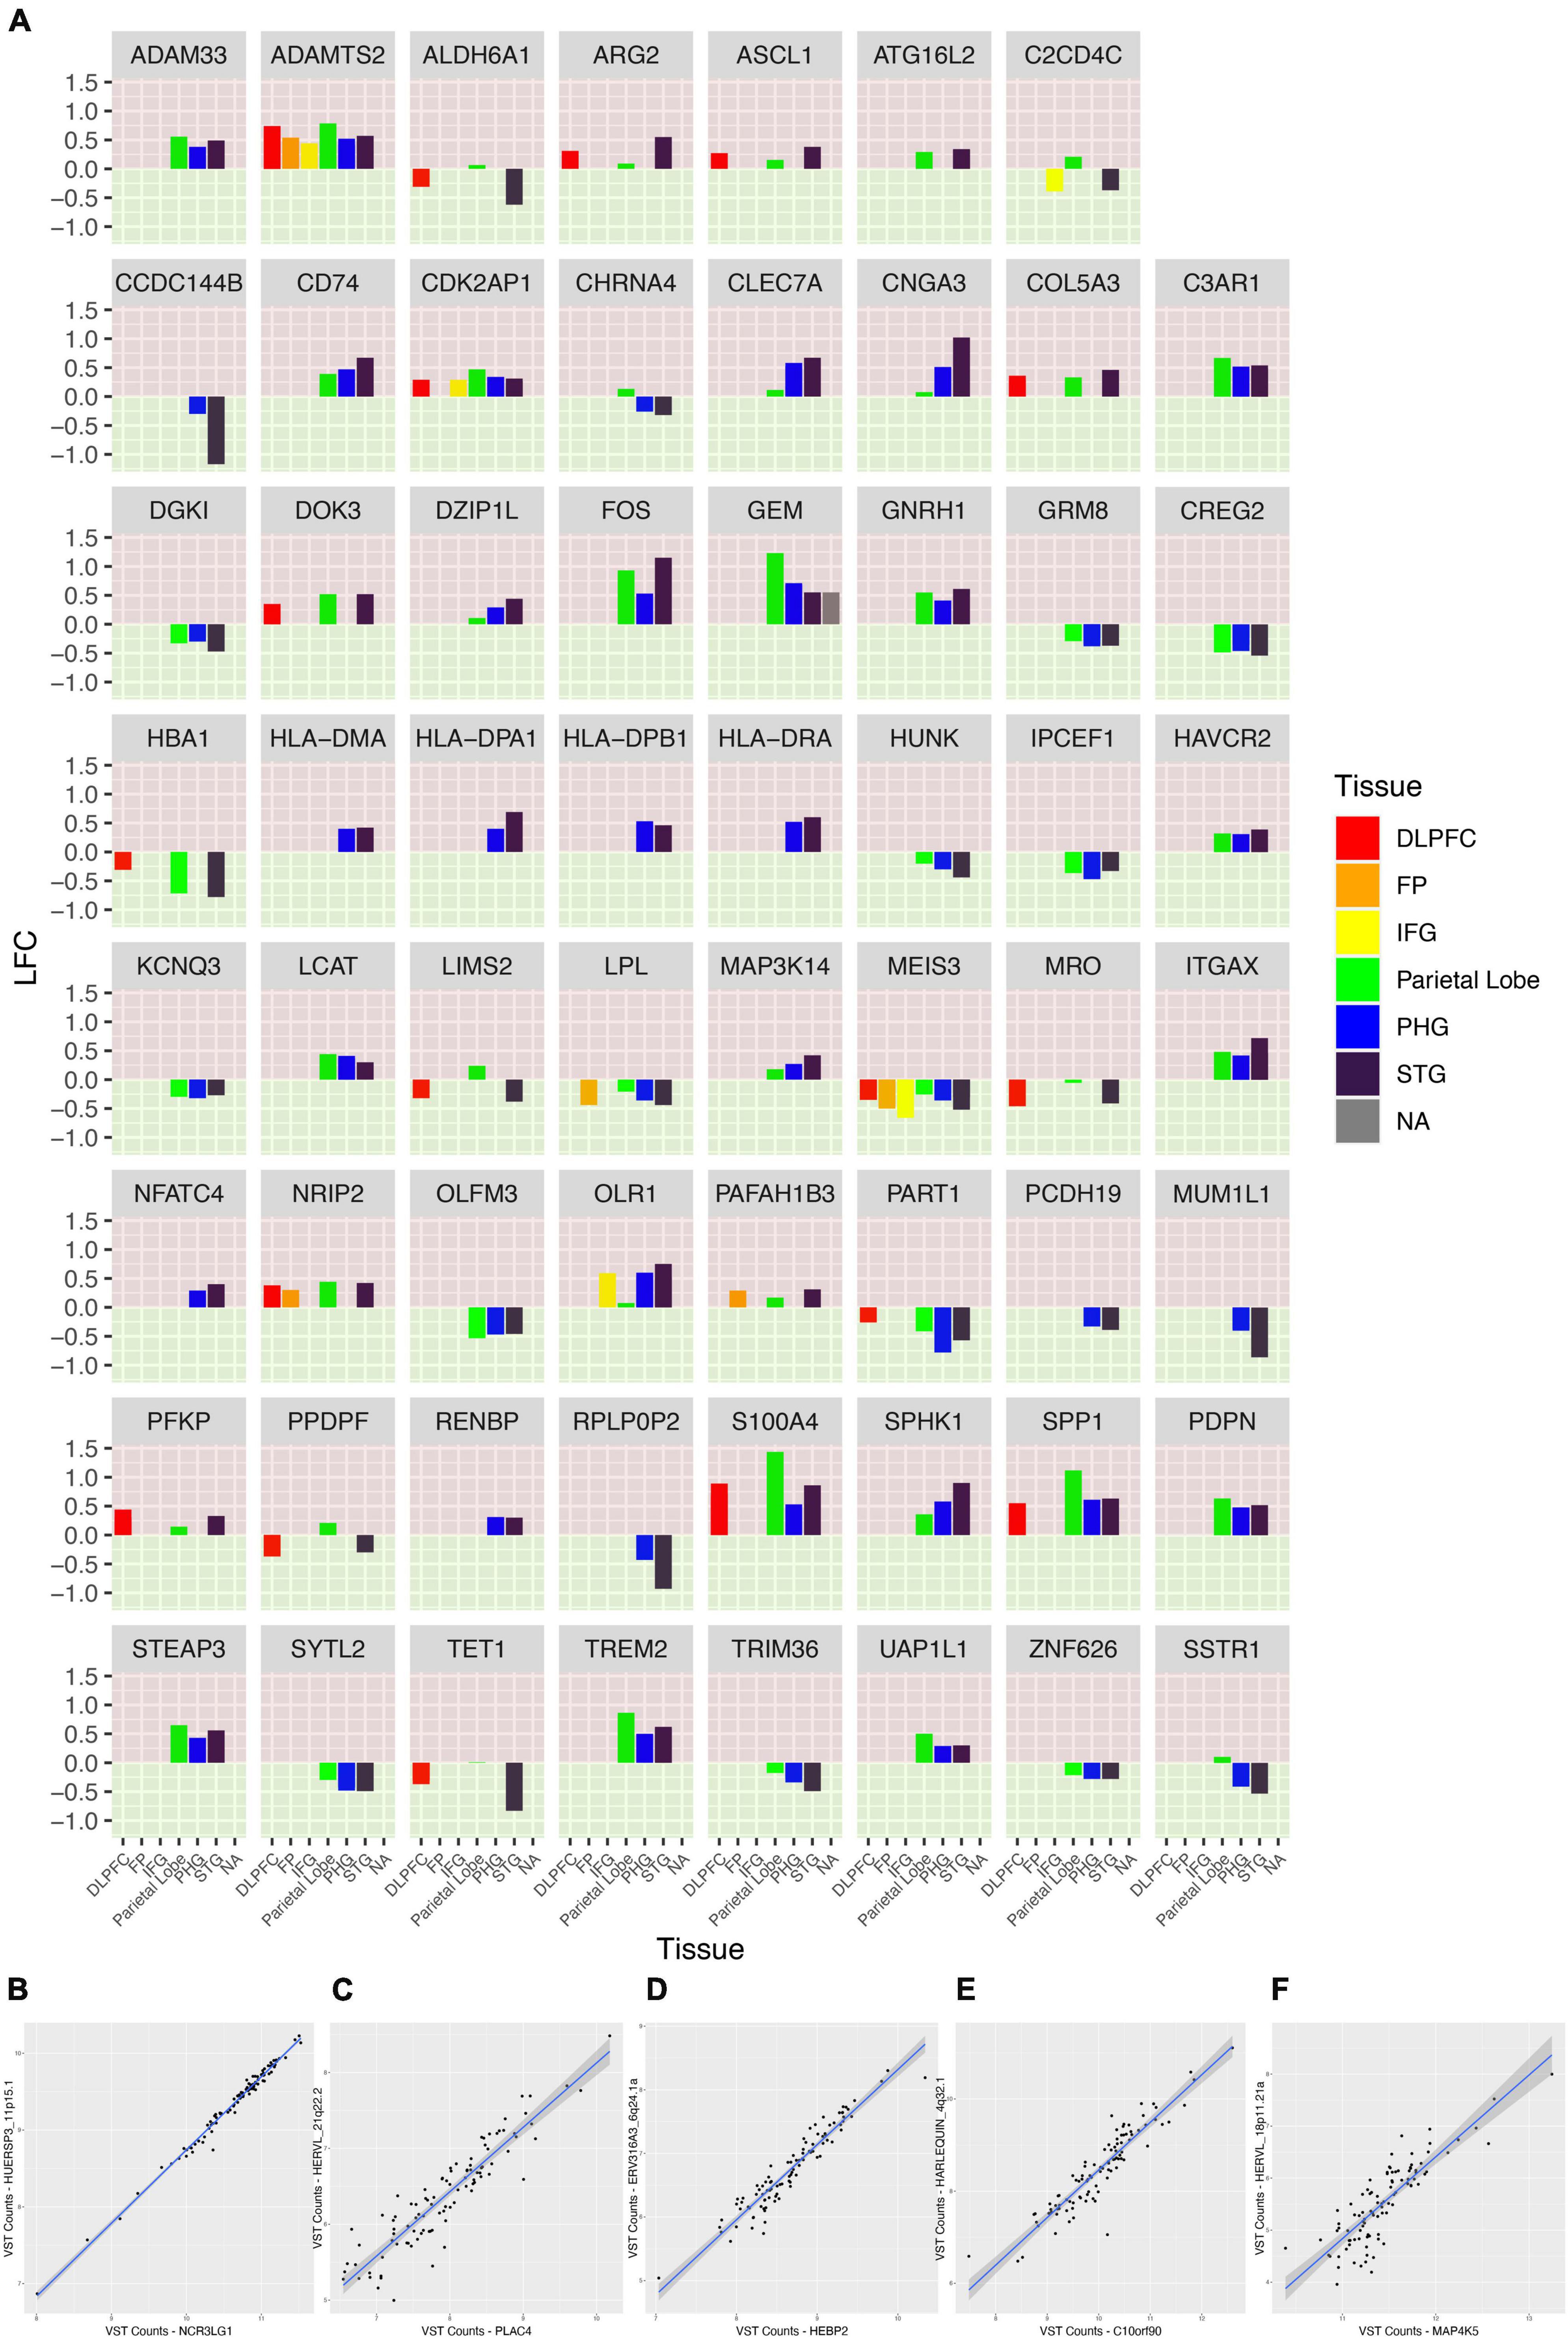
Figure 7. A comparison of the fold change of genes across brain regions in AD. (A) Faceted plot is shown in which each panel represents a gene. Along the x-axis are brain regions and the fold change of the gene in patients with AD is expressed by the height of the bar. Each panel is colored into green and red regions to make it clear which direction the bars face, and, in turn, the corresponding fold change of the gene. The upper portion of each panel is colored red; bars which stretch into this region represent genes with a positive log fold change in AD. The lower portion of each panel is colored green; bars which stretch into this region represent genes with a negative log fold change in AD. Each tissue is also given its own color; some genes were not expressed in some tissues or not associated with a significant log fold change and, as a consequence, not every panel contains data for every tissue. Largely the patterns of log fold change remain consistent across tissues but there are exceptions in which genes show a different pattern of expression in the parietal lobe compared to other tissues. (B–F) Variance-stabilizing transformed counts of top 5 most-associated genes and HERVs as calculated by Arboreto.
Finally, we conducted gene set enrichment analysis and identify chemotaxis and cell-cell adhesion as pathways that were the most statistically significantly enriched (Figure 8).
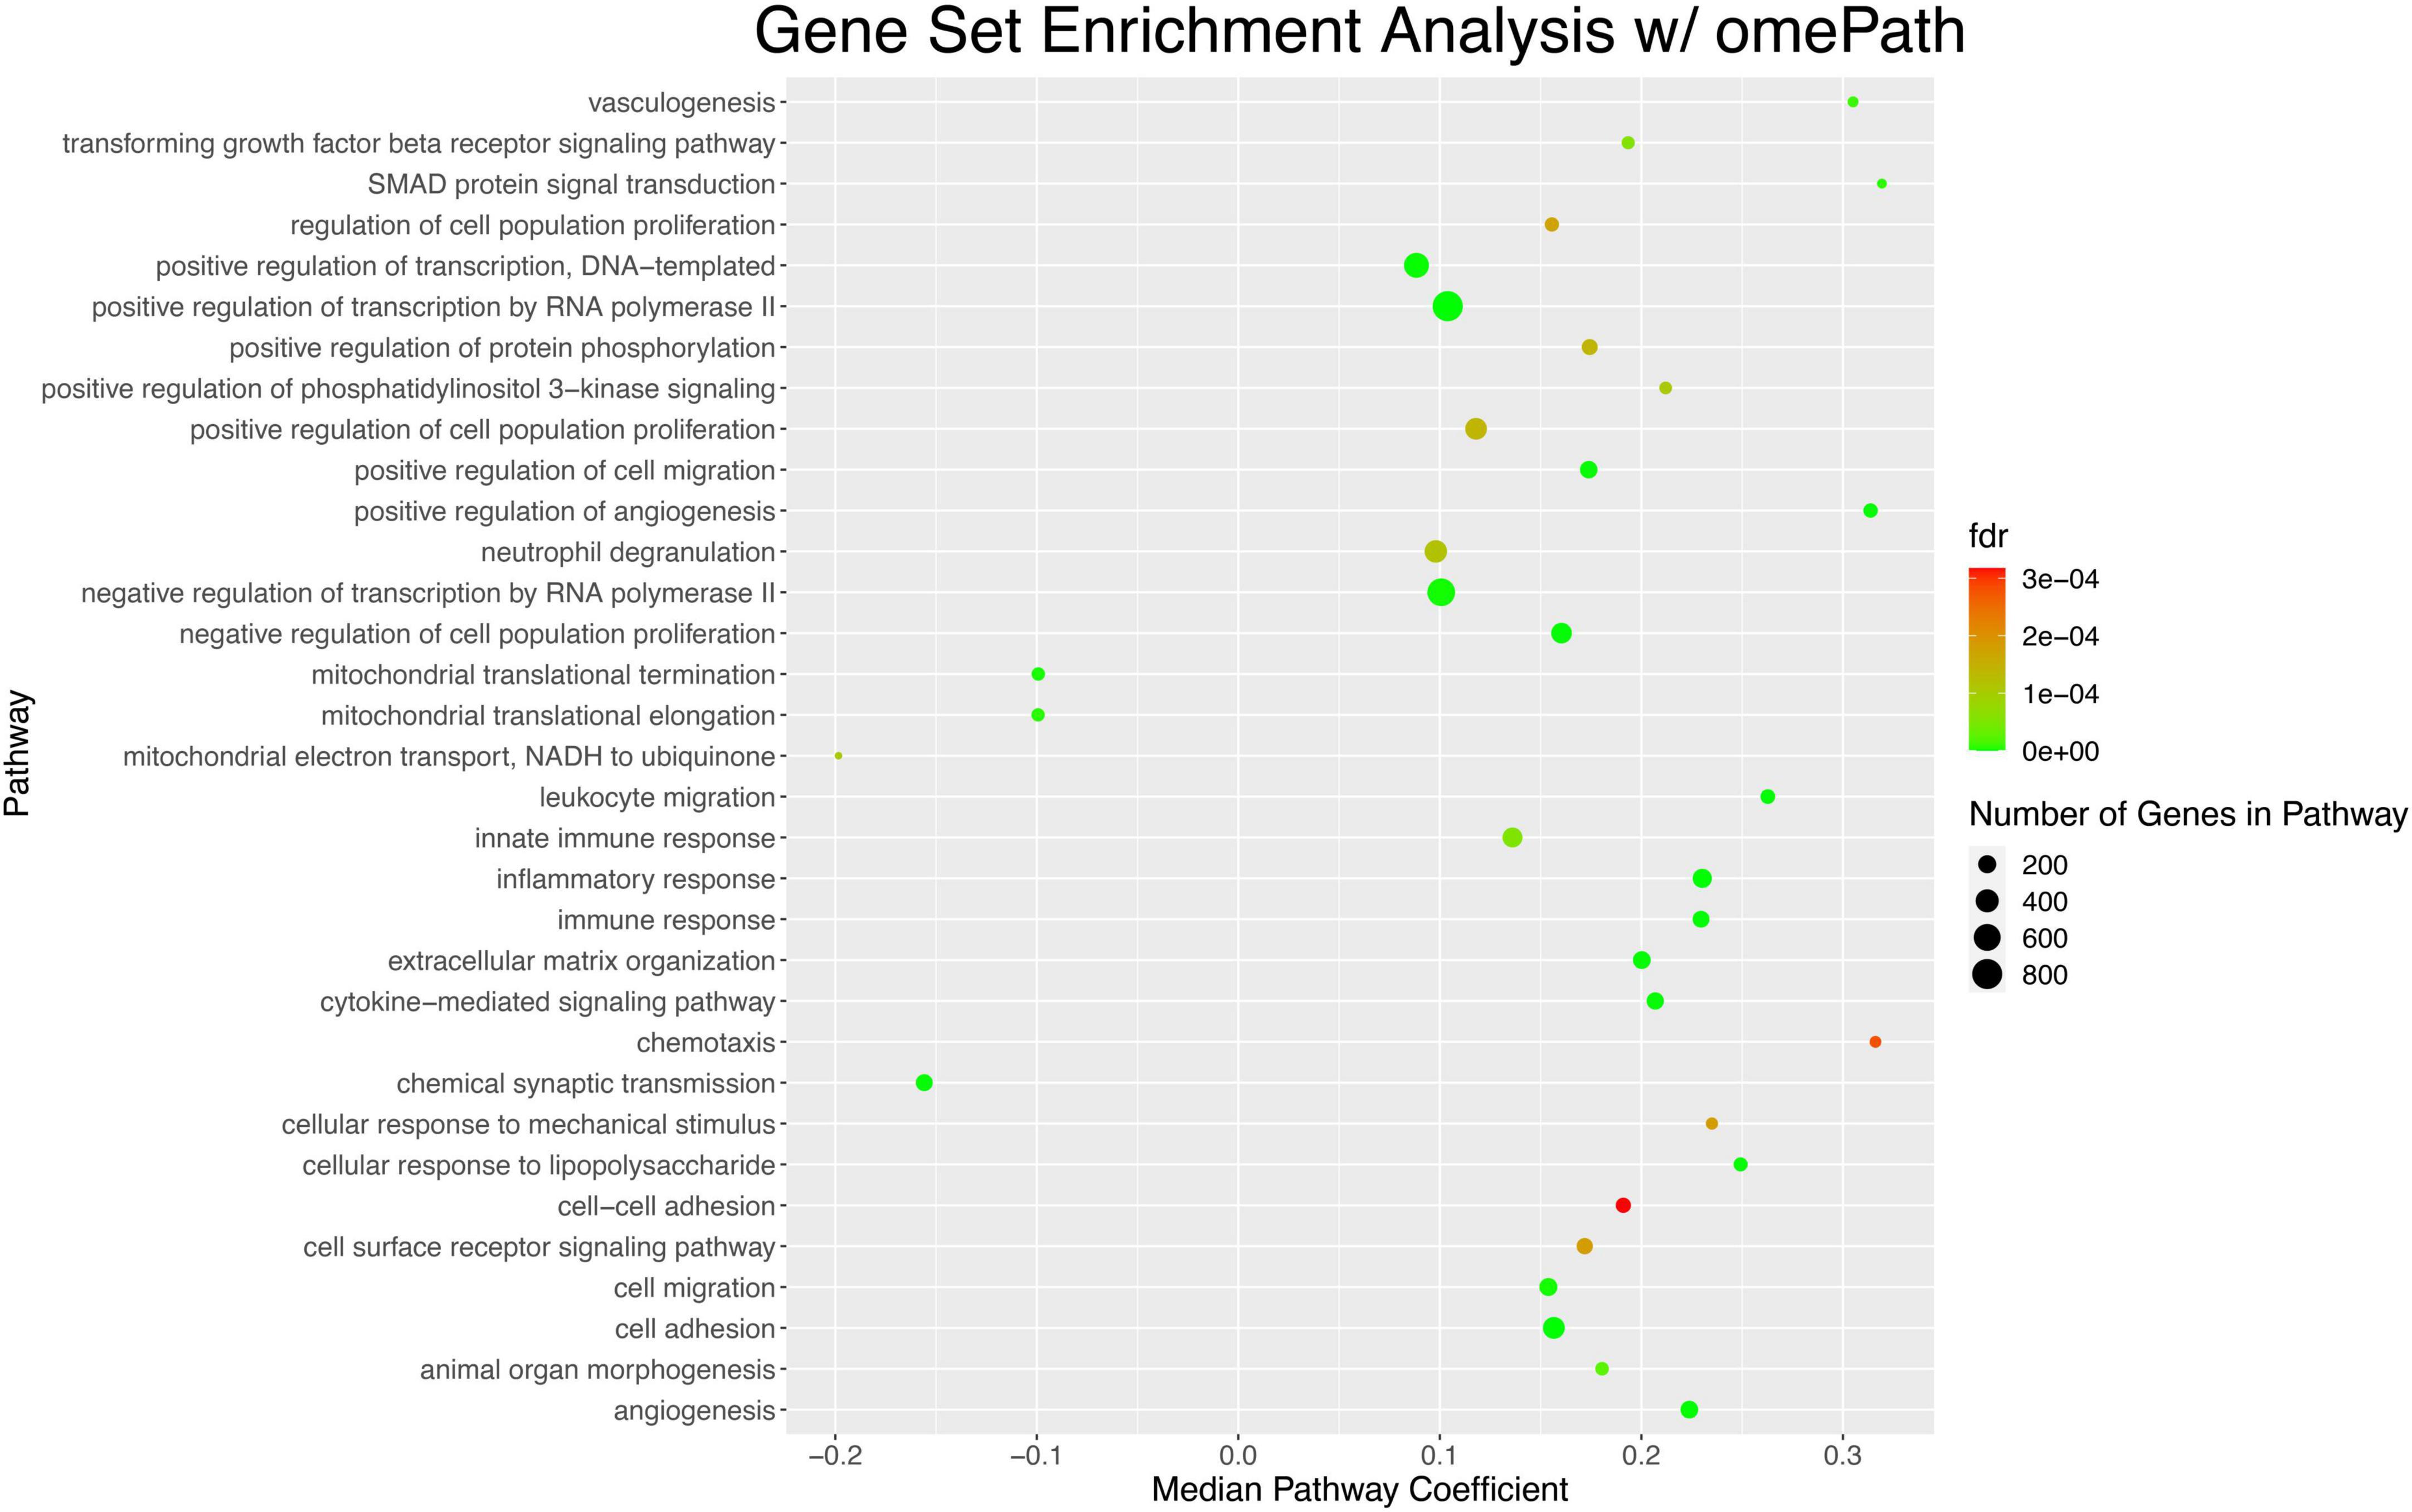
Figure 8. Gene set enrichment analysis of DE genes in AD highlights pathways that are significantly dysregulated in the parietal lobe. The top 33 pathways sorted by lowest p-value are shown. Each dot represents a pathway; the position of the dot on the x-axis represents the coefficient of the median gene in that pathway. The color of the gene, on a color scale from red to green, represents an increasingly more significant p-value associated with the dysregulation of the pathway. The size of the dot indicates the number of genes in the pathway; in this case pathways ranged from ∼200 genes to ∼800 genes.
4. Discussion
In this analysis, we present locus-specific differential HERV expression patterns in Alzheimer’s disease compared to normal brain samples. After filtering uninformative elements, 698 HERVs were found to be differentially expressed between Alzheimer’s and normal brain samples. Of the 698 elements, 511 were upregulated and 187 were downregulated. Of the 62 families included in the analysis, several had more differentially expressed elements than would have been expected statistically. These families include HERV-K, HERV-W, HML3, HML2, HML4, and HML6, among others (Figure 3).
After identifying elements of interest, we conducted a differential gene expression analysis to assess dysregulation of elements proximal to individual HERV loci. We assessed the relationship between HERV-K and TLR8 expression, two elements that may work in tandem to cause neurodegeneration (Dembny et al., 2020). The association between TLR8 and each of the nine HERV-K families were found to be statistically insignificant (Supplementary Figure 2). However, when looking at individual loci, a number of elements had statistically significant Pearson correlation coefficients approaching one (Figure 6). Of note, all of the significant associations were positive. Similarly strong trends were observed by correlating HERV-K expression with the summed expression of a set of interferon signature genes. These results not only corroborate the findings of previous studies, they also highlight the benefit of looking beyond the family level of HERVs to specific transposable element insertions.
Next, gene set enrichment analysis of genes proximal to differentially expressed HERVs reveals dysregulated pathways that may be at play in AD. The pathways with the most statistically significant coefficient values were both linked to cell adhesion process, while the pathway with the largest absolute value of the coefficient was linked to the cell cycle. Disruptions to the cell cycle of neurons in the AD brain have been noted for several decades. As early as 1997, McShea et al. (1997) identified a number of dysregulated cell cycle mediators, such as cell-division cycle 2 (cdc2), cyclin B1 kinase, and cyclin-dependent kinase-4 (Cdk4) (Vincent et al., 1997). Soon after, evidence emerged that neurons in AD patients likely re-enter an ultimately lethal cell cycle (Yang et al., 2001), a cellular process that is now considered an early manifestation of neurodegenerative disease (Denechaud et al., 2023).
Our proximal gene analysis indicated that a member of the transmembrane (TMEM) protein family, TMEM179 (ENSG00000258986), had the highest coefficient value at 2.623108848. The TMEM family is responsible for fulfilling a wide variety of important physiological functions such as mounting an immune response (Dodeller et al., 2008), collagen secretion (Zhang et al., 2020), dendritic lysosomal trafficking (Zhang et al., 2020), and smooth muscle contraction (Thomas-Gatewood et al., 2011), among other roles. The differential expression of the TMEM family has also been noted in several types of cancers (Schmit and Michiels, 2018). Of the expansive list of TMEM proteins, TMEM179 is less frequently a subject of study. The sequence is located on human 14q32.33, which has previously been identified as a potential evolutionary breakpoint (Ruiz-Herrera et al., 2006; Longo et al., 2009). This protein has recently been identified as one of eight probable modulators of optic nerve necrosis in mice (Stiemke et al., 2020). It has also been demonstrated that TMEM179 is expressed in oligodendrocyte precursor cells (OPCs), astrocytes, and neurons; and that it is found in the cortex, hippocampus, and hypothalamus of mice (He et al., 2021). However, the primary focus of the study was investigating the neurotoxic effects of arsenic and the protective effects of N-acetyl-cysteine (NAC) on OPCs. The investigators found that TMEM179 was likely involved in modulating both neurotoxic and protective effects in OPCs, in addition to being involved in mitochondrial maintenance and apoptotic pathways (He et al., 2021). Notably, TMEM179 was thought to inhibit apoptosis via suppression of protein kinase C β (PKCβ) (He et al., 2021), which is one of a handful of PKC isoforms often referred to as “memory kinases” for their role in transmembrane signal conduction (Sun and Alkon, 2014). Mice deficient in PKCβ also demonstrate deficits in cued conditioning and learning (Weeber et al., 2000). Most relevant though is the purported role of PKCβ in AD pathology. Studies have shown that when PKCβ fails to translocate to the plasma membrane, it can hyperphosphorylate tau (Gerschütz et al., 2013).
Accumulation of detritus could also be attributed to dysregulation of the PSMB1 gene—which was found to have a log2 fold change value of 1.388246983. This gene encodes the β6 subunit of a proteasome beta-type family which in turn forms the core of the 20S proteasome. Proteasomes are key members of the ubiquitin–proteasome system (UPS) which is responsible for degradation of intracellular damaged, mutant, misfolded, or extraneous proteins (Glickman and Ciechanover, 2002). Critically, reduced UPS function has been noted throughout much of early Alzheimer’s literature and could be linked to the accumulation of tau seen in the AD brain (López Salon et al., 2000; Keller et al., 2001). The 20S proteasome in particular is affected by this aberrant control of UPS function observed in AD. The phosphorylation and subsequent deactivation of nuclear factor erythroid 2-like factor 2 (Nrf2) in AD patients prevents the increased expression of the 20S proteasome (Ramsey et al., 2007; Pickering et al., 2012), which dwindles the already diminishing pool of competent proteasomes. While it is worth noting that researchers are still unclear whether defective proteasome function causes AD or if it arises as a consequence of the disease and simply exacerbates it (Lee et al., 2013), the increased expression of the PSMB1 gene could still be an indication of the body attempting to compensate for reduced UPS activity.
Other overexpressed genes found in the analysis have less tangential relations to neurodegenerative changes. One such gene was BASP1, which had a log2 fold change value of 1.30198558. This gene plays a critical role in neurodevelopment, synaptic function, and nerve regeneration. More specifically, it is involved in enhanced neurite outgrowth (Korshunova et al., 2008), has implications for neurotransmission, synaptic plasticity, and information storage (Yamamoto et al., 1997; Han et al., 2013), and axonal regeneration after injury. Notably, recent studies have shown that levels of BASP1 are decreased in AD patients (Musunuri et al., 2014), and the protein often demonstrates decreased phosphorylation in the temporal lobes compared to non-AD subjects (Tagawa et al., 2015).
A number of genes with both positive and negative correlation coefficients are classified as long non-coding RNAs (lncRNAs) and pseudogenes. While these specific elements had little to no coverage in literature, lncRNAs in general have been implicated in a number of human diseases, including Alzheimer’s. Although lncRNAs are not capable of forming functional proteins, they nonetheless play a crucial role in mediating the expression of neighboring protein-coding genes through chromatin modifications, transcriptional regulation, and post-transcriptional regulation (Mercer et al., 2009; Derrien et al., 2012; Marchese et al., 2017). Due to their regulatory roles, genomic rearrangements with lncRNA loci have been linked to cancers, neurological and cardiovascular disorders, and infectious or inflammatory disease (Esteller, 2011; Wapinski and Chang, 2011; DiStefano, 2018; Aznaourova et al., 2020). In the past decade, lncRNAs have been increasingly linked to AD pathology, with a number of elements having been identified as potential biomarkers in the blood (Kurt et al., 2020), plasma (Feng et al., 2018), extracellular vesicles (Straten et al., 2009; Wang et al., 2020), and cerebrospinal fluid (Straten et al., 2009; Wang et al., 2020). These identified elements (Supplementary Table 1) may also serve as biomarkers or play a role in AD pathology.
5. Conclusion
A total of 698 HERVs were identified as being significantly differentially expressed in Alzheimer’s disease vs. healthy controls. These HERVs are physically proximal to genes in cell adhesion and immune response pathways. HERVs in the HERV-K superfamily are overrepresented among those differentially expressed and many loci are correlated with innate immune activation.
Further studies will be necessary to confirm the role of specific HERV loci in innate immunity and cell adhesion in neurodegenerative diseases like Alzheimer’s Disease. Both in vitro and in vivo experimentation are warranted. Future studies may also probe the expression of other transposable elements or perform binding experiments to show to what degree certain HERV transcripts or proteins are immunogenic in AD.
Data availability statement
The data is available at https://www.niagads.org/datasets/ng00083. Circular RNAs in Alzheimer’s disease brains – RNA-seq data. This dataset presents the results from processing ribosomal RNA (rRNA)-depleted RNA-seq data derived from human brain tissues donated by individuals with and without Alzheimer’s disease (AD). At the individual-level, it includes data for circular and linear RNA counts as well as technical, clinical, and neuropathological phenotypes. At the summary statistic-level, it includes discovery, replication, and meta-analysis circular RNA (circRNA) differential expression and AD-trait correlation results www.niagads.org.
Ethics statement
The studies involving human participants were reviewed and approved by the Washington University Institutional Review Board. The patients/participants provided their written informed consent to participate in this study.
Author contributions
TD, UR, and JS: investigation. CC, JK, and KC: conceptualization, resources, review and editing, supervision, and funding acquisition. TD, UR, JS, CC, JK, and KC: methodology. TD and UR: writing. All authors contributed to the manuscript and approved the submitted version.
Funding
This work was supported by grants from the National Institutes of Health [R01AG044546 (CC), P01AG003991 (CC) RF1AG053303 (CC), RF1AG058501 (CC), U01AG058922 (CC), RF1AG071706 (CC), and R01AG078964 (CC)], the Chan Zuckerberg Initiative (CZI), the Michael J. Fox Foundation (CC), the Department of Defense (LI- W81XWH2010849), and the Alzheimer’s Association Zenith Fellows Award (ZEN-22-848604, awarded to CC), and anonymous foundation. The recruitment and clinical characterization of research participants at Washington University were supported by the NIH P30AG06644, P01AG0399, and P01AG026276. This work was also supported by access to equipment made possible by the Hope Center for Neurological Disorders, the Neurogenomics and Informatics Center (NGI: https://neurogenomics.wustl.edu/) and the Departments of Neurology and Psychiatry at Washington University School of Medicine. The analytical component of this work was partially supported by funding from Brigham Young University.
Acknowledgments
We thank all the participants and their families, as well as the many involved institutions and their staff.
Conflict of interest
CC has received research support from: GlaxoSmithKline and Eisai. The funders of the study had no role in the collection, analysis, or interpretation of data; in the writing of the report; or in the decision to submit the manuscript for publication. CC is a member of the advisory board of Vivid Genomics and Circular Genomics and owns stocks. TD has received research support from AMPEL BioSolutions.
The remaining authors declare that the research was conducted in the absence of any commercial or financial relationships that could be construed as a potential conflict of interest.
Publisher’s note
All claims expressed in this article are solely those of the authors and do not necessarily represent those of their affiliated organizations, or those of the publisher, the editors and the reviewers. Any product that may be evaluated in this article, or claim that may be made by its manufacturer, is not guaranteed or endorsed by the publisher.
Supplementary material
The Supplementary Material for this article can be found online at: https://www.frontiersin.org/articles/10.3389/fnagi.2023.1186470/full#supplementary-material
Supplementary Figure 1 | Read counts in Wash-U dataset of 98 patients. (a) The total number of reads from each sample is shown. Each bar represents a particular sample and its height represents the number of total reads. (b) A summary boxplot is shown to represent the distribution of reads across our samples. (c) The number of reads from each sample that mapped to HERVs is shown. The order of samples from panel a is preserved. (d) A heatmap shows the number of HERVs across families that mapped from each sample. Darker shades of red indicate a higher number of mapped HERVs from a sample to a HERV family.
Supplementary Figure 2 | Genomic location of HERVs expressed in Alzheimer’s disease. DE HERV loci are mapped to chromosomal locations and shown on a circos plot. The circos plot is a circular representation of the genome. The outermost ring is shaded according to cytogenetic bands with red bands corresponding to centromeres and black and gray bands corresponding to changes between bands and sub-bands that represent chromosomal structural features visible with a microscope. Chromosomes are labeled with text that surrounds this ring. The blue, dashed line in the center represents a log2 fold change of 0. Each dot represents a DE HERV in its corresponding chromosomal location, the color and distance from center are indicative of p-value and log2 fold change, respectively.
Supplementary Figure 3 | Correlations between TLR-8 expression and expression of all HERV-K loci. Significant correlations have loci names written in red text.
Supplementary Figure 4 | Correlation of sum of HERV-K expression across 9 HERV-K families and TLR8 expression.
Footnotes
References
Alzheimer’s Association, (2021). Alzheimer’s disease facts and figures. Alzheimers Dement. 17, 327–406.
Andrews, S. (2010). FastQC: A quality control tool for high throughput sequence data. Cambridge: Babraham Institute.
Antony, J. M., van Marle, G., Opii, W., Butterfield, D., Mallet, F., Yong, V., et al. (2004). Human endogenous retrovirus glycoprotein–mediated induction of redox reactants causes oligodendrocyte death and demyelination. Nat. Neurosci. 7, 1088–1095. doi: 10.1038/nn1319
Aznaourova, M., Schmerer, N., Schmeck, B., and Schulte, L. N. (2020). Disease-causing mutations and rearrangements in long non-coding RNA gene loci. Front. Genet. 11:527484. doi: 10.3389/fgene.2020.527484
Bannert, N., and Kurth, R. (2006). The evolutionary dynamics of human endogenous retroviral families. Annu. Rev. Genomics Hum. Genet. 7, 149–173.
Bendall, M. L., de Mulder, M., Iñiguez, L., Lecanda-Sánchez, A., Pérez-Losada, M., Ostrowski, M., et al. (2019). Telescope: Characterization of the retrotranscriptome by accurate estimation of transposable element expression. PLoS Comput. Biol. 15:e1006453. doi: 10.1371/journal.pcbi.1006453
Bolger, A. M., Lohse, M., and Usadel, B. (2014). Trimmomatic: A flexible trimmer for Illumina sequence data. Bioinformatics 30, 2114–2120.
Buzdin, A. A., Prassolov, V., and Garazha, A. V. (2017). Friends-enemies: Endogenous retroviruses are major transcriptional regulators of human DNA. Front. Chem. 5:35. doi: 10.3389/fchem.2017.00035
Buzdin, A., Kovalskaya-Alexandrova, E., Gogvadze, E., and Sverdlov, E. (2006). At least 50% of human-specific HERV-K (HML-2) long terminal repeats serve in vivo as active promoters for host nonrepetitive DNA transcription. J. Virol. 80, 10752–10762. doi: 10.1128/JVI.00871-06
Catalina, M. D., Bachali, P., Geraci, N. S., Grammer, A. C., and Lipsky, P. E. (2019). Gene expression analysis delineates the potential roles of multiple interferons in systemic lupus erythematosus. Commun. Biol. 2, 140. doi: 10.1038/s42003-019-0382-x
Del-Aguila, J. L., Benitez, B., Li, Z., Dube, U., Mihindukulasuriya, K., Budde, J., et al. (2019). TREM2 brain transcript-specific studies in AD and TREM2 mutation carriers. Mol. Neurodegener. 14:18. doi: 10.1186/s13024-019-0319-3
Dembny, P., Newman, A., Singh, M., Hinz, M., Szczepek, M., Krüger, C., et al. (2020). Human endogenous retrovirus HERV-K(HML-2) RNA causes neurodegeneration through Toll-like receptors. JCI Insight 5:e131093. doi: 10.1172/jci.insight.131093
Denechaud, M., Geurs, S., Comptdaer, T., Bégard, S., Garcia-Núñez, A., Pechereau, L., et al. (2023). Tau promotes oxidative stress-associated cycling neurons in S phase as a pro-survival mechanism: Possible implication for Alzheimer’s disease. Prog. Neurobiol. 223:102386. doi: 10.1016/j.pneurobio.2022.102386
Derrien, T., Johnson, R., Bussotti, G., Tanzer, A., Djebali, S., Tilgner, H., et al. (2012). The GENCODE v7 catalog of human long noncoding RNAs: Analysis of their gene structure, evolution, and expression. Genome Res. 22, 1775–1789. doi: 10.1101/gr.132159.111
DiStefano, J. K. (2018). “The emerging role of long noncoding RNAs in human disease,” in Disease gene identification, methods in molecular biology, ed. J. K. DiStefano (New York, NY: Springer), 91–110.
Dobin, A., Davis, C., Schlesinger, F., Drenkow, J., Zaleski, C., Jha, S., et al. (2013). STAR: Ultrafast universal RNA-seq aligner. Bioinformatics 29, 15–21. doi: 10.1093/bioinformatics/bts635
Dodeller, F., Gottar, M., Huesken, D., Iourgenko, V., and Cenni, B. (2008). The lysosomal transmembrane protein 9B regulates the activity of inflammatory signaling pathways. J. Biol. Chem. 283, 21487–21494. doi: 10.1074/jbc.M801908200
Douville, R. N., and Nath, A. (2014). Human endogenous retroviruses and the nervous system. Handb. Clin. Neurol. 123, 465–485.
Dube, U., Del-Aguila, J., Li, Z., Budde, J., Jiang, S., Hsu, S., et al. (2019). An atlas of cortical circular RNA expression in Alzheimer disease brains demonstrates clinical and pathological associations. Nat. Neurosci. 22, 1903–1912. doi: 10.1038/s41593-019-0501-5
Feng, L., Liao, Y., He, J., Xie, C., Chen, S., Fan, H., et al. (2018). Plasma long non-coding RNA BACE1 as a novel biomarker for diagnosis of Alzheimer disease. BMC Neurol. 18:4. doi: 10.1186/s12883-017-1008-x
Feschotte, C., and Gilbert, C. (2012). Endogenous viruses: Insights into viral evolution and impact on host biology. Nat. Rev. Genet. 13, 283–296.
Frank, O., Giehl, M., Zheng, C., Hehlmann, R., Leib-Mösch, C., Seifarth, W., et al. (2005). Human endogenous retrovirus expression profiles in samples from brains of patients with schizophrenia and bipolar disorders. J. Virol. 79, 10890–10901.
Gerschütz, A., Heinsen, H., Grünblatt, E., Wagner, A., Bartl, J., Meissner, C., et al. (2013). Neuron-specific mitochondrial DNA deletion levels in sporadic Alzheimer’s disease. Curr. Alzheimer Res. 10, 1041–1046. doi: 10.2174/15672050113106660166
Glickman, M. H., and Ciechanover, A. (2002). The ubiquitin-proteasome proteolytic pathway: Destruction for the sake of construction. Physiol. Rev. 82, 373–428.
Groh, S., and Schotta, G. (2017). Silencing of endogenous retroviruses by heterochromatin. Cell. Mol. Life Sci. 74, 2055–2065.
Gu, Z., Gu, L., Eils, R., Schlesner, M., and Brors, B. (2014). Circlize implements and enhances circular visualization in R. Bioinformatics 30, 2811–2812. doi: 10.1093/bioinformatics/btu393
Guo, C., Jeong, H., Hsieh, Y., Klein, H., Bennett, D., De Jager, P., et al. (2018). Tau activates transposable elements in Alzheimer’s disease. Cell Rep. 23, 2874–2880.
Han, M. H., Jiao, S., Jia, J., Chen, Y., Chen, C., Gucek, M., et al. (2013). The novel caspase-3 substrate Gap43 is involved in AMPA receptor endocytosis and long-term depression. Mol. Cell. Proteomics 12, 3719–3731. doi: 10.1074/mcp.M113.030676
He, Z., Zhang, Y., Zhang, H., Zhou, C., Ma, Q., Deng, P., et al. (2021). NAC antagonizes arsenic-induced neurotoxicity through TMEM179 by inhibiting oxidative stress in Oli-neu cells. Ecotoxicol. Environ. Saf. 223:112554. doi: 10.1016/j.ecoenv.2021.112554
Heneka, M. T., Carson, M., El Khoury, J., Landreth, G., Brosseron, F., Feinstein, D., et al. (2015). Neuroinflammation in Alzheimer’s disease. Lancet Neurol. 14, 388–405.
Hoyt, S. J., Storer, J., Hartley, G., Grady, P., Gershman, A., de Lima, L., et al. (2022). From telomere to telomere: The transcriptional and epigenetic state of human repeat elements. Science 376:eabk3112.
Ibba, G., Piu, C., Uleri, E., Serra, C., and Dolei, A. (2018). Disruption by SaCas9 endonuclease of HERV-Kenv, a retroviral gene with oncogenic and neuropathogenic potential, inhibits molecules involved in cancer and amyotrophic lateral sclerosis. Viruses 10:412. doi: 10.3390/v10080412
Ito, J., Sugimoto, R., Nakaoka, H., Yamada, S., Kimura, T., Hayano, T., et al. (2017). Systematic identification and characterization of regulatory elements derived from human endogenous retroviruses. PLoS Genet. 13:e1006883. doi: 10.1371/journal.pgen.1006883
Jacques, P. E., Jeyakani, J., and Bourque, G. (2013). The majority of primate-specific regulatory sequences are derived from transposable elements. PLoS Genet. 9:e1003504. doi: 10.1371/journal.pgen.1003504
Johnston, J. B., Silva, C., Holden, J., Warren, K., Clark, A., and Power, C. (2001). Monocyte activation and differentiation augment human endogenous retrovirus expression: Implications for inflammatory brain diseases. Ann. Neurol. 50, 434–442. doi: 10.1002/ana.1131
Keller, J. N., Hanni, K. B., and Markesbery, W. R. (2001). Impaired proteasome function in Alzheimer’s disease. J. Neurochem. 75, 436–439.
Korshunova, I., Caroni, P., Kolkova, K., Berezin, V., Bock, E., and Walmod, P. (2008). Characterization of BASP1-mediated neurite outgrowth. J. Neurosci. Res. 86, 2201–2213. doi: 10.1002/jnr.21678
Kurt, S., Tomatir, A. G., Tokgun, P. E., and Oncel, C. (2020). Altered expression of long non-coding RNAs in peripheral blood mononuclear cells of patients with Alzheimer’s disease. Mol. Neurobiol. 57, 5352–5361.
Langmead, B., and Salzberg, S. L. (2012). Fast gapped-read alignment with Bowtie 2. Nat. Methods 9, 357–359. doi: 10.1038/nmeth.1923
Lee, M. J., Lee, J. H., and Rubinsztein, D. C. (2013). Tau degradation: The ubiquitin–proteasome system versus the autophagy-lysosome system. Prog. Neurobiol. 105, 49–59. doi: 10.1016/j.pneurobio.2013.03.001
Leek, J., Johnson, W. E., Parker, H. S., Jaffe, A. E., and Storey, J. D. (2012). The sva package for removing batch effects and other unwanted variation in high-throughput experiments. Bioinformatics 28, 882–883.
Li, W., Lee, M., Henderson, L., Tyagi, R., Bachani, M., Steiner, J., et al. (2015). Human endogenous retrovirus-K contributes to motor neuron disease. Sci. Transl. Med. 7:307ra153.
Li, Z., Farias, F., Dube, U., Del-Aguila, J., Mihindukulasuriya, K., Fernandez, M., et al. (2020). The TMEM106B FTLD-protective variant, rs1990621, is also associated with increased neuronal proportion. Acta Neuropathol. 139, 45–61. doi: 10.1007/s00401-019-02066-0
Liao, Y., Smyth, G. K., and Shi, W. (2014). featureCounts: An efficient general purpose program for assigning sequence reads to genomic features. Bioinformatics 30, 923–930. doi: 10.1093/bioinformatics/btt656
Longo, M. S., Carone, D., NISC Comparative Sequencing Program, E. Green, M. O’Neill, and R. J. O’Neill (2009). Distinct retroelement classes define evolutionary breakpoints demarcating sites of evolutionary novelty. BMC Genomics 10:334. doi: 10.1186/1471-2164-10-334
López Salon, M., Morelli, L., Castaño, E. M., Soto, E. F., and Pasquini, J. M. (2000). Defective ubiquitination of cerebral proteins in Alzheimer’s disease. J. Neurosci. Res. 62, 302–310.
Love, M., Huber, W., and Anders, S. (2014). Moderated estimation of fold change and dispersion for RNA-seq data with DESeq2. Genome Biol. 15:550. doi: 10.1186/s13059-014-0550-8
Madabhushi, R., Pan, L., and Tsai, L.-H. (2014). DNA damage and its links to neurodegeneration. Neuron 83, 266–282.
Mameli, G., Poddighe, L., Mei, A., Uleri, E., Sotgiu, S., Serra, C., et al. (2012). Expression and activation by epstein barr virus of human endogenous retroviruses-W in blood cells and astrocytes: Inference for multiple sclerosis. PLoS One 7:e44991. doi: 10.1371/journal.pone.0044991
Marchese, F. P. I, Raimondi, M., and Huarte. (2017). The multidimensional mechanisms of long noncoding RNA function. Genome Biol. 18:206.
McShea, A., Harris, P. L., Webster, K. R., Wahl, A. F., and Smith, M. A. (1997). Abnormal expression of the cell cycle regulators P16 and CDK4 in Alzheimer’s disease. Am. J. Pathol. 150, 1933–1939.
Mercer, T. R., Dinger, M. E., and Mattick, J. S. (2009). Long non-coding RNAs: Insights into functions. Nat. Rev. Genet. 10, 155–159.
Moerman, T., Aibar, S. S., Bravo González-Blas, C., Simm, J., Moreau, Y., Aerts, J., et al. (2019). GRNBoost2 and Arboreto: Efficient and scalable inference of gene regulatory networks. Bioinformatics 35, 2159–2161. doi: 10.1093/bioinformatics/bty916
Musunuri, S., Wetterhall, M., Ingelsson, M., Lannfelt, L., Artemenko, K., Bergquist, J., et al. (2014). Quantification of the brain proteome in Alzheimer’s disease using multiplexed mass spectrometry. J. Proteome Res. 13, 2056–2068.
Nativio, R., Lan, Y., Donahue, G., Sidoli, S., Berson, A., Srinivasan, A., et al. (2020). An integrated multi-omics approach identifies epigenetic alterations associated with Alzheimer’s disease. Nat. Genet. 52, 1024–1035.
Ohnuki, M., Tanabe, K., Sutou, K., Teramoto, I., Sawamura, Y., Narita, M., et al. (2014). Dynamic regulation of human endogenous retroviruses mediates factor-induced reprogramming and differentiation potential. Proc. Natl. Acad. Sci. U.S.A. 111, 12426–12431. doi: 10.1073/pnas.1413299111
Pehrsson, E. C., Choudhary, M. N. K., Sundaram, V., and Wang, T. (2019). The epigenomic landscape of transposable elements across normal human development and anatomy. Nat. Commun. 10:5640. doi: 10.1038/s41467-019-13555-x
Perron, H., Garson, J., Bedin, F., Beseme, F., Paranhos-Baccala, G., Komurian-Pradel, F., et al. (1997). Molecular identification of a novel retrovirus repeatedly isolated from patients with multiple sclerosis. Proc. Natl. Acad. Sci. U.S.A. 94, 7583–7588. doi: 10.1073/pnas.94.14.7583
Perron, H., Jouvin-Marche, E., Michel, M., Ounanian-Paraz, A., Camelo, S., Dumon, A., et al. (2001). Multiple sclerosis retrovirus particles and recombinant envelope trigger an abnormal immune response in vitro, by inducing polyclonal Vβ16 T-lymphocyte activation. Virology 287, 321–332.
Perron, H., Lazarini, F., Ruprecht, K., Péchoux-Longin, C., Seilhean, D., Sazdovitch, V., et al. (2005). Human endogenous retrovirus (HERV)-W ENV and GAG proteins: Physiological expression in human brain and pathophysiological modulation in multiple sclerosis lesions. J. Neurovirol. 11, 23–33. doi: 10.1080/13550280590901741
Pickering, A., Linder, R. A., Zhang, H., Forman, H. J., and Davies, K. J. A. (2012). Nrf2-dependent induction of proteasome and Pa28αβ regulator are required for adaptation to oxidative stress. J. Biol. Chem. 287, 10021–10031.
Ramsey, C. P., Glass, C., Montgomery, M., Lindl, K., Ritson, G., Chia, L., et al. (2007). Expression of Nrf2 in neurodegenerative diseases. J. Neuropathol. Exp. Neurol. 66, 75–85.
Rau, A., Gallopin, M., Celeux, G., and Jaffrézic, F. (2013). Data-based filtering for replicated high-throughput transcriptome sequencing experiments. Bioinformatics 29, 2146–2152. doi: 10.1093/bioinformatics/btt350
Rebollo, R., Romanish, M. T., and Mager, D. L. (2012). Transposable elements: An abundant and natural source of regulatory sequences for host genes. Annu. Rev. Genet. 46, 21–42. doi: 10.1146/annurev-genet-110711-155621
Ruiz-Herrera, A., Castresana, J., and Robinson, T. J. (2006). Is mammalian chromosomal evolution driven by regions of genome fragility? Genome Biol. 7, R115.
Schmit, K., and Michiels, C. (2018). TMEM proteins in cancer: A review. Front. Pharmacol. 9:1345. doi: 10.3389/fphar.2018.01345
Seifarth, W., Frank, O., Zeilfelder, U., Spiess, B., Greenwood, A., Hehlmann, R., et al. (2005). Comprehensive analysis of human endogenous retrovirus transcriptional activity in human tissues with a retrovirus-specific microarray. J. Virol. 79, 341–352. doi: 10.1128/JVI.79.1.341-352.2005
Stauffer, Y., Theiler, G., Sperisen, P., Lebedev, Y., and Jongeneel, C. V. (2004). Digital expression profiles of human endogenous retroviral families in normal and cancerous tissues. Cancer Immun. 4:2.
Stiemke, A. B., Sah, E., Simpson, R., Lu, L., Williams, R., and Jablonski, M. (2020). Systems genetics of optic nerve axon necrosis during glaucoma. Front. Genet. 11:31. doi: 10.3389/fgene.2020.00031
Straten, G., Eschweiler, G. W., Maetzler, W., Laske, C., and Leyhe, T. (2009). Glial cell-line derived neurotrophic factor (GDNF) concentrations in cerebrospinal fluid and serum of patients with early Alzheimer’s disease and normal controls. J. Alzheimers Dis. 18, 331–337. doi: 10.3233/JAD-2009-1146
Sun, W., Samimi, H., Gamez, M., Zare, H., and Frost, B. (2018). Pathogenic tau-induced piRNA depletion promotes neuronal death through transposable element dysregulation in neurodegenerative tauopathies. Nat. Neurosci. 21, 1038–1048. doi: 10.1038/s41593-018-0194-1
Sundaram, V., Cheng, Y., Ma, Z., Li, D., Xing, X., Edge, P., et al. (2014). Widespread contribution of transposable elements to the innovation of gene regulatory networks. Genome Res. 24, 1963–1976. doi: 10.1101/gr.168872.113
Tagawa, K., Homma, H., Saito, A., Fujita, K., Chen, X., Imoto, S., et al. (2015). Comprehensive phosphoproteome analysis unravels the core signaling network that initiates the earliest synapse pathology in preclinical Alzheimer’s disease brain. Hum. Mol. Genet. 24, 540–558. doi: 10.1093/hmg/ddu475
The Gene Ontology Consortium (2019). The gene ontology resource: 20 years and still going strong. Nucleic Acids Res. 47, D330–D338. doi: 10.1093/nar/gky1055
Thomas-Gatewood, C., Neeb, Z., Bulley, S., Adebiyi, A., Bannister, J., Leo, M., et al. (2011). TMEM16A channels generate Ca2+ -activated Cl - currents in cerebral artery smooth muscle cells. Am. J. Physiol. Heart Circ. Physiol. 301, H1819–H1827.
Tiraboschi, P., Hansen, L. A., Thal, L. J., and Corey-Bloom, J. (2004). The importance of neuritic plaques and tangles to the development and evolution of AD. Neurology 62, 1984–1989. doi: 10.1212/01.wnl.0000129697.01779.0a
Vincent, I., Jicha, G., Rosado, M., and Dickson, D. W. (1997). Aberrant expression of mitotic Cdc2/Cyclin B1 kinase in degenerating neurons of Alzheimer’s disease brain. J. Neurosci. 17, 3588–3598. doi: 10.1523/JNEUROSCI.17-10-03588.1997
Wang, D., Wang, P., Bian, X., Xu, S., Zhou, Q., Zhang, Y., et al. (2020). Elevated plasma levels of exosomal BACE1-AS combined with the volume and thickness of the right entorhinal cortex may serve as a biomarker for the detection of Alzheimer’s disease. Mol. Med. Rep. 22, 227–238. doi: 10.3892/mmr.2020.11118
Wapinski, O., and Chang, H. Y. (2011). Long noncoding RNAs and human disease. Trends Cell Biol. 21, 354–361.
Weeber, E. J., Atkins, C., Selcher, J., Varga, A., Mirnikjoo, B., Paylor, R., et al. (2000). A role for the β isoform of protein kinase C in fear conditioning. J. Neurosci. 20, 5906–5914.
Yamamoto, Y., Sokawa, Y., and Maekawa, S. (1997). Biochemical evidence for the presence of NAP-22, a novel acidic calmodulin binding protein, in the synaptic vesicles of rat brain. Neurosci. Lett. 224, 127–130. doi: 10.1016/s0304-3940(97)13482-6
Yang, Y., Geldmacher, D. S., and Herrup, K. (2001). DNA replication precedes neuronal cell death in Alzheimer’s disease. J. Neurosci. 21, 2661–2668. doi: 10.1523/JNEUROSCI.21-08-02661.2001
Yu, M., Hu, X., Pan, Z., Du, C., Jiang, J., Zheng, W., et al. (2023). Endogenous retrovirus-derived enhancers confer the transcriptional regulation of human trophoblast syncytialization. Nucleic Acids Res. 51, 4745–4759. doi: 10.1093/nar/gkad109
Keywords: Alzheimer’s disease, HERV, endogenous retrovirus, RNA-Seq, gene expression
Citation: Dawson T, Rentia U, Sanford J, Cruchaga C, Kauwe JSK and Crandall KA (2023) Locus specific endogenous retroviral expression associated with Alzheimer’s disease. Front. Aging Neurosci. 15:1186470. doi: 10.3389/fnagi.2023.1186470
Received: 14 March 2023; Accepted: 13 June 2023;
Published: 06 July 2023.
Edited by:
Woon-Man Kung, Chinese Culture University, TaiwanReviewed by:
Nihay Laham Karam, University of Eastern Finland, FinlandTara Patricia Hurst, University of Oxford, United Kingdom
Copyright © 2023 Dawson, Rentia, Sanford, Cruchaga, Kauwe and Crandall. This is an open-access article distributed under the terms of the Creative Commons Attribution License (CC BY). The use, distribution or reproduction in other forums is permitted, provided the original author(s) and the copyright owner(s) are credited and that the original publication in this journal is cited, in accordance with accepted academic practice. No use, distribution or reproduction is permitted which does not comply with these terms.
*Correspondence: Tyson Dawson, dHlzb25kYXdzb25AZ21haWwuY29t
†These authors share first authorship