 Xianxiao Zhou1,2,3
 Jiqing Cao4,5Li Zhu4,5
 Kurt Farrell6
 Minghui Wang1,2,3Lei Guo1,2,3Jialiang Yang1,3
 Andrew McKenzie1John F. Crary6
 Dongming Cai4,5,7,8
 Zhidong Tu1,3
 Bin Zhang1,2,3*
- 1Department of Genetics and Genomic Sciences, Icahn School of Medicine at Mount Sinai, New York, NY, United States
- 2Mount Sinai Center for Transformative Disease Modeling, Icahn School of Medicine at Mount Sinai, New York, NY, United States
- 3Icahn Institute for Data Science and Genomic Technology, Icahn School of Medicine at Mount Sinai, New York, NY, United States
- 4Department of Neurology, Icahn School of Medicine at Mount Sinai, New York, NY, United States
- 5Research & Development, James J. Peters VA Medical Center, Bronx, NY, United States
- 6Neuropathology Brain Bank & Research CoRE, Icahn School of Medicine at Mount Sinai, New York, NY, United States
- 7Alzheimer’s Disease Research Center, Icahn School of Medicine at Mount Sinai, New York, NY, United States
- 8Ronald M. Loeb Center for Alzheimer’s Disease, Icahn School of Medicine at Mount Sinai, New York, NY, United States
Background: Aging-related cognitive decline is associated with brain structural changes and synaptic loss. However, the molecular mechanisms of cognitive decline during normal aging remain elusive.
Results: Using the GTEx transcriptomic data from 13 brain regions, we identified aging-associated molecular alterations and cell-type compositions in males and females. We further constructed gene co-expression networks and identified aging-associated modules and key regulators shared by both sexes or specific to males or females. A few brain regions such as the hippocampus and the hypothalamus show specific vulnerability in males, while the cerebellar hemisphere and the anterior cingulate cortex regions manifest greater vulnerability in females than in males. Immune response genes are positively correlated with age, whereas those involved in neurogenesis are negatively correlated with age. Aging-associated genes identified in the hippocampus and the frontal cortex are significantly enriched for gene signatures implicated in Alzheimer’s disease (AD) pathogenesis. In the hippocampus, a male-specific co-expression module is driven by key synaptic signaling regulators including VSNL1, INA, CHN1 and KCNH1; while in the cortex, a female-specific module is associated with neuron projection morphogenesis, which is driven by key regulators including SRPK2, REPS2 and FXYD1. In the cerebellar hemisphere, a myelination-associated module shared by males and females is driven by key regulators such as MOG, ENPP2, MYRF, ANLN, MAG and PLP1, which have been implicated in the development of AD and other neurodegenerative diseases.
Conclusions: This integrative network biology study systematically identifies molecular signatures and networks underlying brain regional vulnerability to aging in males and females. The findings pave the way for understanding the molecular mechanisms of gender differences in developing neurodegenerative diseases such as AD.
Introduction
Aging-associated changes in the human brain contribute to the decline of cognitive functions and the development of various neurodegenerative disorders (Hsu et al., 2008; Lopez-Otin et al., 2013). Gender-specific changes in aging processes may contribute to the differences in the prevalence of several neurological disorders between males and females. For instance, the incidence rate of Parkinson’s disease in males is about 2-fold as in females (19.0/100K in males vs. 9.9/100K in females) (Picillo et al., 2017), while there are more females (3.3 million) living with Alzheimer’s disease than males (2.0 million) (Alzheimer’s Association, 2015; Nebel et al., 2018). Neuro-imaging studies have found many gender differences in structural changes during brain aging (Murphy et al., 1996; Raz et al., 1997; Coffey et al., 1998; Hsu et al., 2008; Kiraly et al., 2016). For example, age-associated brain volume loss in the frontal and temporal lobes is much more significant in men than women, while in the hippocampus and the parietal lobes, the loss is greater in women (Murphy et al., 1996). Another study found that the age-related decrease in brain grey matter volume at the caudate nucleus, putamen and thalamic regions is greater in men with a faster rate of decline than in women (Kiraly et al., 2016). In contrast, females have a lower white matter volume in the right deep temporal regions than males (Hsu et al., 2008). White matter alterations during aging in the precentral, cingulate, and anterior temporal regions also showed significant differences between males and females (Hsu et al., 2008). These findings suggest sex dimorphism in aging-associated microstructural changes across brain regions. However, molecular mechanisms underlying gender-specific age-related structural changes remain elusive (Flood et al., 1987; Pakkenberg et al., 2003; Bertoni-Freddari et al., 2007). The sex dimorphism at the brain morphological levels is probably induced by various molecular changes such as different hormone levels and epigenetic modifications and gene expression alterations.
There were 9 established cellular and molecular hallmarks of aging (Lopez-Otin et al., 2013), including genomic instability, epigenetic alterations, telomere attrition, mitochondrial dysfunction, proteostasis dysfunction, cellular senescence, deregulated nutrient sensing, stem cell exhaustion, and altered intercellular communication. Many studies have shown that these hallmarks are sexually dimorphic factors associated with aging (Barrett and Richardson, 2011; Dulken and Brunet, 2015; Gaignard et al., 2015; Gentilini et al., 2015; Fischer and Riddle, 2018). For example, genomic instability, such as mutation and genetic mosaicism rate, is higher in males than in females (Machiela et al., 2015; Podolskiy et al., 2016). On the other hand, aging hallmarks showed differences in gene expression patterns between males and females. Two studies of the Zebrafish brain showed that aging alters gene expression and molecular dynamics of synapses in a sexually dimorphic pattern (Arslan-Ergul and Adams, 2014; Karoglu et al., 2017). Sexually dimorphism is also found in aging-related neuroinflammation in the mouse hippocampus (Mangold et al., 2017). Compared to animal studies, very few studies have examined sex differences in human brain aging at a global molecular level. A study of the microarray data of 40 samples from 4 brain regions including entorhinal cortex (EC), hippocampus (HIPP_MA), postcentral gyrus (PCG), prefrontal cortex (PFC) and superior frontal gyrus (SFG) by Berchtold et al., showed that more genes are changed in males than in females across 4 brain regions during aging (Berchtold et al., 2008). Expression of the genes involved in energy metabolism and protein synthesis was found to decrease with aging, while immune-related genes were activated in both sexes during aging, with greater alteration in the female brains (Berchtold et al., 2008).
In this study, we aim to systematically investigate sex differences of normal aging by examining RNA-Seq data collected from 13 regions in the Genotype-Tissue Expression (GTEx) project (GTEx Consortium, 2015). We identified aging-associated gene expression patterns, gene co-expression network modules and key network drivers in male and female brains. We further studied the aging associated molecular signatures and modules shared by both genders or specific to a gender group as well as their roles in neurodegenerative disorders such as Alzheimer’s disease.
Materials and methods
GTEx data processing
GTEx RNA-Seq read counts and metadata were downloaded from GTEx Portal phs000424.v7.p2.1 Raw read counts for brain regions were extracted and a total of 1,671 samples from 13 brain regions were retained (Table 1). The demographic and neuropathological information of those subjects was summarized in Supplementary Table 1. Lowly expressed genes with expression levels of at least 1 count per million in less than 20% of samples were removed. A total of 16,494 genes were retained for further analysis. Next, normalization factors were computed on the filtered data matrix using the weighted trimmed mean of M-values (TMM) method, followed by log2 transformation and voom (Law et al., 2014) mean-variance analysis in preparation for Limma linear modeling. The normalized expression data were then split into matrices for males and females in each of the 13 brain regions.
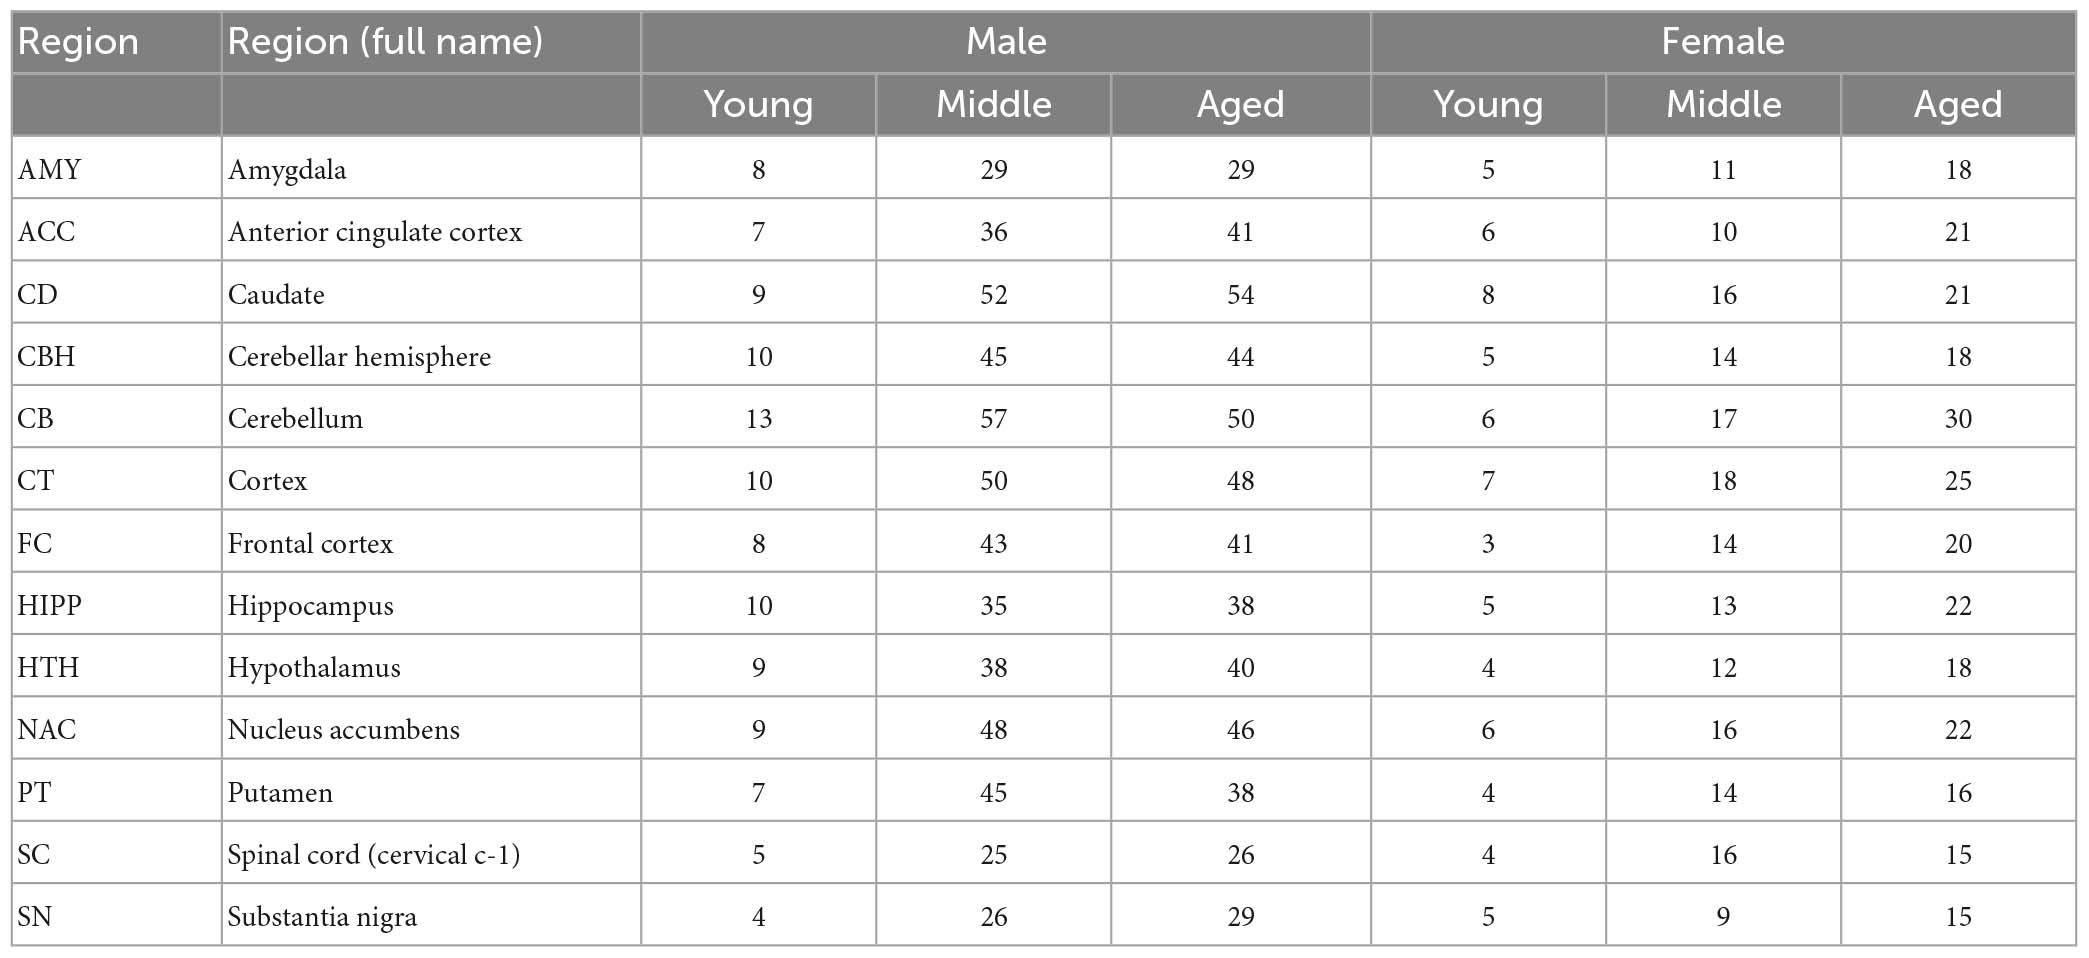
Table 1. Summary of sample sizes for gender and age in the 13 brain regions.
Identification of age-correlated genes (ACGs)
Pearson correlation coefficients were calculated between expression levels of each gene and age for males and females, respectively, in each of the 13 brain regions. P-values were corrected by the Benjamini-Hochberg (BH) procedure (Benjamini and Hochberg, 1995) to adjust for multiple testing. To identify the differentially expressed genes (DEGs) between aged and young brains, we split samples in each brain region into 3 groups: young adult (age < 45), middle-aged (45 ≤ age < 60) and aged adult (age ≥ 60). DEGs between each pair of the 3 groups were identified using the eBayes method to fit gene expression to a linear model implemented by the limma R package (Ritchie et al., 2015). Sample labels were permuted 1,000 times to obtain a null distribution of t-statistics across all genes. The original t-statistic of each gene was compared to the null distribution to calculate the FDR of that gene. Genes identified as age-positively correlated genes (APCGs) or age-negatively correlated genes (ANCGs) in at least one region for both males and females were classified as consistent APCGs (or ANCGs). Genes identified as APCGs (or ANCGs) in at least one region for either only males or only females were classified as male-specific or female-specific APCGs (or ANCGs).
To test the influence of sample size in the identification of ACGs and DEGs, we randomly chose a subset of samples from each region to identify ACGs and DEGs with the same procedure as above. From the male samples in each age group, we randomly selected the same number of samples as a corresponding female group. The samples of the 3 groups were then used to identify ACGs and DEGs with the above-described procedures. This process was repeated 1,000 times to estimate distributions for the numbers of ACG and DEG in each region. P-value was calculated as the number of tests with ACGs/DEGs no less than the number of ACGs/DEGs identified in the original sample set in that brain region, dividing the number of repeats (i.e., 1,000).
We also performed an interaction analysis on age and gender with all genes in addition to the analysis of each gender. We built our model as follows:
where BMI is Body Mass Index, DTHHRDY is a factor of death classification, disease or injury, leading to the cause of death listed in immediate cause of death. TRISCHD is the ischemic time interval between actual death, presumed death, or cross-clamp application and the start of the GTEx procedure. β indicates fixed linear effects and μ is a random effect.
dbGaP data sets preprocessing
To validate the ACGs identified from the GTEx dataset, we downloaded an RNA-seq data set from the study of mRNA Sequencing of Human Cerebral Frontal Cortex (dbGaP Study Accession: phs001353.v1.p1) in North American Brain Expression Consortium (NABEC) (Dillman et al., 2017). Raw sequencing data were aligned to human genome HG38 using the STAR aligner (Dobin et al., 2013) and assigned to genes using the featureCounts (Liao et al., 2014). Count matrix was preprocessed and normalized using the same procedure of GTEx above. To match the age range with the GTEx cohort, individuals younger than 20 or older than 70 were excluded from the following analysis. After correcting for post-mortem interval, ACGs of the dbGaP FC were identified using the Pearson correlation for male and female, respectively. FC region male-specific APCGs and ANCGs were identified by removing APCGs and ANCGs in females, respectively, and vice versa.
Human samples for validation
Formalin-fixation paraffin-embedded human brain tissues from the hippocampal formation were obtained from the Neuropathology Brain Bank & Research CoRE, in accordance with the relevant guidelines and policies of the Icahn School of Medicine at Mount Sinai (ISMMS). The experimental procedures involving human sample handling were approved by the appropriate committee at James J. Peters VA Medical Center (JJP VAMC) and ISMMS. Demographic information with 5–6 individuals/group is provided in Table 4. A comprehensive neuropathological assessment was performed on each brain to rule out the presence of a major neurodegenerative disease in excess of normal aging. Selection criteria was based on biological sex and age of death and the absence of any clinical or neuropathological neurodegenerative features. Middle-age subjects included anyone between the ages of 42–59 years old and “aged” subjects included anyone over the age of 60. Clinical exclusion criteria included dementia or movement disorder diagnosis following a comprehensive chart review. Neuropathological exclusion criteria included any macro or microscopic neurodegenerative changes (i.e., Lewy bodies, neuritic plaques, neuronal atrophy, neocortical neurofibrillary tangles, etc.) with the exception of vascular pathology and/or mild age-related changes (i.e., primary age-related tauopathy or other common age-related changes) (Crary et al., 2014).
Real-time quantitative polymerase chain reaction (RT-qPCR)
The total RNA was extracted using the RNeasy FFPE kit following the instructions provided by the manufacture (Qiagen). The mRNA levels of genes of interest (CD99) were determined by RT-qPCR analysis. The CD99 mRNAs were normalized to actin and then transformed to log2 fold changes when testing the significance of the differences between the groups using the Student’s t-test.
Cell type and neuron loss rate estimation
For each sample, proportions of 6 brain cell types were inferred from the normalized gene expression data using the digital sorting algorithm (Zhong et al., 2013) with the cell markers of the 6 brain cell types extracted from the BRETIGEA package (McKenzie et al., 2018). Spearman correlation coefficient and p-value were then calculated between the proportion of each cell type and age for each brain region. The p-values were corrected using the BH procedure (Benjamini and Hochberg, 1995). The R package DGCA (McKenzie et al., 2016) was used to calculate the correlation difference of cell-type proportions and age between males and females. The adjusted p-values of the DGCA analysis were estimated using 1,000 permutations. To measure the median cell type change rate across age, we also fitted the cell type proportions with age using the non-parametric Theil–Sen estimator (Sen, 1968), which is insensitive to outliers by calculating the median of the slopes of all fitting lines through pairs of points. In addition, a down-sampling analysis was performed on the male samples for calculated the correlation coefficient 1,000 times to test whether neuron proportion was significantly correlated with age in the males with the same number of samples as the females.
Co-expression network construction and downstream analysis
Gene co-expression networks were constructed based on normalized gene expression levels for the males or females in each of the 13 brain regions using the Multiscale Embedded Gene Co-expression Network Analysis (MEGENA) (Song and Zhang, 2015). For each gender group in each brain region, a planar-filtered network was first constructed, and then a multiscale clustering analysis was performed to identify gene co-expression modules at multiple compactness scales. Modules were then compared to random PFN modules generated by shuffling the link weights of the parent cluster to calculate statistical significance. Lastly, a multiscale hub analysis was conducted to identify highly connected hubs of each significant module. Modules with too many (>5,000) or too few (<50) genes were excluded from further analysis.
For each brain region in each gender group, genes in the identified modules were mapped with their respective rankings of correlation coefficients with age and fold changes (log2 transformed) between aged and young adults to quantify modules’ relevance with aging. The significance of a module’s association with aging was calculated using a logistic regression approach LRpath (Sartor et al., 2009), and p-values were then adjusted with Bonferroni correction. A module of a brain region in the males or females was defined as an age-associated module if it was significantly enriched with ACGs and/or aged-young DEGs in the same gender of that region.
Gene ontology (GO) biological process and pathway enrichment analysis
GO biological process and KEGG pathway enrichment analysis was performed using the R package GO-function (Wang et al., 2012). GO biological processes with at least 1 human gene annotated in the org.Hs.eg.db were extracted from GO.db data package in Bioconductor version v3.5 (Huber et al., 2015). Similarly, KEGG pathways with at least one human gene annotated were extracted from the KEGG.db data package (Huber et al., 2015). The input for the analysis was either a set of co-expression modules or a gene signature such as age positively-correlated genes (APCGs), age negatively-correlated genes (ANCGs), up-regulated genes or down-regulated genes in aged brains versus young brains in male/female group. The p-value for an intersection was calculated by the hypergeometric distribution test and corrected using the BH procedure (Benjamini and Hochberg, 1995).
Module preservation and visualization
Module preservation was calculated among modules between the male and female networks for each brain region. To identify common and unique modules, we applied the following procedures: firstly, the significance of the overlap between any two modules was calculated using FET. P-value was corrected by the BH procedure (Benjamini and Hochberg, 1995). We then defined set overlap as follows:
where A and B were sets of genes in two modules under consideration. Lastly, two modules were considered preserved if the adjusted FET p-value was less than 0.05 and the set overlap size was at least 30%. A male module and a female module were defined as preserved aging-associated modules if they were preserved and significantly enriched with ACGs and/or aged-young DEGs. Otherwise, an aging-associated module was defined as a gender-specific aging-associated module if it was not enriched with ACGs/DEGs or not preserved in the other gender network. Circos plots were employed to visualize various features of the modules in a co-expression network using the R package NetWeaver (Wang et al., 2016). Global co-expression networks and modules were visualized using Cytoscape (v3.3.0) (Shannon et al., 2003).
Results
Males are more vulnerable to brain aging with greater neuron loss and microglia gain
The sample demographics of the 13 brain regions are summarized in Table 1. The age range of the subjects is between 20 and 70. There is no significant difference in the age distribution between the two gender groups in each of the 13 brain regions (Kolmogorov–Smirnov test, p ≥ 0.18; Supplementary Figure 1). Notably, the number of male samples is approximately twice of female ones in each region. The neuropathological characters and confounding factors, including neurodegenerative diseases, post-mortem delay and immediate cause of death, are summarized for each brain region in Supplementary Table 1.
We first inferred the proportions of 6 brain cell types for each sample. Generally, we found that the proportion of neurons was negatively correlated with age, while the proportion of microglia was positively correlated with age (Table 2). Specifically, under an FDR cutoff of 0.05, the proportion of neurons was negatively correlated with age in the CD, CBH, CT, FC, HIPP, HTH, NAC and SC regions in the males, while in the other 5 regions, the negative correlation was non-significant with adjusted p-values < 0.2 (0.064–0.184) (Table 2). In contrast, the negative correlation with age was significant in 3 brain regions in the females, i.e., ACC, CT and CB. To estimate the cell type rate of changes during aging in these brain regions, we fitted the cell type proportions with age using Theil–Sen estimator. We found that neuronal loss was faster in the males than in the females in 9 brain regions, including AMY, CD, CBH, CB, HIPP, HTH, NAC, PT and SC (Supplementary Table 2), while the females showed a more neuronal loss in the CT and SN regions than the males. However, the difference was not significant in most of the regions except SC, in which males (ρ = −0.379) and females (ρ = 0.044) showed a significant difference in correlations between neuron proportions and age (adjusted p-value = 0.03). In contrast, the males and the females had a similar rate of increase in microglia proportion with aging across all the brain regions except CD, in which the males gained more microglia than the females. In addition, the astrocyte proportion was altered in a regional- and sex-specific manner during aging. Specifically, the astrocyte proportion increased with age in the CT region of both males and females and the male FC and CB regions. However, in the SC region, the astrocyte proportion was negatively correlated with age in the females (ρ = −0.437, adjusted p = 0.05) but positively correlated with age in the males (ρ = 0.253, adjusted p = 0.16) (Supplementary Table 2). In summary, these results indicate that brain aging is accompanied by the decreased neuron proportion and the decreased microglia proportion.
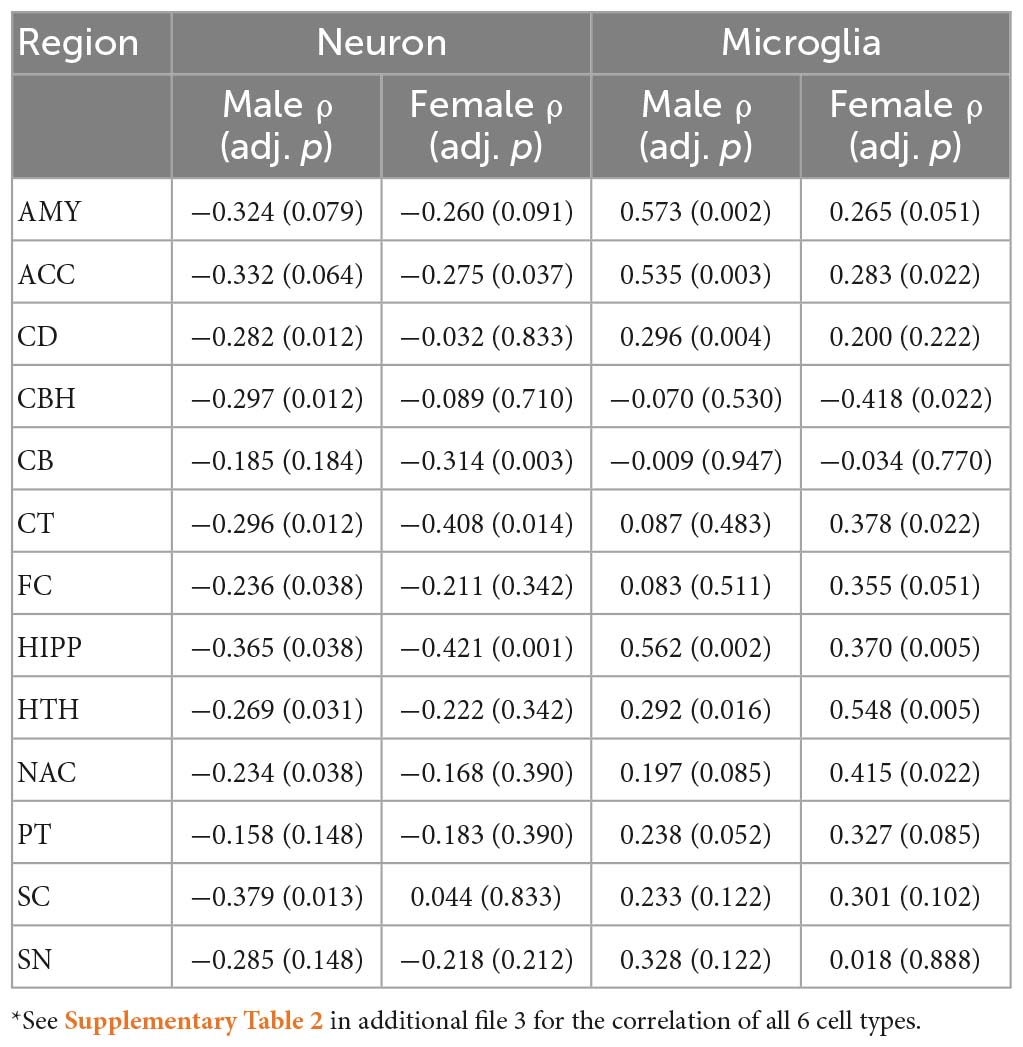
Table 2. Correlations of cell proportions and age in the males and females*.
ACGs can be reproducibly identified in males and females
We performed a standard transcriptome-wide association study to identify genes whose expression levels were associated with age. With a false discovery rate (FDR) cutoff of 5%, correlations between gene expression and age in the 13 brain regions were calculated separately for the male and female groups (Table 3). Nine regions in the males have over 100 genes correlated with age, but only 4 regions in the females have over 100 age-correlated genes (ACGs). In the males, there were 546 to 3,709 genes whose expression levels were positively or negatively correlated with age in the AMY, CD, CBH, CB, CT, FC, HIPP and HTH regions while the numbers of ACGs in the ACC, NAC, PT and SC regions were much smaller. Notably, more than 95% of the ACGs in the SC were negatively correlated with age.
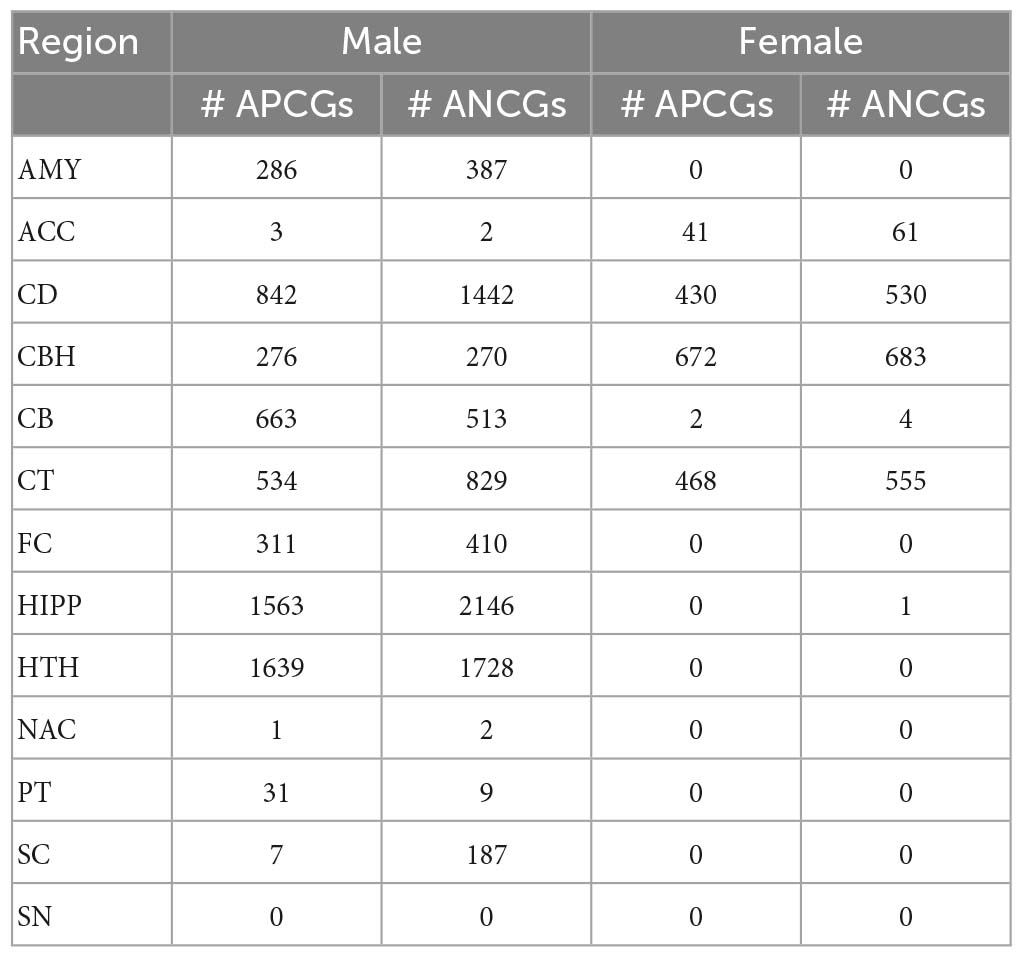
Table 3. Number of age-correlated genes identified in the males and females.
In general, there are fewer ACGs in females than in males. Specifically, we identified only 6 ACGs in the female CB region and 1 for the HIPP region. No ACG was identified in the female AMY, FC, HTH, NAC, PT, SC and SN regions. For CD and CT regions, we identified approximately 1,000 ACGs in the females, which were also less than those in males of these regions. However, we identified 102 and 1,355 ACGs in the female ACC and CBH regions, respectively, which were more than the ACG numbers in the same regions of the males though the female sample sizes were smaller. We identified a similar number of ACGs using Spearman correlation (Supplementary Table 3). These results suggested that the ACC and CBH region were probably more vulnerable in females than in males. In addition, we also identified more DEGs between the aged and young individuals in males than in females (Supplementary Table 4). To summarize, we identified more ACGs in the males than in the females across 11 brain regions except for the ACC and CBH regions.
To investigate the overlap between ACGs in the males and females across the 13 brain regions, we performed Fisher’s Exact Test (FET) for ACG sets with at least one gene. Figure 1A shows the overlaps between these ACG signatures. Note that the reported significance was corrected for multiple testing. There were significant overlaps between the APCG signatures in different brain regions within each gender group and across two groups. A similar pattern was also observed for the ANCG signatures. In contrast, there was no significant overlap between the APCG and ANCG signatures across the 13 regions and two gender groups. To further compare the ACGs from the brain with ACGs signatures from other organs, we performed an enrichment analysis using Fisher’s exact test. After correcting the p-values using the BH procedure, we found that the APCGs and ANCGs of the brain regions were significantly enriched for their counterparts in the heart and artery (Yang et al., 2015; Supplementary Table 5). To validate the ACG signatures, we used an independent RNA-seq dataset in the FC from dbGaP (Study Accession phs001353.v2.p1). To keep the same range as the GTEx dataset, we removed individuals younger than 20 or older than 70, resulting in 102 males and 39 females for the validation study. At an FDR of 5%, 81 APCGs and 91 ANCGs were identified in the male FC, while 3 APCGs and 4 ANCGs were identified in the female FC. Among those ACGs, 23 of the 91 ANCGs and 8 of the 81 APCGs are also identified as ANGCs and APGCs in the male FC of the GTEx, which are significantly more than expected by chance (Fisher’s exact test, p = 3.02E-17 for the ANCGs, p = 1.42E-04 for the APCGs). As no ACG was identified in the female FC in GTEx, we cannot evaluate the conservation of the ACGs in the female FC. On the other hand, we also reproducibly identified 22 male-specific APCGs and 27 male-specific ANCGs in the dbGaP FC dataset, which are also significantly more than expected by chance (Fisher’s exact test, p = 2.54E-03 for the male-specific APCGs and p = 7.78E-04 for the male-specific ANCGs).
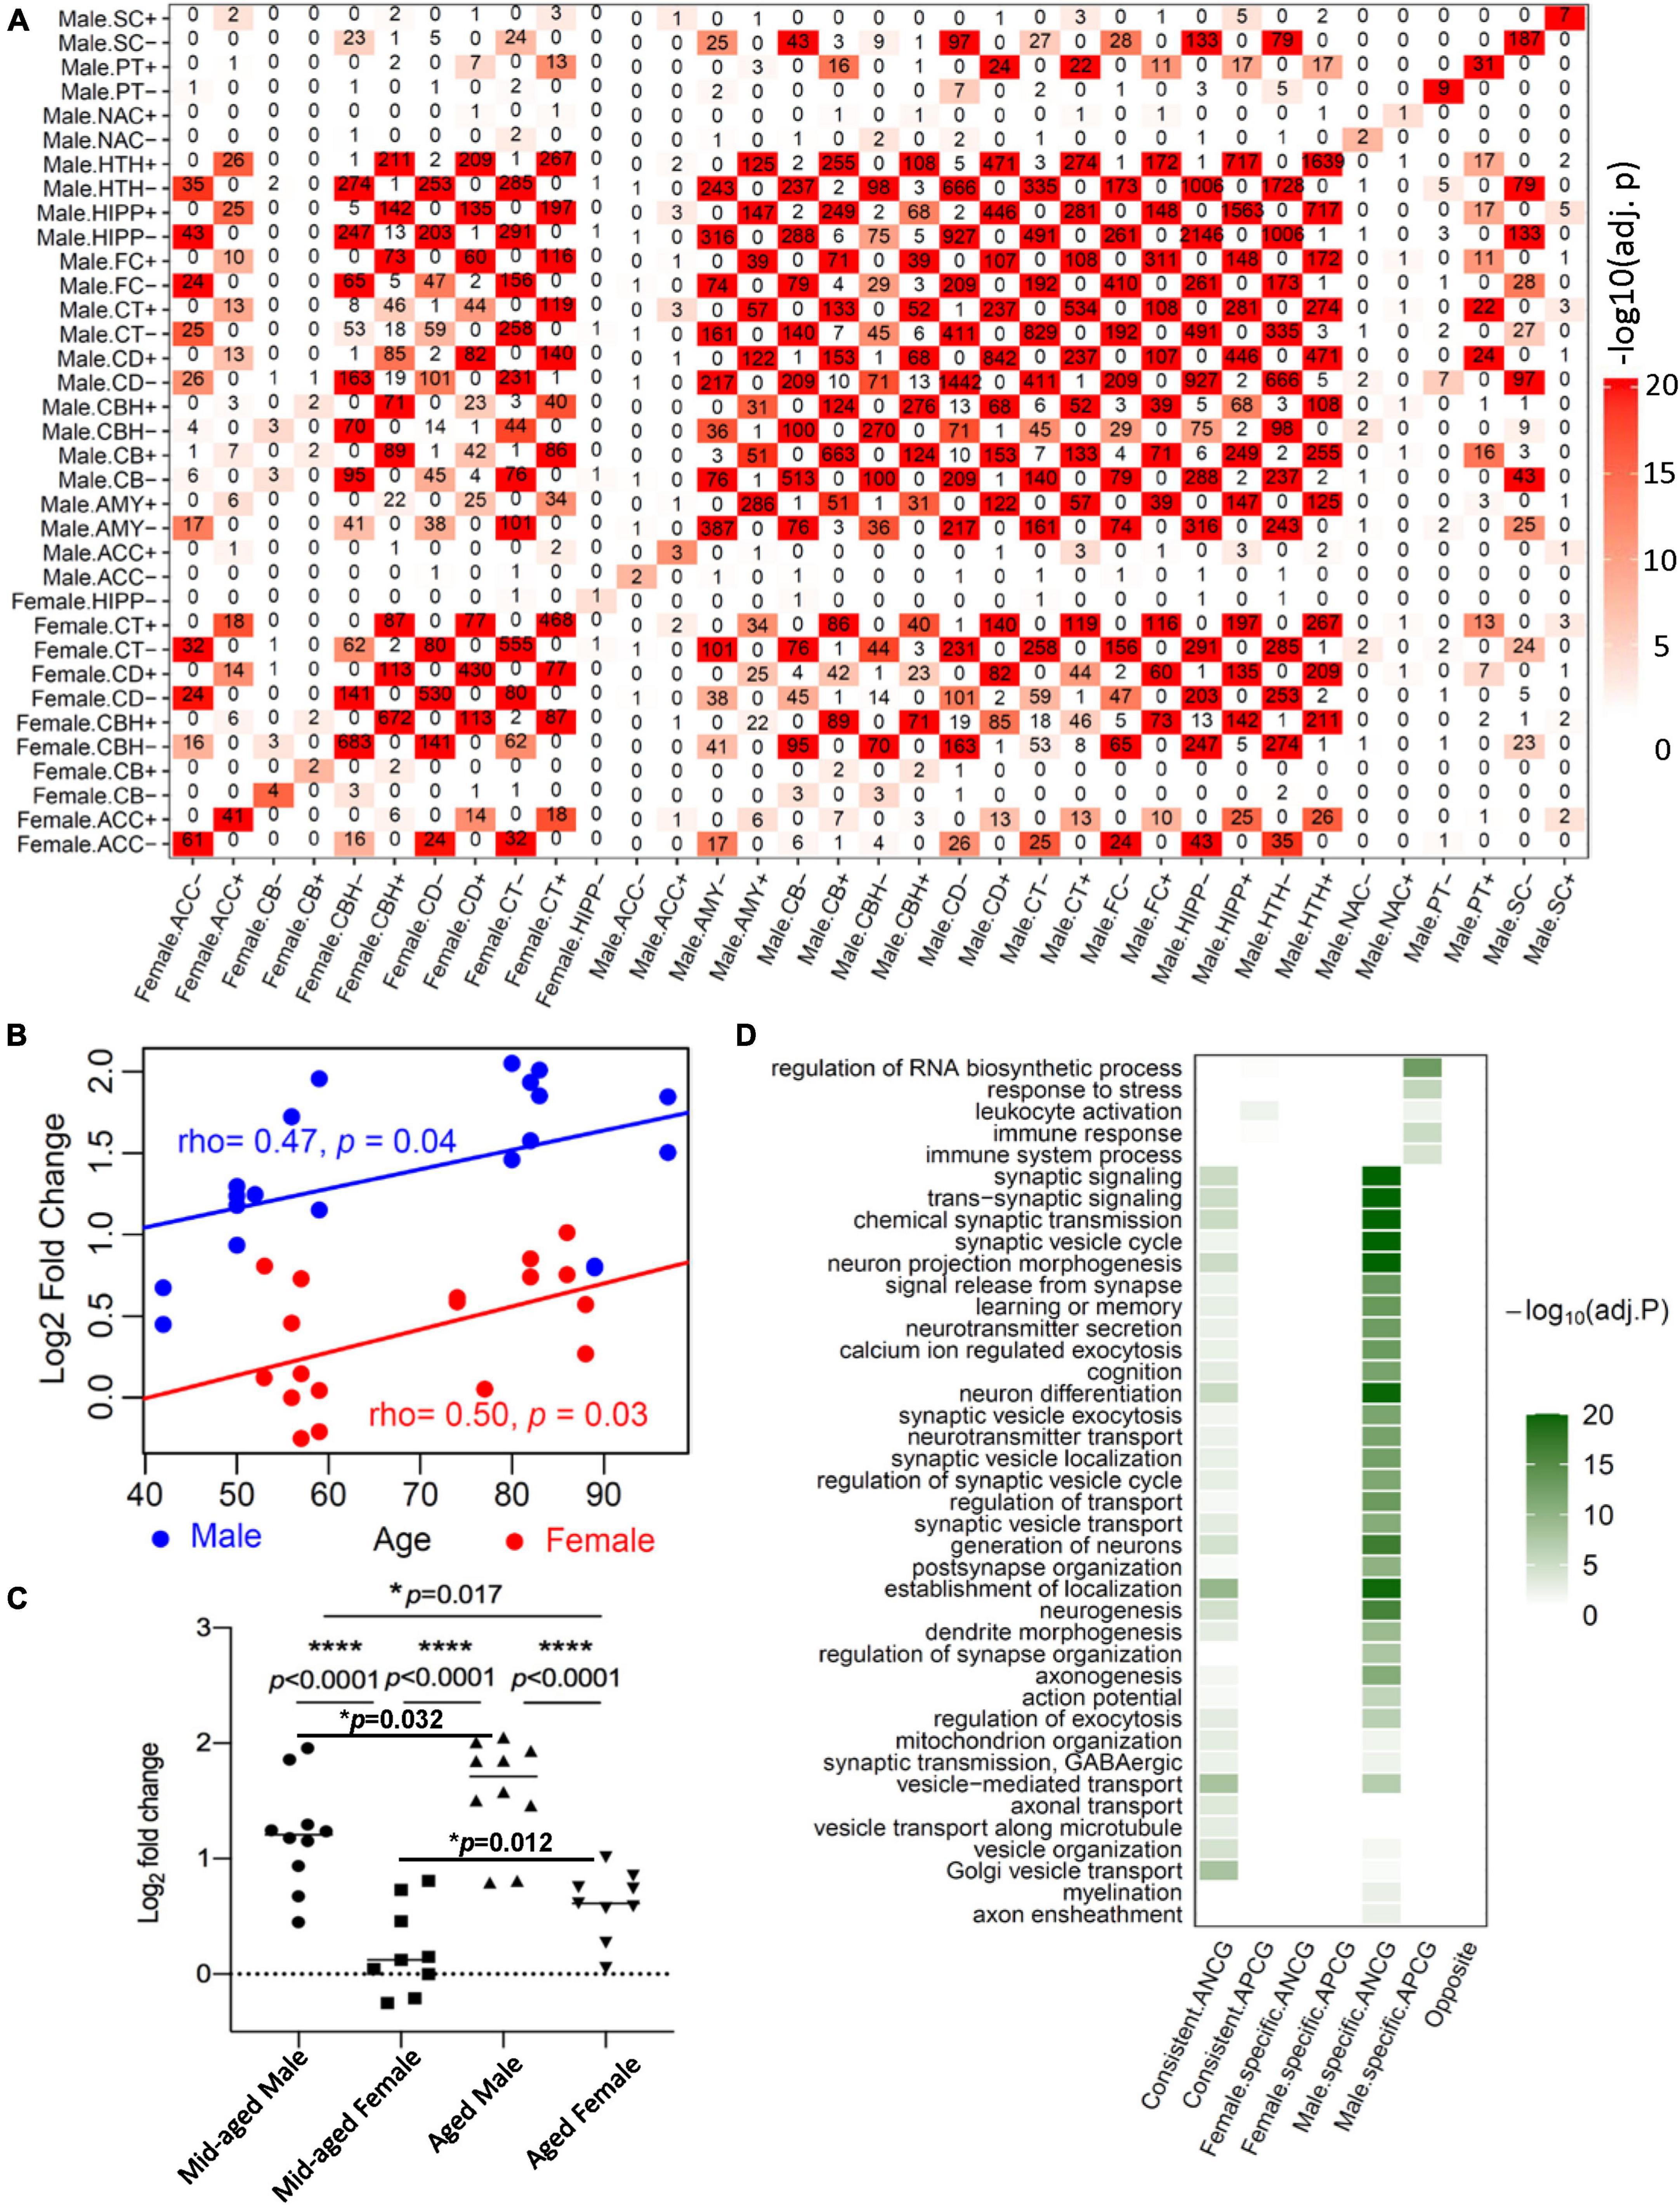
Figure 1. Age-correlated gene (ACG) identified in the GTEx, validation in the human hippocampus and Gene Ontology enrichment analysis of the ACGs. (A) The numbers of ACGs are shown in the diagonal of the heatmap. The “+” sign after the abbreviation of each brain region indicates the signatures positively correlated with age while “−” stands for those negatively correlated with age. Color intensity indicates adjusted p-values of the enrichment test between a pair of ACG signatures. AMY, amygdala; ACC, anterior cingulate cortex (BA24); CD, caudate (basal ganglia); CBH, cerebellar hemisphere; CB, cerebellum; CT, cortex; FC, frontal cortex; HIPP, hippocampus; HTH, hypothalamus; NAC, nucleus accumbens (basal ganglia); PT, putamen (basal ganglia); SC, spinal cord (cervical c-1); SN, substantia nigra. (B) The mRNA expression levels of CD99 that were measured by RT-qPCR and normalized to the actin expression levels in each sample and log2 transformed. Pearson correlation was used to calculate the correlation coefficients between the normalized CD99 expression levels and age in the males (blue) and females (red). (C) The normalized CD99 expression levels in the middle-aged and aged healthy male and female hippocampal region. log2FC: 1.198 ± 0.147 in middle-aged male subjects versus 0.206 ± 0.127 in middle-aged female subjects; versus 1.584 ± 0.146 in aged male subjects; versus 0.606 ± 0.098 in aged female subjects; *p < 0.05, ****p < 0.0001 with Student’s t-test. (D) Top biological processes and pathways enriched with the age-positively correlated genes (APCGs) or age-negatively correlated genes (ANCGs) consistant in both males and females as well as specific to each of the 2 gender groups.
To further validate the ACGs, we collected 38 human hippocampal samples (from 11 male and 10 female subjects, subject demographic information provided in Table 4) and measured the mRNA expression levels of CD99 using qPCR. CD99’s mRNA level was significantly correlated with age in both males (the CD, CT and HIPP regions) and females (the CT region) in the GTEx dataset (Supplementary Table 6A). In our validation hippocampal samples, CD99 expression level wassignificantly correlated with age in both males (ρ = 0.47, p = 0.038) and females (ρ = 0.50, p = 0.034) (Figure 1B). Furthermore, the CD99 expression levels were significantly higher in the aged males than the middle-aged males (t-test, p = 0.032), as well as higher in the aged females than middle-aged females (t-test, p = 0.012) (Figure 1C). In addition, CD99 expression levels were significantly higher in males than in females, in both the middle-aged (t-test, p = 3.86E-05) and the aged group (t-test, p = 2.40E-05). In summary, the validation experiment shows that CD99 expression level is significantly positively correlated with age in both males and females but shows a significant difference between the two sex groups, consistent with the transcriptomics based prediction. These results demonstrated the reproducibility of our ACG signatures.
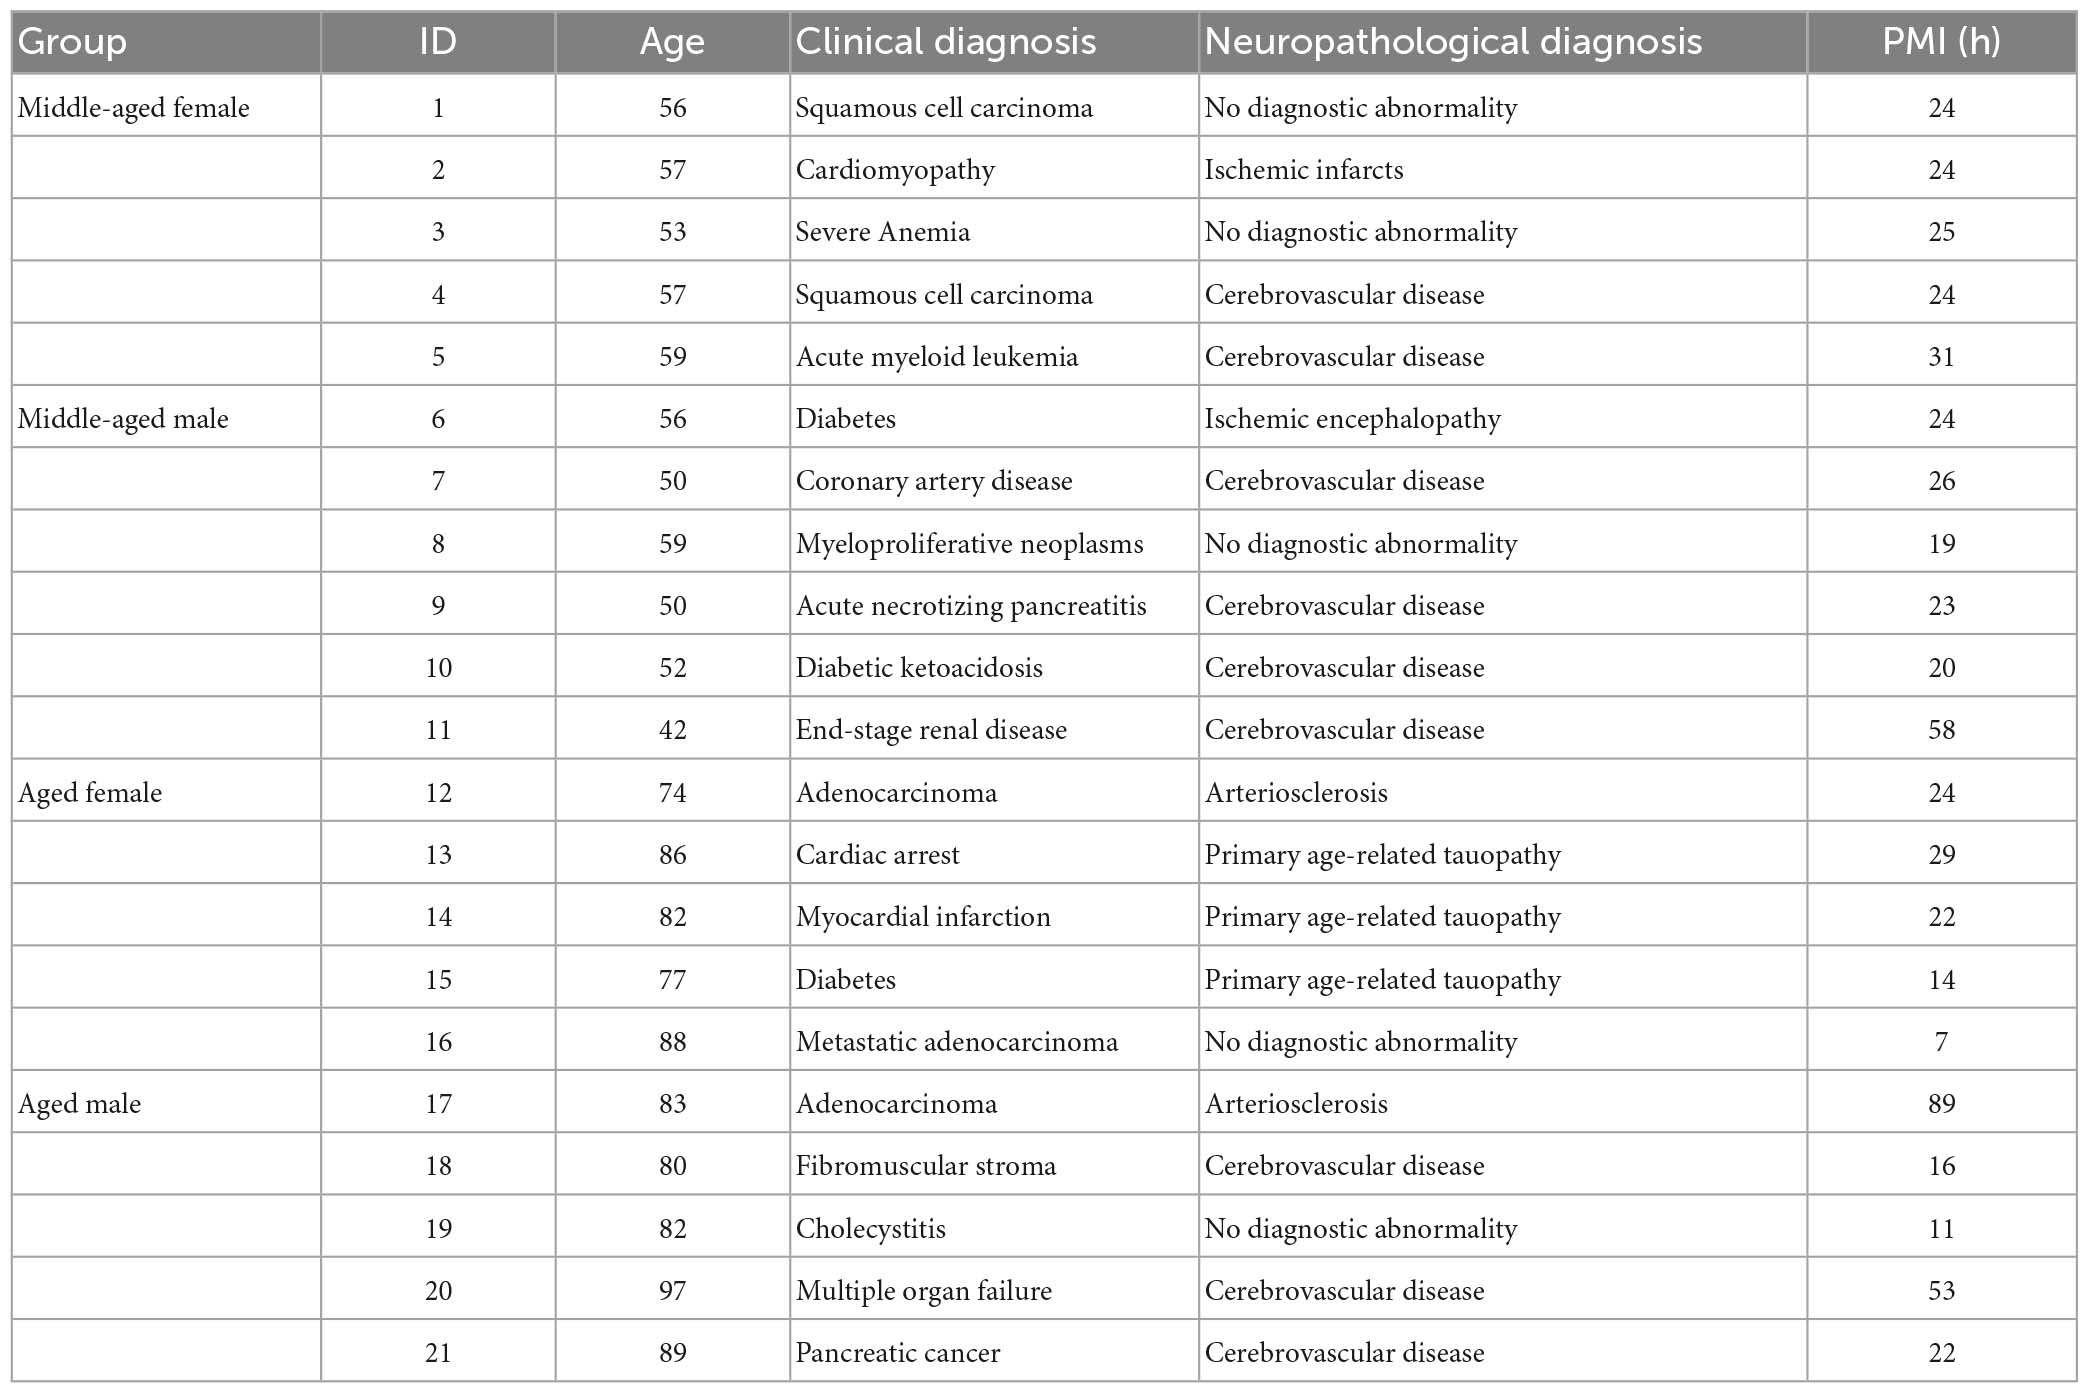
Table 4. Demographic information of the subjects for validation.
We then classified the ACGs across the 13 brain regions into sex-consistent ACGs, male-specific ACGs and female-specific ACGs (Supplementary Table 6A). In total, we identified 774 sex-consistent APCGs and 998 sex-consistent ANCGs. On the other hand, we identified 519 female-specific APCGs and 494 female-specific ANCGs that are correlated with age in one or more brain regions in females but not in males. In males, we identified 2,524 male-specific APCGs and 2,742 male-specific ANCGs that are correlated with age in only one or more brain regions in males but not in females. To study the functions and pathways of the ACGs, we performed a Gene Ontology enrichment analysis for each of the ACG lists. Generally, the top enriched pathways and biological processes for both sex-consistent ANCGs and male-specific ANCGs are “synaptic signaling”, “cognition”, “learning or memory”, “mitochondrion organization” and “neurogenesis” (Figure 1D and Supplementary Table 6B). Besides, the sex-consistent ANCGs are also enriched in the “axonal transport” and “vesicle transport along microtubule” biological processes, while the male-specific ANCGs are enriched in the “myelination”, “regulation of synapse organization” and “axon ensheathment” pathways (Figure 1D). On the other hand, both the male-specific APCGs and sex-consistent APCGs are enriched in the “immune response” and “immune system process” pathways. In addition, the male-specific APCGs are also enriched in the “regulation of RNA biosynthetic process” and “response to stress” pathways (Figure 1D). In contrast, females-specific ANCGs and APCGs were significantly enriched in the “cellular metabolic process” and “regulation of cell communication” pathways, respectively.
We then asked which genes were differentially correlated with age between males and females. To test whether the correlation coefficients of age and gene expression were significantly different between males and females, we performed a differential correlation analysis for each region using an R package DGCA (McKenzie et al., 2016). With a 5% FDR cutoff under 1,000 times of permutation, we identified 65 to 805 genes differentially correlated with age between males and females. We summarized the results in Supplementary Table 7.
Identification of key gene subnetworks and regulators underlying aging in males and/or females
To gain insights into the global structures as well as the detailed local organizations of co-expression and co-regulation of the above-identified gene signatures underlying aging, we performed gene co-expression network analysis of the gene expression data from each brain region in each gender group using the multiscale embedded gene co-expression network analysis (MEGENA) (Song and Zhang, 2015). The modules, comprised of highly co-expressed genes, were first identified in each region in each gender group and were then evaluated for relevance to aging by the enrichment for respective ACG signatures.
Many top-ranked, aging-associated, region-wide gene modules in the males are conserved in their respective female networks, and vice versa (Supplementary Tables 8–20). For instance, the module M11 of the male CBH network (encoded as CBH-Male-M11) is significantly enriched for the ANCGs in the male CBH (fold enrichment (FE) = 14.36, corrected p = 8.07E-53) and the down-regulated genes in aged versus young male CBH (FE = 6.48, corrected p = 1.69E-06) (Figure 2A). Among the 268 genes in the module CBH-Male-M11, 156 genes (66%) fall into an aging-associated female module (CBH-Female-M194) comprised of 205 genes (FE = 46.83, corrected p = 2.78E-252; see Supplementary Table 12). The module CBH-Female-M194 is also significantly enriched for the ANCGs in the female CBH (FE = 3.30, corrected p = 2.37E-31) and the down-regulated genes in aged versus young female CBH (FE = 2.63, corrected p = 3.86E-29) (Figure 2B). Furthermore, 6 hub genes in the module CBH-Male-M11 (Figure 2C) are also hubs of the module CBH-Female-M194 (Figure 2D), including MOG, ENPP2, MYRF, ANLN, MAG and PLP1. Both modules were significantly enriched for myelination-related biological processes (Supplementary Table 21), such as “ensheathment of neurons” and “myelination”. To further validate the shared hub genes identified in the 2 modules conserved between the males and females, we examined gene signatures in Plp1–/– mice or Myrf–/– mice from our previous study (McKenzie et al., 2017) and by overlaying them onto the 2 modules (CBH-Male-M11 and CBH-Female-M194). We found up-regulated genes identified from Plp1–/– cerebellum were significantly enriched in CBH-Male-M11 (FE = 2.85, adjusted p = 8.77E-06, Figure 2C) and CBH-Female-M194 (FE = 3.07, adjusted p = 9.69E-06, Figure 2D). Similarly, down-regulated genes identified from cultured mouse Myrf–/– oligodendrocytes were significantly enriched in CBH-Male-M11 (FE = 2.22, adjusted p = 1.84E-07) and CBH-Female-M194 (FE = 2.71, adjusted p = 8.42E-11). As myelination is an important function in the central nervous system, we further examined the myelination-associated module in the other 12 regions. We found that the myelination-associated module was significantly enriched with ANCGs and conserved across all the brain regions (Supplementary Table 22). Moreover, the hub genes in those modules are very consistent across the 13 brain regions. The most frequent hub genes in the myelination modules are MOG, MYRF, PLP1, CNP and MAG (Supplementary Table 22). In summary, the above results indicate that certain aging-associated processes, such as down-regulation of the myelination/nerve ensheathment modules, are well conserved between males and females across all the brain regions.
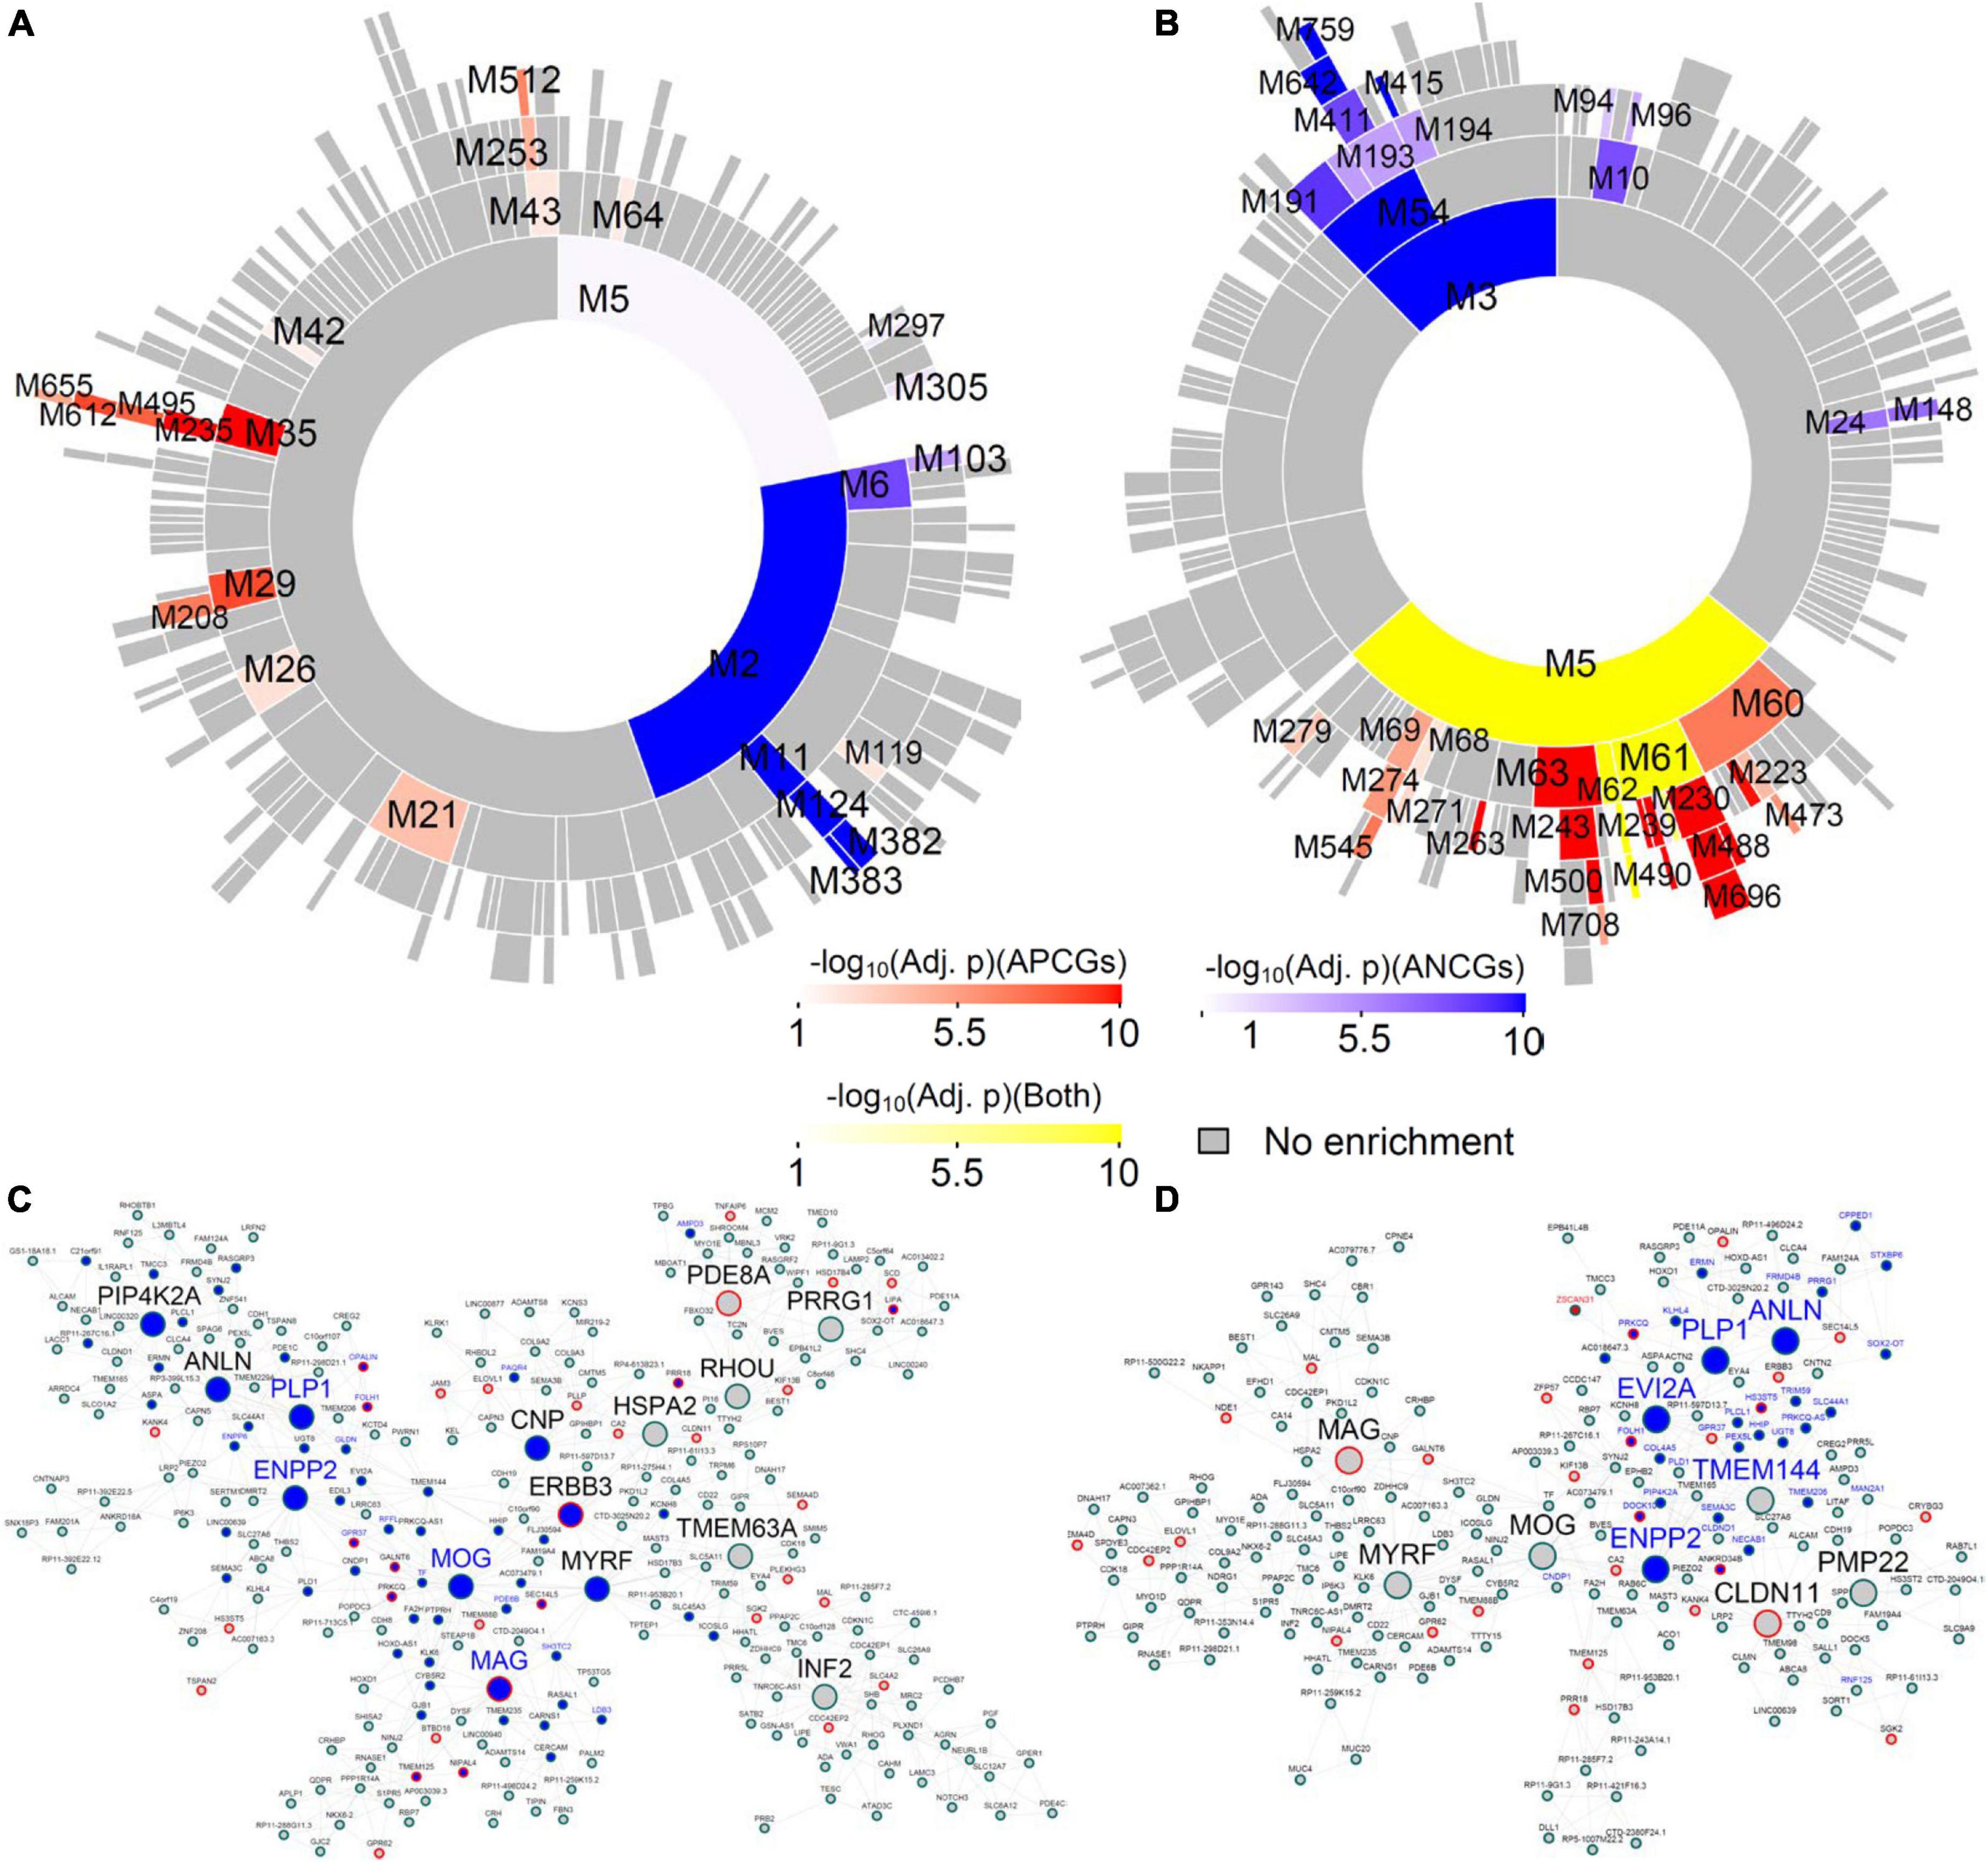
Figure 2. Aging-associated co-expression module shared between male and female cerebellar hemisphere (CBH). (A) Circos plot for the modules in the male CBH network ranked by enrichment of the ACG and DEG signatures between aged versus young males. (B) Circos plot for the top modules in the female CBH network ranked by enrichment of the ACG and DEG signatures in the CBH between aged versus young females. (C) Subnetwork of the module CBH-Male-M11 in the male CBH network, which is conserved in the female CBH network. Blue nodes are the genes whose expression levels are negatively correlated with age in the male CBH, while blue labels are the genes down-regulated in the CBH of the aged males versus that of the young males. Large nodes are the hub genes of the module. Nodes with red borders are genes up-regulated in the CBH region of the Plp1–/– mice versus the wild-type mice. (D) Subnetwork of the module CBH-Female-M194 in the female CBH network. Blue nodes are the genes whose expression levels are negatively correlated with age in the female CBH, while blue labels are the genes down-regulated in the CBH of the aged females versus that of the young females. Large nodes are the hub genes of the module. Nodes with red borders are genes up-regulated in the CBH region of the Plp1–/– mice versus the wild-type mice.
In the AMY, HIPP, HTH and FC brain regions, we observed many male aging-associated modules that don’t overlap with female aging-associated modules (Supplementary Tables 8–20). For instance, in the male hippocampal network (Figure 3A), Hipp-Male-M3 (Figures 3B, C) was significantly enriched for the ANCGs (FE = 3.22, corrected p = 5.71E-174) and the down-regulated DEGs between aged versus young hippocampus (FE = 3.63, corrected p = 3.50E-142). These genes in the module Hippocampus-Male-M3 were implicated in the pathways such as “nervous system development”, “synaptic signaling” and “neuron development” (Supplementary Table 21). Moreover, top hub genes in this module (Figure 3D) were associated with the development of Alzheimer’s disease, including VSNL1 (Kirkwood et al., 2016), INA (Dickson et al., 2005), CHN1 (Kato et al., 2015), NMNAT2 (Ljungberg et al., 2012), and MAP7D2 (Khundakar et al., 2016). In particular, INA, VSNL1, MYT1L and MAP7D2 were identified as male-specific aging-associated hub genes across multiple brain regions (see Supplementary Tables 6A, 8–20). In addition to the Hipp-Male-M3, we also identified many modules specific to the male gene coexpression networks (Supplementary Tables 8–20), such as the modules HIPP-Male-M9, CB-Male-M48, SC-Male-M100, and HIPP-Male-M27. These modules are significantly enriched for the glia and neuron transmission functions such as “regulation of catabolic process”, “glial cell differentiation”, “vesicle-mediated transport in synapse”, and “chemical synaptic transmission” (Supplementary Table 21).
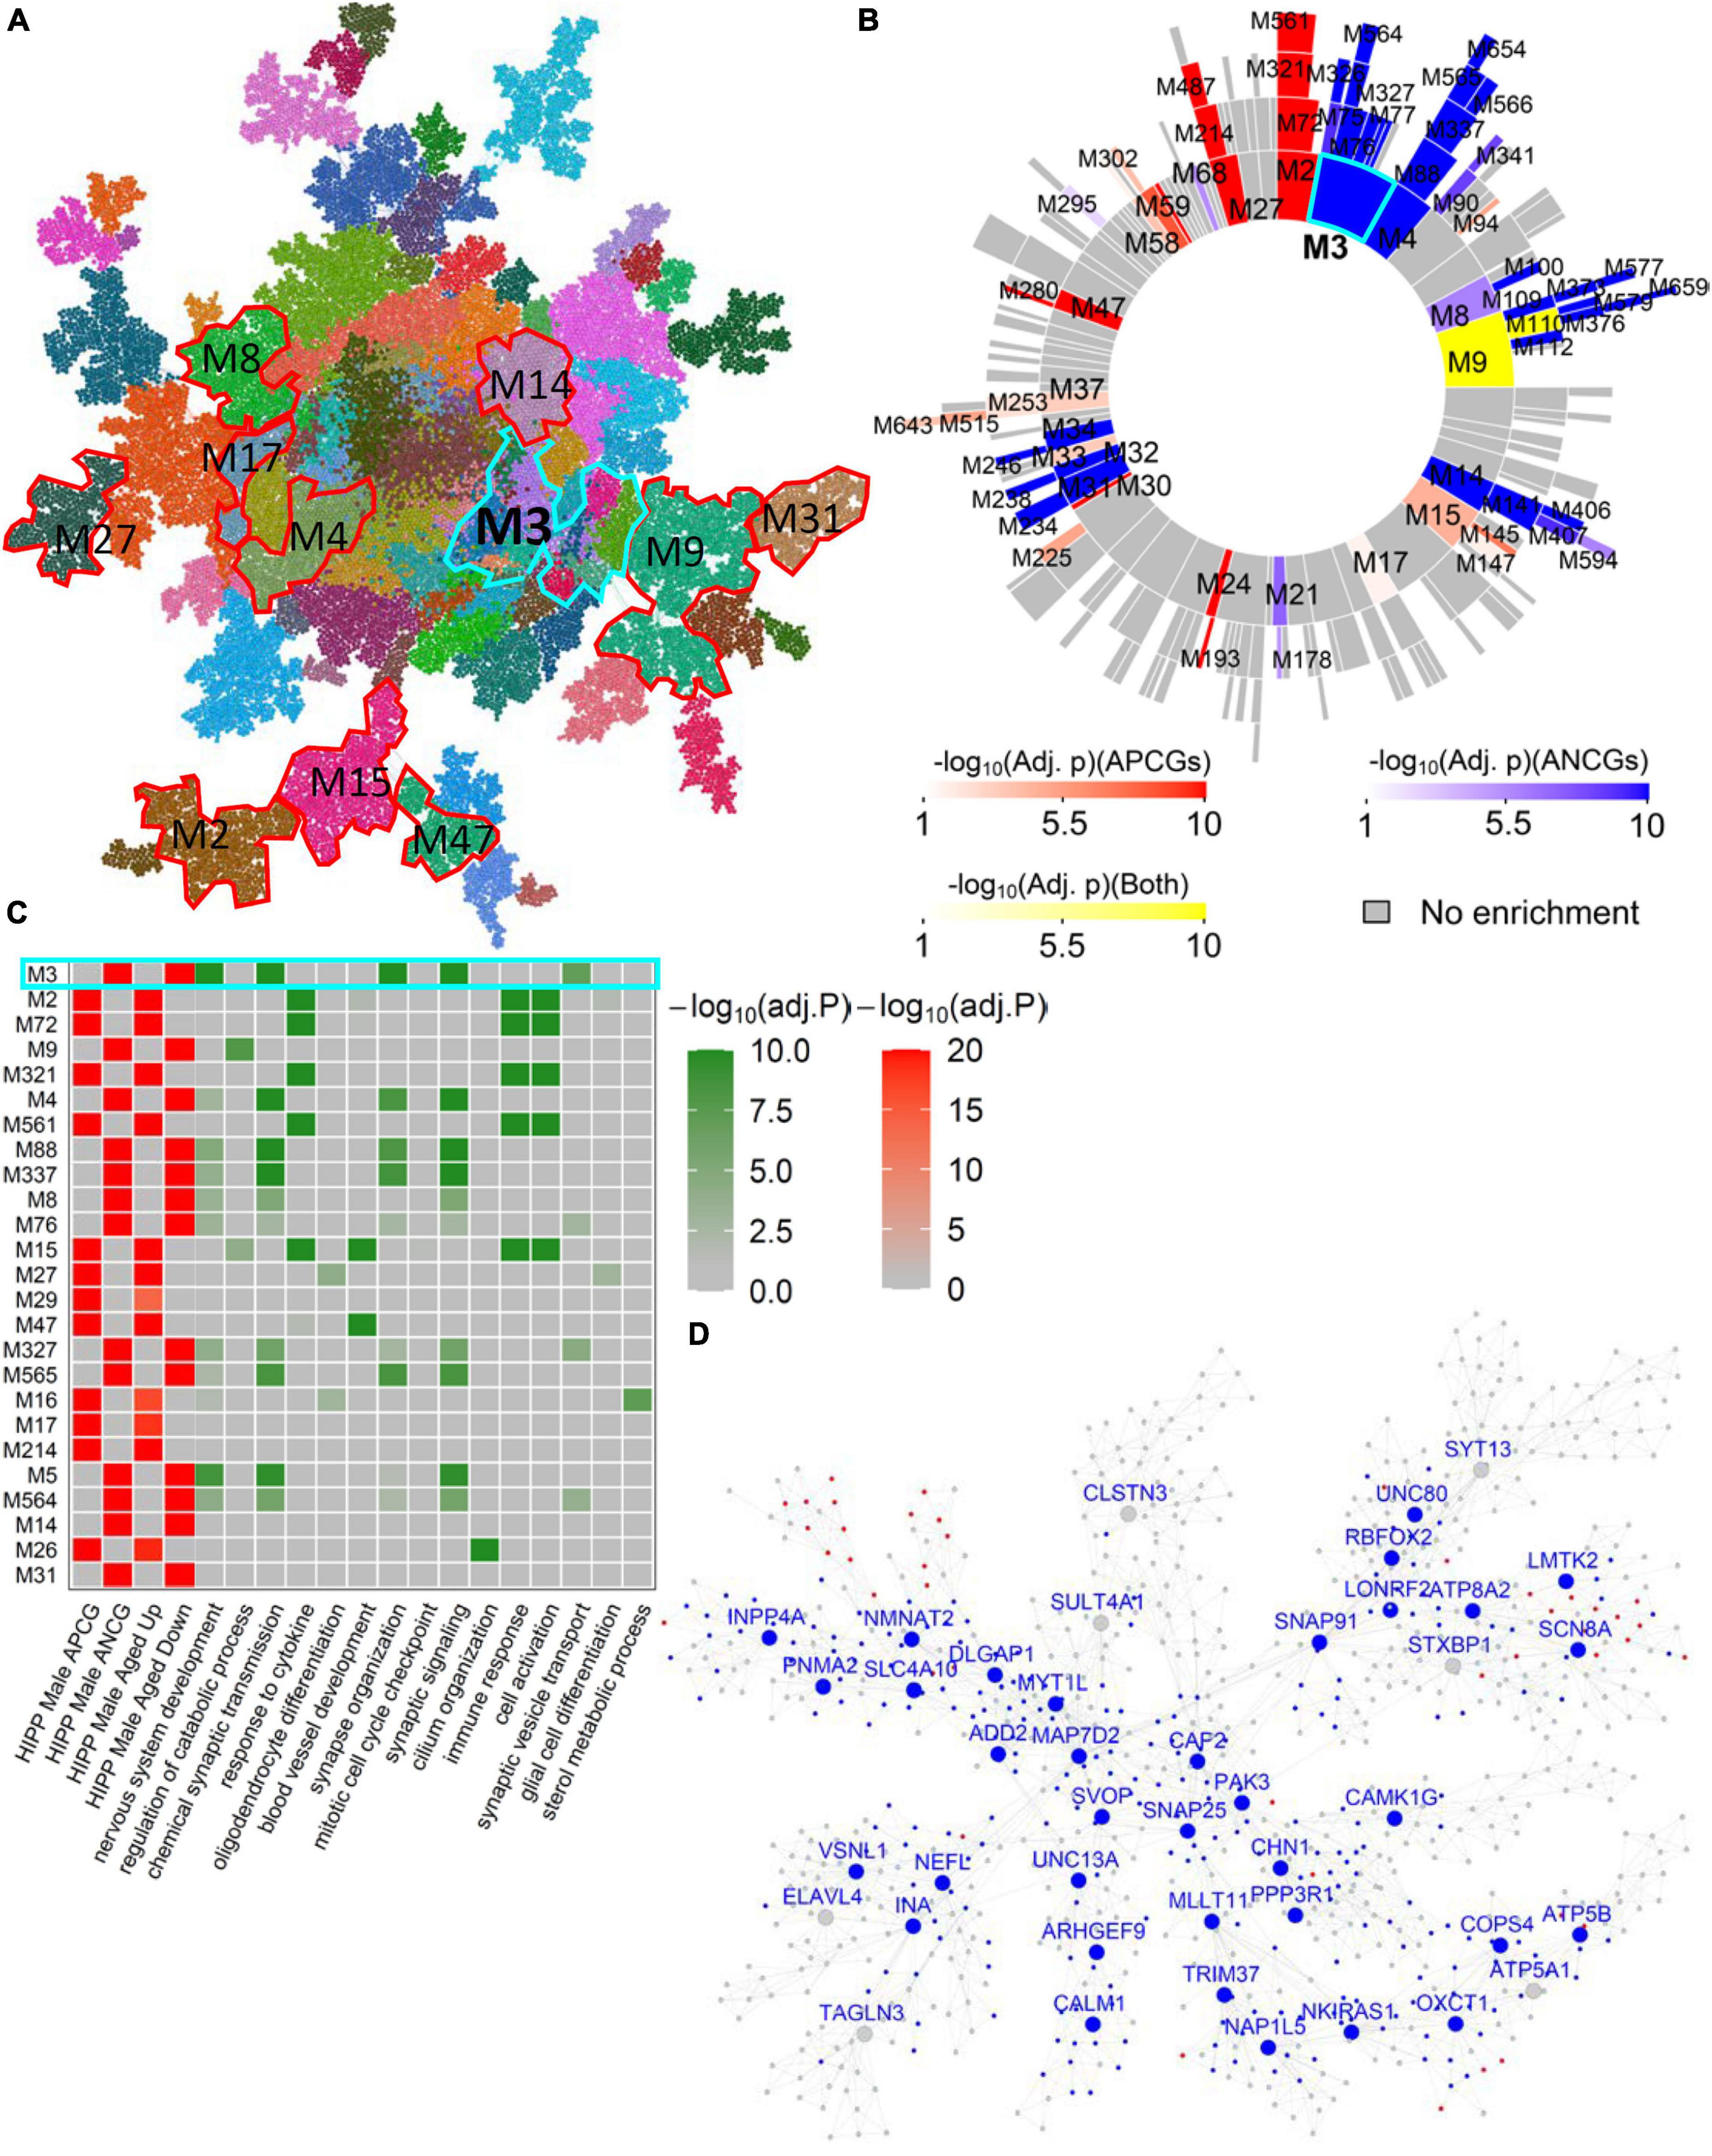
Figure 3. Male-specific aging-associated co-expression network in the hippocampus. (A) The global MEGENA network from the male hippocampus. Each color indicates a highly connected module. The top age-associated modules enriching for the ACGs and DEGs of the male hippocampus are highlighted with red and cyan frames. (B) Sunburst plot of the multi-scale modules in the male hippocampus network. Red blocks show the modules enriched for APCGs of the male hippocampus; blue blocks show the modules enriched for ANCGs of the male hippocampus; yellow blocks show the modules enriched for both APCGs and ANCGs. (C) Heatmap of the top 25 modules in the male hippocampus network enriched with ACGs. The left panel shows the adjusted p-values of ACG and DEG enrichments of the 25 modules. The right panel shows the adjusted p-values of enrichment for the top 2 Gene Ontology biological processes in each of the 25 modules. (D) Subnetwork of the top age-associated module Hippocampus-Male-M3. Nodes with blue labels are ANCG hub genes in the male hippocampus. Red and blue nodes are up- and down-regulated genes in aged males versus young males, respectively.
Similarly, female-specific aging-associated modules have been identified in other brain regions such as CD and CT. For example, several modules in the female CT network (Figure 4A) were significantly enriched for the ACG and DEG signatures in the female CT without significant overlap with the aging-associated module in the male CT network (Supplementary Table 13). For example, CT-Female-M38, the 2nd module most associated with aging (Figures 4B, C), was significantly enriched for the ANCGs in the female CT (corrected p = 1.75E-63) and the down-regulated DEGs in CT between aged versus young females (corrected p = 3.89E-72) (Figure 4D). The genes in the module CT-Female-M38 were associated with “neuron projection morphogenesis” (FE = 2.25, corrected p = 3.67E-06) and “axon development” (FE = 2.31, corrected p = 6.91E-05) (Supplementary Table 21), and regulated by female-specific key drivers include SRPK2, REPS2 and FXYD1. Moreover, there are also many female-specific modules such as CT-Female-M10, NAc-Female-M6, AMY-Female-M25 and CT-Female-M148 (Supplementary Tables 8–20) and they are enriched for pathways like calcium ion regulated exocytosis, protein targeting to ER, inflammatory response, and cellular response to cytokine stimulus (Supplementary Table 21).
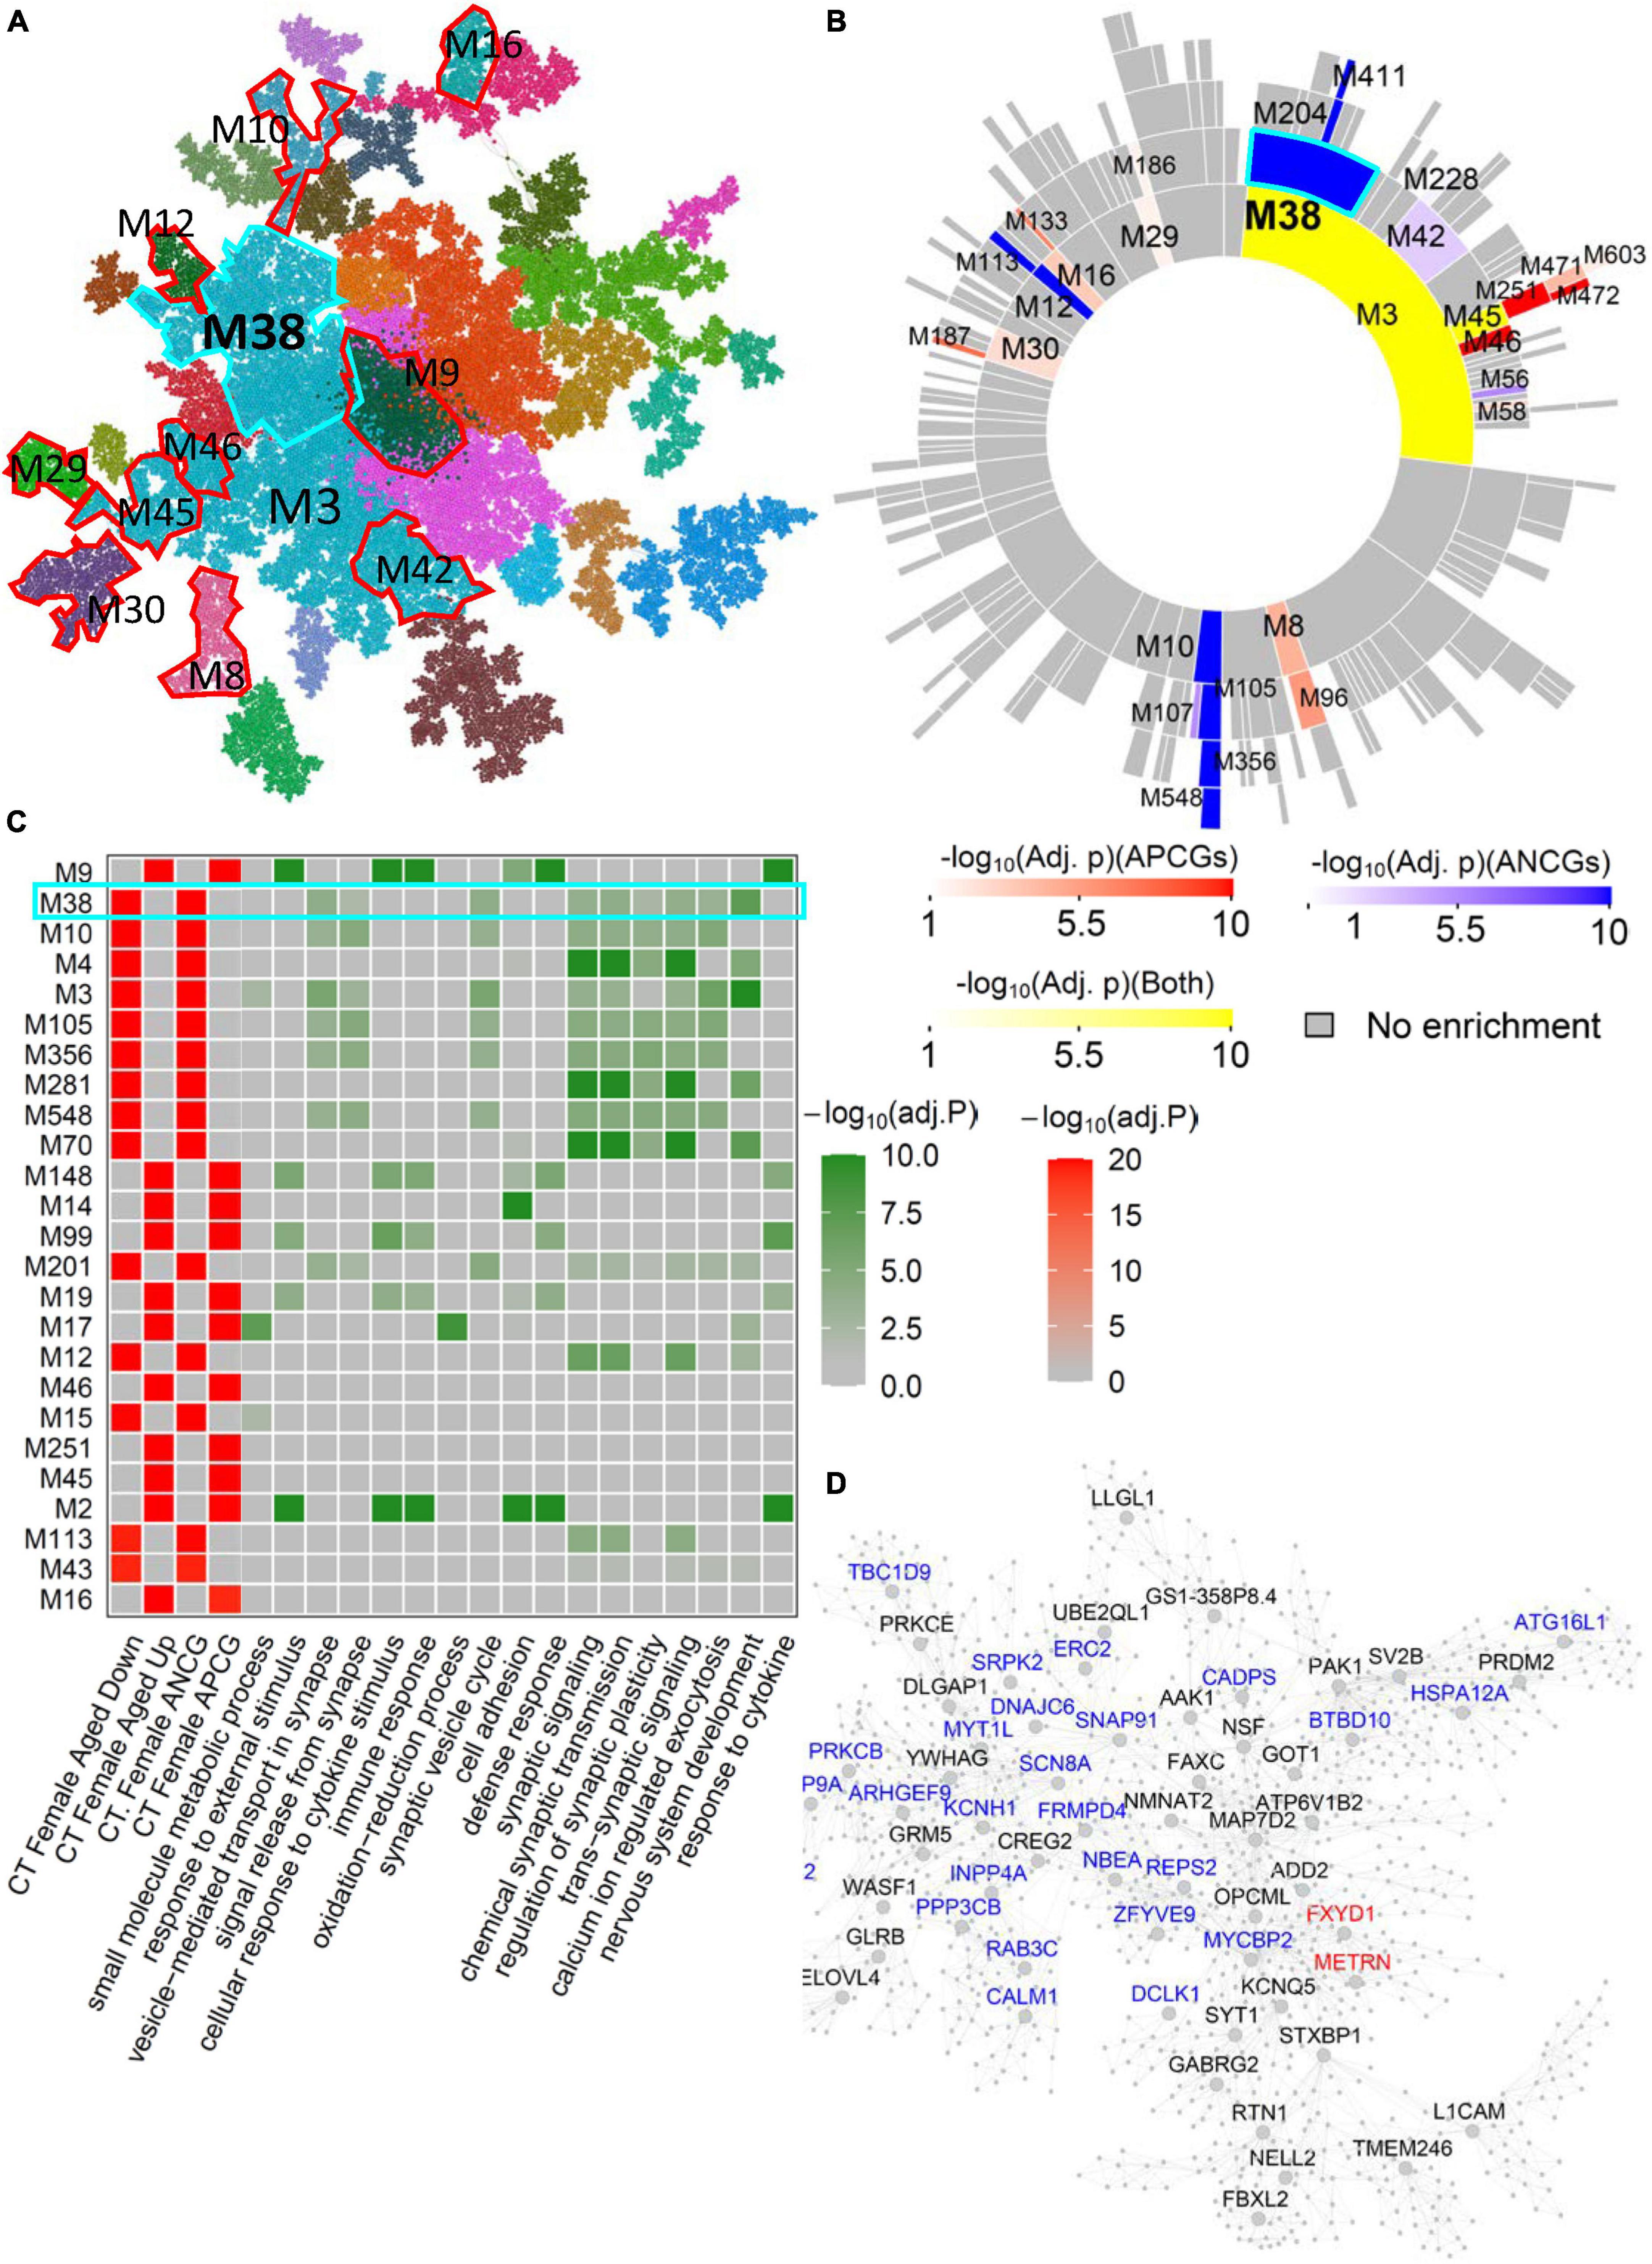
Figure 4. Female-specific aging-associated co-expression network and modules in the cortex. (A) The global MEGENA network from the female cortex. Each color indicates a highly connected module. The top age-associated modules enriching for the ACGs and DEGs of the female cortex are highlighted with red and cyan frames. (B) Sunburst plot of the multi-scale modules in the female cortex network. Red blocks show the modules enriched for APCGs of the female cortex; blue blocks show the modules enriched for ANCGs of the female cortex; yellow blocks show the modules enriched for both APCGs and ANCGs. (C) Heatmap of the top 25 modules in the female cortex network enriched with ACGs. The left panel shows the adjusted p-values of ACG and DEG enrichments of the 25 modules. The right panel shows the adjusted p-values of enrichment for the top 2 Gene Ontology biological processes in each of the 25 modules. (D) Subnetwork of the module CT-Female-M38. Red and blue nodes represent APCG and ANCG hub genes in the female cortex, respectively.
Aging-related modules and key genes are associated with Alzheimer’s diseases
To investigate the association between normal brain aging and Alzheimer’s disease (AD), we performed an enrichment analysis between the ACG signatures and previous AD gene signatures (Colangelo et al., 2002; Liang et al., 2008; Webster et al., 2009; Avramopoulos et al., 2011; Blalock et al., 2011; Szymanski et al., 2011; Miller et al., 2013; Zhang et al., 2013; Satoh et al., 2014; Mostafavi et al., 2018; Klein et al., 2019; Mathys et al., 2019). As shown in Figure 5, the ACG signatures identified from various brain regions were significantly enriched for the AD signatures identified from previous studies. More importantly, the APCG signatures were significantly enriched for the genes positively correlated with AD phenotypes (Braak staging and atrophy) or genes up-regulated in AD versus control, while the ANCG signatures were significantly enriched for the genes negatively correlated with AD phenotypes or down-regulated in AD. Specifically, the APCGs in the male FC, CB, CBH, CD, CT, HIPP, HTH and AMY regions were significantly enriched for the genes positively correlated with Braak stages and brain atrophy in PFC and CB identified by Zhang et al. (2013) and the genes up-regulated with AD versus control in the HIPP CA1 and CA3 sub-regions. On the other hand, the ANCGs in the male AMY, CB, CD, CT, FC, HIPP and HTH regions significantly overlapped the genes negatively correlated with Braak stages and brain atrophy in the PFC (Zhang et al., 2013) and genes down-regulated in thalamocortical radiations, superior temporal gyrus and hippocampal CA1 and CA3 regions of AD brains (Webster et al., 2009; Szymanski et al., 2011; Miller et al., 2013). In summary, AD and aging showed many consistent transcriptomic alterations as aging is the key vulnerability for AD development.
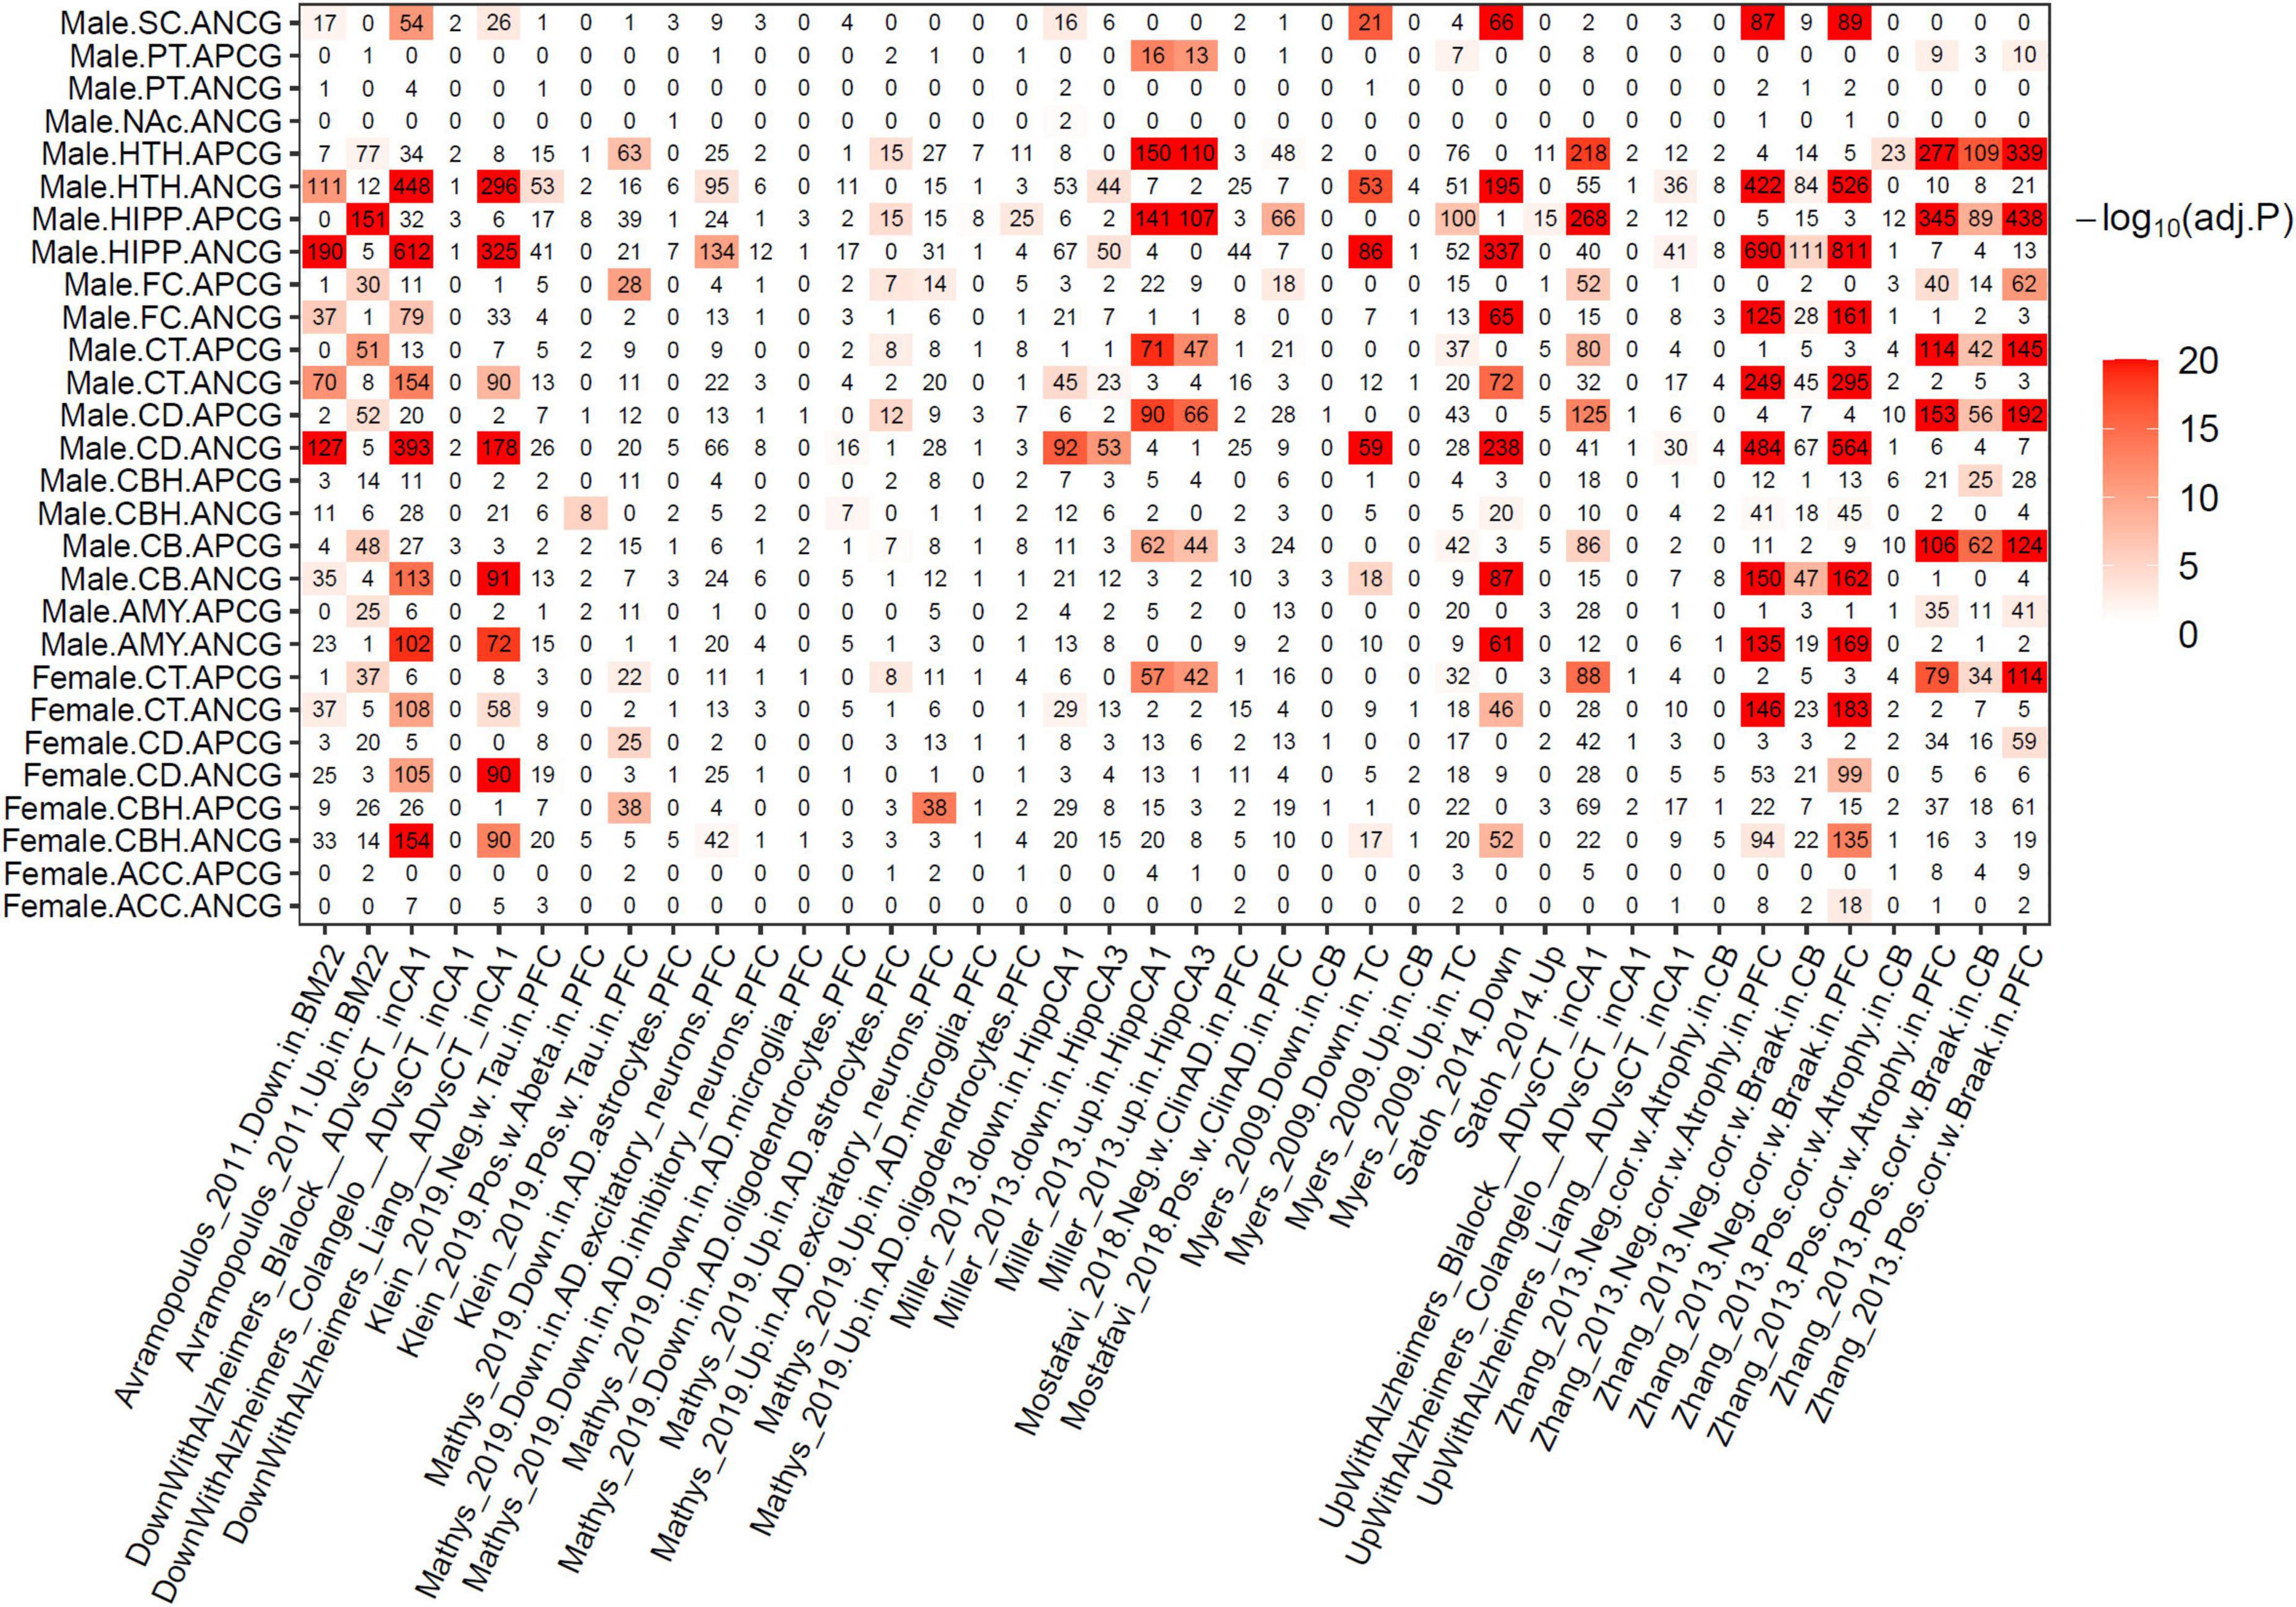
Figure 5. Overlapping between ACGs and Alzheimer’s disease gene signatures of previous studies. The numbers in the heat map show the shared gene numbers. Color intensity indicates the adjusted p-value of Fisher’s Exact Test.
Interestingly, 134, 95 and 42 down-regulated genes identified from AD PFC excitatory neurons in the Mathys et al. single-cell study (Mathys et al., 2019) were significantly enriched for the ANCGs in the male HIPP (corrected p = 9.44E-11), male HTH (corrected p = 1.57E-4) and female CBH (corrected p = 0.015) regions, respectively. On the other hand, 38 and 14 up-regulated genes in AD excitatory neurons were enriched for the APCGs in the male FC (corrected p = 2.18E-14) and the female CBH (corrected p = 1.31E-03) regions, respectively. By contrast, dysregulated genes in AD inhibitory neurons showed no enrichment for the ACGs. Furthermore, the up-regulated genes in AD astrocytes were significantly enriched for the APCGs in six brain regions, including CB, CD, CT, FC, HIPP and HTH. The results suggested that aging may have stronger effects on excitatory neurons and astrocytes than other cell types during AD development. Thus, aging effects on excitatory neurons and astrocytes may increase vulnerability to AD development and progression.
Discussion
Previous studies showed that the proportion of neuronal loss varies not only in different brain regions (ranging from no more than 10% (Pannese, 2011) to 50% (Devaney and Johnson, 1980), but also in different neuron subtypes (Hua et al., 2008). Our data shows that ACGs are enriched for the genes differentially expressed in AD excitatory neurons in comparison with control, but not those differentially expressed in inhibitory neurons, confirming that the loss of neurons in certain neuron subtypes is more severe than others during aging. Morphological studies showed that synaptic function was also significantly altered during aging (Pannese, 2011), with a decrease in dendrites and axons as well as the loss of dendritic spines and myelin sheaths. Moreover, transcriptomic analyses indicate that synapse-related genes and co-expression modules are extensively down-regulated across different brain regions (Berchtold et al., 2013; Dillman et al., 2017). In this study, we showed that the males have faster neuronal loss rates during aging than the females in 9 brain regions (including AMY, CD, CBH, CB, HIPP, HTH, NAC, PT and SC), while the females had a faster rate of neuronal loss in the CT and SN regions during aging. This supports the previous findings that males are generally aging faster than the females measured by many aging hallmarks (Barrett and Richardson, 2011; Dulken and Brunet, 2015; Gaignard et al., 2015; Gentilini et al., 2015; Fischer and Riddle, 2018). Further studies should be designed to investigate the gender differences in proteostasis dysfunction, cellular senescence, deregulated nutrient sensing and altered intercellular communication during aging since no study focuses on the gender differences of these 4 hallmarks. Opposite to the decreased neuron proportion during aging, the microglia proportion increases with age in most of the brain regions in both gender groups. The role of increased microglia proportion in the brain during aging and its contribution to gender differences in brain aging await further investigation.
In this study, we identified more aging-associated genes in the male HIPP, HTH, FC, CD, AMY and CB brain regions than in the respective female regions. This is consistent with a prior study, which showed that subcortical regions in males were aging faster than in females (Kiraly et al., 2016). In contrast, we identified more ACGs in the female ACC and CBH brain regions than the respective male ones, suggesting that sex differences in aging-associated gene expression changes are region-specific. In the CT, CD and CBH regions, hundreds of ACGs were identified in both males and females, while both gender groups have only a few or no ACGs in the NAC, PT, SC and SN regions. As there are twice as many males than females in most of the brain regions in the current GTEx data, the statistical power is larger in the male group, which may contribute to more ACGs identified in the male brain regions than the corresponding female ones. Nevertheless, the CBH region in the females has more ACGs than the males, suggesting that the CBH may age faster in the females than the males, which is further supported by the finding of the increased proportion of microglia in the females than the males. Using an independent human dataset from the dbGap and our hippocampal RT-qPCR cohort, we reproducibly identified many ACGs in the GTEx and validated CD99 as a ACG in both male and female. Due to the relatively low statistical power in the female group in the GTEx cohort, many ACGs in the females are yet to be identified.
Age-related gene expression changes across the central nervous system may contribute to the development of neurodegenerative disorders and functional deficits. Understanding the normal brain aging process helps elucidate the contribution of aging to neurodegenerative disorders and impairment of the brain and offers the potential to prevent, mitigate, and even reverse the impairment with potential therapeutics targeting the dysregulated pathways (Ali et al., 2017). Previous studies suggested that age-related cognitive decline was associated with mTOR signaling, chromatin modification, oxidative stress and dysregulation of mitochondrial function (Bishop et al., 2010; Wyss-Coray, 2016; Mostafavi et al., 2018). These changes during aging could account for the vulnerability of neurons to neurodegenerative stressors because of their high energetic demands (Bishop et al., 2010). Indeed, many key drivers in the aging-related modules identified in both sexes have been demonstrated to contribute to the development of AD and other neurodegenerative disorders. For instance, our study shows that a gene encoding nicotinamide nucleotide adenylyltransferase 2 (NMNAT2), a critical enzyme in the NAD biosynthetic process, is significantly down-regulated during aging in both the males and females. This finding is consistent with the decreased expression of NMNAT2 in Alzheimer’s, Huntington’s, and Parkinson’s diseases (Ali et al., 2016, 2017). The decreased expression of NMNAT2 would reduce the biosynthesis of NAD and then decrease bioenergy generation, which may contribute to the vulnerability of neurons. However, we still do not know the roles of many key drivers identified in this study in the development of neurodegenerative diseases, such as REPS2 and FXYD1.
Estrogen acts as anti-aging-hallmark roles in the brain, such as promoting mitochondrial function, elevating DNA repair enzymes and increasing synaptic plasticity (Zarate et al., 2017). In the GTEx cohort, the genes coding estrogen receptors (ESR1 and ESR2) and aromatase (CYP19A1, HSD17B1 and HSD17B2) were lowly expressed in the 13 brain regions studied here and they were not correlated with age. For their low expression levels, ESR2, HSD17B2 and CYP19A1 were excluded from the further analyses. This suggested that brain neurons are probably affected by the estrogen level decreasing in blood, especially in females after menopause. This should be confirmed by providing more pieces of evidence in future brain aging studies.
Nevertheless, this study has some limitations. Firstly, estimation of the cell proportions from the bulk tissue RNA-seq data was based on the expression levels of the known marker genes of six brain cell types. The age-associated changes of cell type proportions in males and females need be further investigated with single-cell RNA-Sequencing data with sufficient number of young, middle-aged and aged brains. Secondly, the differences in epigenetic alterations (Nativio et al., 2018; Klein et al., 2019) between males and females are important sources of the gender differences in gene expression changes during aging. What are the gender-specific epigenetic alterations during brain aging? What are the roles of those gender-specific aging epigenetic alterations in neurodegenerative disease? These questions need more data to answer in future studies of gender differences in brain aging. Next, although we did not find a significant interaction between age and gender due to the relatively sample size there may be interactions between age and gender if enough samples are obtained. Lastly, as there were twice as many males as females in most of the brain regions in the current GTEx data, the statistical power is larger in the male group, which may contribute to higher numbers of ACGs identified in the male brain regions. Nevertheless, the CBH region in the females showed more ACGs than the males, suggesting that the CBH may age faster in the females than the males, which is further supported by the finding of the increased proportion of microglia in the females than the males.
Conclusions
Dramatic differences in brain cell type proportion and gene expression changes during aging between males and females were observed in several brain regions. Key molecular networks and targets underlying regional vulnerability to aging in males and females were further identified. These findings pave the way for understanding the molecular mechanisms of gender differences in aging and developing neurodegenerative diseases such as AD.
Data availability statement
The original contributions presented in this study are included in the article/Supplementary material, further inquiries can be directed to the corresponding author.
Ethics statement
The studies involving human participants were reviewed and approved by Ethics Committee at James J. Peters VA Medical Center (JJP VAMC) and Icahn School of Medicine at Mount Sinai. The patients/participants provided their written informed consent to participate in this study.
Author contributions
BZ conceived and designed the project. XZ, MW, LG, AM, and JY collected the data. XZ analyzed the data. JC, LZ, KF, DC, and JFC performed RT-qPCR validation. XZ, JC, LZ, MW, LG, ZT, DC, and BZ wrote and edited the manuscript. All authors read and approved the final manuscript.
Funding
This work was supported in parts by grants from the National Institutes of Health (NIH)/National Institute on Aging (R01AG046170, RF1AG057440, R01AG057907, U01AG052411, R01AG062355, and U01AG058635), NIH/National Institute of Allergy and Infectious Diseases (U01AI111598), NIH/National Institute of Dental and Craniofacial Research (R03DE026814), NIH/National Institute of Diabetes and Digestive and Kidney Diseases (R01DK118243) to BZ, NIH R01AG048923 to DC, (RF1AG054014, RO1AG068030, and R56AG058655) to DC and BZ, Department of Veteran Affairs BLRD (I01BX003380) and RR&D (I01RX002290) to DC, grant from NIA/NIH (F32AG056098) to KF, grants from NIH (R01AG054008 and R01NS095252) to JFC, and grant from NIH (R01AG055501) to ZT. This work was also supported in part by the computational resources and staff expertise provided by Scientific Computing at the Icahn School of Medicine at Mount Sinai.
Conflict of interest
The authors declare that the research was conducted in the absence of any commercial or financial relationships that could be construed as a potential conflict of interest.
Publisher’s note
All claims expressed in this article are solely those of the authors and do not necessarily represent those of their affiliated organizations, or those of the publisher, the editors and the reviewers. Any product that may be evaluated in this article, or claim that may be made by its manufacturer, is not guaranteed or endorsed by the publisher.
Supplementary material
The Supplementary Material for this article can be found online at: https://www.frontiersin.org/articles/10.3389/fnagi.2023.1153251/full#supplementary-material
Footnotes
References
Ali, Y. O., Allen, H. M., Yu, L., Li-Kroeger, D., Bakhshizadehmahmoudi, D., Hatcher, A., et al. (2016). NMNAT2:HSP90 complex mediates proteostasis in proteinopathies. PLoS Biol. 14:e1002472. doi: 10.1371/journal.pbio.1002472
Ali, Y. O., Bradley, G., and Lu, H. C. (2017). Screening with an NMNAT2-MSD platform identifies small molecules that modulate NMNAT2 levels in cortical neurons. Sci. Rep. 7:43846.
Alzheimer’s Association (2015). 2015 Alzheimer’s disease facts and figures. Alzheimers Dement. 11, 332–384.
Arslan-Ergul, A., and Adams, M. M. (2014). Gene expression changes in aging zebrafish (Danio rerio) brains are sexually dimorphic. BMC Neurosci. 15:29. doi: 10.1186/1471-2202-15-29
Avramopoulos, D., Szymanski, M., Wang, R., and Bassett, S. (2011). Gene expression reveals overlap between normal aging and Alzheimer’s disease genes. Neurobiol. Aging 32, 2319.e27–2319.e34.
Barrett, E. L., and Richardson, D. S. (2011). Sex differences in telomeres and lifespan. Aging Cell 10, 913–921.
Benjamini, Y., and Hochberg, Y. (1995). Controlling the false discovery rate - a practical and powerful approach to multiple testing. J. R. Stat. Soc. Series B Methodol. 57, 289–300.
Berchtold, N. C., Coleman, P. D., Cribbs, D. H., Rogers, J., Gillen, D. L., and Cotman, C. W. (2013). Synaptic genes are extensively downregulated across multiple brain regions in normal human aging and Alzheimer’s disease. Neurobiol. Aging 34, 1653–1661. doi: 10.1016/j.neurobiolaging.2012.11.024
Berchtold, N. C., Cribbs, D. H., Coleman, P. D., Rogers, J., Head, E., Kim, R., et al. (2008). Gene expression changes in the course of normal brain aging are sexually dimorphic. Proc. Natl. Acad. Sci. U.S.A. 105, 15605–15610. doi: 10.1073/pnas.0806883105
Bertoni-Freddari, C., Fattoretti, P., Giorgetti, B., Grossi, Y., Balietti, M., Casoli, T., et al. (2007). Alterations of synaptic turnover rate in aging may trigger senile plaque formation and neurodegeneration. Ann. N. Y. Acad. Sci. 1096, 128–137. doi: 10.1196/annals.1397.078
Bishop, N. A., Lu, T., and Yankner, B. A. (2010). Neural mechanisms of ageing and cognitive decline. Nature 464, 529–535.
Blalock, E. M., Buechel, H. M., Popovic, J., Geddes, J. W., and Landfield, P. W. (2011). Microarray analyses of laser-captured hippocampus reveal distinct gray and white matter signatures associated with incipient Alzheimer’s disease. J. Chem. Neuroanat. 42, 118–126. doi: 10.1016/j.jchemneu.2011.06.007
Coffey, C. E., Lucke, J. F., Saxton, J. A., Ratcliff, G., Unitas, L. J., Billig, B., et al. (1998). Sex differences in brain aging: A quantitative magnetic resonance imaging study. Arch. Neurol. 55, 169–179.
Colangelo, V., Schurr, J., Ball, M. J., Pelaez, R. P., Bazan, N. G., and Lukiw, W. J. (2002). Gene expression profiling of 12633 genes in Alzheimer hippocampal CA1: Transcription and neurotrophic factor down-regulation and up-regulation of apoptotic and pro-inflammatory signaling. J. Neurosci. Res. 70, 462–473. doi: 10.1002/jnr.10351
Crary, J. F., Trojanowski, J. Q., Schneider, J. A., Abisambra, J. F., Abner, E. L., Alafuzoff, I., et al. (2014). Primary age-related tauopathy (PART): A common pathology associated with human aging. Acta Neuropathol. 128, 755–766. doi: 10.1007/s00401-014-1349-0
Devaney, K. O., and Johnson, H. A. (1980). Neuron loss in the aging visual cortex of man. J. Gerontol. 35, 836–841.
Dickson, T. C., Chuckowree, J. A., Chuah, M. I., West, A. K., and Vickers, J. C. (2005). alpha-Internexin immunoreactivity reflects variable neuronal vulnerability in Alzheimer’s disease and supports the role of the beta-amyloid plaques in inducing neuronal injury. Neurobiol. Dis. 18, 286–295. doi: 10.1016/j.nbd.2004.10.001
Dillman, A. A., Majounie, E., Ding, J., Gibbs, J. R., Hernandez, D., Arepalli, S., et al. (2017). Transcriptomic profiling of the human brain reveals that altered synaptic gene expression is associated with chronological aging. Sci. Rep. 7:16890. doi: 10.1038/s41598-017-17322-0
Dobin, A., Davis, C. A., Schlesinger, F., Drenkow, J., Zaleski, C., Jha, S., et al. (2013). STAR: Ultrafast universal RNA-seq aligner. Bioinformatics 29, 15–21. doi: 10.1093/bioinformatics/bts635
Dulken, B., and Brunet, A. (2015). Stem cell aging and sex: Are we missing something? Cell Stem Cell 16, 588–590. doi: 10.1016/j.stem.2015.05.006
Fischer, K. E., and Riddle, N. C. (2018). Sex differences in aging: Genomic instability. J. Gerontol. A Biol. Sci. Med. Sci. 73, 166–174.
Flood, D. G., Buell, S. J., Horwitz, G. J., and Coleman, P. D. (1987). Dendritic extent in human dentate gyrus granule cells in normal aging and senile dementia. Brain Res. 402, 205–216. doi: 10.1016/0006-8993(87)90027-8
Gaignard, P., Savouroux, S., Liere, P., Pianos, A., Therond, P., Schumacher, M., et al. (2015). Effect of sex differences on brain mitochondrial function and its suppression by ovariectomy and in aged mice. Endocrinology 156, 2893–2904. doi: 10.1210/en.2014-1913
Gentilini, D., Garagnani, P., Pisoni, S., Bacalini, M. G., Calzari, L., Mari, D., et al. (2015). Stochastic epigenetic mutations (DNA methylation) increase exponentially in human aging and correlate with X chromosome inactivation skewing in females. Aging 7, 568–578. doi: 10.18632/aging.100792
GTEx Consortium (2015). Human genomics. The genotype-tissue expression (GTEx) pilot analysis: Multitissue gene regulation in humans. Science 348, 648–660.
Hsu, J. L., Leemans, A., Bai, C. H., Lee, C. H., Tsai, Y. F., Chiu, H. C., et al. (2008). Gender differences and age-related white matter changes of the human brain: A diffusion tensor imaging study. Neuroimage 39, 566–577. doi: 10.1016/j.neuroimage.2007.09.017
Hua, T., Kao, C., Sun, Q., Li, X., and Zhou, Y. (2008). Decreased proportion of GABA neurons accompanies age-related degradation of neuronal function in cat striate cortex. Brain Res. Bull. 75, 119–125. doi: 10.1016/j.brainresbull.2007.08.001
Huber, W., Carey, V. J., Gentleman, R., Anders, S., Carlson, M., Carvalho, B. S., et al. (2015). Orchestrating high-throughput genomic analysis with Bioconductor. Nat. Methods 12, 115–121.
Karoglu, E. T., Halim, D. O., Erkaya, B., Altaytas, F., Arslan-Ergul, A., Konu, O., et al. (2017). Aging alters the molecular dynamics of synapses in a sexually dimorphic pattern in zebrafish (Danio rerio). Neurobiol. Aging 54, 10–21. doi: 10.1016/j.neurobiolaging.2017.02.007
Kato, T., Konishi, Y., Shimohama, S., Beach, T. G., Akatsu, H., and Tooyama, I. (2015). Alpha1-chimaerin, a Rac1 GTPase-activating protein, is expressed at reduced mRNA levels in the brain of Alzheimer’s disease patients. Neurosci. Lett. 591, 19–24. doi: 10.1016/j.neulet.2015.02.013
Khundakar, A. A., Hanson, P. S., Erskine, D., Lax, N. Z., Roscamp, J., Karyka, E., et al. (2016). Analysis of primary visual cortex in dementia with Lewy bodies indicates GABAergic involvement associated with recurrent complex visual hallucinations. Acta Neuropathol. Commun. 4:66. doi: 10.1186/s40478-016-0334-3
Kiraly, A., Szabo, N., Toth, E., Csete, G., Farago, P., Kocsis, K., et al. (2016). Male brain ages faster: The age and gender dependence of subcortical volumes. Brain Imaging Behav. 10, 901–910. doi: 10.1007/s11682-015-9468-3
Kirkwood, C. M., Macdonald, M. L., Schempf, T. A., Vatsavayi, A. V., Ikonomovic, M. D., and Koppel, J. L. (2016). Altered levels of visinin-like protein 1 correspond to regional neuronal loss in Alzheimer disease and frontotemporal lobar degeneration. J. Neuropathol. Exp. Neurol. 75, 175–182. doi: 10.1093/jnen/nlv018
Klein, H. U., Mccabe, C., Gjoneska, E., Sullivan, S. E., Kaskow, B. J., Tang, A., et al. (2019). Epigenome-wide study uncovers large-scale changes in histone acetylation driven by tau pathology in aging and Alzheimer’s human brains. Nat. Neurosci. 22, 37–46. doi: 10.1038/s41593-018-0291-1
Law, C. W., Chen, Y., Shi, W., and Smyth, G. K. (2014). voom: Precision weights unlock linear model analysis tools for RNA-seq read counts. Genome Biol. 15:R29. doi: 10.1186/gb-2014-15-2-r29
Liang, W. S., Reiman, E. M., Valla, J., Dunckley, T., Beach, T. G., Grover, A., et al. (2008). Alzheimer’s disease is associated with reduced expression of energy metabolism genes in posterior cingulate neurons. Proc. Natl. Acad. Sci. U.S.A. 105, 4441–4446. doi: 10.1073/pnas.0709259105
Liao, Y., Smyth, G. K., and Shi, W. (2014). featureCounts: An efficient general purpose program for assigning sequence reads to genomic features. Bioinformatics 30, 923–930. doi: 10.1093/bioinformatics/btt656
Ljungberg, M. C., Ali, Y. O., Zhu, J., Wu, C. S., Oka, K., Zhai, R. G., et al. (2012). CREB-activity and nmnat2 transcription are down-regulated prior to neurodegeneration, while NMNAT2 over-expression is neuroprotective, in a mouse model of human tauopathy. Hum. Mol. Genet. 21, 251–267. doi: 10.1093/hmg/ddr492
Lopez-Otin, C., Blasco, M. A., Partridge, L., Serrano, M., and Kroemer, G. (2013). The hallmarks of aging. Cell 153, 1194–1217.
Machiela, M. J., Zhou, W., Sampson, J. N., Dean, M. C., Jacobs, K. B., Black, A., et al. (2015). Characterization of large structural genetic mosaicism in human autosomes. Am. J. Hum. Genet. 96, 487–497.
Mangold, C. A., Wronowski, B., Du, M., Masser, D. R., Hadad, N., Bixler, G. V., et al. (2017). Sexually divergent induction of microglial-associated neuroinflammation with hippocampal aging. J. Neuroinflammation 14:141. doi: 10.1186/s12974-017-0920-8
Mathys, H., Davila-Velderrain, J., Peng, Z., Gao, F., Mohammadi, S., Young, J. Z., et al. (2019). Single-cell transcriptomic analysis of Alzheimer’s disease. Nature 570, 332–337.
McKenzie, A. T., Katsyv, I., Song, W. M., Wang, M., and Zhang, B. (2016). DGCA: A comprehensive R package for differential gene correlation analysis. BMC Syst. Biol. 10:106. doi: 10.1186/s12918-016-0349-1
McKenzie, A. T., Moyon, S., Wang, M., Katsyv, I., Song, W. M., Zhou, X., et al. (2017). Multiscale network modeling of oligodendrocytes reveals molecular components of myelin dysregulation in Alzheimer’s disease. Mol. Neurodegener. 12:82. doi: 10.1186/s13024-017-0219-3
McKenzie, A. T., Wang, M., Hauberg, M. E., Fullard, J. F., Kozlenkov, A., Keenan, A., et al. (2018). Brain cell type specific gene expression and co-expression network architectures. Sci. Rep. 8:8868.
Miller, J. A., Woltjer, R. L., Goodenbour, J. M., Horvath, S., and Geschwind, D. H. (2013). Genes and pathways underlying regional and cell type changes in Alzheimer’s disease. Genome Med. 5:48.
Mostafavi, S., Gaiteri, C., Sullivan, S. E., White, C. C., Tasaki, S., Xu, J., et al. (2018). A molecular network of the aging human brain provides insights into the pathology and cognitive decline of Alzheimer’s disease. Nat. Neurosci. 21, 811–819.
Murphy, D. G., Decarli, C., Mcintosh, A. R., Daly, E., Mentis, M. J., Pietrini, P., et al. (1996). Sex differences in human brain morphometry and metabolism: An in vivo quantitative magnetic resonance imaging and positron emission tomography study on the effect of aging. Arch. Gen. Psychiatry 53, 585–594. doi: 10.1001/archpsyc.1996.01830070031007
Nativio, R., Donahue, G., Berson, A., Lan, Y., Amlie-Wolf, A., Tuzer, F., et al. (2018). Dysregulation of the epigenetic landscape of normal aging in Alzheimer’s disease. Nat. Neurosci. 21, 497–505.
Nebel, R. A., Aggarwal, N. T., Barnes, L. L., Gallagher, A., Goldstein, J. M., Kantarci, K., et al. (2018). Understanding the impact of sex and gender in Alzheimer’s disease: A call to action. Alzheimers Dement. 14, 1171–1183. doi: 10.1016/j.jalz.2018.04.008
Pakkenberg, B., Pelvig, D., Marner, L., Bundgaard, M. J., Gundersen, H. J., Nyengaard, J. R., et al. (2003). Aging and the human neocortex. Exp. Gerontol. 38, 95–99.
Pannese, E. (2011). Morphological changes in nerve cells during normal aging. Brain Struct. Funct. 216, 85–89.
Picillo, M., Nicoletti, A., Fetoni, V., Garavaglia, B., Barone, P., and Pellecchia, M. T. (2017). The relevance of gender in Parkinson’s disease: A review. J. Neurol. 264, 1583–1607.
Podolskiy, D. I., Lobanov, A. V., Kryukov, G. V., and Gladyshev, V. N. (2016). Analysis of cancer genomes reveals basic features of human aging and its role in cancer development. Nat. Commun. 7:12157.
Raz, N., Gunning, F. M., Head, D., Dupuis, J. H., Mcquain, J., Briggs, S. D., et al. (1997). Selective aging of the human cerebral cortex observed in vivo: Differential vulnerability of the prefrontal gray matter. Cereb. Cortex 7, 268–282. doi: 10.1093/cercor/7.3.268
Ritchie, M. E., Phipson, B., Wu, D., Hu, Y., Law, C. W., Shi, W., et al. (2015). limma powers differential expression analyses for RNA-sequencing and microarray studies. Nucleic Acids Res. 43:e47. doi: 10.1093/nar/gkv007
Sartor, M. A., Leikauf, G. D., and Medvedovic, M. (2009). LRpath: A logistic regression approach for identifying enriched biological groups in gene expression data. Bioinformatics 25, 211–217. doi: 10.1093/bioinformatics/btn592
Satoh, M., Ogawa, J., Tokita, T., Nakaguchi, N., Nakao, K., Kida, H., et al. (2014). The effects of physical exercise with music on cognitive function of elderly people: Mihama-Kiho project. PLoS One 9:e95230. doi: 10.1371/journal.pone.0095230
Sen, P. K. (1968). Estimates of regression coefficient based on Kendall’s Tau. J. Am. Stat. Assoc. 63, 1379–1389.
Shannon, P., Markiel, A., Ozier, O., Baliga, N. S., Wang, J. T., Ramage, D., et al. (2003). Cytoscape: A software environment for integrated models of biomolecular interaction networks. Genome Res. 13, 2498–2504. doi: 10.1101/gr.1239303
Song, W. M., and Zhang, B. (2015). Multiscale embedded gene co-expression network analysis. PLoS Comput. Biol. 11:e1004574. doi: 10.1371/journal.pcbi.1004574
Szymanski, M., Wang, R., Bassett, S. S., and Avramopoulos, D. (2011). Alzheimer’s risk variants in the clusterin gene are associated with alternative splicing. Transl. Psychiatry 1:e18.
Wang, J., Zhou, X., Zhu, J., Gu, Y., Zhao, W., Zou, J., et al. (2012). GO-function: Deriving biologically relevant functions from statistically significant functions. Brief. Bioinform. 13, 216–227. doi: 10.1093/bib/bbr041
Wang, M., Roussos, P., Mckenzie, A., Zhou, X., Kajiwara, Y., Brennand, K. J., et al. (2016). Integrative network analysis of nineteen brain regions identifies molecular signatures and networks underlying selective regional vulnerability to Alzheimer’s disease. Genome Med. 8:104. doi: 10.1186/s13073-016-0355-3
Webster, J. A., Gibbs, J. R., Clarke, J., Ray, M., Zhang, W., Holmans, P., et al. (2009). Genetic control of human brain transcript expression in Alzheimer disease. Am. J. Hum. Genet. 84, 445–458.
Yang, J., Huang, T., Petralia, F., Long, Q., Zhang, B., Argmann, C., et al. (2015). Synchronized age-related gene expression changes across multiple tissues in human and the link to complex diseases. Sci. Rep. 5:15145.
Zarate, S., Stevnsner, T., and Gredilla, R. (2017). Role of estrogen and other sex hormones in brain aging. Neuroprotection and DNA repair. Front. Aging Neurosci. 9:430. doi: 10.3389/fnagi.2017.00430
Zhang, B., Gaiteri, C., Bodea, L. G., Wang, Z., Mcelwee, J., Podtelezhnikov, A. A., et al. (2013). Integrated systems approach identifies genetic nodes and networks in late-onset Alzheimer’s disease. Cell 153, 707–720. doi: 10.1016/j.cell.2013.03.030
Keywords: brain aging, gender differences, gene co-expression network, key regulators, Alzheimer’s disease
Citation: Zhou X, Cao J, Zhu L, Farrell K, Wang M, Guo L, Yang J, McKenzie A, Crary JF, Cai D, Tu Z and Zhang B (2023) Molecular differences in brain regional vulnerability to aging between males and females. Front. Aging Neurosci. 15:1153251. doi: 10.3389/fnagi.2023.1153251
Received: 29 January 2023; Accepted: 02 May 2023;
Published: 22 May 2023.
Edited by:
Jolanta Dorszewska, Poznan University of Medical Sciences, PolandReviewed by:
Ismael Al-Ramahi, Baylor College of Medicine, United StatesRoberta Marongiu, Cornell University, United States
Copyright © 2023 Zhou, Cao, Zhu, Farrell, Wang, Guo, Yang, McKenzie, Crary, Cai, Tu and Zhang. This is an open-access article distributed under the terms of the Creative Commons Attribution License (CC BY). The use, distribution or reproduction in other forums is permitted, provided the original author(s) and the copyright owner(s) are credited and that the original publication in this journal is cited, in accordance with accepted academic practice. No use, distribution or reproduction is permitted which does not comply with these terms.
*Correspondence: Bin Zhang, YmluemhhbmcudWNsYUBnbWFpbC5jb20=