
94% of researchers rate our articles as excellent or good
Learn more about the work of our research integrity team to safeguard the quality of each article we publish.
Find out more
ORIGINAL RESEARCH article
Front. Aging Neurosci., 15 November 2022
Sec. Neurocognitive Aging and Behavior
Volume 14 - 2022 | https://doi.org/10.3389/fnagi.2022.963668
This article is part of the Research TopicCommunity Series in Understanding Brain Aging – Volume IIView all 7 articles
 Shasha Bao†Chengde Liao†Nan XuAilin DengYueyuan LuoZhiqiang OuyangXiaobin GuoYifan LiuTengfei Ke*
 Jun Yang*
Objective: Brain tissue changes dynamically during aging. The purpose of this study was to use synthetic magnetic resonance imaging (syMRI) to evaluate the changes in relaxation values in different brain regions during brain aging and to construct a brain age prediction model.
Materials and methods: Quantitative MRI was performed on 1,000 healthy people (≥ 18 years old) from September 2020 to October 2021. T1, T2 and proton density (PD) values were simultaneously measured in 17 regions of interest (the cerebellar hemispheric cortex, pons, amygdala, hippocampal head, hippocampal tail, temporal lobe, occipital lobe, frontal lobe, caudate nucleus, lentiform nucleus, dorsal thalamus, centrum semiovale, parietal lobe, precentral gyrus, postcentral gyrus, substantia nigra, and red nucleus). The relationship between the relaxation values and age was investigated. In addition, we analyzed the relationship between brain tissue values and sex. Finally, the participants were divided into two age groups: < 60 years old and ≥ 60 years old. Logistic regression analysis was carried out on the two groups of data. According to the weight of related factors, a brain age prediction model was established and verified.
Results: We obtained the specific reference value range of different brain regions of individuals in different age groups and found that there were differences in relaxation values in brain tissue between different sexes in the same age group. Moreover, the relaxation values of most brain regions in males were slightly higher than those in females. In the study of age and brain relaxation, it was found that brain relaxation values were correlated with age. The T1 values of the centrum semiovale increased with age, the PD values of the centrum semiovale increased with age, while the T2 values of the caudate nucleus and lentiform nucleus decreased with age. Seven brain age prediction models were constructed with high sensitivity and specificity, among which the combined T1, T2 and PD values showed the best prediction efficiency. In the training set, the area under the curve (AUC), specificity and sensitivity were 0.959 [95% confidence interval (CI): 0.945–0.974], 91.51% and 89.36%, respectively. In the test cohort, the above indicators were 0.916 (95% CI: 0.882–0.951), 89.24% and 80.33%, respectively.
Conclusion: Our study provides specific reference ranges of T1, T2, and PD values in different brain regions from healthy adults of different ages. In addition, there are differences in brain relaxation values in some brain regions between different sexes, which help to provide new ideas for brain diseases that differ according to sex. The brain age model based on synthetic MRI is helpful to determine brain age.
With the aging of the global population, the burden of age-related functional decline and disease is increasing (Vos et al., 2012). As one’s age increases, the microscopic and macroscopic characteristics of white matter change, and the atypical manifestations of white matter in the process of aging are similar to neurodegenerative diseases and mental diseases (Valizadeh et al., 2018). Therefore, understanding the brain-related changes in the process of aging can help us to better distinguish them from signs of a pathological state (Lebel and Deoni, 2018). There are considerable individual differences in the size of brain changes with age; the degree of brain aging may be adversely affected by poor physical and mental health. Cardiovascular risk factors, such as hypertension high blood pressure, diabetes and obesity, have been linked to increased brain aging (Ronan et al., 2016). In addition, some studies have hypothesized that long-term exposure to a stressful environment will lead to biological aging and premature aging (Geronimus, 2013). Therefore, in the process of human brain degeneration with age, the speed and trajectory of human brain degradation may be quite different between different individuals and different brain regions. Magnetic resonance imaging (MRI) is a powerful tool for studying human brain maturation, because many ongoing microstructure changes during brain maturation affect proton relaxation, leading to characteristic changes in MRI findings (Paus et al., 2001).
MRI features could serve as a biomarker for determining the age of the brain and can reflect the integrity and health of the brain to a certain extent (Bashyam et al., 2020). At present, a variety of brain MR quantitative methods, such as magnetization transfer imaging and diffusion tensor imaging, have been used to evaluate the physiological characteristics of brain tissue and its changes with age (Weiskopf et al., 2013; Seiler et al., 2014; Faizy et al., 2018). However, the traditional quantitative relaxation sequence needs to be collected on the basis of the conventional scanning sequence, which increases the scanning time. Different scanning sequence images may have the problem of spatial mismatching. Synthetic MRI (SyMRI) is a new type of quantitative MR technology that can obtain high-definition quantitative values of R1 (1/T1), R2 (1/T2) and proton density (PD) of the whole brain in a single scan with high accuracy, and the quantitative parameters related to brain tissue can be obtained according to the automatic segmentation of brain tissue by R1, R2 and PD (McAllister et al., 2017). In contrast, quantitative MRI techniques, such as relaxation measurements provide absolute digital indicators that can be used to define brain aging trajectories and quantitatively monitor abnormal aging or disease conditions.
SyMRI can not only provide the images needed for conventional imaging diagnosis, but also provide quantitative values for the early detection of abnormal maturity and disease status (Hagiwara et al., 2017). By drawing the region of interest (ROI) on the quantitative map of syMRI, the quantitative values of brain tissue can be obtained. Therefore, syMRI can objectively compare brain states according to the relaxation value and the absolute value of water content (Warntjes et al., 2008; Hagiwara et al., 2017). To date, the gradual changes in the contrast of gray matter and white matter on conventional images driven by changes in T1 and T2 values have been widely used to evaluate brain development (Barkovich et al., 1988; Paus et al., 2001). Compared with traditional MRI, syMRI significantly improves the examination efficiency, enriches diagnostic information, and has broader applicability. SyMRI technology can synthesize a variety of contrast-weighted images by setting different repetition time (TR), echo time (TE) and inversion time (TI) values, including some rarely used clinical scanning sequences, to provide more valuable diagnostic information for a variety of clinical diseases, and show a good diagnostic effect (Andica et al., 2019). At present, some studies have used the above characteristics of syMRI to evaluate the brain volumes of children with cerebral palsy (Kułak et al., 2016), autism (Hazlett et al., 2017) and multiple sclerosis brain atrophy (Vågberg et al., 2013). To sum up, we speculate that it is feasible to use syMRI to explore the brain aging process.
Previous studies have shown that T1, T2 and PD values obtained by using syMRI varied with age in 89 healthy children (from newborns to adolescents) (Lee et al., 2018). They also provided age-specific regional reference values that can be used as an objective tool for assessing normal/abnormal brain development (Lee et al., 2018). However, there are few studies on the changes in brain tissue relaxation values from adulthood to old age. The purpose of this study was to prospectively analyze the relevant information of relaxation values obtained by synthetic MRI in different brain regions of healthy people, explore the changes in brain tissue relaxation values in relation to age, and provide digital indicators, that can be used to define the aging trajectory to quantitatively monitor the status of abnormal aging.
We recruited healthy volunteers from communities and universities, and all subjects underwent syMRI at our research center (September 2020 to October 2021, Asian population). Inclusion criteria were as follows: (1) age ≥ 18 years old; (2) no previous history of hypertension, heart disease or diabetes; (3) no severe mental illness, learning disability or cognitive impairment in the past; (4) no history of alcohol abuse or taking psychotropic drugs; (5) no history of brain-related lesions (such as cerebral hemorrhage, cerebral infarction, brain tumor, etc.) or history of brain surgery; and (6) no claustrophobia. Exclusion criteria were as follows: (1) MRI detection of brain tumors, cerebral hemorrhage and other brain abnormalities and (2) images with artifacts. We included 1,000 subjects, of whom 57 were diagnosed with old cerebral infarction, significant demyelination and severe motor artifacts, and were excluded from the final analysis. This study was examined and approved by the Ethics Committee of Yunnan Cancer Hospital (Ethical Review approval No: KYCS2021262). All participants were informed of the contents and methods of the experiment and signed an informed consent form.
All MRI scans were performed on a 3T scanner (GE Signal Pioneer, GE Medical) using a 21-channel head and neck joint coil. The quantitative MRI parameters were as follows: visual field 240 mm, matrix 320 × 256, cross-sectional thickness/spacing 6/1 mm, echo chain length 16, acceleration factor 3, excitation times 1, layer number 21, bandwidth 173.6 kHz/pixel, and TR 4,031 ms. There was a 1 mm spacing between slices. The main purpose of adding layer spacing is to prevent interlayer interference and to control the number of scanning layers. Too many layers will prolong the scanning time of Magic sequence and increase the probability of motion artifacts. The acceleration is ASSET (Array Spatial Sensitivity Encoding Technique. ASSET is GE’s rebranding of SENSE.). We use 4 different saturation delay times and 2 different echo times. The syMRI sequence acquisition time was 3 min 30 s. Use the program provided by the supplier (GE’s MAGIC software was used) to generate quantified maps (T1, T2 and PD diagrams) from the original data at the same time. MAGIC is a customized version of SyMRI IMAGE marketed by Synthetic MRI’s partner GE Healthcare under a license agreement.
We measured and analyzed the quantitative tissue values (T1, T2, and PD) of the ROI by the same surveyor. Three quantitative relaxation values were simultaneously obtained in each ROI by using imaging processing software (GE’s MAGIC software was used). The ROIs on T1 were manually placed in the following 17 regions of interest: the cerebellar cortex, pons, amygdala, hippocampal head, hippocampal caudate, temporal lobe, occipital lobe, frontal lobe, caudate nucleus head, lentiform nucleus shell, dorsal thalamus, centrum semiovale, parietal lobe, precentral gyrus, and postcentral gyrus. The substantia nigra and red nucleus were located on T2 fluid-attenuated inversion recovery (FLAIR) images. The selection of the ROI for quantitative analysis is shown in the supplementary (Supplementary Figure 1). The tissue values we obtained from the left and right hemispheres of the brain were averaged to obtain the value of each ROI in the brain. ROI delineated slice selection was performed at the (1) internal auditory canal level: cerebellar hemisphere; (2) middle layer of the eyeball: pons; (3) suprasellar cistern level: amygdala, hippocampal head, hippocampal caudate, temporal lobe, and occipital lobe; (4) basal ganglia level: frontal lobe, caudate nucleus head, lentiform nucleus shell, and dorsal thalamus; (5) centrum semiovale level: centrum semiovale, and parietal lobe; (6) paracentric lobule level: precentral gyrus, postcentral gyrus; and (7) midbrain aqueduct plane (on T2 FLAIR): substantia nigra and red nucleus. ROIs were chosen carefully to prevent the risk of partial volume effects at the tissue interface and to prevent changes in relaxation values from being drawn in the neighbor’s sulcus in smaller areas. Hence, the areas we manually delineated were located in the median area of the corresponding brain region to ensure that the values come from brain tissue, not from the nearest neighbor’s cerebrospinal fluid. Two weeks after the first drawing of the ROIs, we randomly selected 10 subjects (a total of 60 subjects) in each of the six groups, and the same radiologist drew the ROIs again. Then, the tissue values extracted twice were tested by the intragroup correlation coefficient test (intraclass correlation coefficient, ICC). The characteristics with ICCs > 0.75 were considered to be stable and repeatable.
SPSS 22.0 software was used for statistical analysis in this study. Visual histogram inspections were used to assess variable normality. When normally distributed, a consistency test (ICC) was used to evaluate the intragroup differences in measurements from the same radiologist. The brain regions with ICC values > 0.75 were preserved, and the following statistical analysis was performed: (1) the analysis of variance (ANOVA) test or nonparametric test was used for comparisons among different age groups; (2) the independent sample t-test was used for comparison between different sexes in the same age group; (3) the values of T1, T2, PD of brain tissue were analyzed by Spearman correlation analysis, and the difference was evaluated for statistical significance; (4) the data were divided into two groups (< 60 years old group and ≥ 60 years old group) and analyzed by logistic binary regression analysis, and the brain regions with p < 0.05 were retained. All patients were randomly divided into a training set and a test set at a ratio of 7:3 (the division between test and training data based on the entire pool of subjects). RStudio (version 4.1.0) software was used to build the prediction model and verification model.
Among the 943 subjects, there were 357 males and 586 females aged from 20 to 85 years old. According to their age, the participants were divided into 6 groups: 350 were in the 20-year-old group, 70 were in the 30-year-old group, 110 were in the 40-year-old group, 170 were in the 50-year-old group, 132 were in the 60-year-old group and 111 were in the ≥ 70-year group. Figure 2 shows the age range and sex distribution of subjects. The brain regions with good consistency (ICC > 0.75) were retained when the observers measured the tissue values of each brain region twice (Supplementary Table 1).
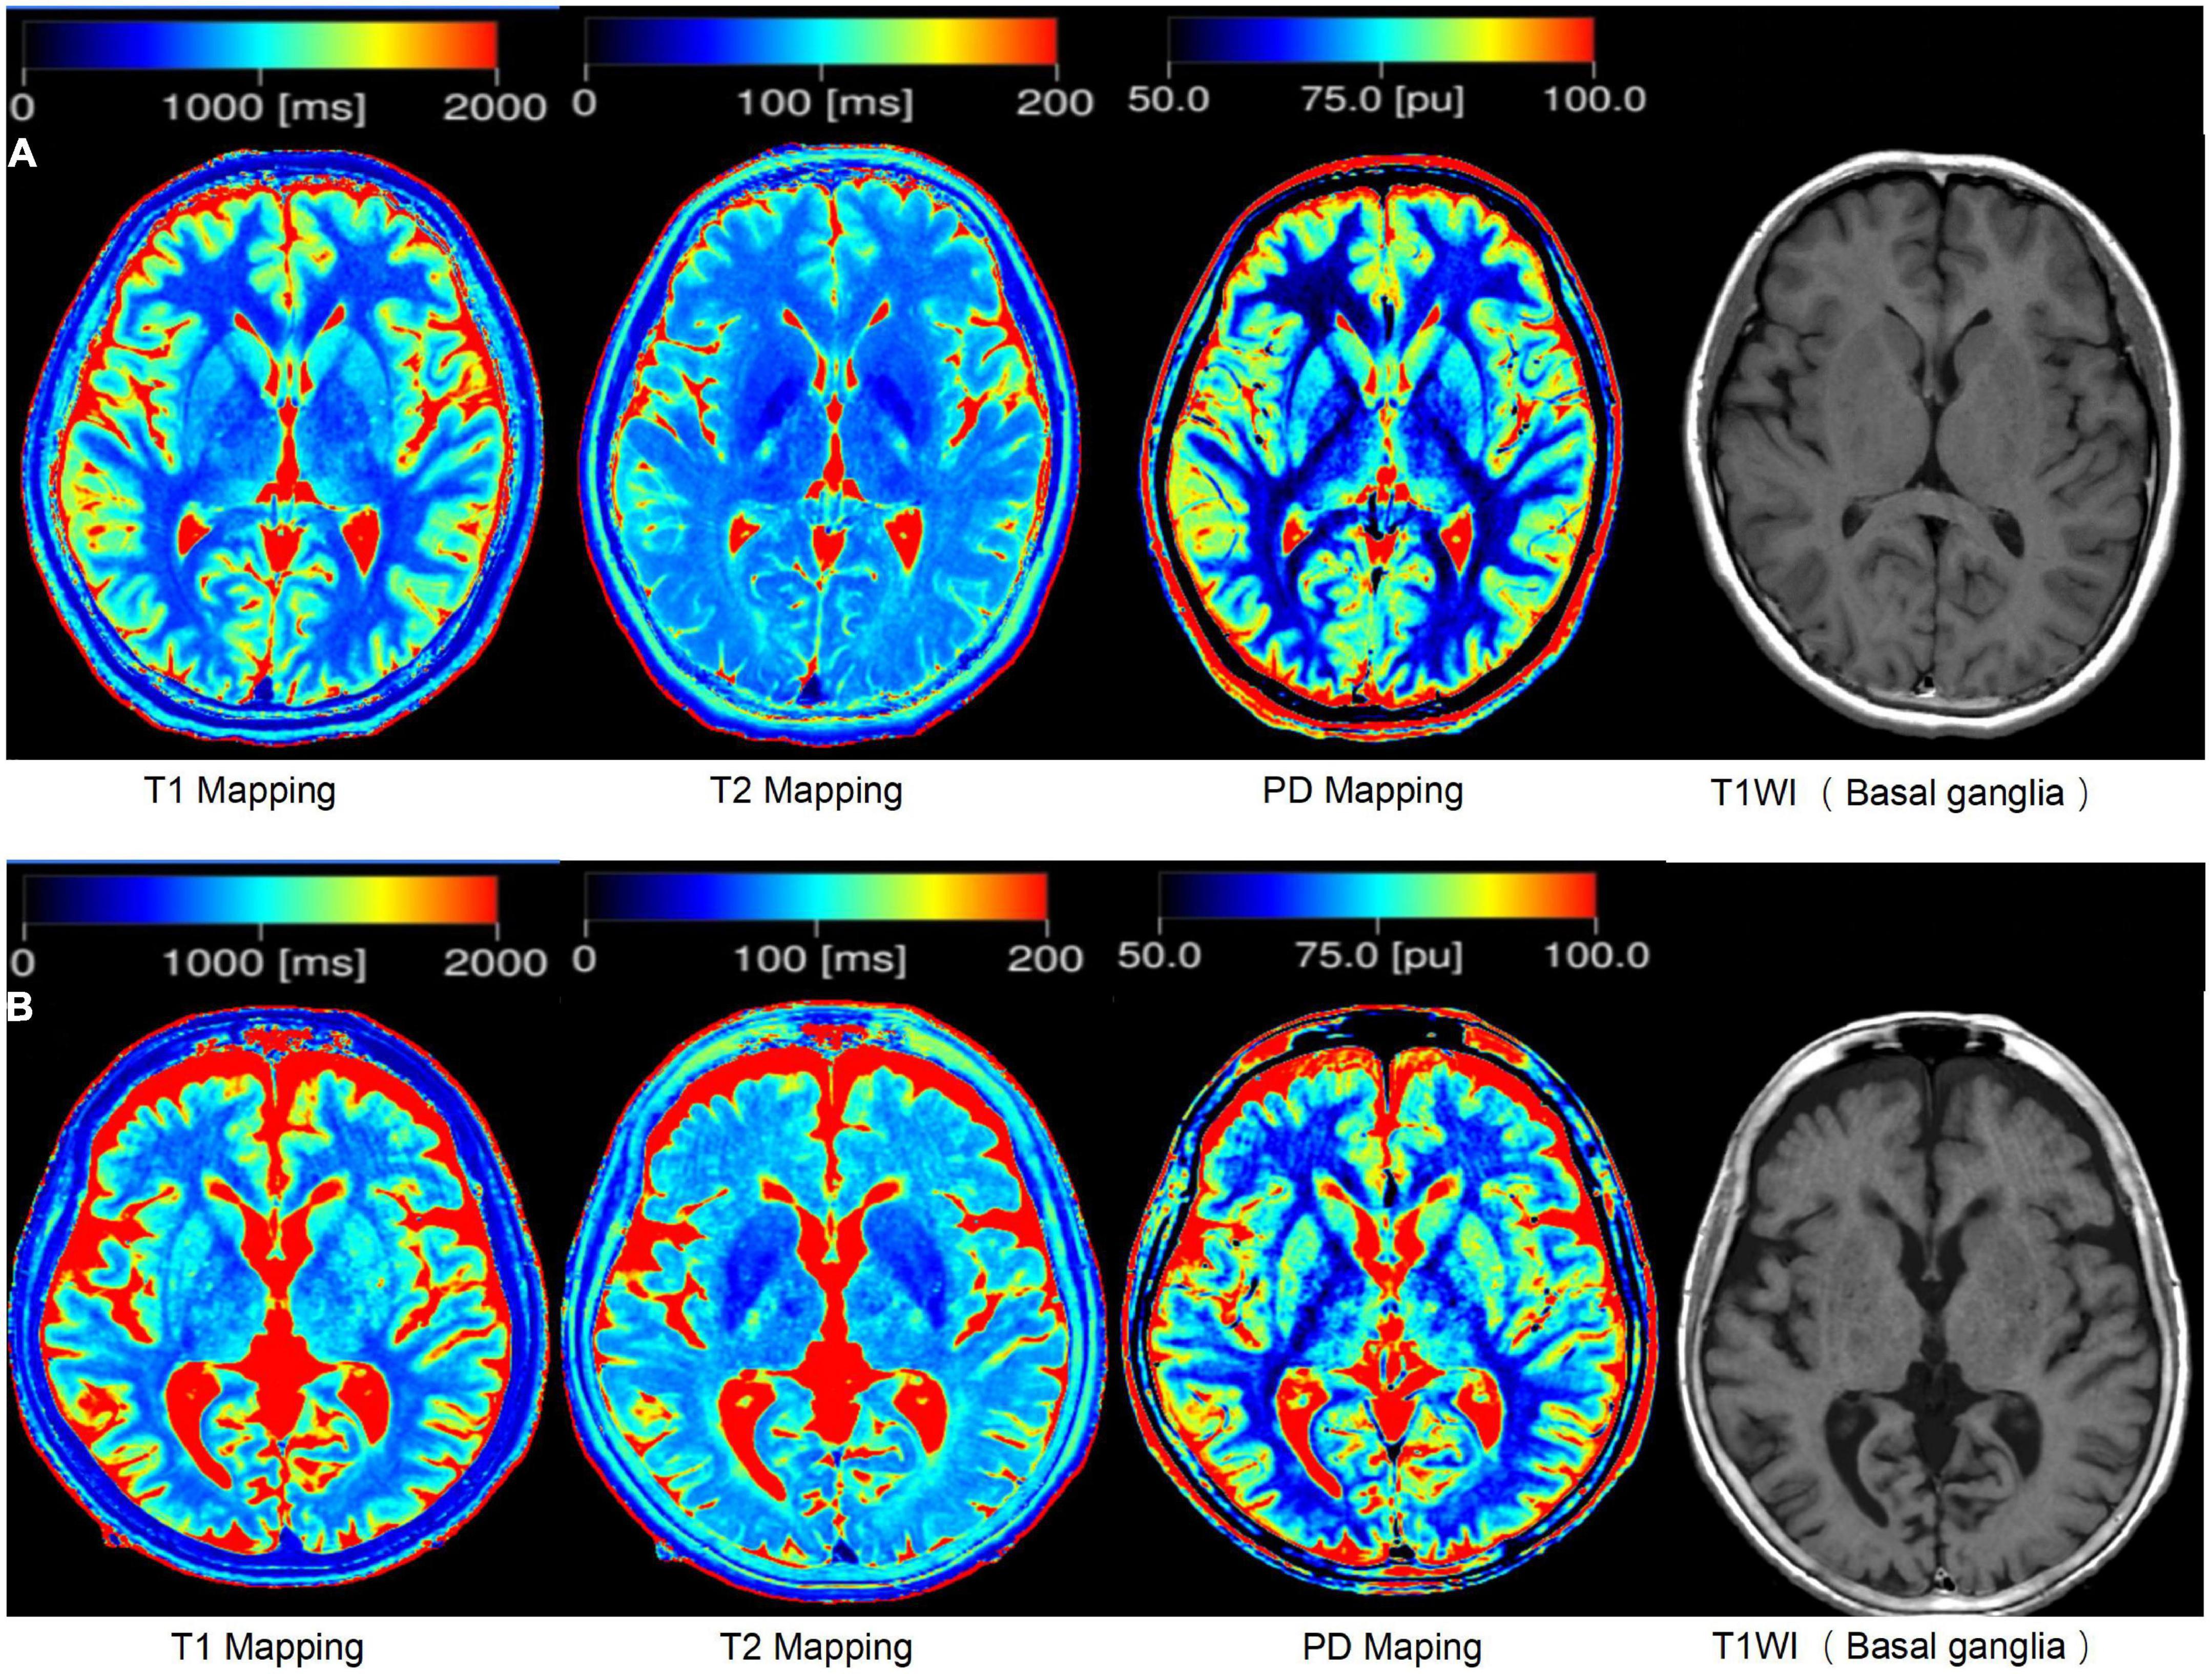
Figure 1. The example of syMRI. (A) Shows the brain of a 25-year-old person, and (B) shows the brain of a 83-year-old person.
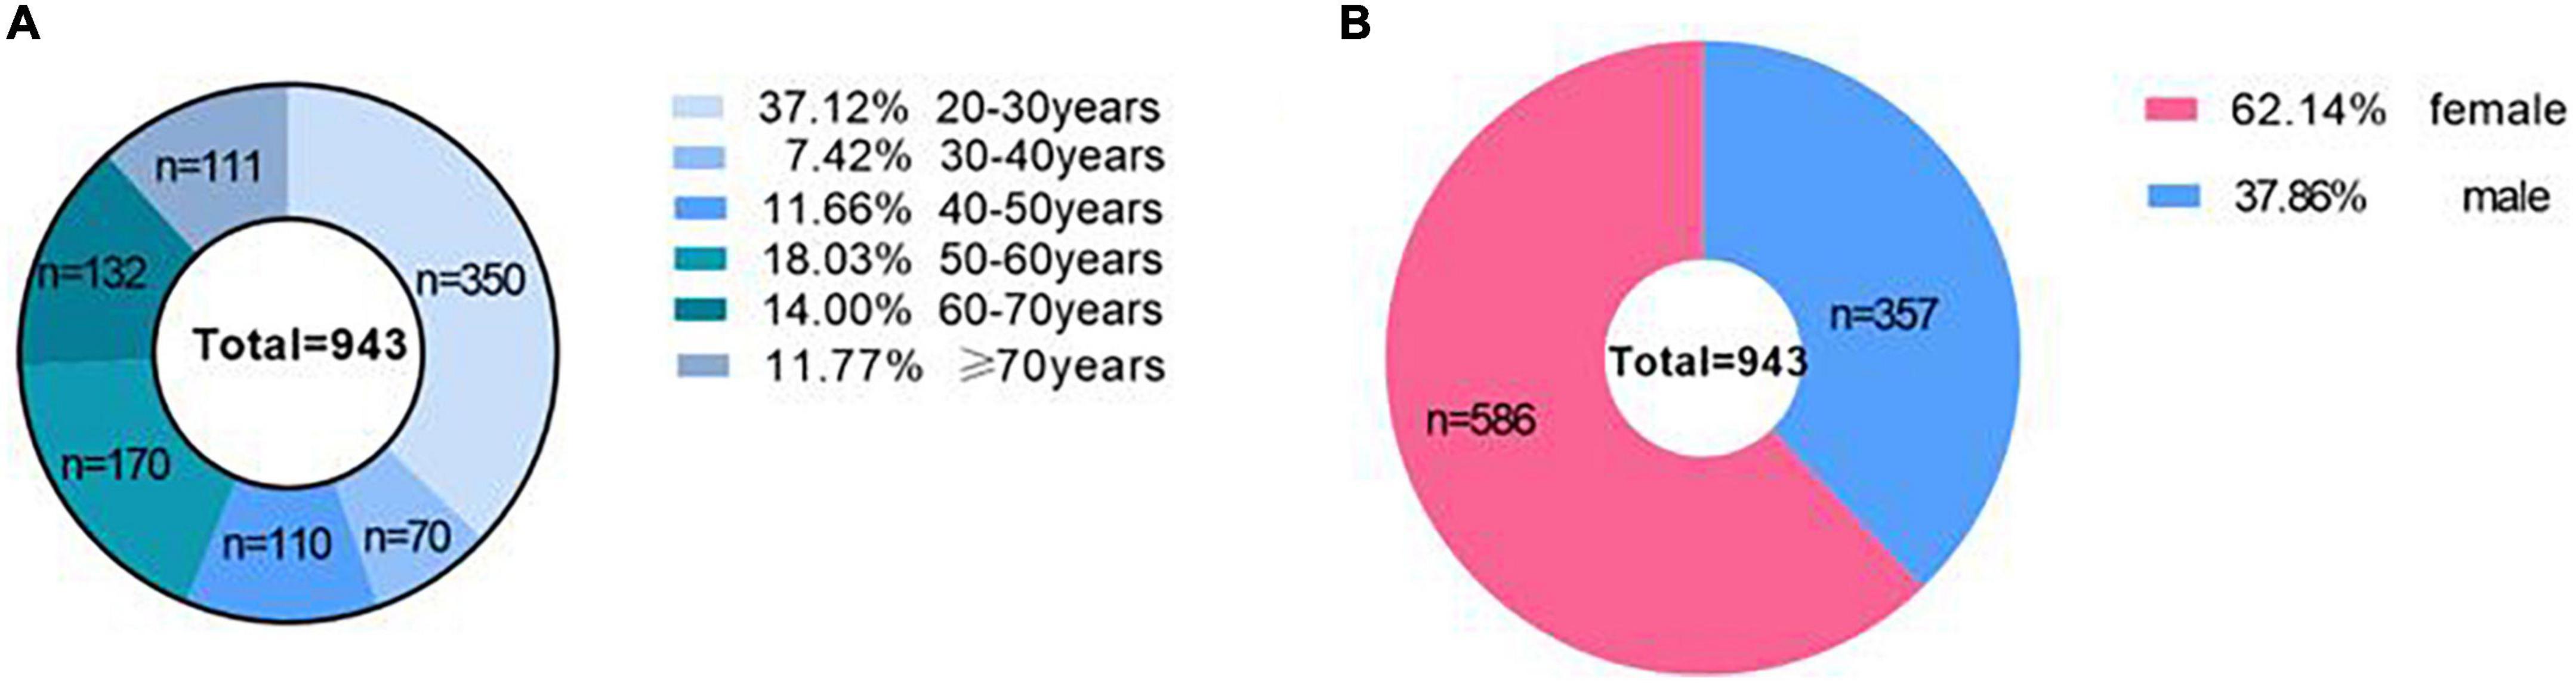
Figure 2. The age range and sex distribution of subjects. (A) Shows the age range of subjects, and (B) shows the sex distribution of subjects.
1. Comparison of brain tissue relaxation parameters between participants of the same age but of different sexes.
After analyzing and comparing the relaxation values of brain tissue of participants within the same age group of different sexes, we found that there were significant differences in some brain regions between the sexes (Figure 3 and Supplementary Table 2).
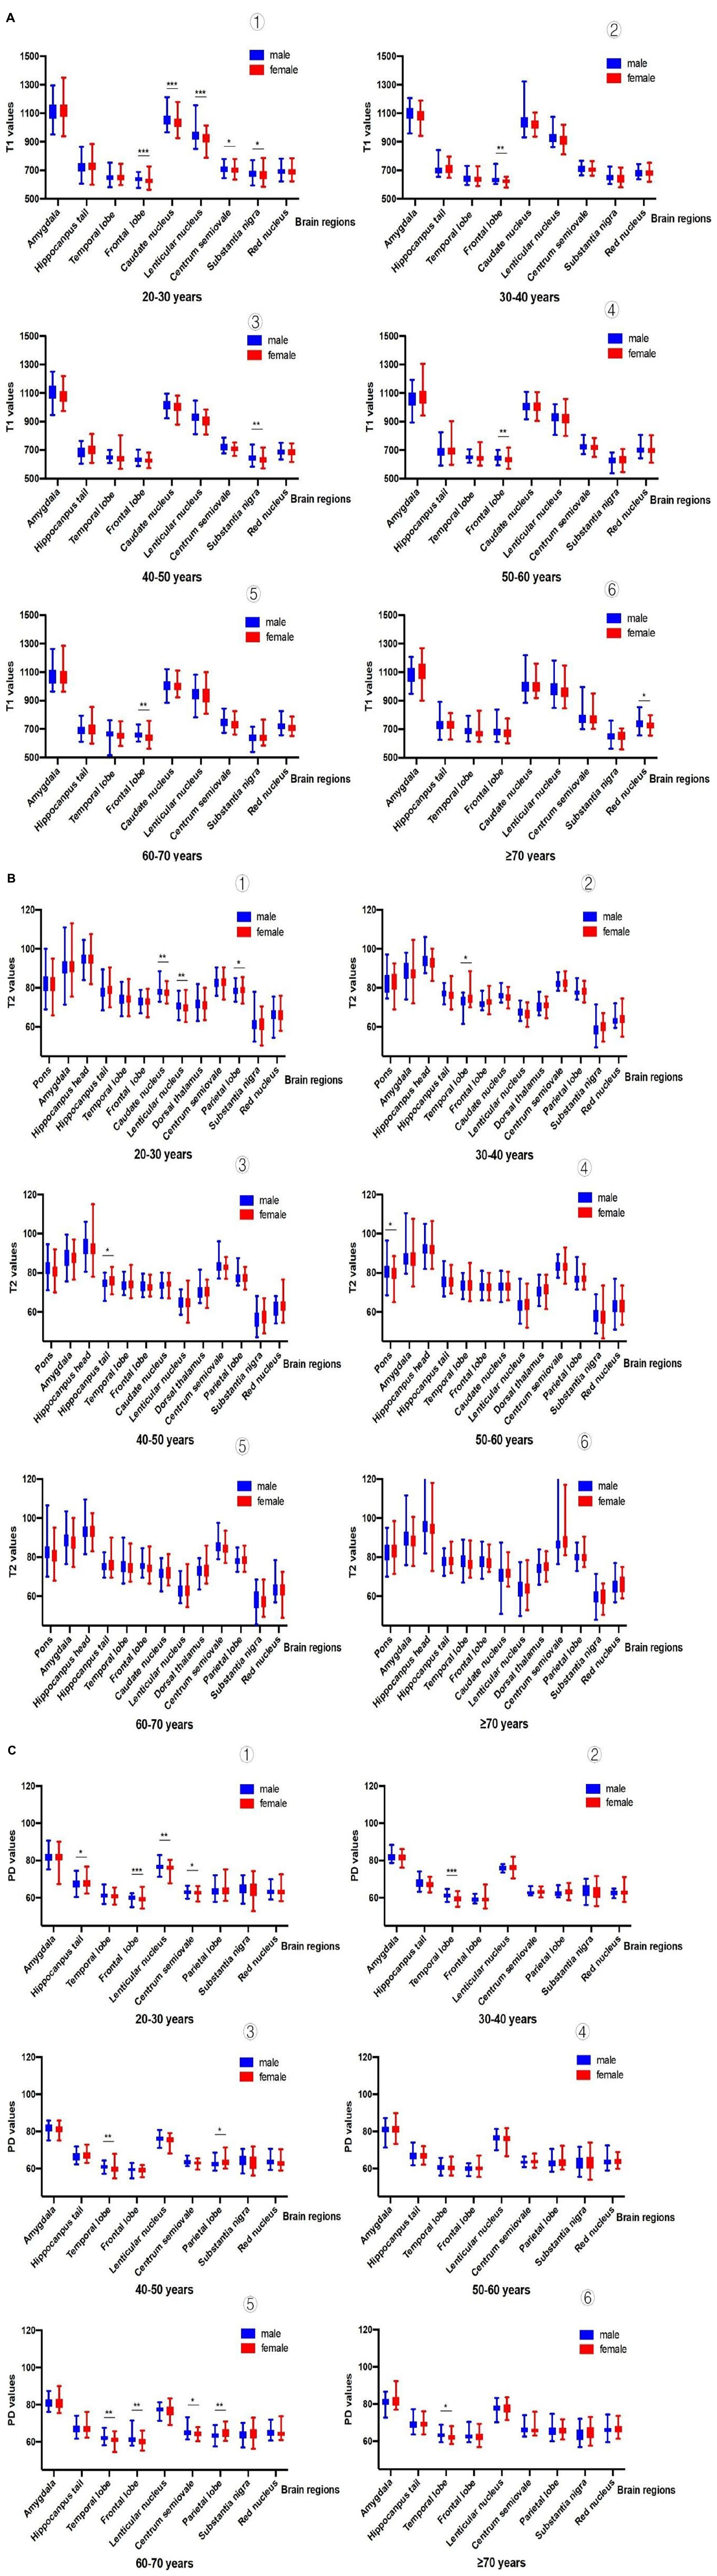
Figure 3. (A) Comparison of T1 values among people of different sexes [➀ shows sex differences in T1 values (20-30 years): in the frontal lobe, caudate nucleus, lentiform nucleus, centrum semiovale and substantia nigra; ➁ shows sex differences in T1 values (30-40 years): only in the frontal lobe; ➂ shows sex differences in T1 values (40-50 years):only in the substantia nigra; ➃ shows sex differences in T1 values (50-60 years): only in the frontal lobe; ➄ shows sex differences in T1 values (60-70 years): only in the frontal lobe; ➅ shows sex differences in T1 values (70 years): only in the frontal lobe]. (Male vs. female, *P<0.05; **P<0.01; ***P<0.001). (B) Comparison of T2 values among people of different sexes [➀ shows sex differences in T2 values (20-30 years): in the caudate nucleus, lenticular nucleus, and parietal lobe; ➁ shows sex differences in T2 values (30-40 years):all brain regions had no significant difference; ➂ shows sex differences in T2 values (40-50 years): only in the hippocampal tail; ➃ shows sex differences in T2 values (50-60 years): only in the pons; ➄ shows sex differences in T2 values (60-70 years): all brain regions had no significant difference; ➅ shows sex differences in T2 values (70 years): all brain regions had no significant difference]. (Male vs. female, *P<0.05; **P<0.01;***P<0.001). (C) Comparison of PD values among people of different sexes [➀ shows sex differences in PD values (20-30 years): in the hippocampal tail, frontal lobe, lentiform nucleus, and centrum semiovale; ➁ shows sex differences in PD values (30-40 years): only in the temporal lobe; ➂ shows sex differences in PD values (40-50 years): only in the temporal lobe and parietal lobe; ➃ shows sex differences in PD values (50-60 years): there was no significant difference in all brain regions; ➄ shows sex differences in PD values (60-70 years): in the temporal lobe, frontal lobe, centrum semiovale, and parietal lobe; ➅ shows sex differences in PD values (70 years): only in the temporal lobe]. (Male vs. female, *P<0.05;**P<0.01;***P<0.001).
The age groups and brain regions that showed sex differences in T1 values were (1) the 20–30 years old group: in the frontal lobe, caudate nucleus, lentiform nucleus, centrum semiovale and substantia nigra; (2) the 30–40 years old group: only in the frontal lobe; (3) the 40–50 years old group: only in the substantia nigra; (4) the 50–60 years old group: in the frontal lobe only; (5) the 60–70 years old group: in the frontal lobe only; and (6) the ≥ 70 years old group: in the frontal lobe only. The age groups and brain regions that showed sex differences in T2 values were (1) the 20–30 years old group: in the caudate nucleus, lenticular nucleus, and parietal lobe; (2) the 30–40 years old group: all brain regions had no significant difference; (3) the 40–50 years old group: only in the hippocampal tail; (4) the 50–60 years old group: only in the pons; (5) the 60–70 years old group: all brain regions had no significant difference; and (6) the ≥ 70 years old group: all brain regions had no significant difference. The age groups and brain regions with sex differences in PD values were (1) the 20–30 years old group: in the hippocampal tail, frontal lobe, lentiform nucleus, and centrum semiovale; (2) the 30–40 years old group: only in the temporal lobe; (3) the 40–50 years old group: only in the temporal lobe and parietal lobe; (4) the 50–60 years old group: there was no significant difference in all brain regions; (5) the 60–70 years old group: in the temporal lobe, frontal lobe, centrum semiovale, and parietal lobe; and (6) the ≥ 70 years old group: only in the temporal lobe.
2. Changes in the relaxation values of brain regions with age.
The specific reference ranges of relaxation values for different brain regions (T1, T2, and PD) for different age groups are provided in Supplementary Table 3. After Spearman correlation analysis was performed between relaxation values and age, we selected the brain regions with significant correlation coefficients (| r| > 0.4, see Supplementary Table 4). Categorized by values, these regions were T1: the centrum semiovale; T2: the caudate nucleus and lenticular nucleus; and PD: centrum semiovale. Figure 4 shows the changes in T1, T2, and PD values with age in 943 subjects with higher correlation coefficients. We found that the relaxation values of brain regions with a high correlation with age had different trends with increasing age, in which the T1 values of the centrum semiovale increased with age, the PD values of centrum semiovale increased with age, while the T2 values of the caudate nucleus and lentiform nucleus decreased with age.
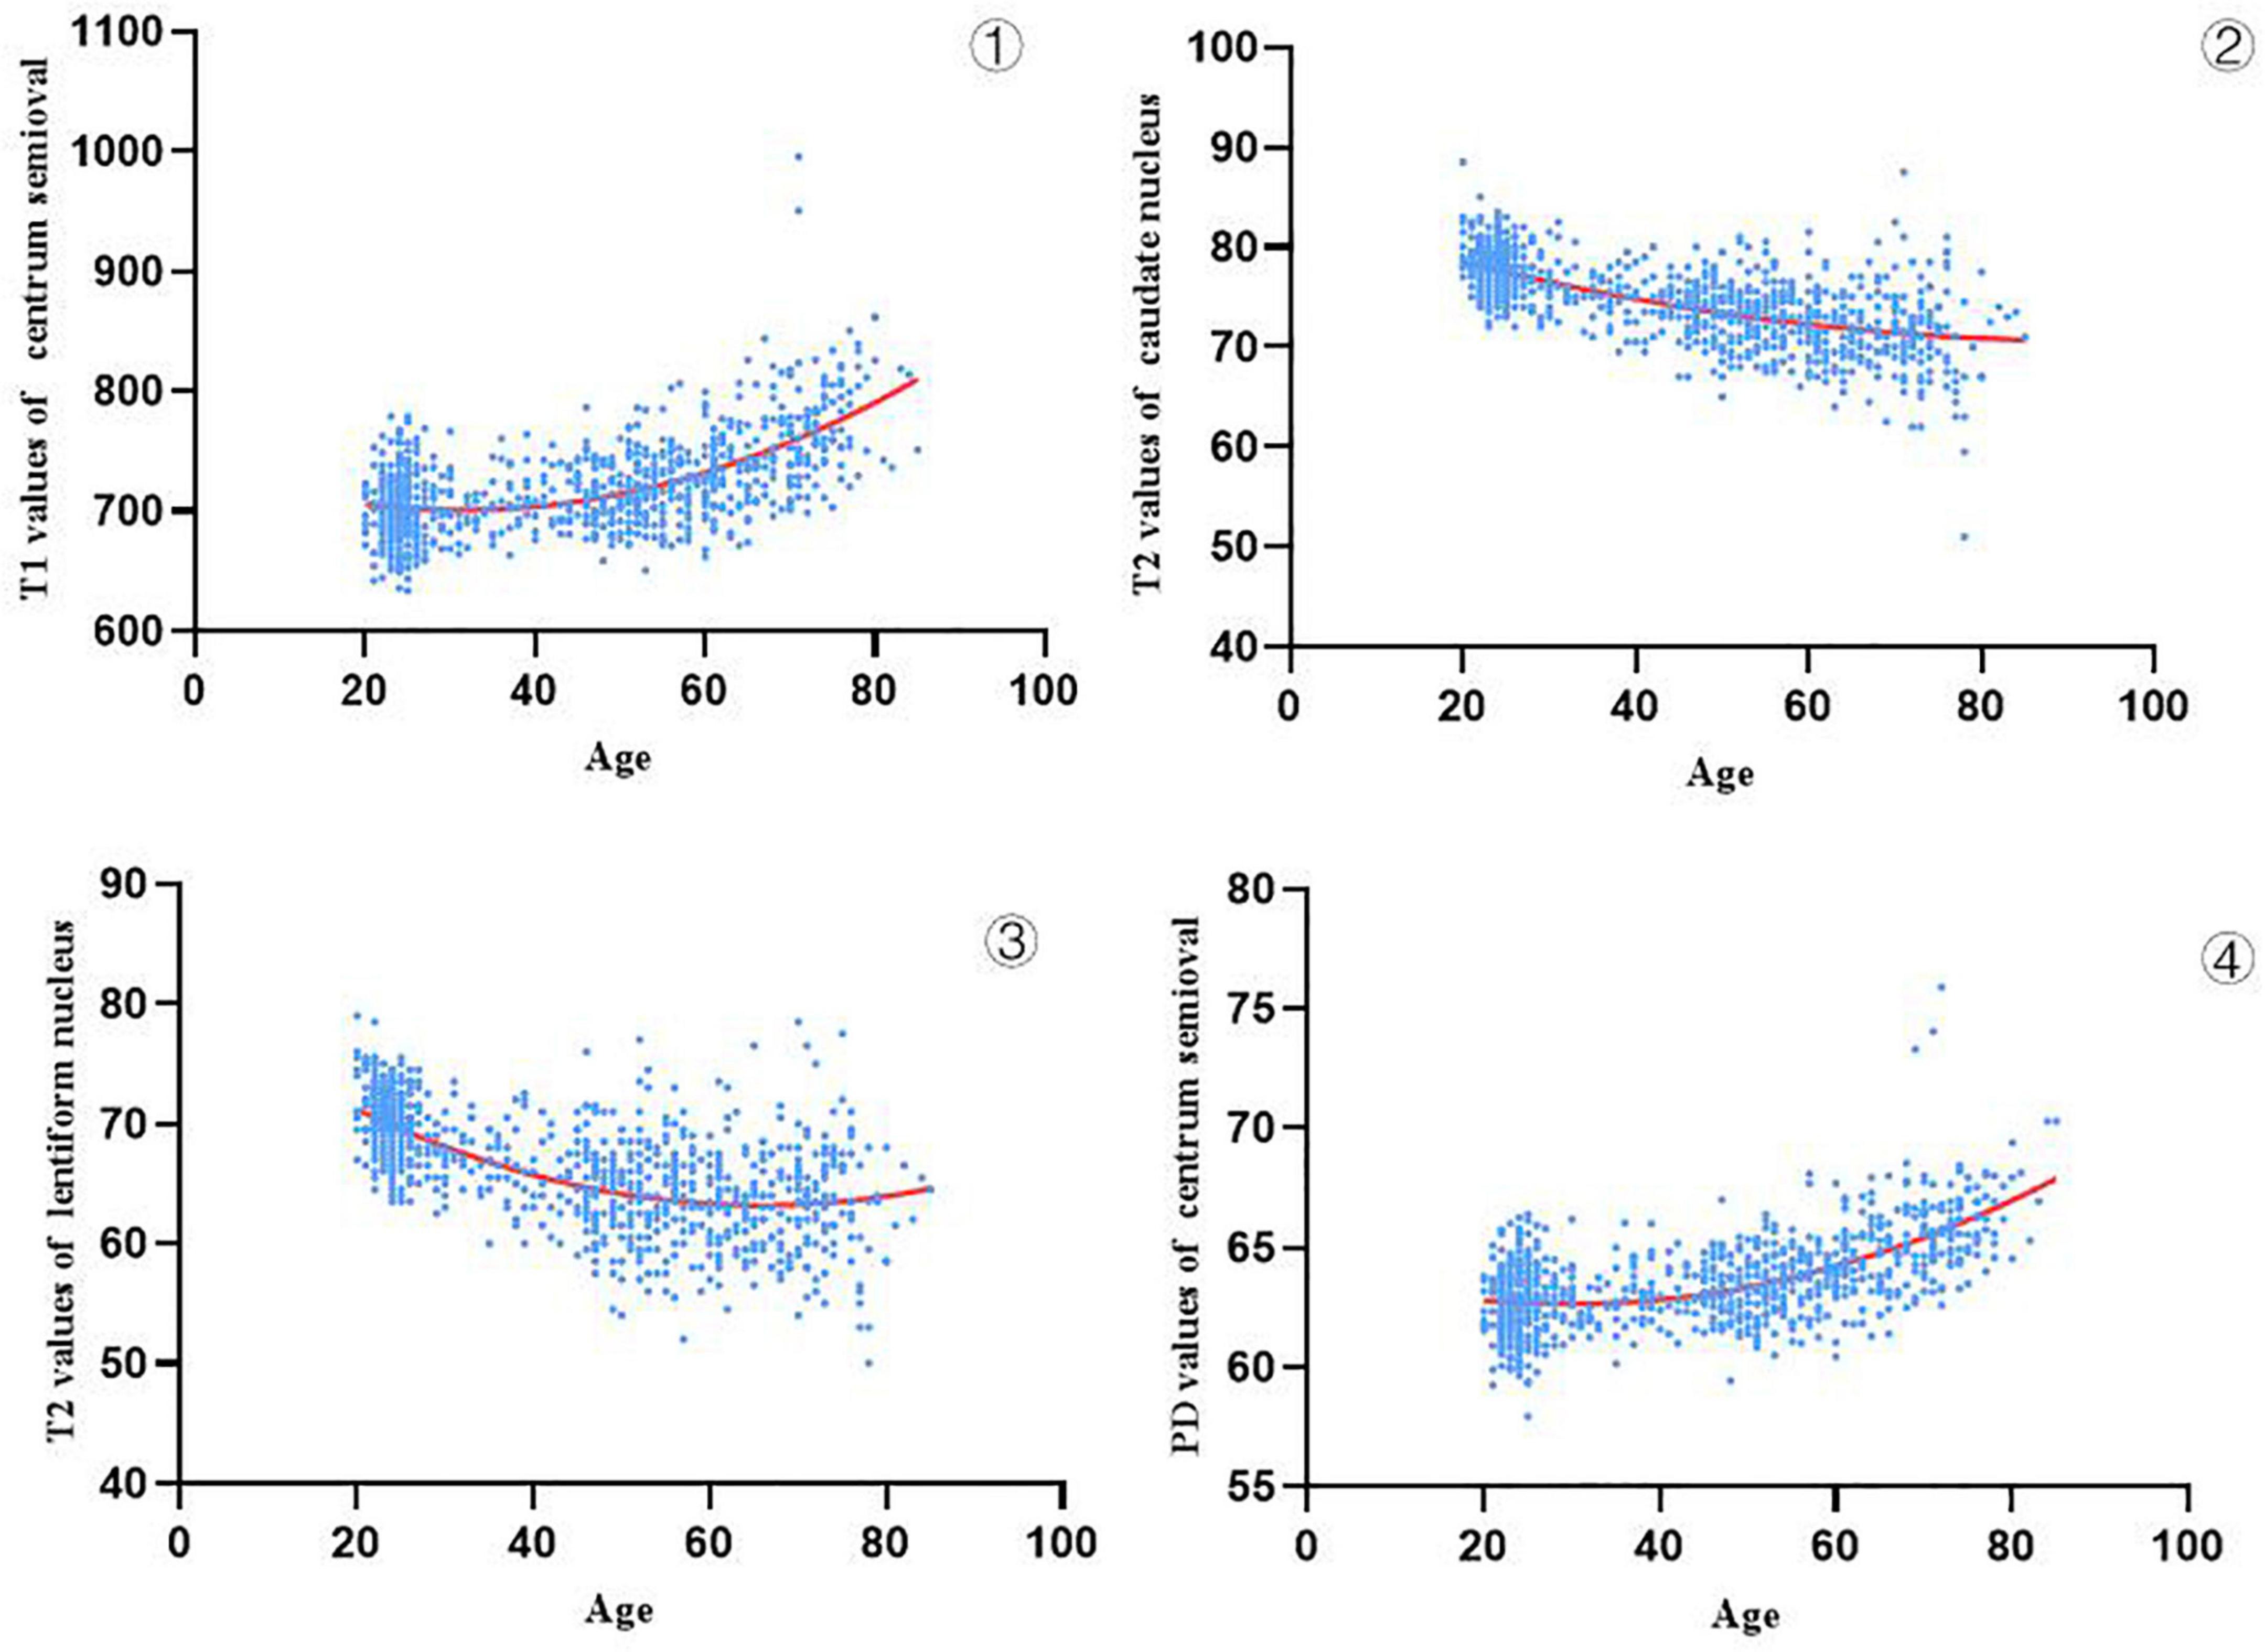
Figure 4. Trajectories of T1, T2 and PD values in age-related brain regions (943 subjects) ① show that the T1 values of the centrum semiovale increased with age, ②,③ show that the T2 values of the caudate nucleus and lentiform nucleus decreased with age, and ④ show that the PD values of centrum semiovale increased with age.
3. Construction and prediction of the prediction model.
We divided the included data into two groups, a < 60-year-old group (700 cases) and a ≥ 60-year-old group (243 cases), to build a brain age prediction model. We screened out the variables that entered the model by logistic binary regression to construct a brain age prediction model and finally included the brain regions corresponding to certain T1, T2, and PD values in the model as follows: (1) T1 values: the caudate nucleus, lenticular nucleus, centrum semiovale, substantia nigra and red nucleus; (2) T2 values: the frontal lobe, caudate nucleus, lenticular nucleus and dorsal thalamus; and (3) PD values: the centrum semiovale and red nucleus (Supplementary Table 5).
There are seven prediction models: (1) the T1 value prediction model; (2) the T2 value prediction model; (3) the PD value prediction model; (4) the T1 value combined with the T2 value prediction model; (5) the T1 value combined with the PD value prediction model; (6) the T2 value combined with the PD value prediction model; and (7) the T1 value, T2 value, and PD value joint prediction model. The receiver operating characteristic (ROC) curves of the training set and verification set of the seven models we constructed are shown in Figure 5. The characteristics of training cohort and test cohort are shown in Table 1. The sensitivity and specicity of each model are shown in Table 2.
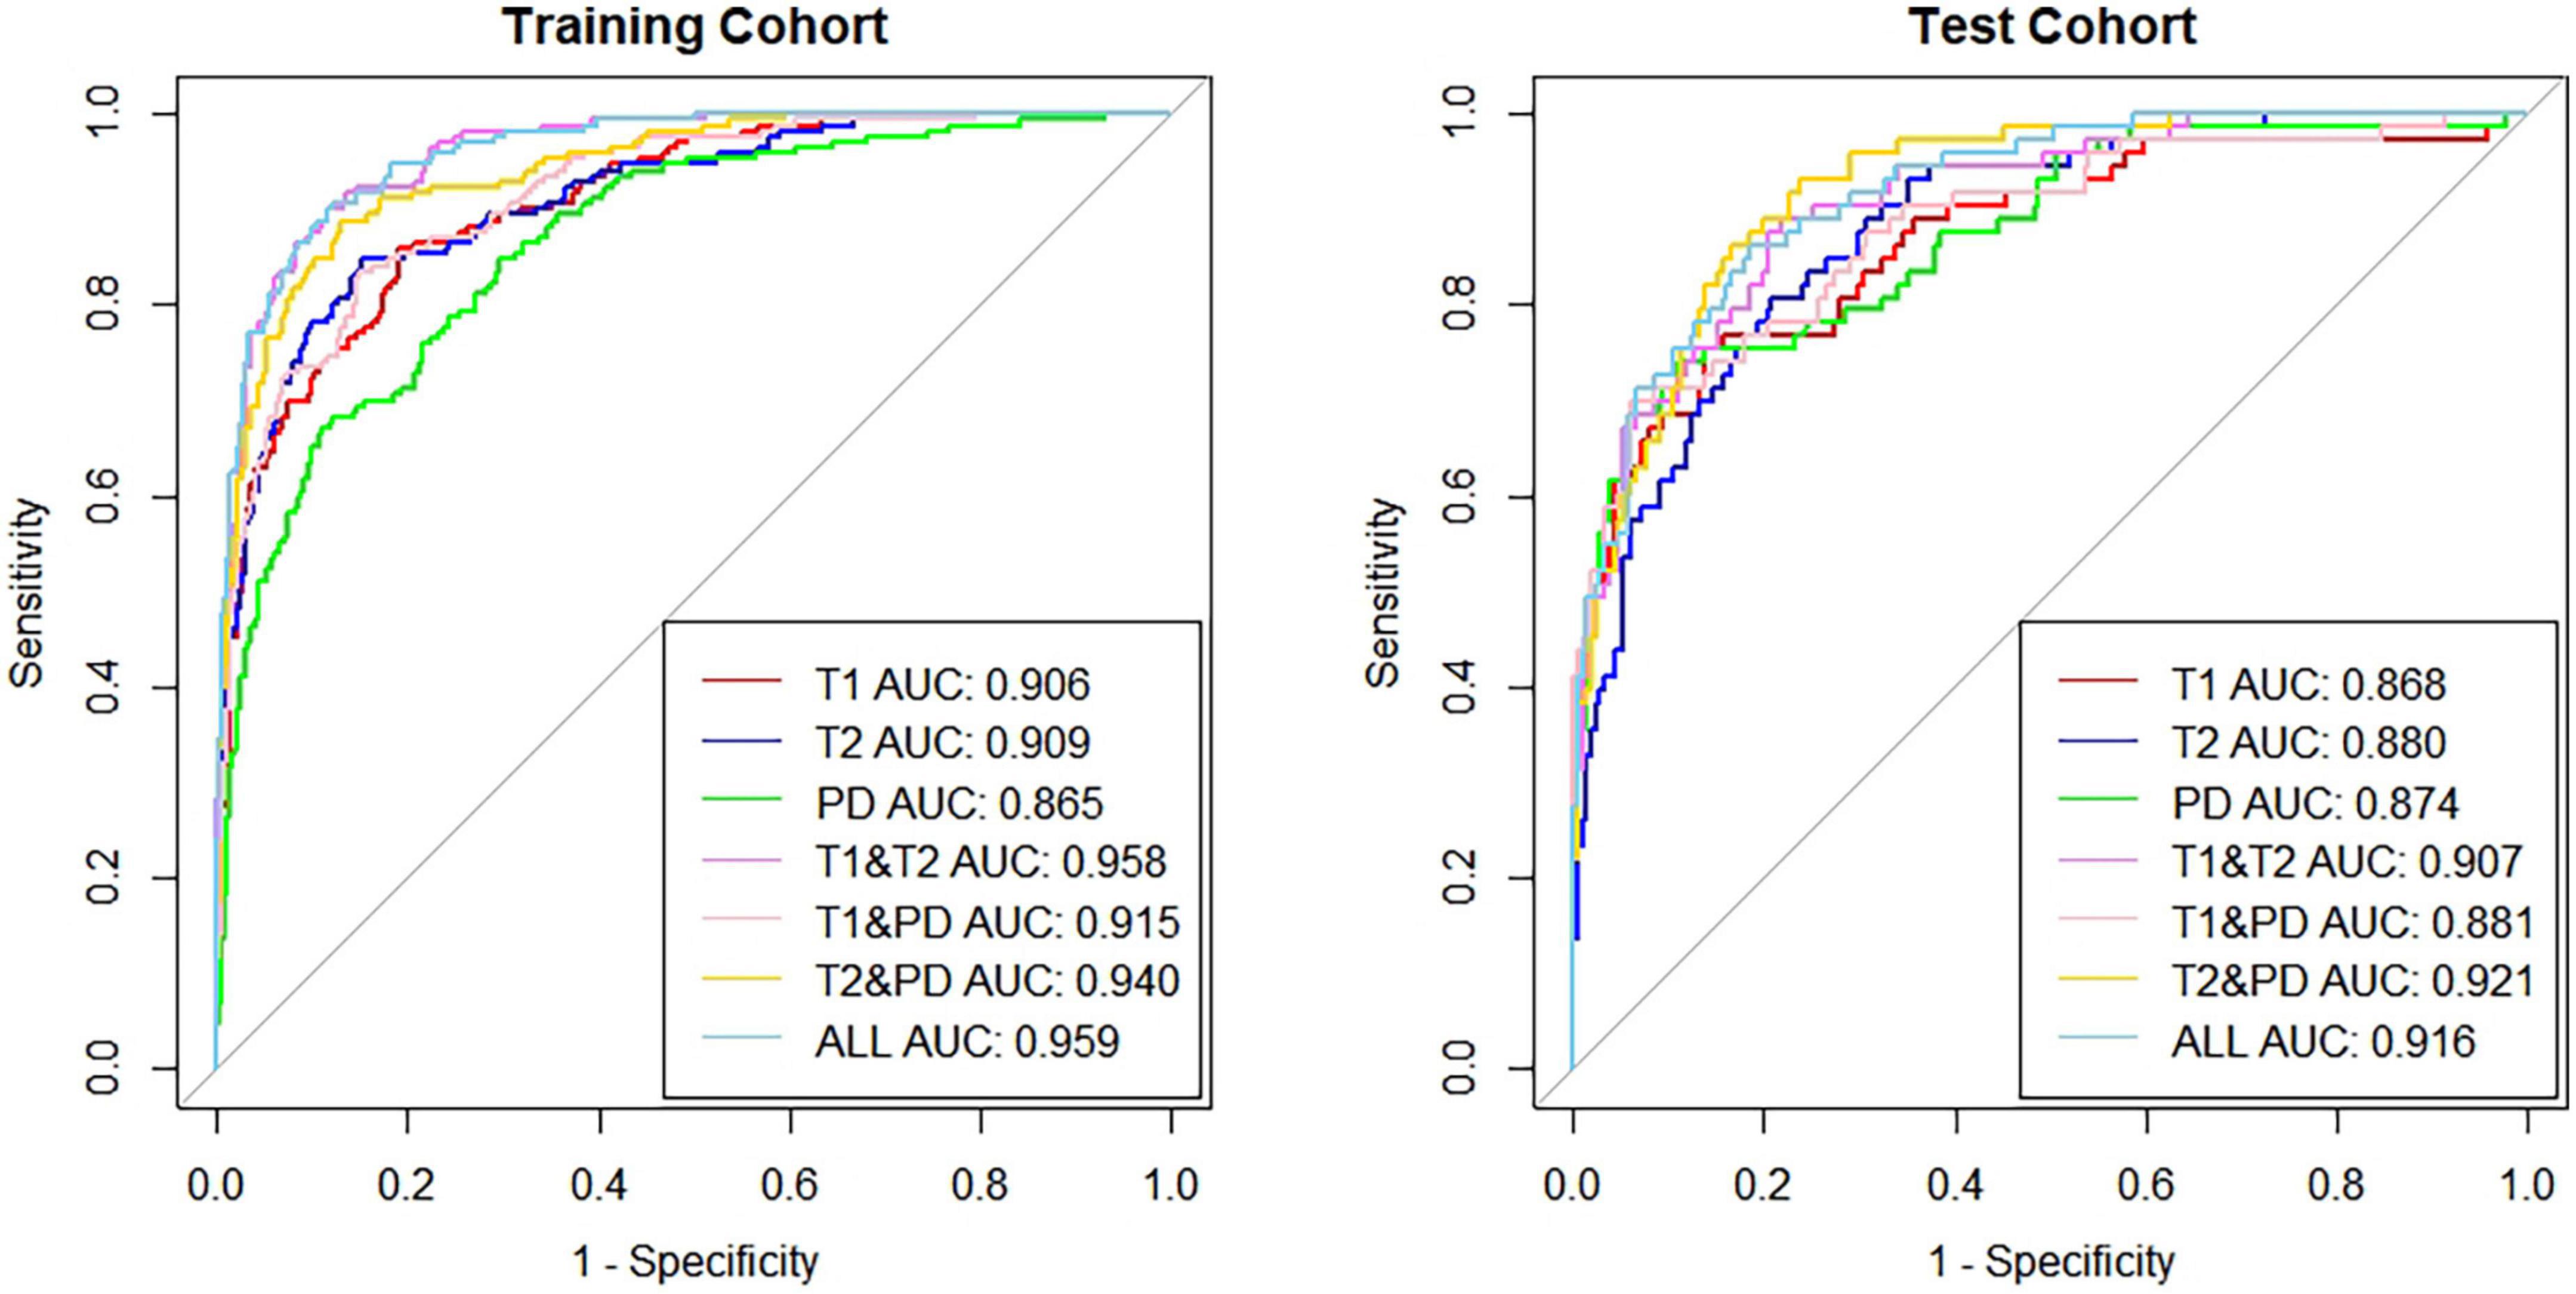
Figure 5. The AUC of the 7 predictive models in the training group and test group.
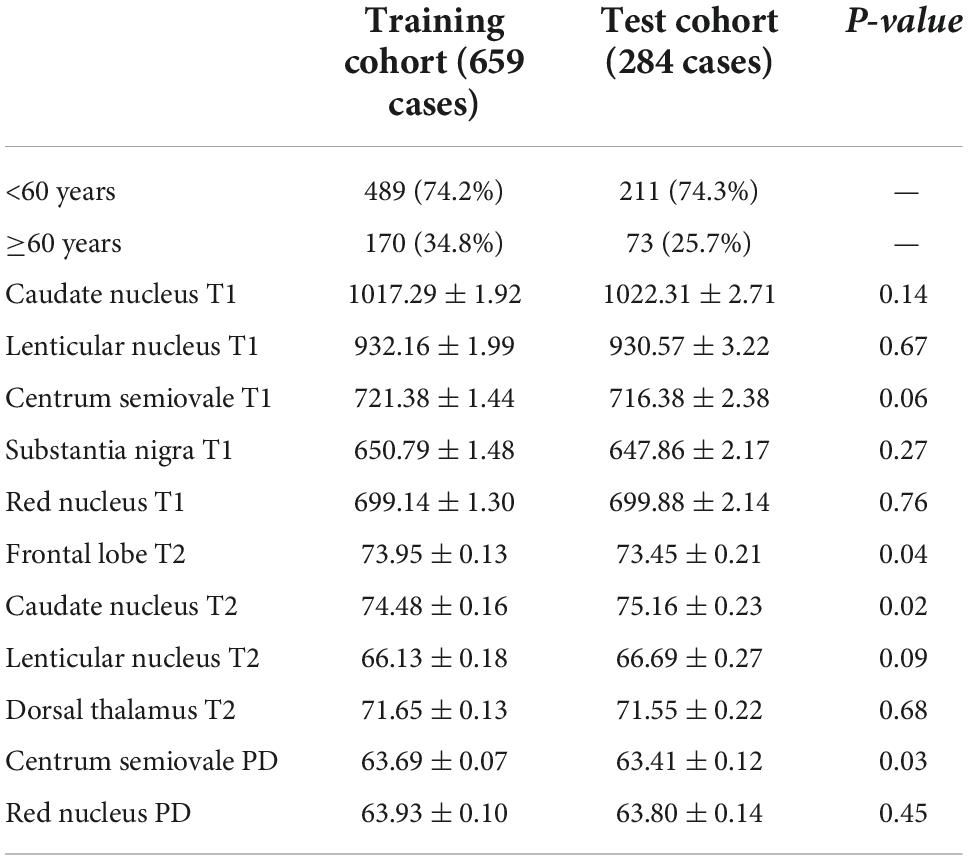
Table 1. Demographic characteristic of subjects in training and test cohort.
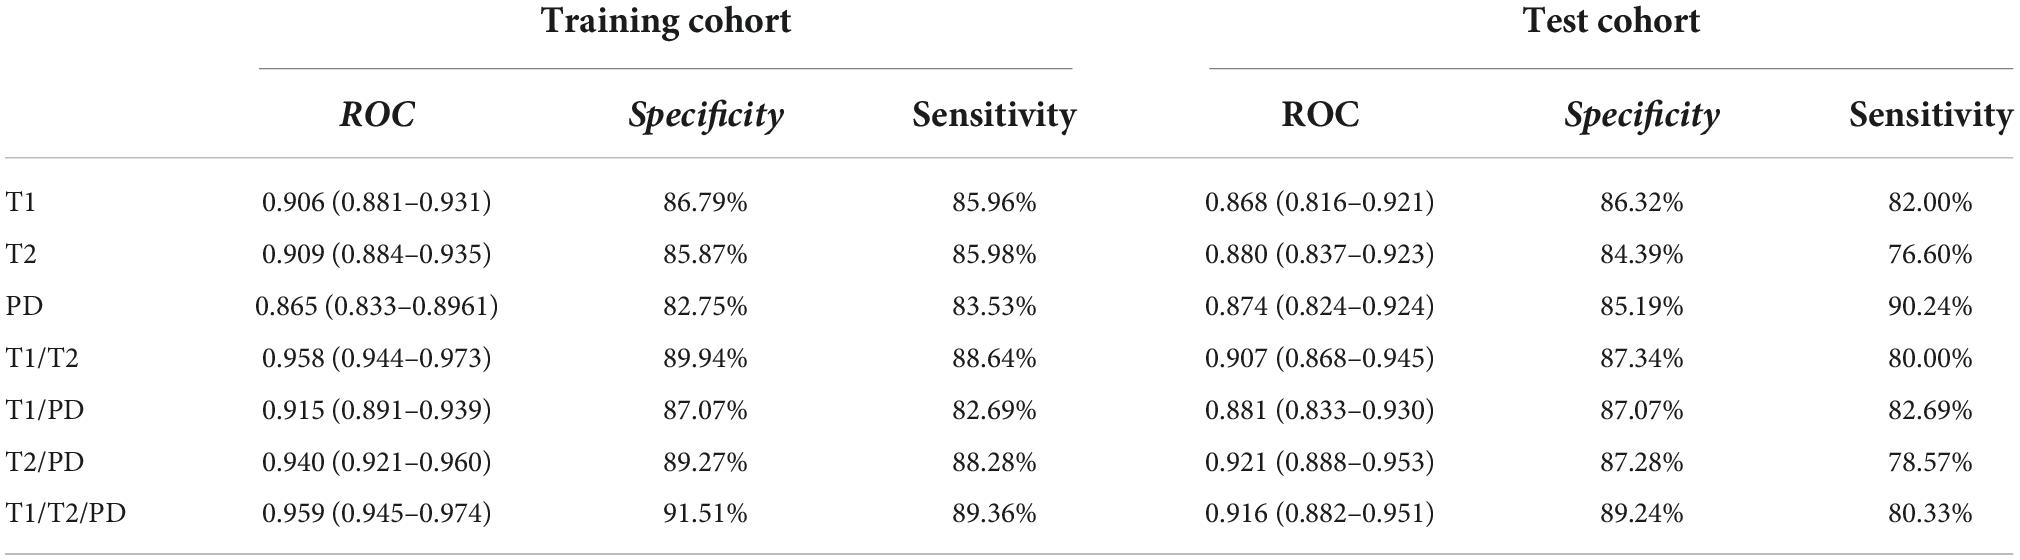
Table 2. Specificity and sensitivity of 7 prediction models.
Based on syMRI of 943 healthy people aged 20–85 years old, this study analyzed the sex differences in the relaxation values of different brain regions and their changes with age.
In this study, syMRI was used for the first time to assess the developmental trajectory of brain tissue value attributes from adulthood to old age in a large sample. We analyzed the relationship between the relaxation values of different brain regions and age. The T1 values of the centrum semiovale increased with age, the PD values of the centrum semiovale increased with age, while the T2 values of the caudate nucleus and lentiform nucleus decreased with age. In addition, we established seven prediction models using brain tissue relaxation values to predict brain age, among which the model combined with T1, T2, and PD values had the best performance for brain age prediction. In this study, when exploring the relationship between brain tissue relaxation values and age, we also found that there may be differences in brain tissue relaxation values between different sexes. We found that the relaxation values of brain regions of participants in the same age group were different between different sexes, and the T1 values of brain regions with differences in males were slightly higher than those in females. However, the T2 and PD values of different brain regions in females were slightly higher than those in males.
In our study, we found that the differences in T1, T2, and PD values in different brain regions were different among different age groups, suggesting that the changes in relaxation values in important brain regions in different age groups may have stages. In the research progress on the structural changes in the cerebral hemisphere of aging rhesus monkeys, it has been proven that the decrease in oligodendrocyte and synaptic density are related to age; in addition, with the increase in age, glial cell proliferation, increase in free water content and decrease in myelin sheath leads to the increase in T1 and T2 values. These physiological changes affect the changes in white matter volume and relaxation value and have a certain correlation with age (Peters and Kemper, 2012). We found that there was a linear relationship between the relaxation value of brain tissue and age with increasing age. It was observed that some brain regions showed positive correlations, while some brain regions showed negative correlations. However, a study of newborns to adolescents showed that tissue values in all brain regions except cortical PD decreased with age (Lee et al., 2018). This finding is different from our results, which showed that the T1 and PD values of the centrum semiovale decrease with age, while the T2 values of the caudate nucleus and lenticular nucleus increase with age. This outcome may be due to complex biochemical and biophysical changes. In the study of healthy children (Lee et al., 2018), the brain develops to maturity from infancy to adolescence, while our subjects studied the aging process of the brain from adulthood to old age. The general decline in tissue value during brain maturation from infancy to puberty is due to complex biochemical and biophysical changes, such as reduced tissue water content, changes in water zoning, myelin formation, and changes in cell and axon density (Yoshiura et al., 1998, 2000; Matsumae et al., 2001; MacKay et al., 2006; Bartzokis et al., 2010; Glasser and Van Essen, 2011; Deoni et al., 2012). The physiological process of brain maturation is different from that of brain aging, so our results are different from those of teenagers.
Our study found that the T1 value of the centrum semiovale increased with age, which may be related to myelin loss, amyloid burden and water content. The loss of myelin and the increase in water content in brain tissue led to an increase in T1 values (Peters and Kemper, 2012). Myelin formation increases dramatically in the first few years of life (MacKay et al., 1994). At the same time, in the absence of pathology, the water content of brain tissue decreases in childhood (Kreis et al., 1993). In contrast, in the elderly stage, MRI provides evidence consistent with myelin pallor, diffuse vacuolation, gliosis, perivascular space dilation, and decreased glial cell density (Davis et al., 1994). These results are consistent with our findings obtained by syMRI in the investigation of biological markers of brain age. The T1 value of brain tissue from infants to adolescents (brain maturity) decreases with age (Lee et al., 2018). However, during brain aging, the T1 value of the centrum semiovale increased with age. The T2 value is related to amyloid deposition, myelin density, iron load and tissue water content (Schenker et al., 1993; Gracien et al., 2016). In addition, the accumulation of iron leads to the shortening of T2, especially for gray matter nuclei (Schenker et al., 1993). PD provides information about water content in tissue, so when brain tissue is replaced by cerebrospinal fluid, it is sensitive to edema and atrophy (Engström et al., 2014). With increasing age, the water content of brain tissue increases and brain atrophy occurs, so the PD values of the centrum semiovale is positively correlated with age.
Jackson et al. (1993) reported that the changes in brain tissues in different regions were the same, and there was a relative dividing line at approximately 60 years of age. Before 60 years of age, T1, T2, and PD values were stable or slightly decreased but increased after 60 years of age; this outcome may be due to changes in water, myelin sheath and iron content. In this study, we proposed to construct a model to predict the brain age of individuals < 60 years old and ≥ 60 years old. The seven prediction models we constructed have high prediction efficiency, and compared with the prediction of a single relaxation value, we found that the prediction model constructed by combining T1, T2, and PD values was the most effective. This model may be the most effective because the combination of multiple values may make the prediction information richer, thus improving the prediction accuracy and efficiency of the model. This model may be a suitable biological marker for predicting brain aging, which can aid in the early clinical diagnosis and early prevention of neurodegenerative diseases such as Alzheimer’s disease. Brain aging can lead to large differences in human lifespan, leading to age-related degenerative diseases. The potential biological age of an individual may be different from his or her actual age, and this difference can better predict the risk of age-related health problems in the future (Cole and Franke, 2017). Our model uses relaxation values alone or in combination to predict whether the brain age matches the actual age. Individuals who deviate from the brain’s aging trajectory may have unknown problems even if they are physically healthy, especially an increased risk of cognitive aging or age-related neurological diseases. Therefore, using our prediction model, we can observe the aging degree of the brain without mental and neurological abnormalities and prevent diseases in advance. Of note, the search for biomarkers of brain aging may have important neuroscience and clinical application value (Storsve et al., 2014). The brain tissue value measured by syMRI technology is characterized by objectivity, stability, good repeatability, and ease of measurement and calculation.
In this study, when exploring the relationship between brain tissue relaxation values and age, we also found that there may be differences in brain tissue relaxation values between different sexes. We found that there were differences in relaxation values between men and women in distinct brain areas, and sex differences in brain development were observed. It is not clear whether these sex differences are related to behavior. At present, studies have shown that men exhibit greater differences in brain structure than women during aging (Ritchie et al., 2018; Wierenga et al., 2018). Because there are differences in brain tissue relaxation values among different age groups, we limited the comparison between different sexes to the same age group in our study. It was found that there were differences in T1, T2, and PD values between males and females in different brain regions, and it was found that the relaxation values of most males were slightly higher than those of females. The differences between the sexes may be related to the differences in brain development between sexes. For example, in a study on the effect of sex on the development of brain executive function, it was found that girls performed significantly better than boys in reading comprehension, and boys performed better than girls in thinking during counter working memory tasks (Wierenga et al., 2019). The prevalence rates of several mental and degenerative diseases vary between sexes. For example, the incidence of Alzheimer’s disease in women is higher than that in men, prompting recent calls for biomedical research to give priority to sex differences in measures related to the disease (Mazure and Swendsen, 2016). Women also have higher rates of depression (Gennatas et al., 2017), while men have higher rates of autism spectrum disorders (Baron-Cohen et al., 2011), schizophrenia (Aleman et al., 2003) and dyslexia (Arnett et al., 2017).
SyMRI technology produces T1, T2 and PD quantitative relaxation maps simultaneously to study brain aging objectively, stably and repeatedly. Moreover, SyMRI data are easy to measure and calculate. Instead of using the cognitive score scale, which is easily affected by the subjective state of the subjects, this technique is more advantageous for exploring the biological markers of brain aging. In addition, this technique can not only be directly used for tissue quantitative analysis but can also be used for data postprocessing, such as brain tissue segmentation, brain volume quantification and myelin volume measurement (Andica et al., 2019). SyMRI can be used to quantitatively evaluate the characteristics of tissue relaxation (West et al., 2012), and this technique has been used as an objective tool to evaluate the brain development of children (Lee et al., 2018). In addition, this technique can not only be directly used for tissue quantitative analysis but can also be used for data postprocessing, such as brain tissue segmentation, brain volume quantification and myelin volume measurement (West et al., 2013; Warntjes et al., 2014).
As a new MRI technique, syMRI can provide information about the changes in relaxation values in brain tissue. Our study provides specific reference ranges of T1, T2 and PD values in different brain regions from adults to elderly adults; these ranges can be used as an objective tool to evaluate brain aging. In addition, the brain age model based on syMRI is helpful in determining the degree of brain aging, which will be a useful tool to predict brain age. Different races and groups may have differences in brain structure and organization. Our study is conducted only in the Asian population, so our findings may only apply to the Asian population. Furthermore, we found that the tissue values of brain regions are different between different sexes, which provides a new way to associate sex differences in the human brain with behavior and mental illness in the future.
Our research has several limitations. First of all, the reference organizational values provided in this study are derived from cross-sectional data, so differences between individuals may lead to deviations in the aging process. Although the overall observations in our study are quite reliable, further longitudinal studies may be needed to confirm our findings. Secondly, the sample size of this study is relatively small, and further research is needed in a wider population to promote the clinical application of quantitative imaging using synthetic sequences. In addition, for different races and different populations, the structure and organization of the human brain will be different, our study population is only Asian people, so the results of this study may only be applicable to Asian people. Fourth, our exclusion criteria are flawed and lack of investigation of subjects’ clinical data (such as nutrition, activity, or other drugs). Finally, this study included healthy normal people who were not assessed by the Professional Mental State scale and other mental scales, and only through oral questioning of the subjects and their families without serious mental illness, learning disability and cognitive impairment in the past.
The original contributions presented in this study are included in the article/Supplementary material, further inquiries can be directed to the corresponding authors.
The studies involving human participants were reviewed and approved by the Ethics Committee of Yunnan Cancer Hospital. The patients/participants provided their written informed consent to participate in this study.
SB contributed to the data analysis and article writing. CL and TK contributed to the research design. NX and AD contributed to the volunteer collection and scanning. YYL contributed to the measurement. ZO contributed to the data statistics and analysis. XG contributed to the picture and tables making. YFL contributed to the design of MRI scanning parameters. JY contributed to the research design and review of articles. All authors contributed to the article and approved the submitted version.
This study was supported by the National Natural Science Foundation of China (Grant nos. 82160340 and 82060313), the Yunnan Provincial High-level Talent Health training Project (Grant no. D-2018009), the Outstanding Youth Science Foundation of Yunnan Basic Research Project (Grant no. 202201AW070002), and the Yunnan Department of Science and Technology-Kunming Medical University Joint Project (Grant no. 202001AY070001-072).
The authors declare that the research was conducted in the absence of any commercial or financial relationships that could be construed as a potential conflict of interest.
All claims expressed in this article are solely those of the authors and do not necessarily represent those of their affiliated organizations, or those of the publisher, the editors and the reviewers. Any product that may be evaluated in this article, or claim that may be made by its manufacturer, is not guaranteed or endorsed by the publisher.
The Supplementary Material for this article can be found online at: https://www.frontiersin.org/articles/10.3389/fnagi.2022.963668/full#supplementary-material
Aleman, A., Kahn, R. S., and Selten, J. P. (2003). Sex differences in the risk of schizophrenia: evidence from meta-analysis. Arch. Gen. Psychiatry 60, 565–571.
Andica, C., Hagiwara, A., Hori, M., Kamagata, K., Koshino, S., Maekawa, T., et al. (2019). Review of synthetic MRI in pediatric brains: Basic principle of MR quantification, its features, clinical applications, and limitations. J. Neuroradiol. 46, 268–275. doi: 10.1016/j.neurad.2019.02.005
Arnett, A. B., Pennington, B. F., Peterson, R. L., Willcutt, E. G., DeFries, J. C., and Olson, R. K. (2017). Explaining the sex difference in dyslexia. J. Child. Psychol. Psychiatry 58, 719–727. doi: 10.1111/jcpp.12691
Barkovich, A. J., Kjos, B. O., Jackson, D. E. Jr., and Norman, D. (1988). Normal maturation of the neonatal and infant brain: MR imaging at 1.5 T. Radiology 166(1 Pt 1), 173–180. doi: 10.1148/radiology.166.1.3336675
Baron-Cohen, S., Lombardo, M. V., Auyeung, B., Ashwin, E., Chakrabarti, B., and Knickmeyer, R. (2011). Why are autism spectrum conditions more prevalent in males? PLoS Biol. 9:e1001081. doi: 10.1371/journal.pbio.1001081
Bartzokis, G., Lu, P. H., Tingus, K., Mendez, M. F., Richard, A., Peters, D. G., et al. (2010). Lifespan trajectory of myelin integrity and maximum motor speed. Neurobiol. Aging 31, 1554–1562. doi: 10.1016/j.neurobiolaging.2008.08.015
Bashyam, V. M., Erus, G., Doshi, J., Habes, M., Nasrallah, I., Truelove-Hill, M., et al. (2020). MRI signatures of brain age and disease over the lifespan based on a deep brain network and 14 468 individuals worldwide. Brain 143, 2312–2324.
Cole, J. H., and Franke, K. (2017). Predicting age using neuroimaging: Innovative brain ageing biomarkers. Trends Neurosci. 40, 681–690. doi: 10.1016/j.tins.2017.10.001
Davis, P. C., Mirra, S. S., and Alazraki, N. (1994). The brain in older persons with and without dementia: Findings on MR, PET, and SPECT images. AJR Am. J. Roentgenol. 162, 1267–1278. doi: 10.2214/ajr.162.6.8191980
Deoni, S. C., Dean, D. C. III, O’Muircheartaigh, J., Dirks, H., and Jerskey, B. A. (2012). Investigating white matter development in infancy and early childhood using myelin water faction and relaxation time mapping. Neuroimage 63, 1038–1053. doi: 10.1016/j.neuroimage.2012.07.037
Engström, M., Warntjes, J. B., Tisell, A., Landtblom, A. M., and Lundberg, P. (2014). Multi-parametric representation of voxel-based quantitative magnetic resonance imaging. PLoS One 9:e111688. doi: 10.1371/journal.pone.0111688
Faizy, T. D., Kumar, D., Broocks, G., Thaler, C., Flottmann, F., Leischner, H., et al. (2018). Age-related measurements of the myelin water fraction derived from 3D multi-echo GRASE reflect myelin content of the cerebral white matter. Sci. Rep. 8:14991. doi: 10.1038/s41598-018-33112-8
Gennatas, E. D., Avants, B. B., Wolf, D. H., Satterthwaite, T. D., Ruparel, K., Ciric, R., et al. (2017). Age-related effects and sex differences in gray matter density, volume, mass, and cortical thickness from childhood to young adulthood. J. Neurosci. 37, 5065–5073. doi: 10.1523/jneurosci.3550-16.2017
Geronimus, A. T. (2013). Deep integration: Letting the epigenome out of the bottle without losing sight of the structural origins of population health. Am. J. Public Health 103, (Suppl. 1), S56–S63. doi: 10.2105/ajph.2013.301380
Glasser, M. F., and Van Essen, D. C. (2011). Mapping human cortical areas in vivo based on myelin content as revealed by T1- and T2-weighted MRI. J. Neurosci. 31, 11597–11616. doi: 10.1523/jneurosci.2180-11.2011
Gracien, R. M., Reitz, S. C., Hof, S. M., Fleischer, V., Zimmermann, H., Droby, A., et al. (2016). Assessment of cortical damage in early multiple sclerosis with quantitative T2 relaxometry. NMR Biomed. 29, 444–450. doi: 10.1002/nbm.3486
Hagiwara, A., Warntjes, M., Hori, M., Andica, C., Nakazawa, M., Kumamaru, K. K., et al. (2017). SyMRI of the brain: Rapid quantification of relaxation rates and proton density, with synthetic MRI, automatic brain segmentation, and myelin measurement. Invest. Radiol. 52, 647–657. doi: 10.1097/rli.0000000000000365
Hazlett, H. C., Gu, H., Munsell, B. C., Kim, S. H., Styner, M., Wolff, J. J., et al. (2017). Early brain development in infants at high risk for autism spectrum disorder. Nature 542, 348–351. doi: 10.1038/nature21369
Jackson, G. D., Connelly, A., Duncan, J. S., Grünewald, R. A., and Gadian, D. G. (1993). Detection of hippocampal pathology in intractable partial epilepsy: Increased sensitivity with quantitative magnetic resonance T2 relaxometry. Neurology 43, 1793–1799. doi: 10.1212/wnl.43.9.1793
Kreis, R., Ernst, T., and Ross, B. D. (1993). Development of the human brain: In vivo quantification of metabolite and water content with proton magnetic resonance spectroscopy. Magn. Reson. Med. 30, 424–437. doi: 10.1002/mrm.1910300405
Kułak, P., Maciorkowska, E., and Gościk, E. (2016). Volumetric magnetic resonance imaging study of brain and cerebellum in children with cerebral palsy. Biomed. Res. Int. 2016:5961928. doi: 10.1155/2016/5961928
Lebel, C., and Deoni, S. (2018). The development of brain white matter microstructure. Neuroimage 182, 207–218. doi: 10.1016/j.neuroimage.2017.12.097
Lee, S. M., Choi, Y. H., You, S. K., Lee, W. K., Kim, W. H., Kim, H. J., et al. (2018). Age-related changes in tissue value properties in children: Simultaneous quantification of relaxation times and proton density using synthetic magnetic resonance imaging. Invest. Radiol. 53, 236–245. doi: 10.1097/rli.0000000000000435
MacKay, A., Laule, C., Vavasour, I., Bjarnason, T., Kolind, S., and Mädler, B. (2006). Insights into brain microstructure from the T2 distribution. Magn. Reson. Imaging 24, 515–525. doi: 10.1016/j.mri.2005.12.037
MacKay, A., Whittall, K., Adler, J., Li, D., Paty, D., and Graeb, D. (1994). In vivo visualization of myelin water in brain by magnetic resonance. Magn. Reson. Med. 31, 673–677. doi: 10.1002/mrm.1910310614
Matsumae, M., Kurita, D., Atsumi, H., Haida, M., Sato, O., and Tsugane, R. (2001). Sequential changes in MR water proton relaxation time detect the process of rat brain myelination during maturation. Mech. Ageing Dev. 122, 1281–1291. doi: 10.1016/s0047-6374(01)00265-2
Mazure, C. M., and Swendsen, J. (2016). Sex differences in Alzheimer’s disease and other dementias. Lancet Neurol. 15, 451–452. doi: 10.1016/s1474-4422(16)00067-3
McAllister, A., Leach, J., West, H., Jones, B., Zhang, B., and Serai, S. (2017). Quantitative synthetic MRI in children: Normative intracranial tissue segmentation values during development. AJNR Am. J. Neuroradiol. 38, 2364–2372. doi: 10.3174/ajnr.A5398
Paus, T., Collins, D. L., Evans, A. C., Leonard, G., Pike, B., and Zijdenbos, A. (2001). Maturation of white matter in the human brain: A review of magnetic resonance studies. Brain Res. Bull. 54, 255–266. doi: 10.1016/s0361-9230(00)00434-2
Peters, A., and Kemper, T. (2012). A review of the structural alterations in the cerebral hemispheres of the aging rhesus monkey. Neurobiol. Aging 33, 2357–2372. doi: 10.1016/j.neurobiolaging.2011.11.015
Ritchie, S. J., Cox, S. R., Shen, X., Lombardo, M. V., Reus, L. M., Alloza, C., et al. (2018). Sex differences in the adult human brain: Evidence from 5216 UK biobank participants. Cereb. Cortex 28, 2959–2975. doi: 10.1093/cercor/bhy109
Ronan, L., Alexander-Bloch, A. F., Wagstyl, K., Farooqi, S., Brayne, C., Tyler, L. K., et al. (2016). Obesity associated with increased brain age from midlife. Neurobiol. Aging 47, 63–70. doi: 10.1016/j.neurobiolaging.2016.07.010
Schenker, C., Meier, D., Wichmann, W., Boesiger, P., and Valavanis, A. (1993). Age distribution and iron dependency of the T2 relaxation time in the globus pallidus and putamen. Neuroradiology 35, 119–124. doi: 10.1007/bf00593967
Seiler, S., Ropele, S., and Schmidt, R. (2014). Magnetization transfer imaging for in vivo detection of microstructural tissue changes in aging and dementia: A short literature review. J. Alzheimers Dis. 42, (Suppl. 3), S229–S237. doi: 10.3233/jad-132750
Storsve, A. B., Fjell, A. M., Tamnes, C. K., Westlye, L. T., Overbye, K., Aasland, H. W., et al. (2014). Differential longitudinal changes in cortical thickness, surface area and volume across the adult life span: Regions of accelerating and decelerating change. J. Neurosci. 34, 8488–8498. doi: 10.1523/jneurosci.0391-14.2014
Vågberg, M., Lindqvist, T., Ambarki, K., Warntjes, J. B., Sundström, P., Birgander, R., et al. (2013). Automated determination of brain parenchymal fraction in multiple sclerosis. AJNR Am. J. Neuroradiol. 34, 498–504. doi: 10.3174/ajnr.A3262
Valizadeh, S. A., Liem, F., Mérillat, S., Hänggi, J., and Jäncke, L. (2018). Identification of individual subjects on the basis of their brain anatomical features. Sci. Rep. 8:5611. doi: 10.1038/s41598-018-23696-6
Vos, T., Flaxman, A. D., Naghavi, M., Lozano, R., Michaud, C., Ezzati, M., et al. (2012). Years lived with disability (YLDs) for 1160 sequelae of 289 diseases and injuries 1990-2010: A systematic analysis for the Global Burden of Disease Study 2010. Lancet 380, 2163–2196. doi: 10.1016/s0140-6736(12)61729-2
Warntjes, J. B., Leinhard, O. D., West, J., and Lundberg, P. (2008). Rapid magnetic resonance quantification on the brain: Optimization for clinical usage. Magn. Reson. Med. 60, 320–329. doi: 10.1002/mrm.21635
Warntjes, J. B., Tisell, A., Landtblom, A. M., and Lundberg, P. (2014). Effects of gadolinium contrast agent administration on automatic brain tissue classification of patients with multiple sclerosis. AJNR Am. J. Neuroradiol. 35, 1330–1336. doi: 10.3174/ajnr.A3890
Weiskopf, N., Suckling, J., Williams, G., Correia, M. M., Inkster, B., Tait, R., et al. (2013). Quantitative multi-parameter mapping of R1, PD(*), MT, and R2(*) at 3T: A multi-center validation. Front. Neurosci. 7:95. doi: 10.3389/fnins.2013.00095
West, J., Blystad, I., Engström, M., Warntjes, J. B., and Lundberg, P. (2013). Application of quantitative MRI for brain tissue segmentation at 1.5 T and 3.0 T field strengths. PLoS One 8:e74795. doi: 10.1371/journal.pone.0074795
West, J., Warntjes, J. B., and Lundberg, P. (2012). Novel whole brain segmentation and volume estimation using quantitative MRI. Eur. Radiol. 22, 998–1007. doi: 10.1007/s00330-011-2336-7
Wierenga, L. M., Bos, M. G. N., van Rossenberg, F., and Crone, E. A. (2019). Sex effects on development of brain structure and executive functions: Greater variance than mean effects. J. Cogn. Neurosci. 31, 730–753. doi: 10.1162/jocn_a_01375
Wierenga, L. M., Sexton, J. A., Laake, P., Giedd, J. N., and Tamnes, C. K. (2018). A key characteristic of sex differences in the developing brain: Greater variability in brain structure of boys than girls. Cereb. Cortex 28, 2741–2751. doi: 10.1093/cercor/bhx154
Yoshiura, T., Higano, S., Rubio, A., Shrier, D. A., Kwok, W. E., Iwanaga, S., et al. (2000). Heschl and superior temporal gyri: Low signal intensity of the cortex on T2-weighted MR images of the normal brain. Radiology 214, 217–221. doi: 10.1148/radiology.214.1.r00ja17217
Keywords: brain age prediction, synthetic MRI, relaxation value, brain aging, brain regions
Citation: Bao S, Liao C, Xu N, Deng A, Luo Y, Ouyang Z, Guo X, Liu Y, Ke T and Yang J (2022) Prediction of brain age using quantitative parameters of synthetic magnetic resonance imaging. Front. Aging Neurosci. 14:963668. doi: 10.3389/fnagi.2022.963668
Received: 07 June 2022; Accepted: 20 October 2022;
Published: 15 November 2022.
Edited by:
Hans J. Grabe, University of Greifswald, GermanyReviewed by:
Robert I. Reid, Mayo Clinic, United StatesCopyright © 2022 Bao, Liao, Xu, Deng, Luo, Ouyang, Guo, Liu, Ke and Yang. This is an open-access article distributed under the terms of the Creative Commons Attribution License (CC BY). The use, distribution or reproduction in other forums is permitted, provided the original author(s) and the copyright owner(s) are credited and that the original publication in this journal is cited, in accordance with accepted academic practice. No use, distribution or reproduction is permitted which does not comply with these terms.
*Correspondence: Tengfei Ke, MjUwMTY5OTk1QHFxLmNvbQ==; Jun Yang, aW1keWFuZ0BxcS5jb20=
†These authors have contributed equally to this work
Disclaimer: All claims expressed in this article are solely those of the authors and do not necessarily represent those of their affiliated organizations, or those of the publisher, the editors and the reviewers. Any product that may be evaluated in this article or claim that may be made by its manufacturer is not guaranteed or endorsed by the publisher.
Research integrity at Frontiers
Learn more about the work of our research integrity team to safeguard the quality of each article we publish.