- 1Laboratory of Bioinformatics and Drug Design, Institute of Biochemistry and Biophysics, University of Tehran, Tehran, Iran
- 2Department of Computer and Data Sciences, Faculty of Mathematical Sciences, Shahid-Beheshti University, Tehran, Iran
- 3School of Biological Sciences, Institute for Research in Fundamental Sciences (IPM), Tehran, Iran
- 4Department of Stem Cells and Developmental Biology, Cell Science Research Center, Royan Institute for Stem Cell Biology and Technology (RI-SCBT), Tehran, Iran
- 5Department of Cell and Molecular Biology, School of Biology, College of Science, University of Tehran, Tehran, Iran
Background: Recent research has investigated the connection between Diabetes Mellitus (DM) and Alzheimer’s Disease (AD). Insulin resistance plays a crucial role in this interaction. Studies have focused on dysregulated proteins to disrupt this connection. Non-coding RNAs (ncRNAs), on the other hand, play an important role in the development of many diseases. They encode the majority of the human genome and regulate gene expression through a variety of mechanisms. Consequently, identifying significant ncRNAs and utilizing them as biomarkers could facilitate the early detection of this cross-talk. On the other hand, computational-based methods may help to understand the possible relationships between different molecules and conduct future wet laboratory experiments.
Materials and methods: In this study, we retrieved Genome-Wide Association Study (GWAS, 2008) results from the United Kingdom Biobank database using the keywords “Alzheimer’s” and “Diabetes Mellitus.” After excluding low confidence variants, statistical analysis was performed, and adjusted p-values were determined. Using the Linkage Disequilibrium method, 127 significant shared Single Nucleotide Polymorphism (SNP) were chosen and the SNP-SNP interaction network was built. From this network, dense subgraphs were extracted as signatures. By mapping each signature to the reference genome, genes associated with the selected SNPs were retrieved. Then, protein-microRNA (miRNA) and miRNA-long non-coding RNA (lncRNA) bipartite networks were built and significant ncRNAs were extracted. After the validation process, by applying the scoring function, the final protein-miRNA-lncRNA tripartite network was constructed, and significant miRNAs and lncRNAs were identified.
Results: Hsa-miR-199a-5p, hsa-miR-199b-5p, hsa-miR-423-5p, and hsa-miR-3184-5p, the four most significant miRNAs, as well as NEAT1, XIST, and KCNQ1OT1, the three most important lncRNAs, and their interacting proteins in the final tripartite network, have been proposed as new candidate biomarkers in the cross-talk between DM and AD. The literature review also validates the obtained ncRNAs. In addition, miRNA/lncRNA pairs; hsa-miR-124-3p/KCNQ1OT1, hsa-miR-124-3p/NEAT1, and hsa-miR-124-3p/XIST, all expressed in the brain, and their interacting proteins in our final network are suggested for future research investigation.
Conclusion: This study identified 127 shared SNPs, 7 proteins, 15 miRNAs, and 11 lncRNAs involved in the cross-talk between DM and AD. Different network analysis and scoring function suggested the most significant miRNAs and lncRNAs as potential candidate biomarkers for wet laboratory experiments. Considering these candidate biomarkers may help in the early detection of DM and AD co-occurrence.
Introduction
Diabetes Mellitus (DM) and Alzheimer’s Disease (AD) are two of the most prevalent diseases in the elderly population of the world. DM cases are increasing exponentially, and by 2035 there will likely be 592 million cases. Moreover, the incidence of DM-induced AD in the human population has increased rapidly over the past decade. DM not only increases the risk of AD, but also doubles or triples the development rate of it. Given the apparent relationship between these two diseases, it has been suggested that AD is actually a neuroendocrine disorder and not just a neurologic one. Similar to insulin resistance in the brain, AD brains have decreased glucose uptake from the environment. Patients with DM and AD have amyloid beta deposits in the pancreas and brain. In addition, certain DM target receptors are involved in the regulation of tau expression and phosphorylation, a significant target protein in AD. This phenomenon is referred to as the cross-talk between DM and AD (Kandimalla et al., 2017).
Diabetes Mellitus and its complications are primarily caused by insulin resistance and impaired insulin signaling. Insulin encourages cells to absorb glucose. It is also required for normal cognitive function of hippocampus. Several studies have found that brain insulin resistance is a key factor in the link between DM and AD (Baglietto-Vargas et al., 2016; Spinelli et al., 2019; McNay and Pearson-Leary, 2020). There are additional cellular and molecular reasons besides impaired insulin signaling. The majority of the main evidence includes oxidative-stress, inflammation, obesity, dysregulation of Apolipoprotein E (APOE), insulin degradation enzyme (IDE), Glucose Transporter type 4 (GLUT4), and Acetylcholinesterase (AChE), are linked to insulin resistance (Mittal and Katare, 2016).
Mittal et al. (2016) derived differentially expressed proteins of Type 2 Diabetes Mellitus (T2DM) and AD individually 70 proteins in total and retrieved the first neighbor of each protein in protein-protein interaction (PPI) network (957 proteins). Using pathway analysis and interactions between these proteins, the most relevant proteins for both T2DM and AD were identified (Mittal et al., 2016). Karki et al. (2017) used Biological Expression Language (BEL) to identify six significant shared pathways between T2DM and AD at both the molecular and clinical levels. They also discovered that some drugs used to treat T2DM might increase the risk of AD (Karki et al., 2017). Another research (Shakil, 2017) demonstrated that antidiabetic drugs can be used to treat Alzheimer’s disease. Based on this hypothesis, molecular docking was used to study two antidiabetic drugs, ertugliflozin and sotagliflozin, and their targets, sodium glucose cotransporter 2 and AChE, respectively. Finally, sotagliflozin structure was proposed for designing drugs that may treat DM and AD simultaneously. Hu et al. (2020) retrieved data from the ROSMAP Project for T2DM and AD, analyzed multi-omic data using an inference method and identified common pathways between these two diseases.
Furthermore, variations in the human genome may increase the risk of chronic diseases like DM and AD. As a result, Genome-Wide Association Study (GWAS) projects were conducted to identify new loci linked to both diseases. Hao et al. (2015) investigated shared genetic risk factors in the association between T2DM and AD using a systems biology approach. They discovered genes involved in both diseases using GWAS analysis. By combining gene ontologies, co-expression networks, and regulatory elements, they discovered shared Single Nucleotide Polymorphisms (SNPs) and their associated genes as novel targets for further investigation. In order to identify the most important pathways in the cross-talk between T2DM and AD, they finally used pathway enrichment analysis.
Despite the importance of protein dysregulation in the development of many diseases, recent research has revealed that non-coding RNAs (ncRNAs) also play a significant role in the progression of complex diseases (Li and Kowdley, 2012; Natarajan et al., 2013; DiStefano, 2018; Lekka and Hall, 2018). Furthermore, the majority of the human genome encodes ncRNAs, with only a small percentage converting to proteins. Therefore, researchers believe that ncRNAs have a significant impact on neurodegeneration processes that lead to AD (Idda et al., 2018) and metabolic disorders that lead to DM (Alvarez and Distefano, 2013). Approximately 70% of experimentally detected microRNAs (miRNAs) are expressed in the brain and are involved in memory and synapses formation (Silvestro et al., 2019). Additionally, they regulate the function of insulin and, consequently, their dysregulation has been linked to the progression of DM (Nigi et al., 2018). On the other hand, long non-coding RNAs (lncRNAs), also have been linked to insulin resistance, inflammation, and DM (Sathishkumar et al., 2018), as well as the progression of AD (Luo and Chen, 2016).
Despite producing some promising and valuable insights, less attention has been paid to the impact of ncRNAs on the cross-talk between DM and AD to date. Therefore, this research is motivated by the fact that, while dysregulated proteins play an important role in the progression of many diseases, ncRNAs also have a strong impact on complex diseases. Consequently, using GWAS results and statistical and network analysis, we proposed candidate miRNAs and lncRNAs as potential biomarkers for early detection of the co-occurrence of DM and AD. The following covers data collection, networks analysis, validations, and scoring function in the section “Materials and methods.” Significant ncRNAs in the final tripartite network were introduced in the section “Result.” We believe that the paths in this network from lncRNAs to proteins (which pass through miRNAs) recommend potential candidate biomarkers that may also be drug targets in the cross-talk between DM and AD. We will discuss them in detail in the section “Discussion.”
Materials and methods
Data set
We retrieved GWAS results using keywords “Alzheimer’s” and “Diabetes” from Neale Lab1, which performed GWAS analysis from the United Kingdom Biobank database (Bycroft et al., 2018). For DM and AD 35 and 11 files were downloaded in both sexes, respectively. GWAS results in each file included genotyped and imputed data on 13,791,467 SNPs from more than 300,000 volunteers in both diseases. The beta coefficient, p-value, minor allele frequency, and standard error were all included in each dataset. To find protein-miRNA and miRNA-lncRNA interactions, we used the Starbase (2010) database (Li et al., 2014).
Mapping single nucleotide polymorphisms to proteins
Initially, significant SNPs from each disease should be chosen. We employed two statistical parameters: Minor Allele Frequency (MAF) and adj.p-value. MAF is a standard used to determine the frequency of the second most common allele for a particular SNP. Due to the fact that variants with low confidence (MAF < 0.001) did not meet the MAF threshold, they were removed from the DM and AD datasets. The adj.p-value for the remaining SNPs was calculated using the FDR method in R. Significant SNPs were determined to have adj.p-value < 0.05. Following data cleaning, significant SNPs revealed by both diseases were selected.
LD is a commonly used method for calculating SNP correlation. It was employed to identify interactions between SNPs. It is only applicable to SNPs located on the same chromosome. It generates two disequilibrium values; D’ and R2, describing how frequently alleles are inherited together. LD performed a chi-squared test for each pair of SNPs and calculates D’ (Si, Sj) and R2 (Si, Sj) and reports the p-value (Si, Sj) (Slatkin, 2008). We calculated LD using the NIH API in R (National Cancer Institute2). Then, we created the graph Gs which its nodes represent the significant SNPs that were identified in the preceding step. We considered an edge between two SNPs if D’ (Si, Sj) >0.7 and p-value (Si, Sj) < 0.0001. This graph contains of four connected components. Two components correspond to SNPs on chromosome 19, and the other two components correspond to SNPs on chromosome 6. For each component, we looked for dense subgraphs that contained at least 20% of the nodes in that component. Then, the nodes of each dense subgraph are regarded as a collection of SNP’s signatures.
To identify genes (proteins and ncRNAs) associated with the signatures, we utilized the UCSC Genome Browser3 and retrieved information about the genes and their biological consequences. SNPnexus4 was then used to annotate the achieved genes and their corresponding proteins. Next, the Disgenet database (2014), a database for disease gene associations, was used to determine if these proteins are linked to both DM and AD.
Protein-miRNA and miRNA-long non-coding RNA networks
Assume that p1, p2, …, pn are proteins achieved from the previous step and m1, m2, …, ml are miRNAs, obtained from the starbase database, that interacts with at least one of these proteins. The protein-miRNA bipartite network was subsequently created. The nodes of one part are the set P = {p1, p2, …, pn} and the other part are the set M = {m1, m2, …, ml}. If miRNA mj regulates protein pi, there is an edge between pi and mj. The top 10 miRNAs with the highest degree in the corresponding network were selected as significant, formally denoted by M’ = {m’1, m’2, m’3,., m’s}. Next, suppose that l1, l2, …, lr are lncRNAs, retrieved from the starbase database, that interact with at least one of the miRNAs m’i. Similarly, the miRNA-lncRNA bipartite network was constructed. The nodes of one part is the set M’ and the other part is the set L = {l1, l2, …, lr}. There is an edge between m’i and lj if lncRNA lj regulates miRNA m’i. In the constructed network, similarly to previous network, the top 10 lncRNAs with the highest degree were chosen as significant, formally denoted by L ‘ = {l’1, l’2, l’3,., l’t}.
Protein-miRNA-long non-coding RNA tripartite network
After passing validation, the final protein-miRNA-lncRNA tripartite network was constructed. The first layer of this network is represented by the set P, the second by the set M’, and the third by the set L’. Similar to the previous bipartite networks, if miRNA m’j regulates protein pi, there is an edge between pi and m’j. In addition, there is an edge between m’i and l’j if lncRNA l’j regulates the miRNA m’i. To validate the edges of this network we considered the following well-known databases. We used TargetScan (2005), miRwalk (2011), microT (2012), and miRmap (2012) databases to validate protein-miRNA interactions and LncBase (2012) database to validate miRNA-lncRNA interactions. If an edge was reported in at least one of the aforementioned databases, the interaction was kept in the final network; otherwise, it was removed.
Scoring function
By assigning a score to ncRNAs, the significance of the nodes in the tripartite network was determined. Assume that NP is the total number of proteins in the final tripartite network and denotes the set of proteins regulated by miRNA . The scoring function was calculated as follows:
Where denote the set of miRNAs which regulated by lncRNA .
In fact, to calculate , all the miRNAs in the tripartite network, regulated by lncRNA were retrieved and the sum of the scores of the corresponding miRNAs was assigned as the score of the intended lncRNA.
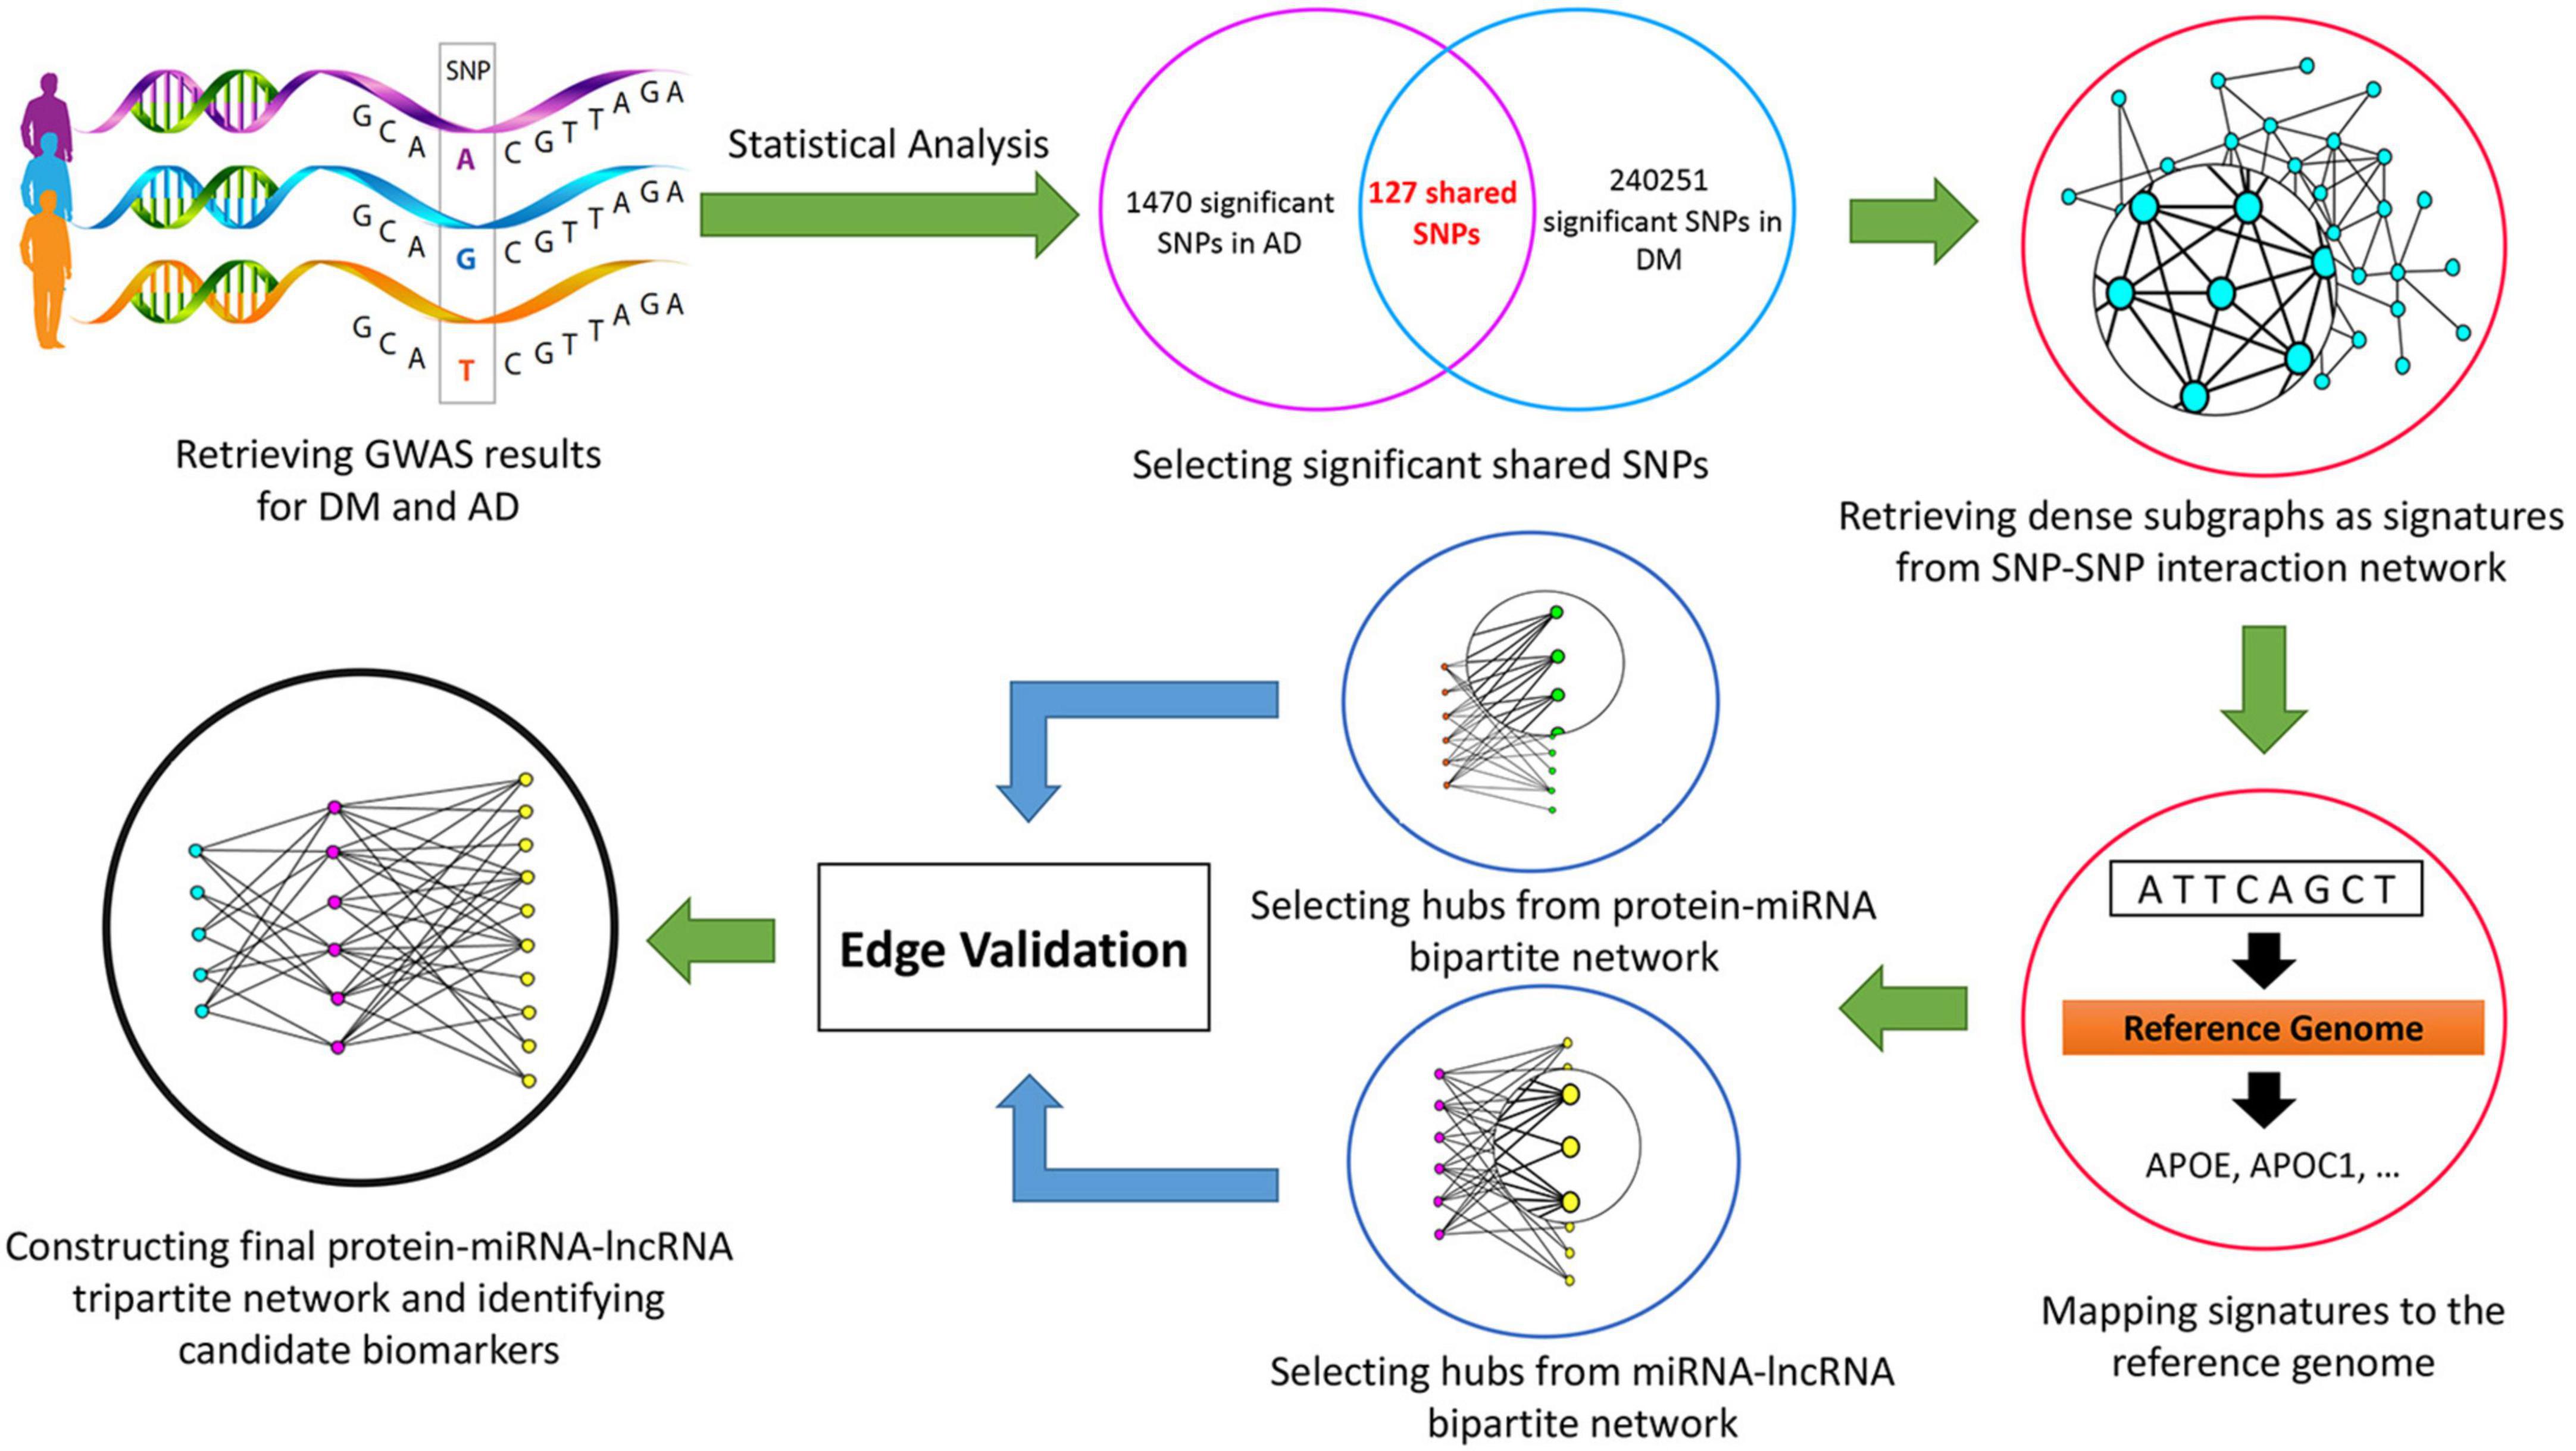
The research workflow is depicted in Figure 1.
Results
Networks analysis
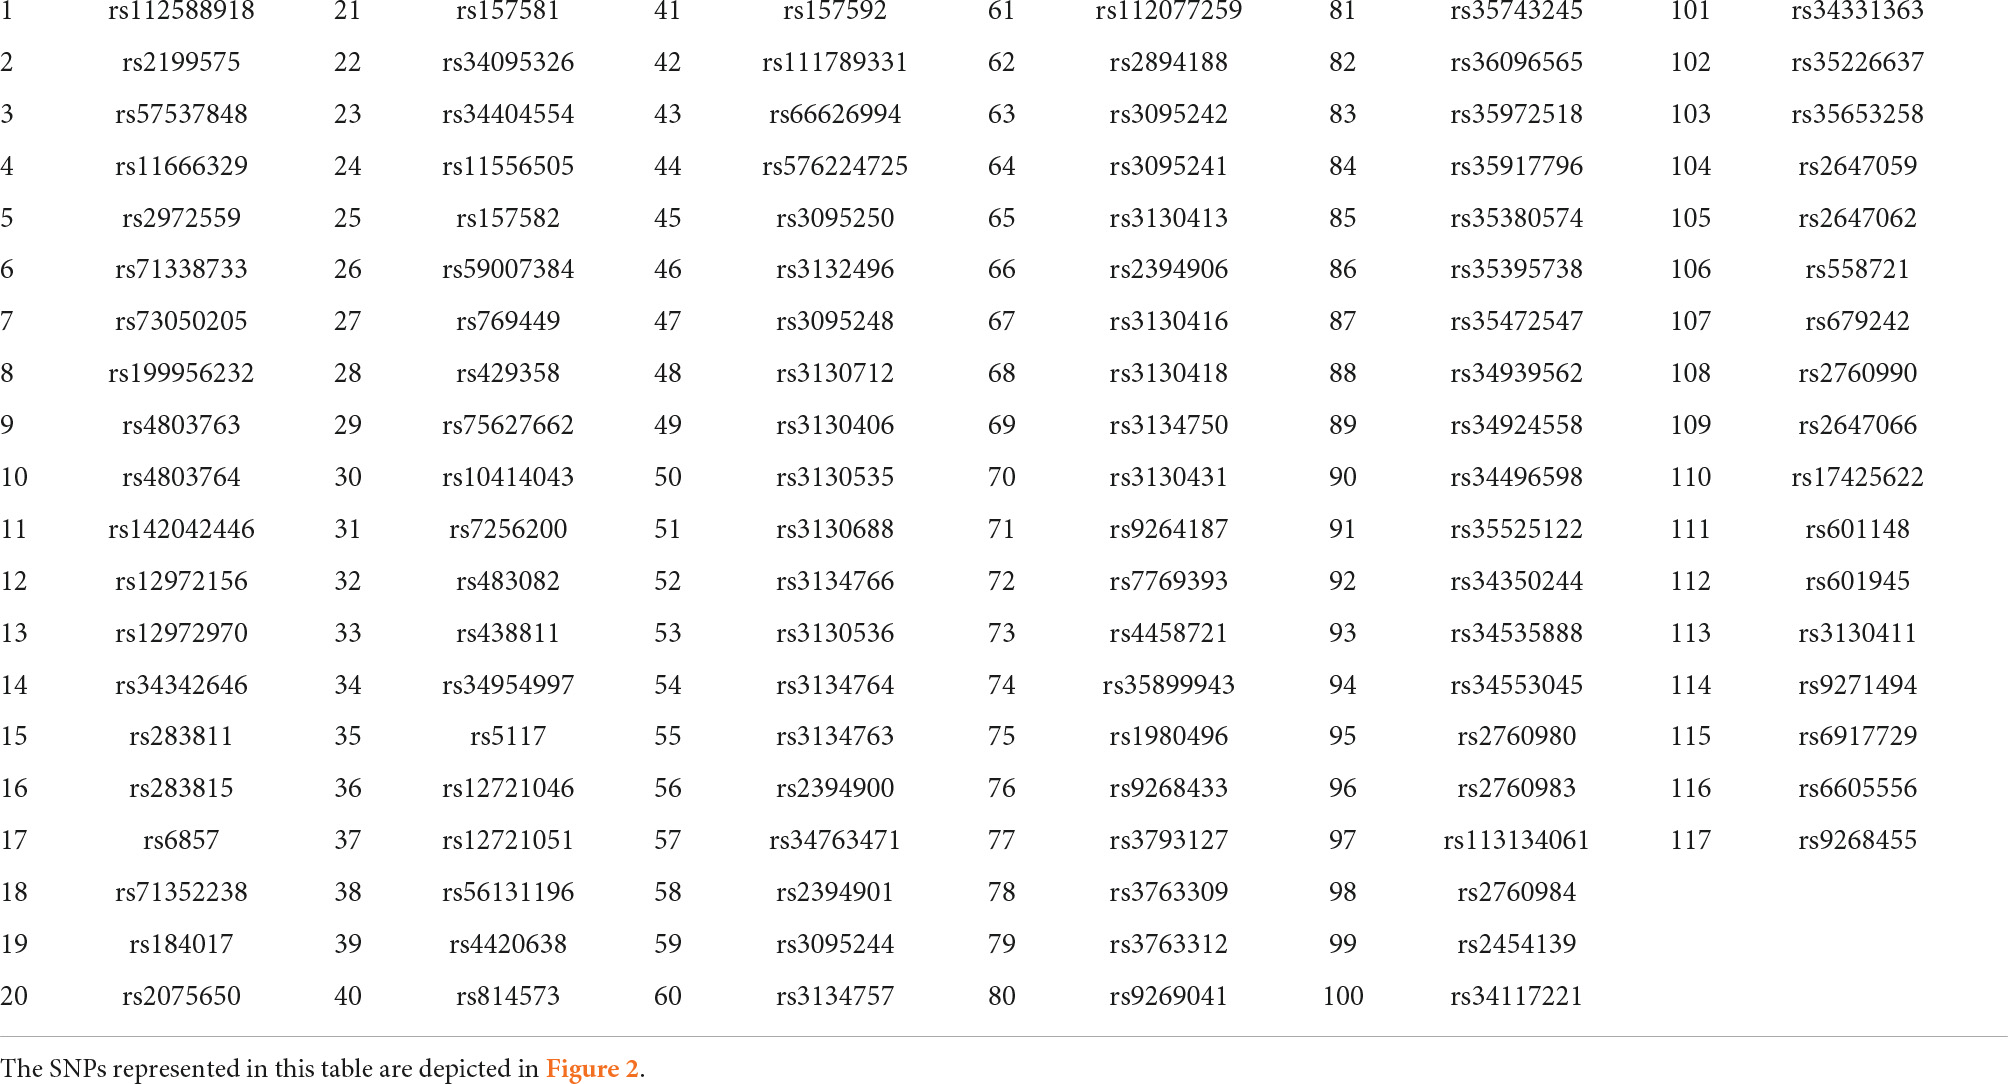
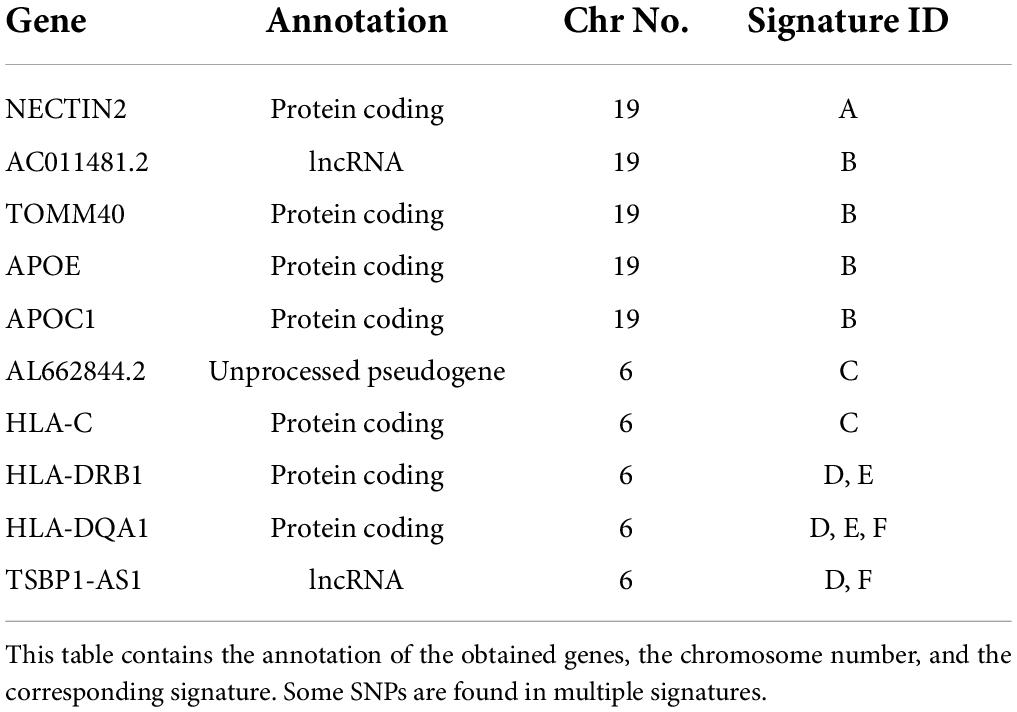
There were 127 common SNPs among the 1470 and 240251 significant SNPs identified by analyzing AD and DM GWAS results, respectively. Forty-three SNPs occurred on chromosome 19 and 84 SNPs on chromosome 6. Supplementary Table 1 contains all the information about common SNPs revealed by both diseases. To construct the SNP-SNP interaction network LD was calculated and different D’ value thresholds were tested. The final network consists of four components. Two components are associated to chromosome 19, while the remaining two are linked to chromosome 6. As we have already mentioned, to identify signatures, we considered dense subgraphs containing at least 20% of the chromosome’s total nodes. As a result, the subgraphs linked to chromosomes 19 should contain at least 8 and subgraphs linked to chromosomes 6 should contain at least 16 nodes. Each of the 43 SNPs on chromosome 19 belongs to at least one signature. Ten of the 84 SNPs on chromosome 6 do not participate in any signature; some are members of small dense subgraphs (which do not meet the signature threshold), while others do not form any dense subgraph. The results are shown in Table 1 and Figure 2.

Figure 2. Single Nucleotide Polymorphism (SNP)-SNP interaction network. This network consists of four components. Component 1 consists of signature (A) (light blue nodes) and component 2 consists of signature (B) (red nodes). Component 3 consists of signature (C) (green nodes) and component 4 consist of signatures (D–F). The dark blue nodes in the last component are shared by signatures (D–F) while the yellow, purple, and light pink nodes are unique to signatures (D–F), respectively. The first two components are found on chromosome 19, while the last two are found on chromosome 6. Each SNP rsid number is listed in Table 1.
After mapping each signature to the reference genome, 7 proteins, 2 lncRNAs, and one pseudogene were identified. Genes with at least 3 SNPs were reported in our dataset. According to Figure 3, HLA-DRB1and APOE have the highest and lowest number of SNPs, respectively. Signatures and their associated genes are displayed in Table 2.
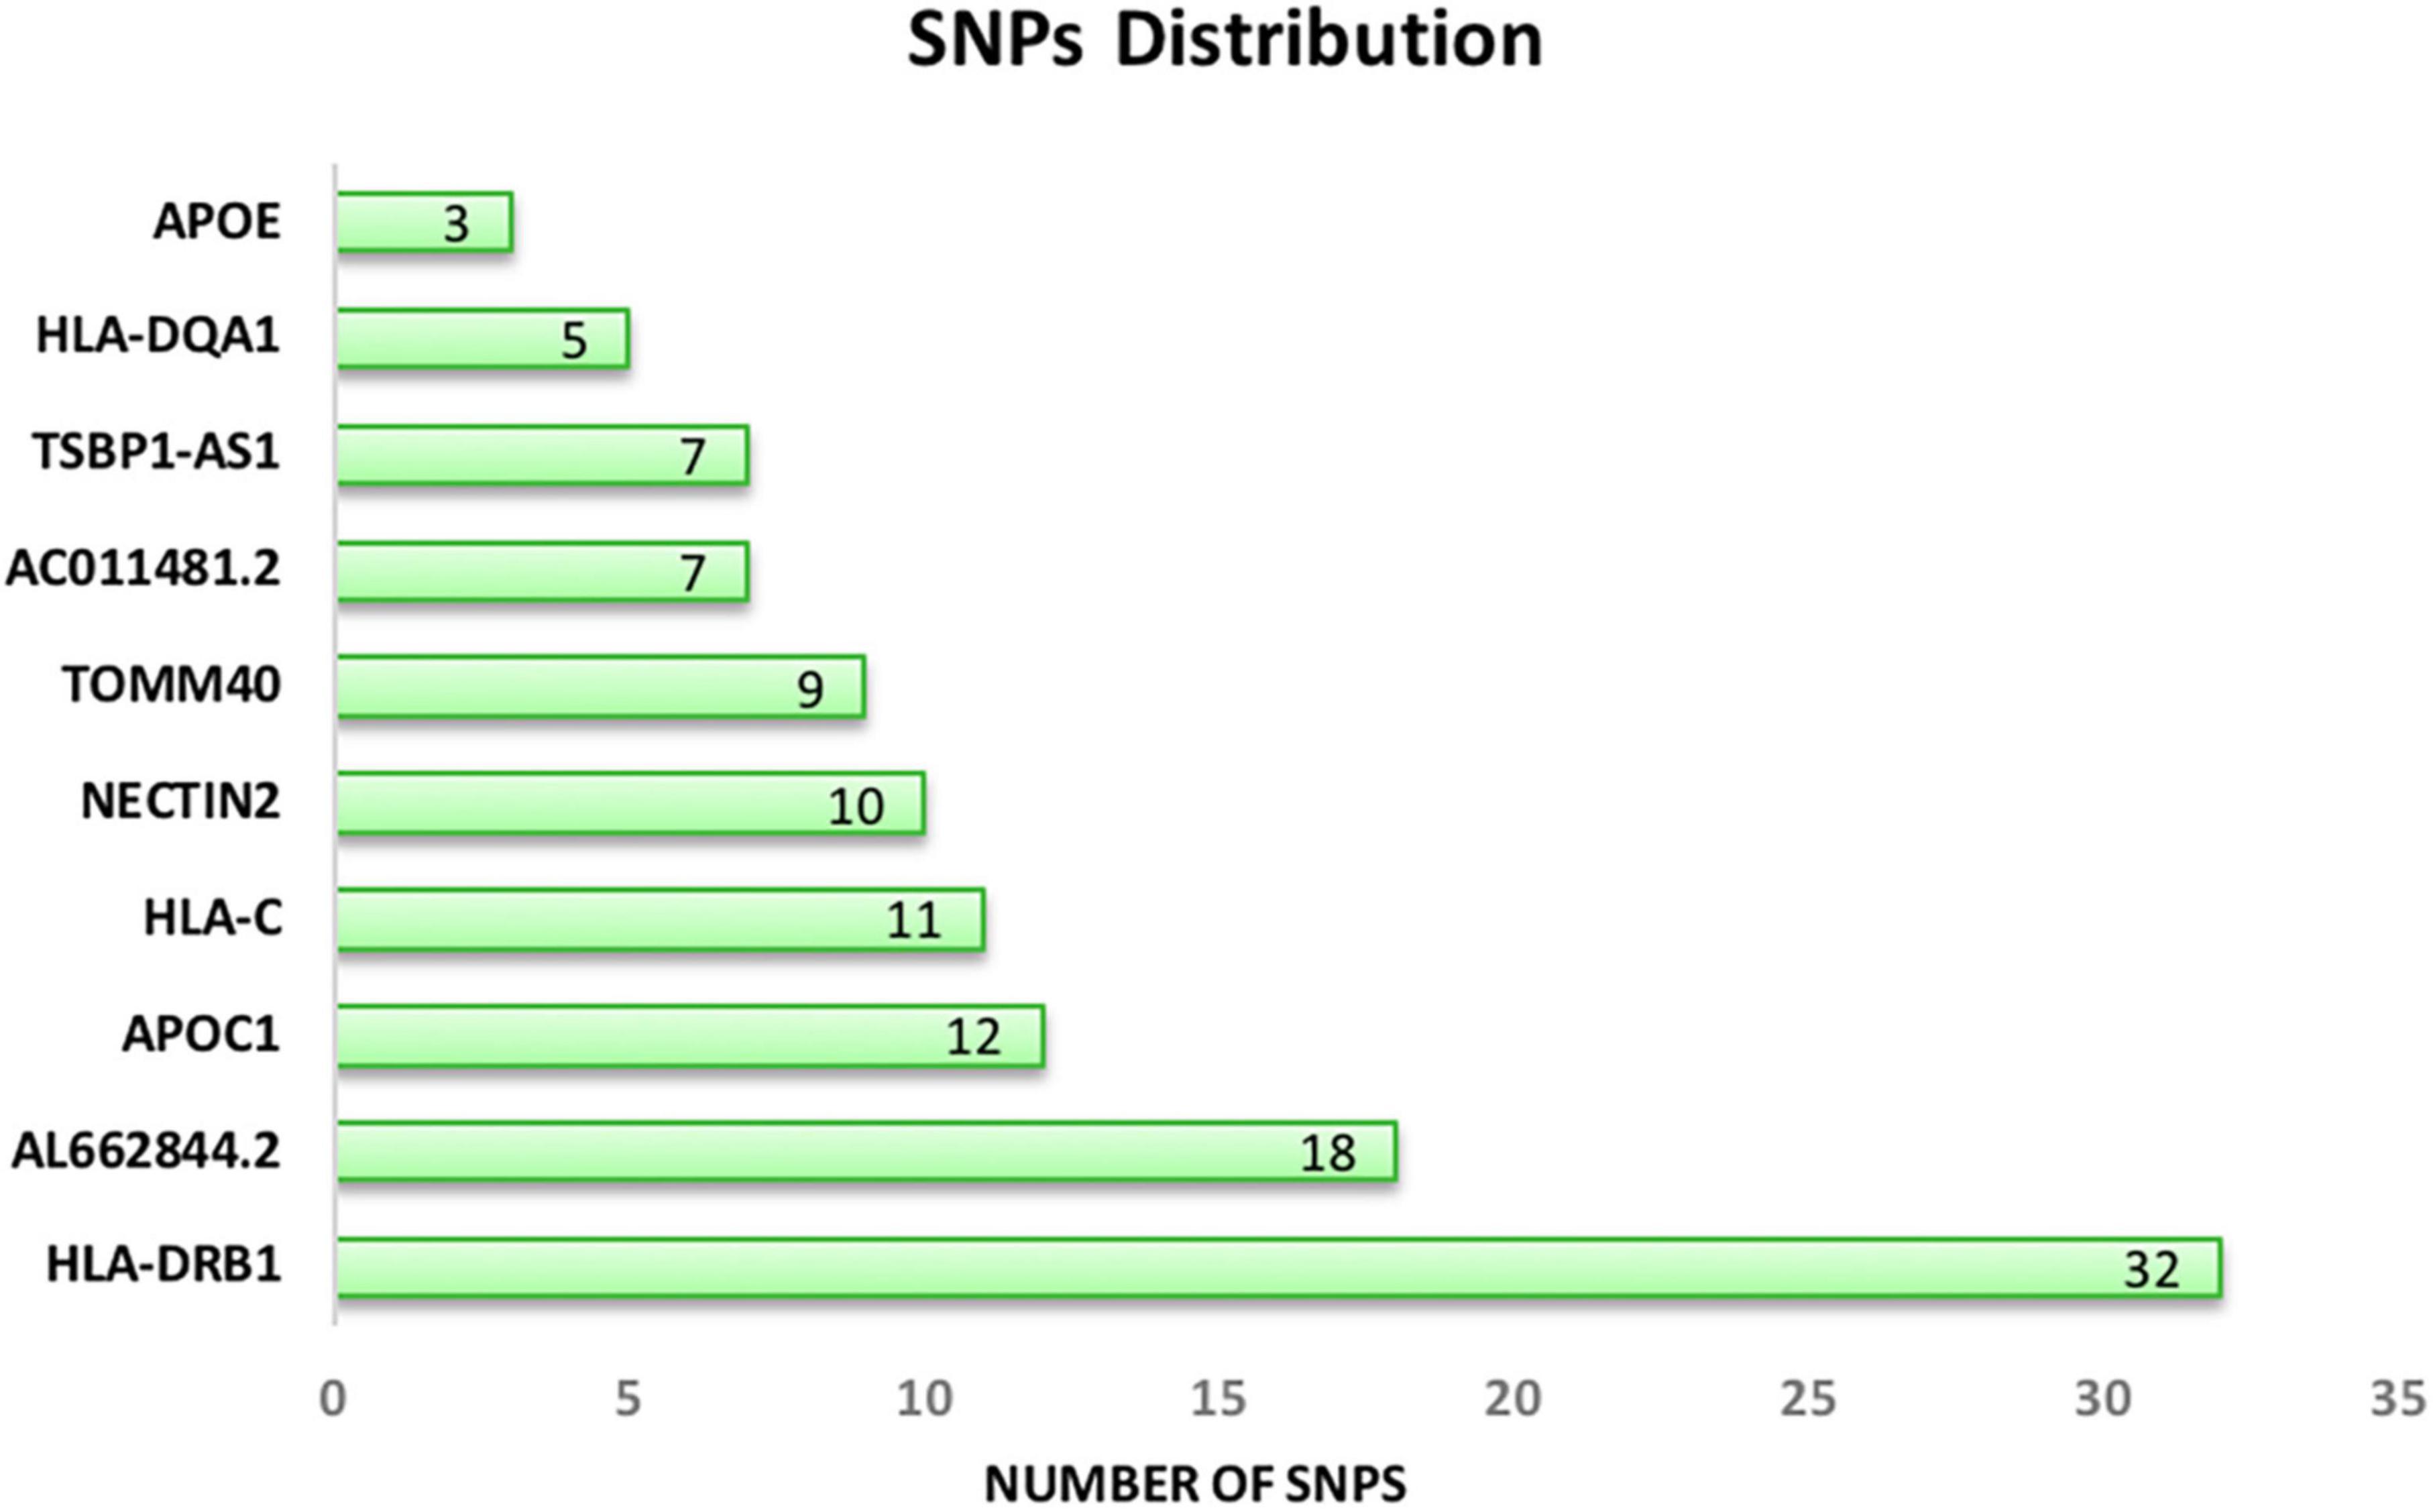
Figure 3. Distribution of common significant SNPs on the associated genes. APOE (chromosome 19) and HLA-DRB1 (chromosome 6) have the lowest and the highest number of SNPs.
To highlight the importance of miRNAs in the progression of both diseases we created a protein-miRNA bipartite network. This network showed that among 238 miRNAs, hsa-miR-199a-5p, hsa-miR-199b-5p, hsa-miR-423-5p, hsa-miR-3184-5p, hsa-miR-124-3p, hsa-miR-506-3p, hsa-miR-1321, hsa-miR-4731, hsa-miR-491-5p, hsa-miR-663a, hsa-miR-744-5p, hsa-miR-665, hsa-miR-1286, hsa-miR-1908-5p, and hsa-miR-873-5p are the top 10 high-degree miRNAs in the network. Since some nodes shared the same degree, 15 miRNAs were chosen.
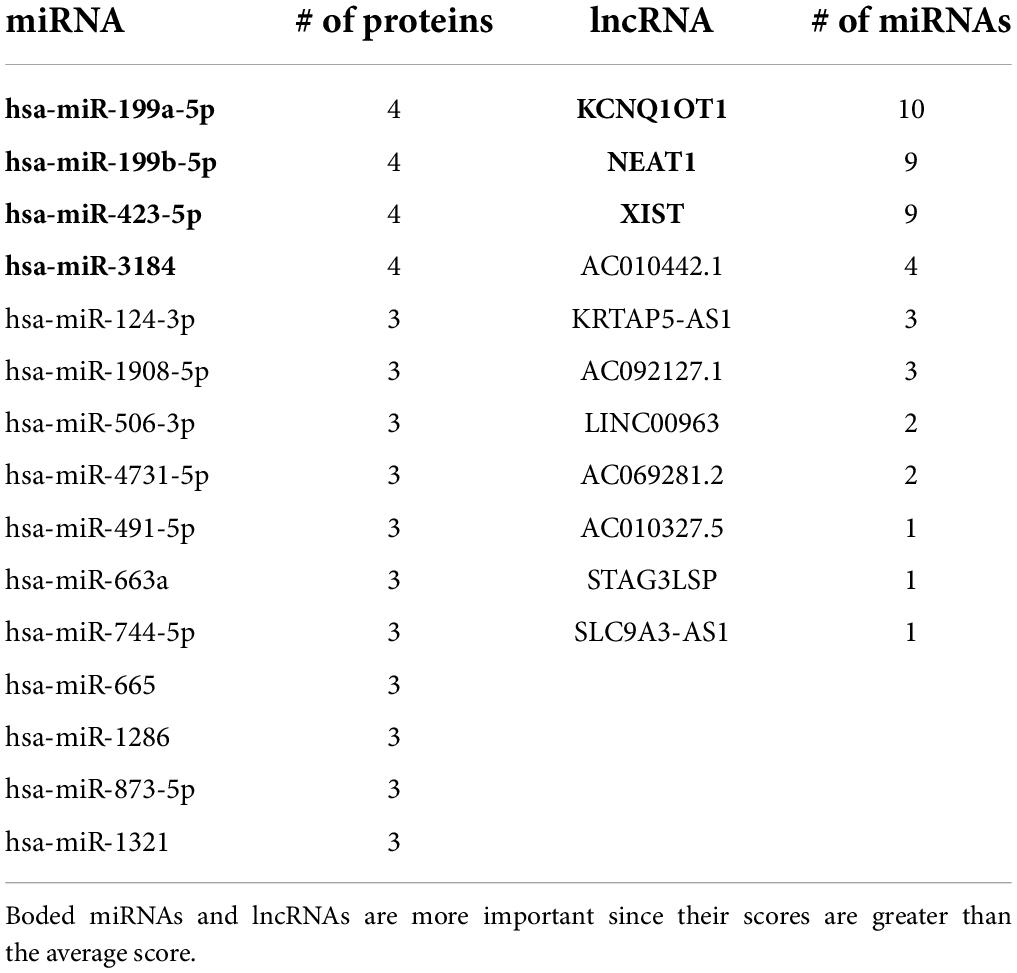
Next, miRNA-lncRNA bipartite network was built and high degree lncRNAs were chosen. Among 350 lncRNAs in this network, Nuclear paraspeckle assembly transcript 1 (NEAT1), AC069281.2, X inactive specific transcript (XIST), KCNQ1 opposite strand/antisense transcript 1 (KCNQ1OT1), AC010442.1, AC092127.1, SLC9A3-AS1, KRTAP5-AS1, AC010327.5, STAG3L5P-PVRIG2P-PILRB, and LINC00963 are the top 10 high-degree ones. Since some nodes shared the same degree, 11 lncRNAs were chosen. Supplementary Tables 2, 3 contain all the protein-miRNA and miRNA-lncRNA interactions.
Validations
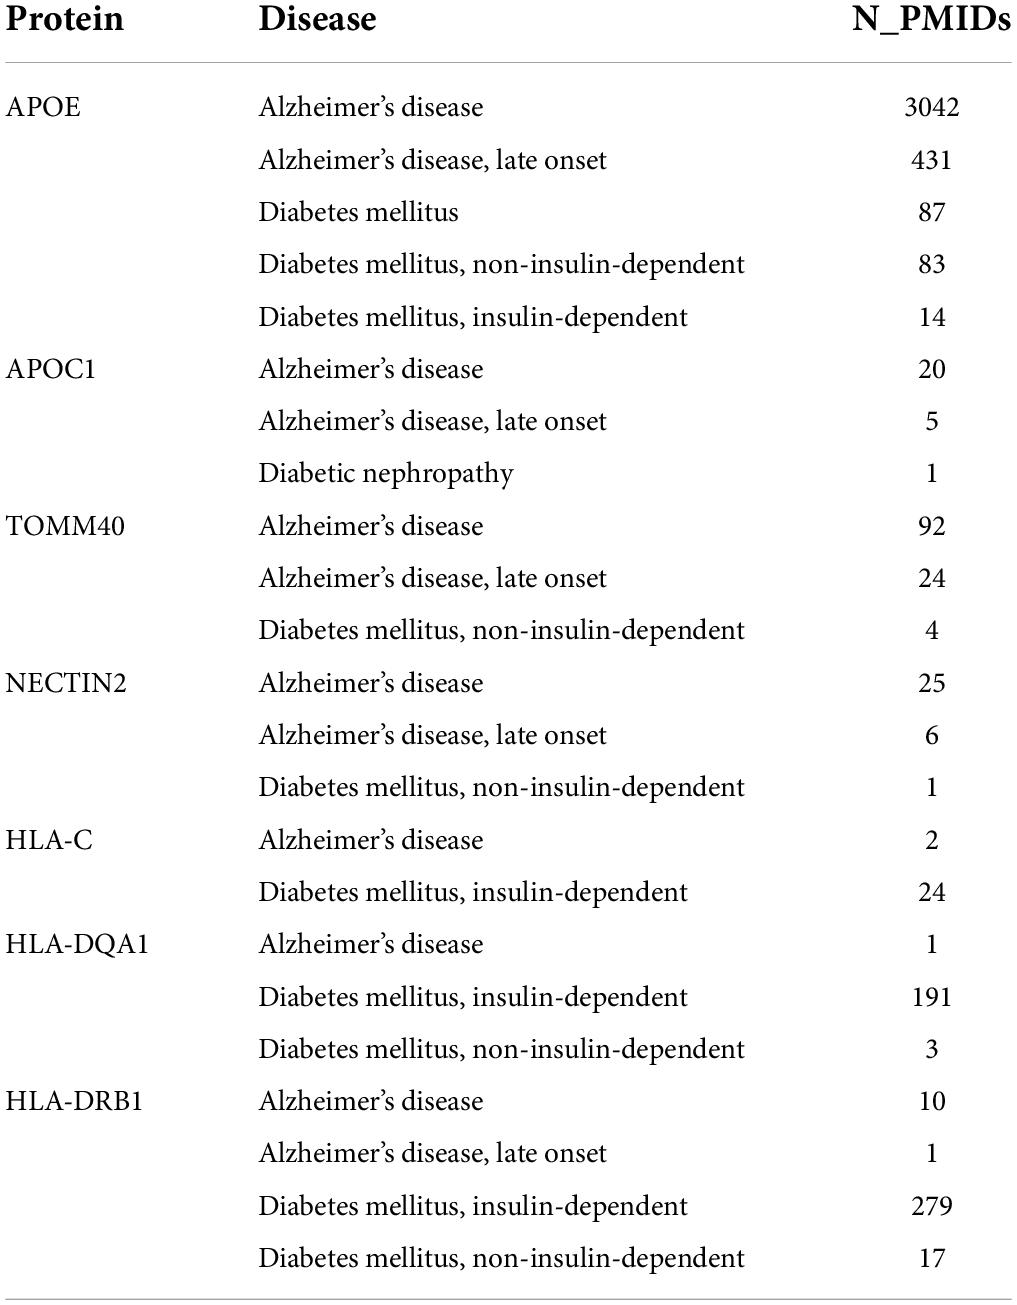
To ensure that the achieved proteins are associated with the mentioned diseases, we used the Disgenet database. The findings revealed that APOE is a key gene in the progression of both diseases. APOC1, TOMM40, and NECTIN2 play a bigger role in AD than in DM, while HLA-C, HLA-DQA1, and HLA-DRB1 play a bigger role in DM than in AD. Nevertheless, all proteins are involved in both diseases. Results have been shown in Table 3.
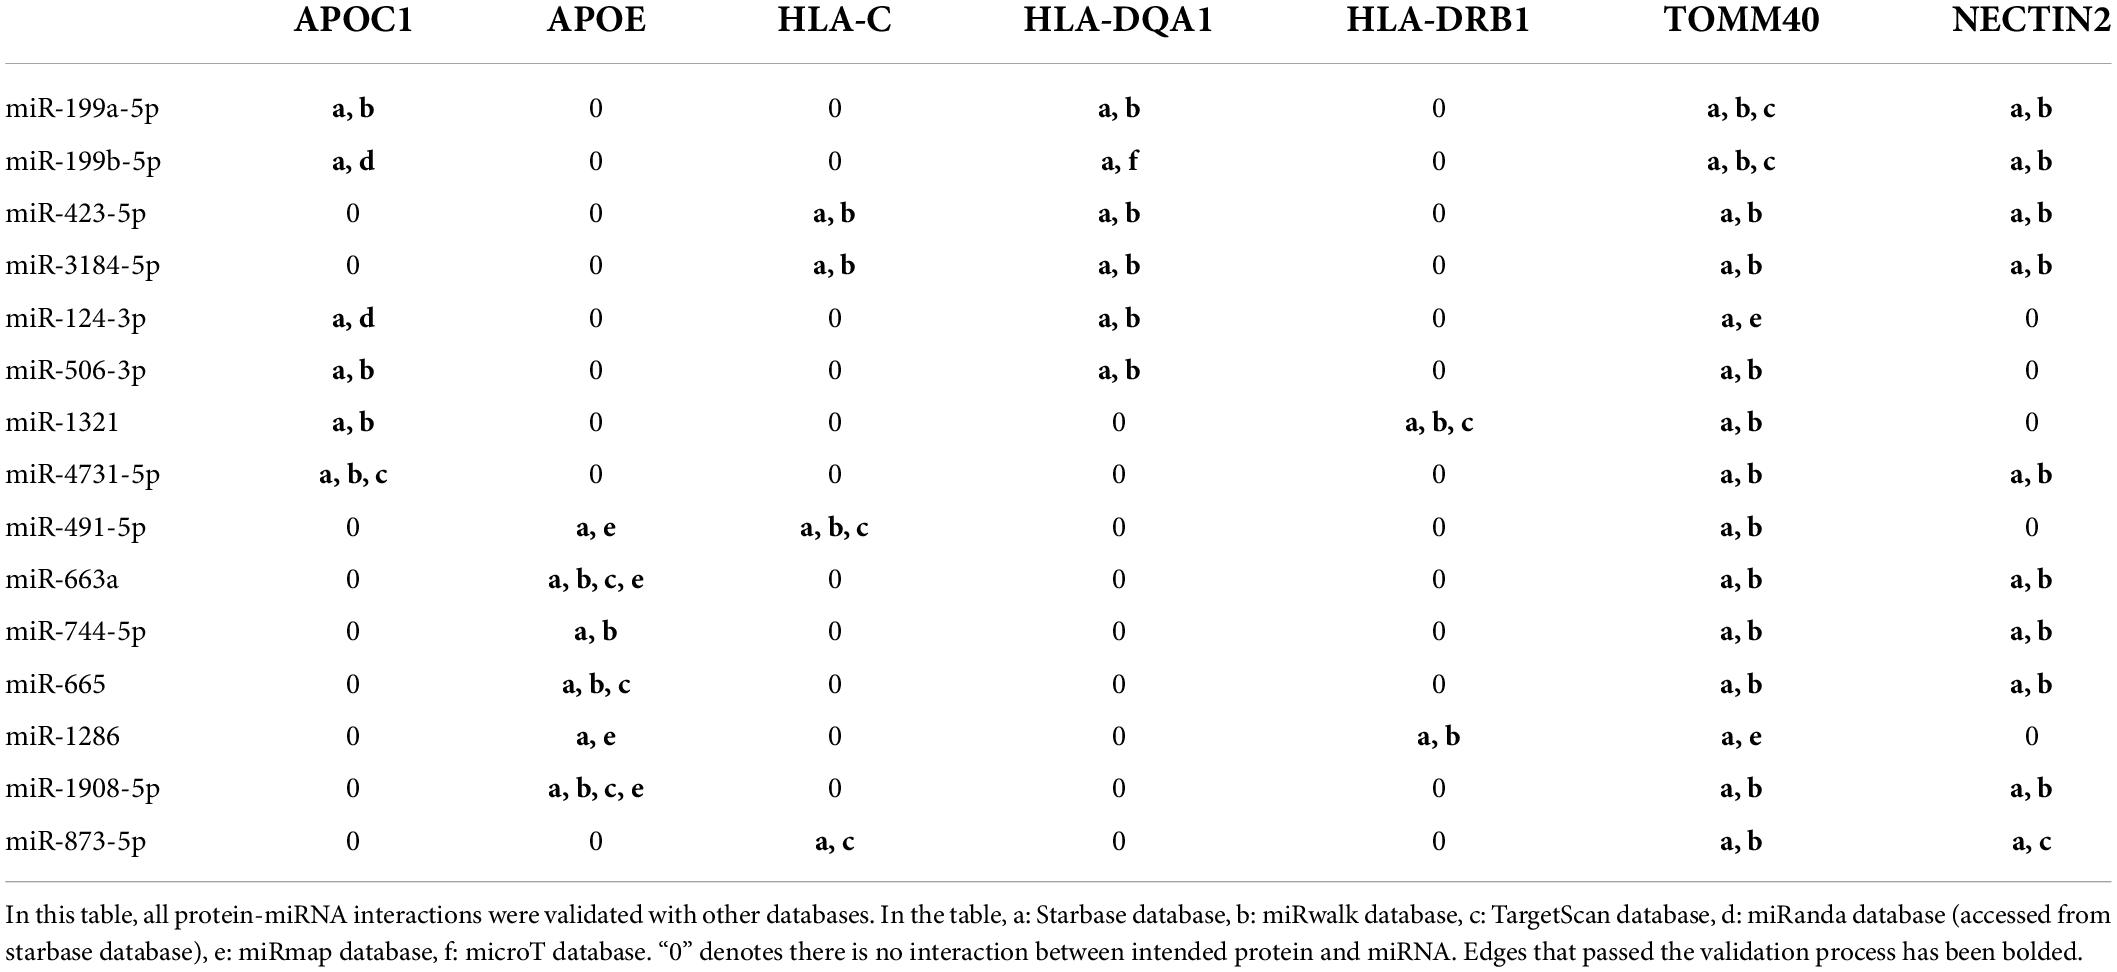
To increase confidence to the final network, all interactions were double-checked against TargetScan miRwalk, miRmap, microT and LncBase databases. As shown in Table 4, all protein-miRNA interactions passed the validation process and no edge has been removed. However, according to Table 5, some edges did not satisfy the validation process for miRNA-lncRNA interactions and were removed.
Protein-miRNA-long non-coding RNA tripartite network
After the validation process, the final tripartite network was constructed. This network consists of 7 proteins achieved from mapping signatures to the reference genome, 15 high-degree miRNAs with 49 interactions retrieved from the protein-miRNA bipartite network and 11 high-degree lncRNAs with 45 interactions derived from the miRNA-lncRNA bipartite network. Figure 4 shows the final network.
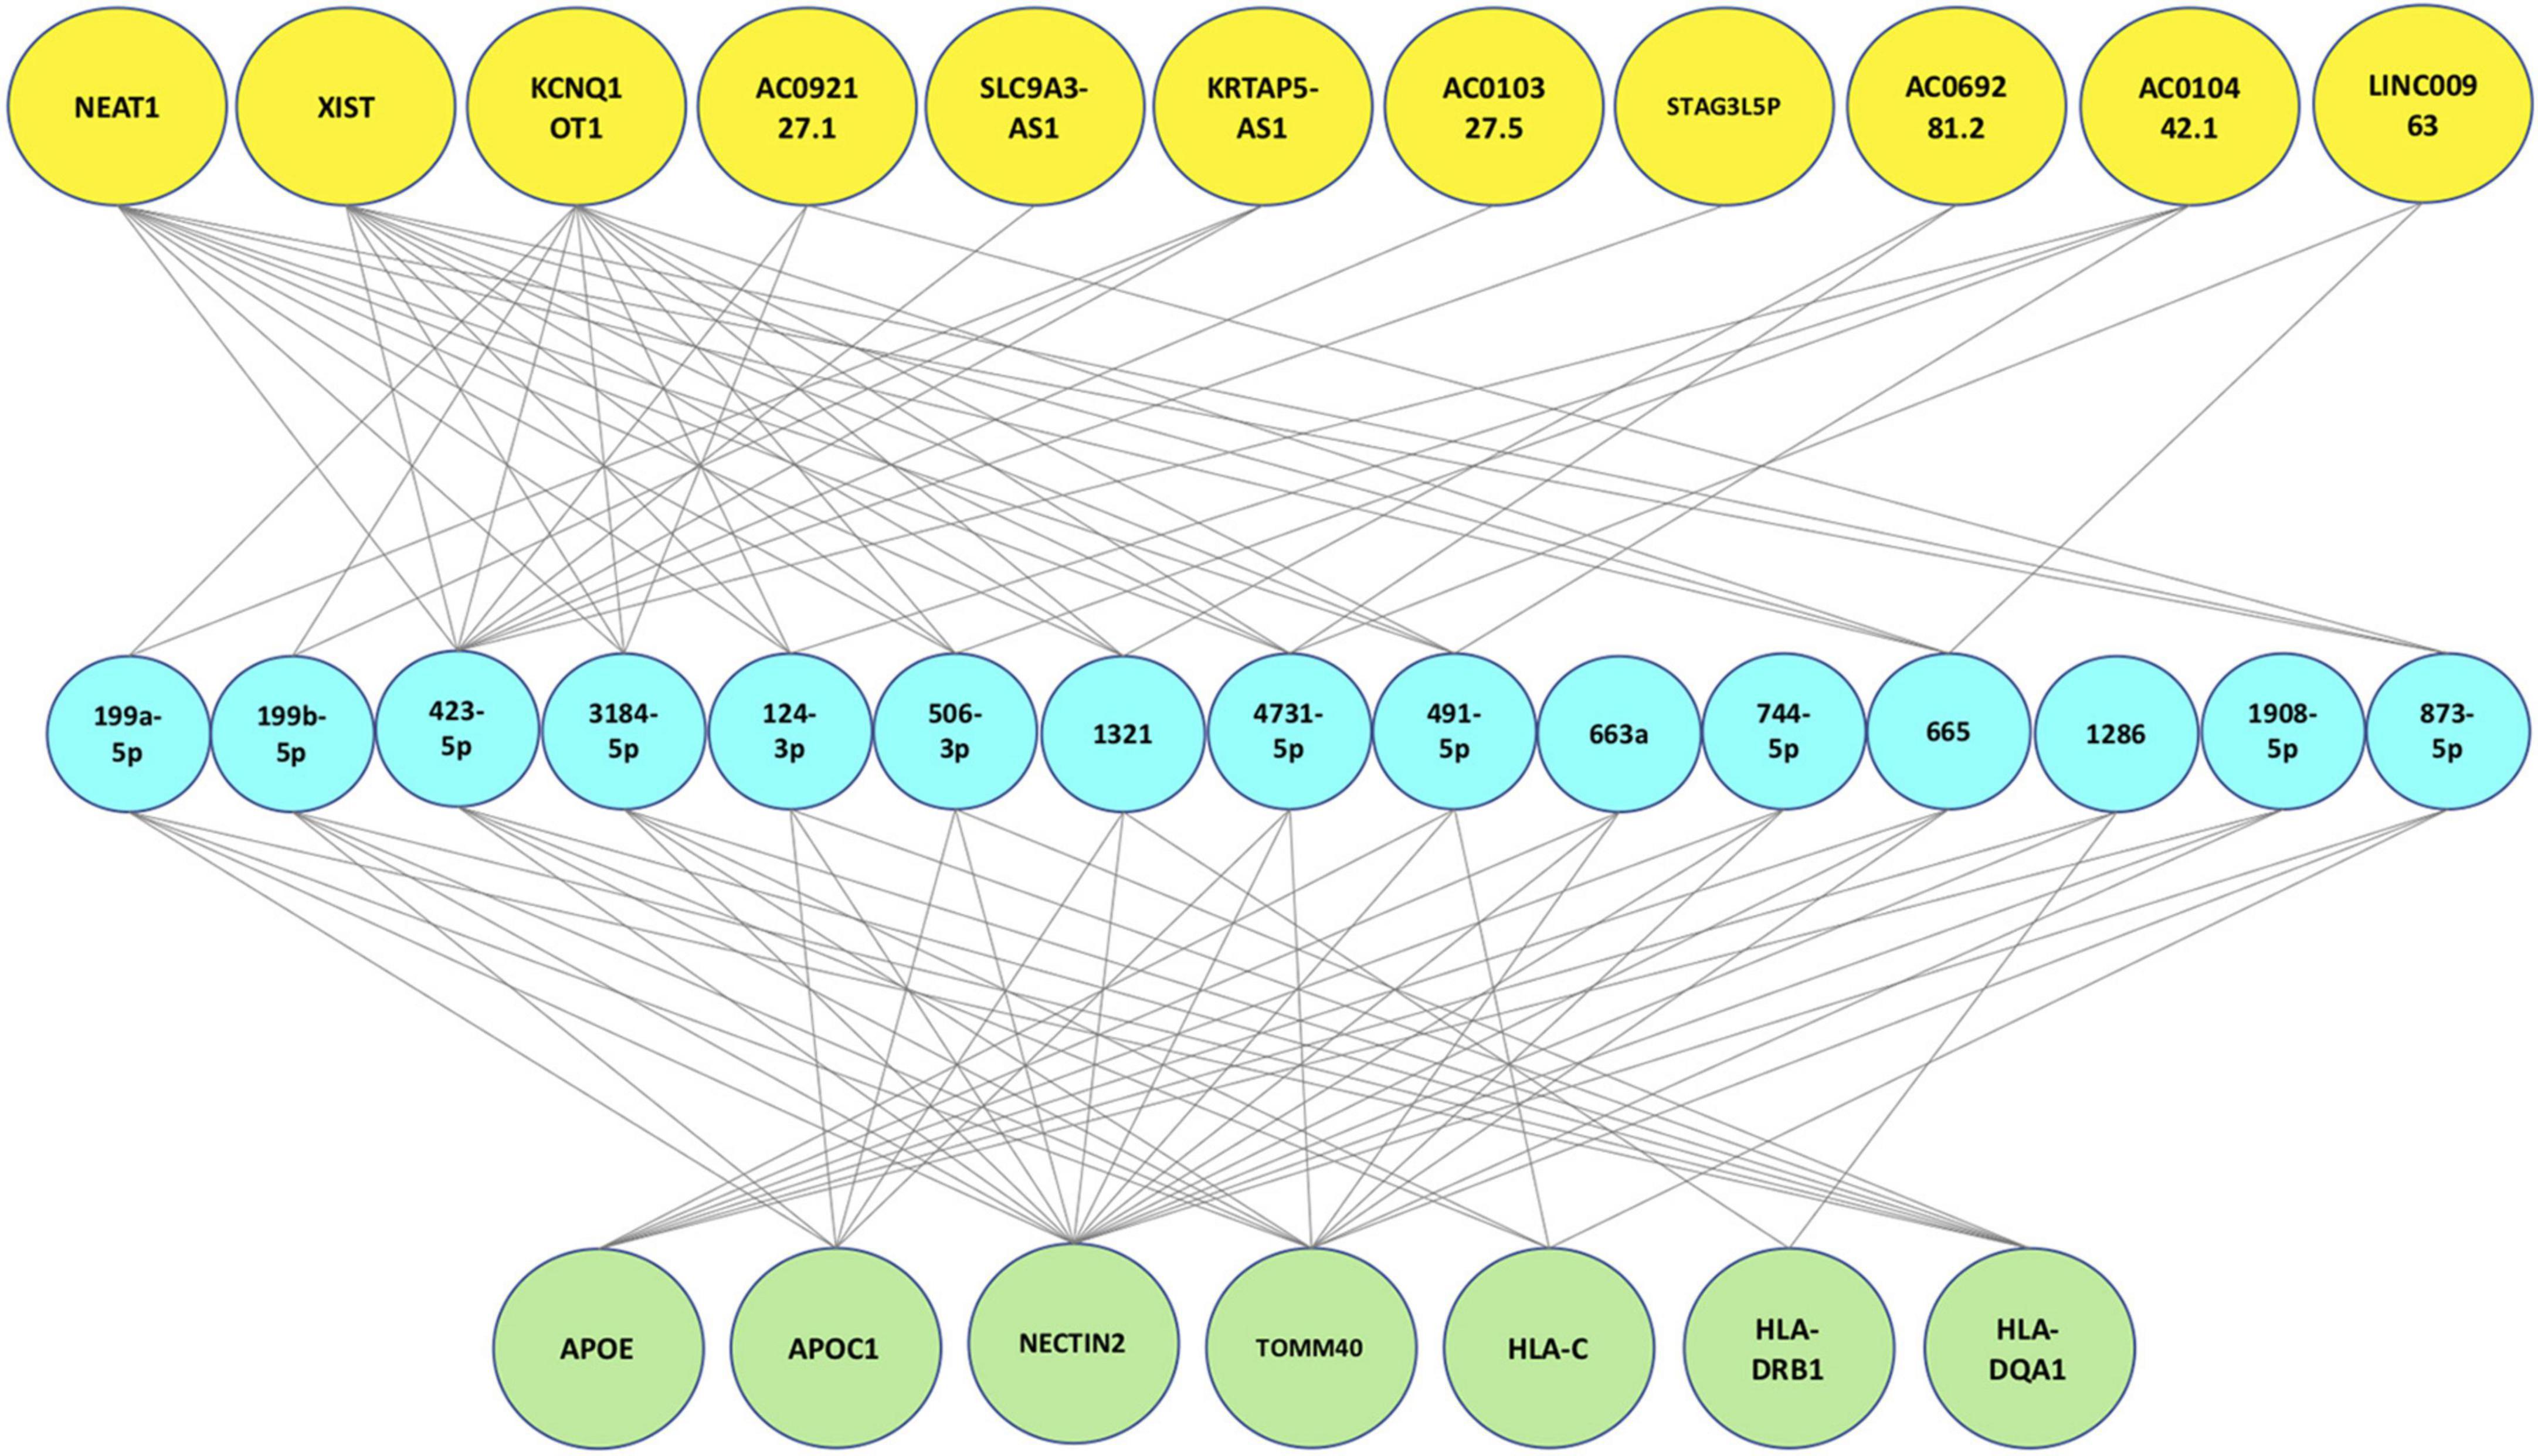
Figure 4. Final protein-miRNA-lncRNA tripartite network. The first layer (green nodes) consists of 7 proteins. The second layer (blue nodes) consists of 15 high degree miRNAs and the last layer (yellow nodes) consists of 11 high degree lncRNAs.
Scoring function results
We assigned a score to each ncRNA based on the scoring function and arranged them in descending order. According to Figure 5 and Table 6, the miRNAs with the highest scores are hsa-miR-199a-5p, hsa-miR-199b-5p, and hsa-miR-3184. Moreover, KCNQ1OT1, NEAT1, and XIST are the most significant lncRNAs. Each of the mentioned ncRNAs has a score higher than the average. A literature review also confirms the significance of the discussed ncRNAs.
MicroRNA pathway enrichment analysis
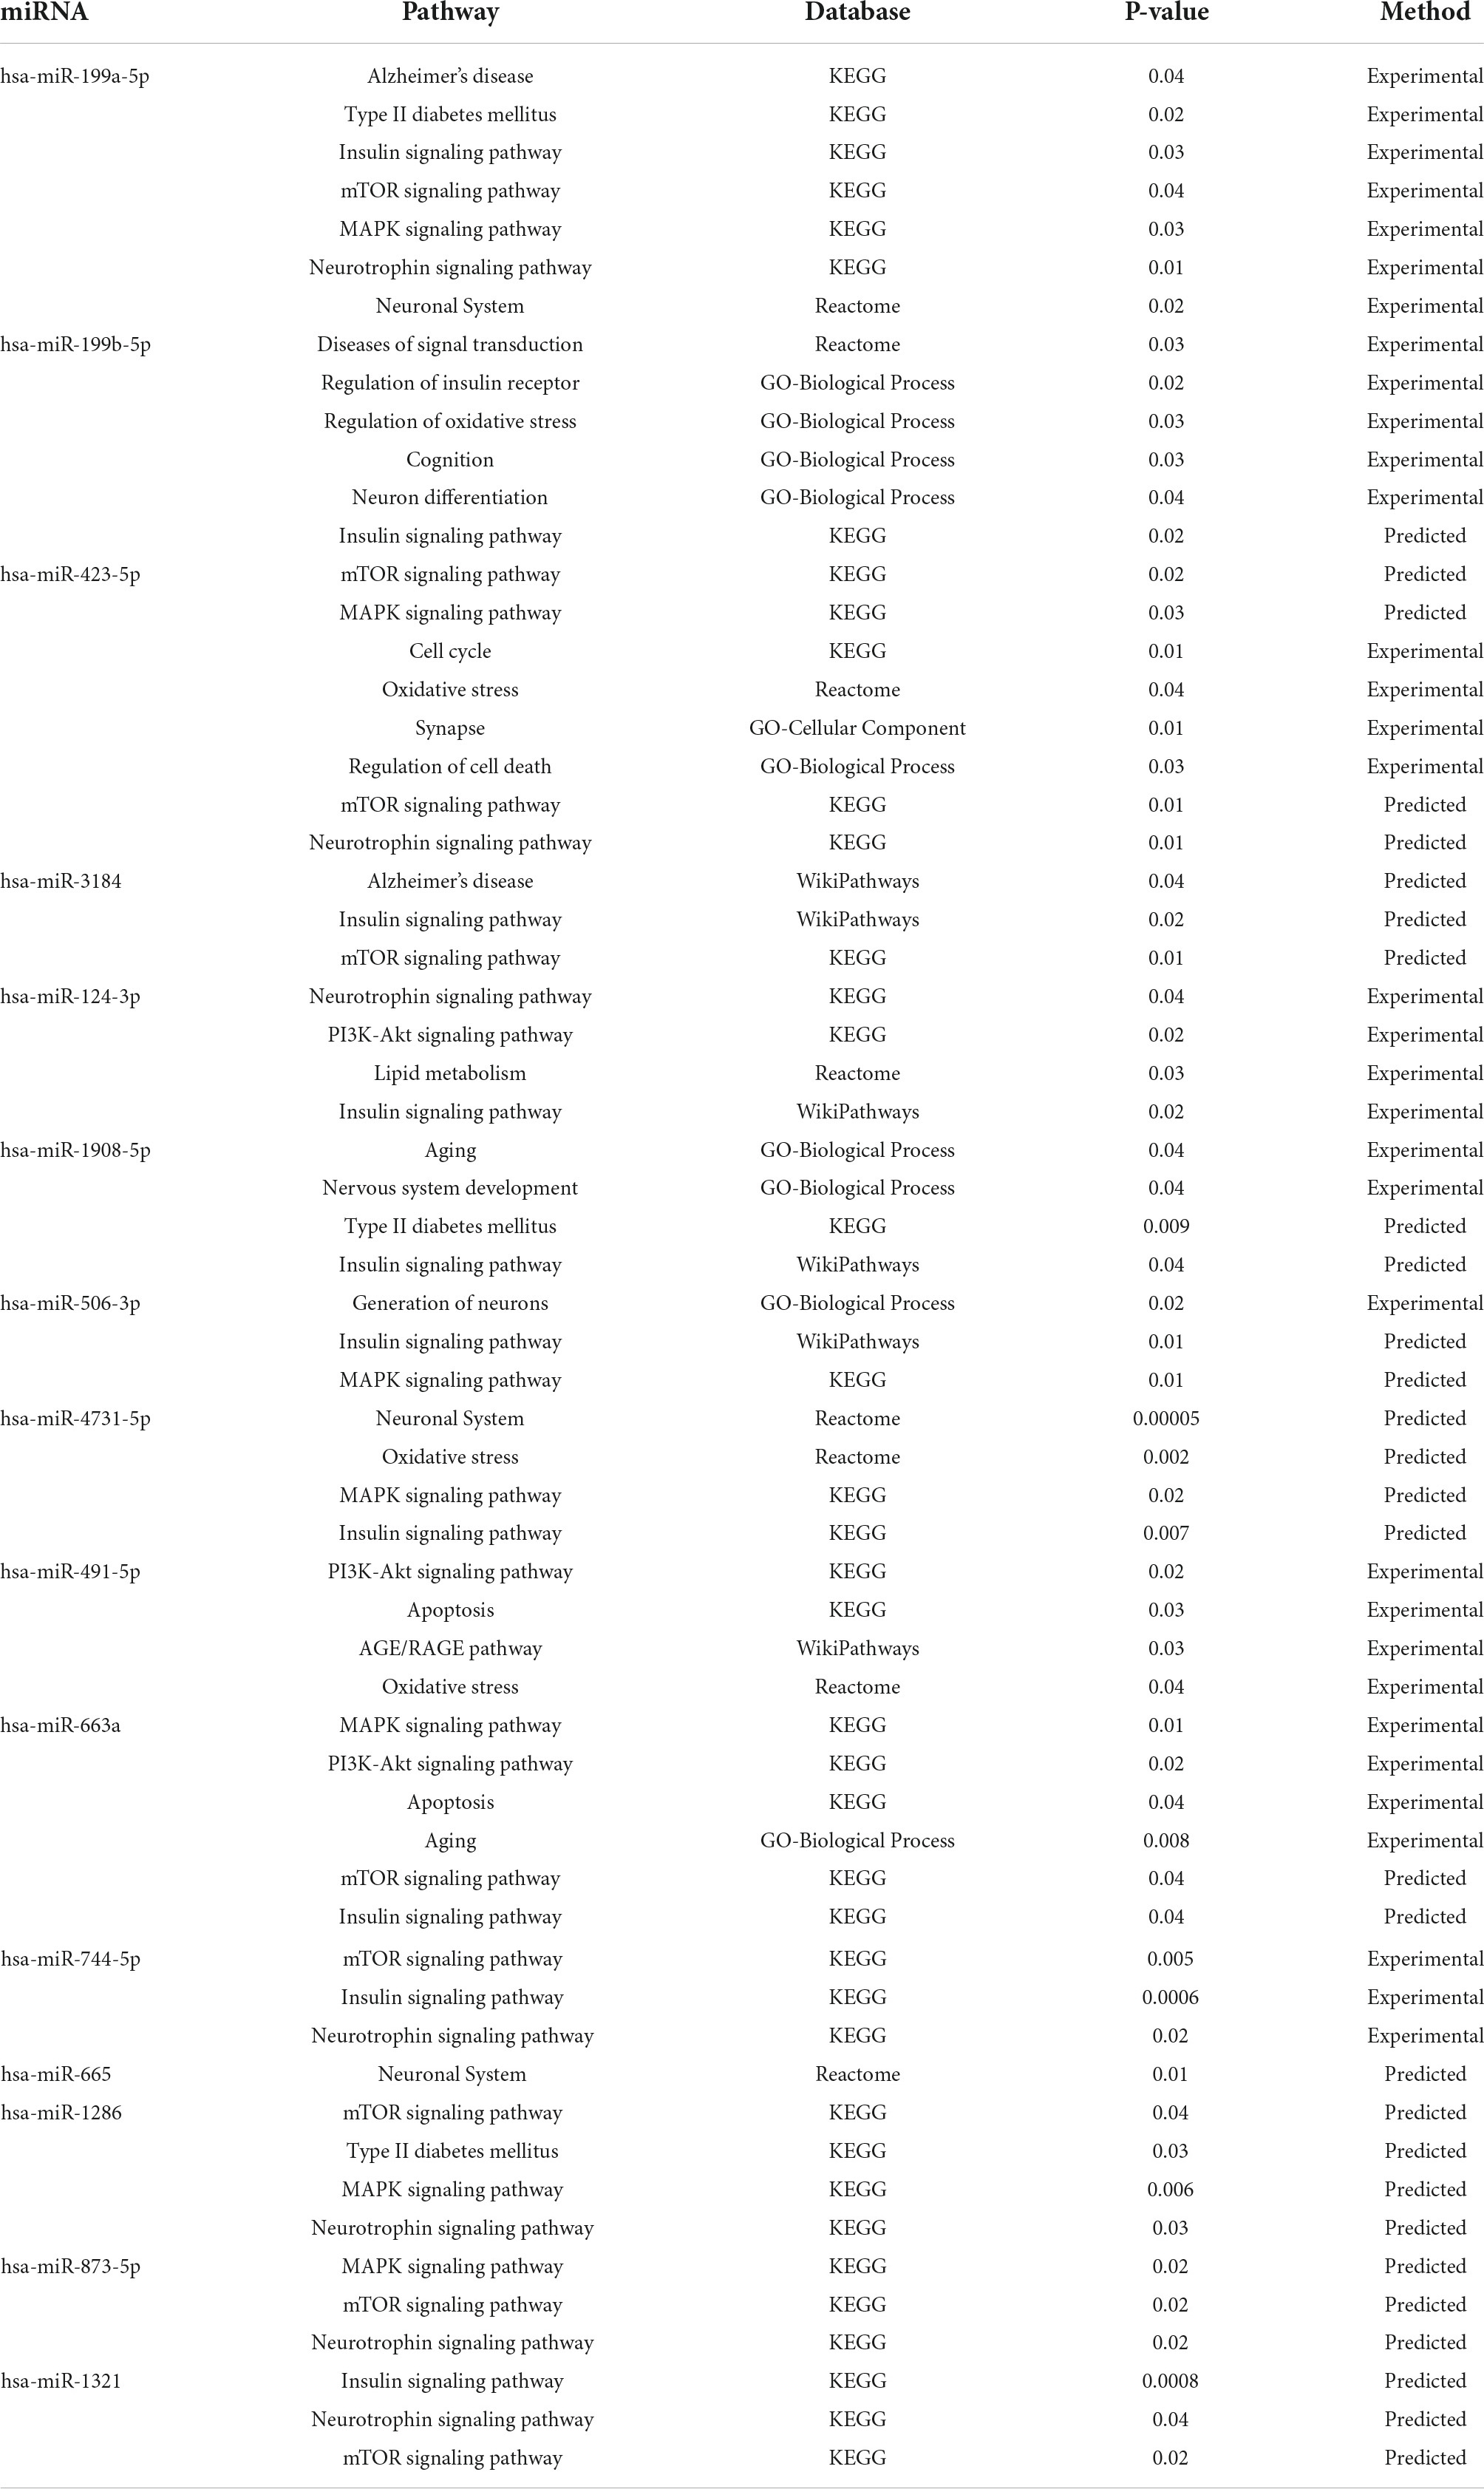
The top 10 high-degree miRNAs from the protein-miRNA bipartite network were applied to pathway enrichment analysis using the miRpathDB database (Vlachos et al., 2015). Table 7 demonstrates that the genes involved in Alzheimer’s disease pathway, Type II diabetes pathway, Insulin signaling pathway, MAPK signaling pathway, PI3K-Akt signaling pathway, mTOR signaling pathway, and Neurotrophin signaling pathway are regulated by the significant miRNAs identified in this study. The mentioned pathways have also been identified as shared pathways between DM and AD in previous research.
Discussion
Using a variety of data (SNPs, proteins, miRNAs, and lncRNAs), this study investigated the relationship between DM and AD and introduced candidate biomarkers that could be identified as potential drug targets for the prevention and treatment of both diseases. In addition, the current study demonstrated that the proposed candidate proteins could involve known biomarkers in the cross-talk between DM and AD, confirming the accuracy of the final tripartite network, which was supported by the literature. Moreover, many of the proposed ncRNAs have been identified in both diseases or in at least one of them.
Apolipoprotein E, the brain cholesterol transporter, appears to be highly expressed in the brain, liver, kidney, and adipose tissue and plays a crucial role in lipid metabolism. It is located on chromosome 19, and its allele number 4 (APOE4) is associated with AD. Previous research has demonstrated that this protein plays an important role in the progression of related diseases (Peila et al., 2002; Irie et al., 2008; Shinohara et al., 2020). Studies indicate that APOE dysregulation can disrupt insulin signaling by preventing it from interacting with its receptor, as well as affecting the clearance of amyloid beta (Aβ) plaques in the brain. In addition, its negative correlation with IDE brain expression may have an effect on Aβ plaques (Du et al., 2009). Apolipoprotein C1 (APOC1), the downstream gene of APOE, is involved in lipid metabolism and is predominantly expressed in the brain and liver. Patients with T2DM have a high concentration of this protein, which causes hyperlipidemia and, consequently, insulin resistance (Bouillet et al., 2016). APOC1 dysregulation has also been detected in mice with memory loss (Abildayeva et al., 2008).
In a previous GWAS study, specific alleles of “Translocase of Outer Mitochondrial Membrane 40” (TOMM40) and “Nectin cell adhesion molecule 2” (NECTIN2; i.e., PVRL2) were found to be associated with an increased risk of developing both DM and AD (Hao et al., 2015). TOMM40, an APOE-neighboring gene, is involved in age-related neurodegeneration processes (Gottschalk et al., 2014). Dysregulation of this protein induces mitochondrial dysfunction, which interferes with insulin uptake in the brain, resulting in insulin resistance (Wennberg et al., 2016). In addition, it has been reported that the expression of TOMM40 is reduced in the blood of Alzheimer’s patients (Lee et al., 2012). NECTIN2, a gene close to APOE, is a significant gene in AD progression (Hu et al., 2019). It is found in the brain and neuronal cells and is necessary for proper cell junction formation. The expression of this protein was found to be lower in T2DM patients (Kleinstein et al., 2019).
In addition to the previously mentioned proteins, the major histocompatibility complex, class I, C (HLA-C), the major histocompatibility complex, class II, DQ alpha 1 (HLA-DQA1), and the major histocompatibility complex, class II, DR beta 1 (HLA-DRB1) have been linked to AD, Parkinson’s disease, and multiple sclerosis. Additionally, their connection to DM has been documented. Studies confirmed the role of HLA-DRB1 in the progression of AD (Lu et al., 2017) and T2DM (Williams et al., 2011). Furthermore, the dysregulation of HLA-DQA1 in AD (Kwok et al., 2018) and T2DM has been discussed (Ma et al., 2013). Russell et al. (2019) also demonstrated the upregulation of HLA-C in Type 1 diabetes.
Hsa-miR-199a-5p, one of the miRNAs with the highest score as determined by the scoring function (see Table 6), has been cited in multiple studies as the dysregulated miRNA in DM and AD. It appears to be expressed in the brain and controls GLUT4, the brain glucose transporter. GLUT4 is heavily expressed in the hippocampus and is extremely important for hippocampal memory function (McNay and Pearson-Leary, 2020). It is upregulated in the prefrontal cortex of Alzheimer’s patients (Heidari et al., 2018) as well as diabetic patients’ plasma (Yan et al., 2014) which disrupts the regulation of GLUT4, preventing neurons from absorbing insulin and causing insulin resistance. An additional target of hsa-miR-199a-5p in the brain peptidylprolyl cis/trans isomerase, NIMA-interacting 1 (PIN1), an enzyme that regulates protein function in the post phosphorylation process. It is believed that the lack of PIN1 (downregulation) causes tau hyperphosphorylation in the brain (Sultana et al., 2006). Hsa-mir-199b-5p also interacts with PIN1. It is upregulated in the brains of Alzheimer’s patients, and causes hyperphosphorylation of tau protein (Heidari et al., 2018).
Hsa-mir-124-3p has been downregulated in DM and AD. One of the most important targets of this miRNA is Beta-secretase 1 (BACE1) which is a significant known biomarker for AD. Decreasing the expression of hsa-mir-124-3p causes increase in the levels of BACE1, leading to hyperphosphorylation of the tau protein (Fang et al., 2012; Lau et al., 2013).
Hsa-miR-1908-5p, which interacts with APOE in the tripartite network, is involved in the regulation of human obesity and cholesterol. Wang et al. demonstrated that upregulation of this miRNA in the peripheral blood cells of Alzheimer’s patients could inhibit Aβ clearance (Wang et al., 2019). In addition, the role of this microRNA in cholesterol metabolism and neurodegeneration has been investigated (Goedeke and Fernández-Hernando, 2014).
Hsa-miR-423-5p has been introduced as the novel differentially expressed miRNA between non-AD individuals and Mild Cognitive Impairment (MCI) patients (Nagaraj et al., 2017). Alzheimer’s patients experience an upregulation of hsa-mir-744-5p, which may regulate PIN1 expression (Lau et al., 2014). Sidorkiewicz et al. (2020), demonstrated the role of hsa-miR-491-5p in the diagnosis of T2DM in prediabetic patients. They discussed the upregulation of this miRNA as the diagnostic biomarker for T2DM (Sidorkiewicz et al., 2020). Downregulation of hsa-miR-665 has also been identified in T2DM patients (Yang et al., 2017). Additionally, Sheinerman et al. (2012) presented this miRNA as a novel plasma biomarker for the diagnosis of MCI.
Alzheimer’s patients have been found to have altered expression of hsa-miR-1321 (Lau et al., 2014), hsa-mir-506-3p (Nunez-Iglesias et al., 2010), hsa-miR-663a (Grasso et al., 2019), and hsa-miR-873-5p (Shi et al., 2018). These miRNAs, along with hsa-miR-4731-5p, hsa-miR-1286, and hsa-miR-3184-5p, have been introduced in this study as novel candidate miRNAs in the cross-talk between DM and AD for further analysis. The miRNAs identified in this study were validated using the Human microRNA Disease Database (2007). Results show that hsa-miR-124-3p is a significant miRNA in T2DM and AD. In addition, hsa-mir-665 and hsa-mir-199a-5p have been identified as T2DM biomarkers, whereas hsa-miR-199b-5p and hsa-miR-744-5p have been discovered in inflammatory and brain diseases, respectively. As a plasma biomarker for MCI and glioblastoma, the function of hsa-miR-491-5p has been discussed.
According to Table 6, KCNQ1OT1 is the highest score lncRNA that is highly expressed in the brain. In addition, the interaction between KCNQ1OT1 and hsa-miR-506 has been identified in the plasma of patients with elevated glucose levels (Zhu et al., 2020).
Alzheimer’s patients have upregulated levels of NEAT1 and XIST. They may result in the downregulation of hsa-miR-124-3p, which in turn causes the upregulation of BACE1. As previously stated, BACE1 dysregulation results in tau hyperphosphorylation, which ultimately leads to cell death. Therefore, silencing the aforementioned lncRNAs may reduce AD-related complications (Zhao et al., 2019; Huang et al., 2020; Yue et al., 2020). In addition, NEAT1 was found to be significantly upregulated in diabetic rats, leading to a highly activated Akt/mTOR signaling pathway (Huang et al., 2019). The role of XIST in insulin resistance and T2DM has also been reported (Sathishkumar et al., 2018).
Long intergenic non-coding RNA 963 (LINC00963) also modulates the Foxo signaling pathway in rats and induces oxidative stress (Chen et al., 2018).
The role of other achieved lncRNAs has been less proven. AC011481.2, TSBP1, and BTNL2 Antisense RNA 1 (TSBP1-AS1) were directly obtained by mapping signatures to the reference genome (see Table 2). AC011481.2 is a novel antisense transcript for NECTIN2. The GWAS catalog identifies mutations in specific loci (rs6857) of this gene as a risk factor for developing T2DM and AD simultaneously (2008). This mutation has been identified as one of 127 common SNPs in the cross-talk between DM and AD (see Supplementary Table 1). TSBP1-AS, KRTAP5-1/KRTAP5-2 antisense RNA 1 (KRTAP5-AS1), STAG3LSP, SLC9A3 antisense RNA 1 (SLC9A3-AS1), AC092127.1, AC010327.5, AC069281.2, and AC010442.1 have an unknown function in DM and AD. Lack of information about lncRNAs may be the reason. Due to the fact that they have been identified as significant in our study, additional analysis may lead to noteworthy advancements. Table 8 provides a summary of the discussion.
In future research, we will increase the reliability of our study by evaluating the biomarkers we have introduced. In this regard, at the Royan Institute for Stem Cells, we intend to conduct a mouse-based laboratory experiment.
Conclusion
We identified 127 shared SNPs, 7 proteins, 15 miRNAs, and 11 lncRNAs in the cross-talk between DM and AD. According to the literature review, the proteins APOE, APOC1, TOMM40, NECTIN2, HLA-C, HLA-DRB1, and HLA-DQA1, discovered in this study, play crucial roles in the progression of both or one of the aforementioned diseases. Furthermore, the scoring function revealed that hsa-miR-199a-5p, hsa-miR-199b-5p, hsa-miR-423-5p, and hsa-miR-3184-5p (miRNAs with a score greater than 0.5) are the most significant miRNAs discovered in this study; the first two are known miRNAs in the progression of corresponding diseases, and the last two are proposed. This study also discovered that NEAT1, XIST, and KCNQ1OT1 (lncRNAs with above-average scores) are involved in the cross-talk between DM and AD. The first two lncRNAs are known to play a role in the progression of disease (particularly AD), and the third has been identified as a candidate for future research. Finally, we proposed lncRNA/miRNA pairs; hsa-miR-124-3p/KCNQ1OT1, hsa-miR-124-3p/NEAT1, and hsa-miR-124-3p/XIST, all of which are expressed in the brain, as new candidate biomarkers for the occurrence of DM and AD simultaneously. In addition, dysregulation in the expression of hsa-miR-199a-5p in the blood of patients has been suggested for early detection of both diseases.
Data availability statement
The original contributions presented in this study are included in the article/Supplementary material, further inquiries can be directed to the corresponding authors.
Author contributions
ShG designed and performed experiments, analyzed data, and wrote the manuscript. CE, SaG, KS, and MH-R supervised the research. All authors read and approved the final manuscript.
Funding
This work was financially supported the Research Council of the University of Tehran is acknowledged.
Conflict of interest
The authors declare that the research was conducted in the absence of any commercial or financial relationships that could be construed as a potential conflict of interest.
Publisher’s note
All claims expressed in this article are solely those of the authors and do not necessarily represent those of their affiliated organizations, or those of the publisher, the editors and the reviewers. Any product that may be evaluated in this article, or claim that may be made by its manufacturer, is not guaranteed or endorsed by the publisher.
Supplementary material
The Supplementary Material for this article can be found online at: https://www.frontiersin.org/articles/10.3389/fnagi.2022.955461/full#supplementary-material
Footnotes
- ^ http://www.nealelab.is/uk-biobank
- ^ https://ldlink.nci.nih.gov
- ^ https://genome.ucsc.edu/
- ^ https://www.snp-nexus.org/v4/
References
Abildayeva, K., Berbée, J. F., Blokland, A., Jansen, P. J., Hoek, F. J., Meijer, O., et al. (2008). Human apolipoprotein C-I expression in mice impairs learning and memory functions. J. Lipid Res. 49, 856–869. doi: 10.1194/jlr.M700518-JLR200
Alvarez, M. L., and Distefano, J. K. (2013). The role of non-coding RNAs in diabetic nephropathy: Potential applications as biomarkers for disease development and progression. Diabetes Res. Clin. Pract. 99, 1–11. doi: 10.1016/j.diabres.2012.10.010
Baglietto-Vargas, D., Shi, J., Yaeger, D. M., Ager, R., and Laferla, F. M. (2016). Diabetes and Alzheimer’s disease crosstalk. Neurosci. Biobehav. Rev. 64, 272–287. doi: 10.1016/j.neubiorev.2016.03.005
Bouillet, B., Gautier, T., Aho, L. S., Duvillard, L., Petit, J. M., Lagrost, L., et al. (2016). Plasma apolipoprotein C1 concentration is associated with plasma triglyceride concentration, but not visceral fat, in patients with type 2 diabetes. Diabetes Metab. 42, 263–266. doi: 10.1016/j.diabet.2016.01.003
Bycroft, C., Freeman, C., Petkova, D., Band, G., Elliott, L. T., Sharp, K., et al. (2018). The UK Biobank resource with deep phenotyping and genomic data. Nature 562, 203–209. doi: 10.1038/s41586-018-0579-z
Chen, W., Zhang, L., Zhou, Z. Q., Ren, Y. Q., Sun, L. N., Man, Y. L., et al. (2018). Effects of long non-coding RNA LINC00963 on renal interstitial fibrosis and oxidative stress of rats with chronic renal failure via the foxo signaling pathway. Cell. Physiol. Biochem. 46, 815–828. doi: 10.1159/000488739
Disgenet database (2014). DisGeNET Database. Available online at: https://www.disgenet.org/ (accessed June, 2021).
DiStefano, J. K. (2018). The emerging role of long noncoding RNAs in Human disease. Methods Mol. Biol. 1706, 91–110. doi: 10.1007/978-1-4939-7471-9_6
Du, J., Chang, J., Guo, S., Zhang, Q., and Wang, Z. (2009). ApoE 4 reduces the expression of Abeta degrading enzyme IDE by activating the NMDA receptor in hippocampal neurons. Neurosci. Lett. 464, 140–145. doi: 10.1016/j.neulet.2009.07.032
Fang, M., Wang, J., Zhang, X., Geng, Y., Hu, Z., Rudd, J. A., et al. (2012). The miR-124 regulates the expression of BACE1/β-secretase correlated with cell death in Alzheimer’s disease. Toxicol. Lett. 209, 94–105. doi: 10.1016/j.toxlet.2011.11.032
Goedeke, L., and Fernández-Hernando, C. (2014). MicroRNAs: A connection between cholesterol metabolism and neurodegeneration. Neurobiol. Dis. 72(Pt A) 48–53. doi: 10.1016/j.nbd.2014.05.034
Gottschalk, W. K., Lutz, M. W., He, Y. T., Saunders, A. M., Burns, D. K., Roses, A. D., et al. (2014). The broad impact of TOM40 on neurodegenerative diseases in aging. J. Parkinsons Dis. Alzheimers Dis. 1:12. doi: 10.13188/2376-922X.1000003
Grasso, M., Piscopo, P., Talarico, G., Ricci, L., Crestini, A., Tosto, G., et al. (2019). Plasma microRNA profiling distinguishes patients with frontotemporal dementia from healthy subjects. Neurobiol. Aging 84, 240.e1–e12. doi: 10.1016/j.neurobiolaging.2019.01.024
GWAS (2008). GWAS Catalog. Available online at: https://www.ebi.ac.uk/gwas/ (accessed March, 2021).
Hao, K., Di Narzo, A. F., Ho, L., Luo, W., Li, S., Chen, R., et al. (2015). Shared genetic etiology underlying Alzheimer’s disease and type 2 diabetes. Mol. Aspects Med. 43-44, 66–76. doi: 10.1016/j.mam.2015.06.006
Heidari, E., Siavashani, E. S., Rasooli, M., Amiri, Z., Sharifi-Zarchi, A., and Shahpasand, K. (2018). Pin1 regulatory miRNAs as novel candidates for Alzheimer’s disease treatment. bioRxiv [Preprint]. 472985. doi: 10.1101/472985
Hu, Y., Zhao, T., Zang, T., Zhang, Y., and Cheng, L. (2019). Identification of Alzheimer’s disease-related genes based on data integration method. Front. Genet. 9:703. doi: 10.3389/fgene.2018.00703
Hu, Z., Jiao, R., Wang, P., Zhu, Y., Zhao, J., De Jager, P., et al. (2020). Shared causal paths underlying Alzheimer’s dementia and type 2 diabetes. Sci. Rep. 10:4107. doi: 10.1038/s41598-020-60682-3
Huang, S., Xu, Y., Ge, X., Xu, B., Peng, W., Jiang, X., et al. (2019). Long noncoding RNA NEAT1 accelerates the proliferation and fibrosis in diabetic nephropathy through activating Akt/mTOR signaling pathway. J. Cell Physiol. 234, 11200–11207. doi: 10.1002/jcp.27770
Huang, Z., Zhao, J., Wang, W., Zhou, J., and Zhang, J. (2020). Depletion of LncRNA NEAT1 rescues mitochondrial dysfunction through Nedd4L-dependent pink1 degradation in animal models of Alzheimer’s disease. Front. Cell. Neurosci. 14:28. doi: 10.3389/fncel.2020.00028
Human microRNA Disease Database (2007). The Human MicroRNA Disease Database. Available online at: https://www.cuilab.cn/hmdd (accessed August, 2021).
Idda, M. L., Munk, R., Abdelmohsen, K., and Gorospe, M. (2018). Noncoding RNAs in Alzheimer’s disease. Wiley Interdiscip. Rev. RNA 9, 1–13. doi: 10.1002/wrna.1463
Irie, F., Fitzpatrick, A. L., Lopez, O. L., Kuller, L. H., Peila, R., Newman, A. B., et al. (2008). Enhanced risk for Alzheimer disease in persons with type 2 diabetes and APOE epsilon4: The cardiovascular health study cognition study. Arch. Neurol. 65, 89–93. doi: 10.1001/archneurol.2007.29
Kandimalla, R., Thirumala, V., and Reddy, P. H. (2017). Is Alzheimer’s disease a type 3 diabetes? A critical appraisal. Biochimica et biophysica acta. Mol. Basis Dis. 1863, 1078–1089. doi: 10.1016/j.bbadis.2016.08.018
Karki, R., Kodamullil, A. T., and Hofmann-Apitius, M. (2017). Comorbidity analysis between Alzheimer’s disease and type 2 diabetes mellitus (T2DM) based on shared pathways and the role of t2dm drugs. J. Alzheimers Dis. 60, 721–731. doi: 10.3233/JAD-170440
Kleinstein, S. E., Mccorrison, J., Ahmed, A., Hasturk, H., Van Dyke, T. E., and Freire, M. (2019). Transcriptomics of type 2 diabetic and healthy human neutrophils. medRxiv [Preprint]. 19011353. doi: 10.1101/19011353
Kwok, M. K., Lin, S. L., and Schooling, C. M. (2018). Re-thinking Alzheimer’s disease therapeutic targets using gene-based tests. EbioMedicine 37, 461–470. doi: 10.1016/j.ebiom.2018.10.001
Lau, P., Bossers, K., Janky, R., Salta, E., Frigerio, C. S., Barbash, S., et al. (2013). Alteration of the microRNA network during the progression of Alzheimer’s disease. EMBO Mol. Med. 5, 1613–1634. doi: 10.1002/emmm.201201974
Lau, P., Sala Frigerio, C., and De Strooper, B. (2014). Variance in the identification of microRNAs deregulated in Alzheimer’s disease and possible role of lincRNAs in the pathology: The need of larger datasets. Ageing Res. Rev. 17, 43–53. doi: 10.1016/j.arr.2014.02.006
Lee, T. S., Goh, L., Chong, M. S., Chua, S. M., Chen, G. B., Feng, L., et al. (2012). Downregulation of Tomm40 expression in the blood of Alzheimer disease subjects compared with matched controls. J. Psychiatr. Res. 46, 828–830. doi: 10.1016/j.jpsychires.2012.03.006
Lekka, E., and Hall, J. (2018). Noncoding RNAs in disease. FEBS Lett. 592, 2884–2900. doi: 10.1002/1873-3468.13182
Li, J. H., Liu, S., Zhou, H., Qu, L. H., and Yang, J. H. (2014). starBase v2.0: Decoding miRNA-ceRNA, miRNA-ncRNA and protein-RNA interaction networks from large-scale CLIP-Seq data. Nucleic Acids Res. 42, D92–D97. doi: 10.1093/nar/gkt1248
Li, Y., and Kowdley, K. V. (2012). Micrornas in common human diseases. Genomics Proteomics Bioinf. 10, 246–253. doi: 10.1016/j.gpb.2012.07.005
LncBase (2012). LncBase Database. Available online at: https://diana.e-ce.uth.gr/lncbasev3
Lu, R.-C., Yang, W., Tan, L., Sun, F.-R., Tan, M.-S., Zhang, W., et al. (2017). Association of HLA-DRB1 polymorphism with Alzheimer’s disease: A replication and meta-analysis. Oncotarget 8, 93219–93226. doi: 10.18632/oncotarget.21479
Luo, Q., and Chen, Y. (2016). Long noncoding RNAs and Alzheimer’s disease. Clin. Interv. Aging 11, 867–872. doi: 10.2147/CIA.S107037
Ma, Z. J., Sun, P., Guo, G., Zhang, R., and Chen, L. M. (2013). Association of the HLA-DQA1 and HLA-DQB1 alleles in type 2 diabetes mellitus and diabetic nephropathy in the Han ethnicity of China. J. Diabetes Res. 2013:452537. doi: 10.1155/2013/452537
McNay, E. C., and Pearson-Leary, J. (2020). GluT4: A central player in hippocampal memory and brain insulin resistance. Exp. Neurol. 323:113076. doi: 10.1016/j.expneurol.2019.113076
microT (2012). microT Database. Available online at: http://diana.imis.athena-innovation.gr/DianaTools/index.php?r=MicroT_CDS/index (accessed September, 2021).
miRmap (2012). miRmap Database. Available online at: https://mirmap.ezlab.org/ (accessed September, 2021).
miRwalk (2011). miRWalk Database. Available online at: http://mirwalk.umm.uni-heidelberg.de/ (accessed September, 2021).
Mittal, K., and Katare, D. P. (2016). Shared links between type 2 diabetes mellitus and Alzheimer’s disease: A review. Diabetes Metab. Syndr. 10, S144–S149.
Mittal, K., Mani, R. J., and Katare, D. P. (2016). Type 3 diabetes: Cross talk between differentially regulated proteins of type 2 diabetes mellitus and Alzheimer’s disease. Sci. Rep. 6:25589. doi: 10.1038/srep25589
Nagaraj, S., Laskowska-Kaszub, K., Dȩbski, K. J., Wojsiat, J., Da̧browski, M., Gabryelewicz, T., et al. (2017). Profile of 6 microRNA in blood plasma distinguish early stage Alzheimer’s disease patients from non-demented subjects. Oncotarget 8, 16122–16143. doi: 10.18632/oncotarget.15109
Natarajan, S. K., Smith, M. A., Wehrkamp, C. J., Mohr, A. M., and Mott, J. L. (2013). MicroRNA function in human diseases. Med. Epigenet. 1, 106–115. doi: 10.1159/000356447
Nigi, L., Grieco, G. E., Ventriglia, G., Brusco, N., Mancarella, F., Formichi, C., et al. (2018). MicroRNAs as regulators of insulin signaling: Research updates and potential therapeutic perspectives in type 2 diabetes. Int. J. Mol. Sci. 19:3705. doi: 10.3390/ijms19123705
Nunez-Iglesias, J., Liu, C. C., Morgan, T. E., Finch, C. E., and Zhou, X. J. (2010). Joint genome-wide profiling of miRNA and mRNA expression in Alzheimer’s disease cortex reveals altered miRNA regulation. PLoS One 5:e8898. doi: 10.1371/journal.pone.0008898
Peila, R., Rodriguez, B. L., and Launer, L. J. (2002). Type 2 diabetes, APOE gene, and the risk for dementia and related pathologies: The Honolulu-Asia aging study. Diabetes 51, 1256–1262. doi: 10.2337/diabetes.51.4.1256
Russell, M. A., Redick, S. D., Blodgett, D. M., Richardson, S. J., Leete, P., Krogvold, L., et al. (2019). HLA class II antigen processing and presentation pathway components demonstrated by transcriptome and protein analyses of islet β-cells from donors with type 1 diabetes. Diabetes 68, 988–1001. doi: 10.2337/db18-0686
Sathishkumar, C., Prabu, P., Mohan, V., and Balasubramanyam, M. (2018). Linking a role of lncRNAs (long non-coding RNAs) with insulin resistance, accelerated senescence, and inflammation in patients with type 2 diabetes. Hum. Genomics 12:41. doi: 10.1186/s40246-018-0173-3
Shakil, S. (2017). Molecular interaction of anti-diabetic drugs with acetylcholinesterase and sodium glucose co-transporter 2. J. Cell Biochem. 118, 3855–3865. doi: 10.1002/jcb.26036
Sheinerman, K. S., Tsivinsky, V. G., Crawford, F., Mullan, M. J., Abdullah, L., and Umansky, S. R. (2012). Plasma microRNA biomarkers for detection of mild cognitive impairment. Aging (Albany NY) 4, 590–605. doi: 10.18632/aging.100486
Shi, R., Zhang, S., Cheng, G., Yang, X., Zhao, N., and Chen, C. (2018). Ginsenoside Rg1 and acori graminei rhizoma attenuates neuron cell apoptosis by promoting the expression of miR-873-5p in Alzheimer’s disease. Neurochem. Res. 43, 1529–1538. doi: 10.1007/s11064-018-2567-y
Shinohara, M., Tashiro, Y., Suzuki, K., Fukumori, A., Bu, G., and Sato, N. (2020). Interaction between APOE genotype and diabetes in cognitive decline. Alzheimers Dement. (Amst.). 12:e12006. doi: 10.1002/dad2.12006
Sidorkiewicz, I., Niemira, M., Maliszewska, K., Erol, A., Bielska, A., Szalkowska, A., et al. (2020). Circulating miRNAs as a predictive biomarker of the progression from prediabetes to diabetes: Outcomes of a 5-Year prospective observational study. J. Clin. Med. 9:2184. doi: 10.3390/jcm9072184
Silvestro, S., Bramanti, P., and Mazzon, E. (2019). Role of miRNAs in Alzheimer’s disease and possible fields of application. Int. J. Mol. Sci. 20:3979.
Slatkin, M. (2008). Linkage disequilibrium — understanding the evolutionary past and mapping the medical future. Nat. Rev. Genet. 9, 477–485. doi: 10.1038/nrg2361
Spinelli, M., Fusco, S., and Grassi, C. (2019). Brain insulin resistance and hippocampal plasticity: Mechanisms and biomarkers of cognitive decline. Front. Neurosci. 13:788. doi: 10.3389/fnins.2019.00788
Starbase (2010). Starbase database. Available online at: http://starbase.sysu.edu./cn (accessed March, 2021).
Sultana, R., Boyd-Kimball, D., Poon, H. F., Cai, J., Pierce, W. M., Klein, J. B., et al. (2006). Oxidative modification and down-regulation of Pin1 in Alzheimer’s disease hippocampus: A redox proteomics analysis. Neurobiol. Aging 27, 918–925. doi: 10.1016/j.neurobiolaging.2005.05.005
TargetScan (2005). Target Scan Human Database. Available online at: http://www.targetscan.org/vert_72 (accessed September, 2021).
Vlachos, I. S., Zagganas, K., Paraskevopoulou, M. D., Georgakilas, G., Karagkouni, D., Vergoulis, T., et al. (2015). DIANA-miRPath v3.0: Deciphering microRNA function with experimental support. Nucleic Acids Res. 43, W460–W466. doi: 10.1093/nar/gkv403
Wang, M., Qin, L., and Tang, B. (2019). MicroRNAs in Alzheimer’s disease. Front. Genet. 10:665. doi: 10.3389/fphar.2019.00665
Wennberg, A. M., Spira, A. P., Pettigrew, C., Soldan, A., Zipunnikov, V., Rebok, G. W., et al. (2016). Blood glucose levels and cortical thinning in cognitively normal, middle-aged adults. J. Neurol. Sci. 365, 89–95. doi: 10.1016/j.jns.2016.04.017
Williams, R. C., Muller, Y. L., Hanson, R. L., Knowler, W. C., Mason, C. C., Bian, L., et al. (2011). HLA-DRB1 reduces the risk of type 2 diabetes mellitus by increased insulin secretion. Diabetologia 54, 1684–1692. doi: 10.1007/s00125-011-2122-8
Yan, S. T., Li, C. L., Tian, H., Li, J., Pei, Y., Liu, Y., et al. (2014). MiR-199a is overexpressed in plasma of type 2 diabetes patients which contributes to type 2 diabetes by targeting GLUT4. Mol. Cell Biochem. 397, 45–51. doi: 10.1007/s11010-014-2170-8
Yang, Z. M., Chen, L. H., Hong, M., Chen, Y. Y., Yang, X. R., Tang, S. M., et al. (2017). Serum microRNA profiling and bioinformatics analysis of patients with type 2 diabetes mellitus in a Chinese population. Mol. Med. Rep. 15, 2143–2153. doi: 10.3892/mmr.2017.6239
Yue, D., Guanqun, G., Jingxin, L., Sen, S., Shuang, L., Yan, S., et al. (2020). Silencing of long noncoding RNA XIST attenuated Alzheimer’s disease-related BACE1 alteration through miR-124. Cell Biol. Int. 44, 630–636. doi: 10.1002/cbin.11263
Zhao, Y., Wang, Z., Mao, Y., Li, B., Zhu, Y., Zhang, S., et al. (2019). NEAT1 involves Alzheimer’s disease (AD) progression via regulation of glycolysis and P-tau. bioRxiv [Preprint]. 643718. doi: 10.1101/643718
Keywords: biomarker detection, Alzheimer’s disease (AD), diabetes mellitus (DM), type 3 diabetes mellitus, brain diabetes, genome wide association study, non-coding RNA, bioinformatics
Citation: Ghiam S, Eslahchi C, Shahpasand K, Habibi-Rezaei M and Gharaghani S (2022) Exploring the role of non-coding RNAs as potential candidate biomarkers in the cross-talk between diabetes mellitus and Alzheimer’s disease. Front. Aging Neurosci. 14:955461. doi: 10.3389/fnagi.2022.955461
Received: 28 May 2022; Accepted: 04 August 2022;
Published: 24 August 2022.
Edited by:
Yoana Rabanal, University of Castilla-La Mancha, SpainReviewed by:
Muhammad Jawad Khan, COMSATS University, PakistanRoger Gutiérrez-Juárez, National Autonomous University of Mexico, Mexico
Copyright © 2022 Ghiam, Eslahchi, Shahpasand, Habibi-Rezaei and Gharaghani. This is an open-access article distributed under the terms of the Creative Commons Attribution License (CC BY). The use, distribution or reproduction in other forums is permitted, provided the original author(s) and the copyright owner(s) are credited and that the original publication in this journal is cited, in accordance with accepted academic practice. No use, distribution or reproduction is permitted which does not comply with these terms.
*Correspondence: Sajjad Gharaghani, cy5naGFyYWdoYW5pQHV0LmFjLmly; Changiz Eslahchi, Y2gtZXNsYWhjaGlAc2J1LmFjLmly
 Shokoofeh Ghiam
 Changiz Eslahchi
 Koorosh Shahpasand
 Mehran Habibi-Rezaei
 Sajjad Gharaghani