 Mei-dan Wan1
 Hui Liu1Xi-xi Liu1
 Wei-wei Zhang2
 Xue-wen Xiao1
 Si-zhe Zhang1
 Ya-ling Jiang1Hui Zhou1
 Xin-xin Liao3,4,5
 Ya-fang Zhou3,4,5
 Bei-sha Tang1,3,4,6,7
 Jun-Ling Wang1,3,4,6,7
 Ji-feng Guo1,3,4,6,7
 Bin Jiao1,3,4,6,7*
 Lu Shen1,3,4,6,7,8*
- 1Department of Neurology, Xiangya Hospital, Central South University, Changsha, China
- 2Department of Radiology, Xiangya Hospital, Central South University, Changsha, China
- 3National Clinical Research Center for Geriatric Disorders, Central South University, Changsha, China
- 4Key Laboratory of Hunan Province in Neurodegenerative Disorders, Central South University, Changsha, China
- 5Department of Geriatrics, Xiangya Hospital, Central South University, Changsha, China
- 6Engineering Research Center of Hunan Province in Cognitive Impairment Disorders, Central South University, Changsha, China
- 7Hunan International Scientific and Technological Cooperation Base of Neurodegenerative and Neurogenetic Diseases, Changsha, China
- 8Key Laboratory of Organ Injury, Aging and Regenerative Medicine of Hunan Province, Changsha, China
The relationships between multiple visual rating scales based on structural magnetic resonance imaging (sMRI) with disease severity and cerebrospinal fluid (CSF) biomarkers in patients with Alzheimer’s disease (AD) were ambiguous. In this study, a total of 438 patients with clinically diagnosed AD were recruited. All participants underwent brain sMRI scan, and medial temporal lobe atrophy (MTA), posterior atrophy (PA), global cerebral atrophy-frontal sub-scale (GCA-F), and Fazekas rating scores were visually evaluated. Meanwhile, disease severity was assessed by neuropsychological tests such as the Mini-Mental State Examination (MMSE), Montreal Cognitive Assessment (MoCA), and Clinical Dementia Rating (CDR). Among them, 95 patients were tested for CSF core biomarkers, including Aβ1–42, Aβ1–40, Aβ1–42/Aβ1–40, p-tau, and t-tau. As a result, the GCA-F and Fazekas scales showed positively significant correlations with onset age (r = 0.181, p < 0.001; r = 0.411, p < 0.001, respectively). Patients with late-onset AD (LOAD) showed higher GCA-F and Fazekas scores (p < 0.001, p < 0.001). With regard to the disease duration, the MTA and GCA-F were positively correlated (r = 0.137, p < 0.05; r = 0.106, p < 0.05, respectively). In terms of disease severity, a positively significant association emerged between disease severity and the MTA, PA GCA-F, and Fazekas scores (p < 0.001, p < 0.001, p < 0.001, p < 0.05, respectively). Moreover, after adjusting for age, gender, and APOE alleles, the MTA scale contributed to moderate to severe AD in statistical significance independently by multivariate logistic regression analysis (p < 0.05). The model combining visual rating scales, age, gender, and APOE alleles showed the best performance for the prediction of moderate to severe AD significantly (AUC = 0.712, sensitivity = 51.5%, specificity = 84.6%). In addition, we observed that the MTA and Fazekas scores were associated with a lower concentration of Aβ1–42 (p < 0.031, p < 0.022, respectively). In summary, we systematically analyzed the benefits of multiple visual rating scales in predicting the clinical status of AD. The visual rating scales combined with age, gender, and APOE alleles showed best performance in predicting the severity of AD. MRI biomarkers in combination with CSF biomarkers can be used in clinical practice.
Introduction
Alzheimer’s disease (AD) is the main type of dementia, which not only causes huge social and economic burden but also seriously affect the health and quality of life of patients (Pimenova et al., 2018). Early diagnosis of AD is critical to decelerating the progress of the disease (Avila and Perry, 2021; Wan et al., 2022). Currently, the definitive diagnosis of AD relies mostly on CSF core biomarker analysis, positron emission tomography (PET) of tracer molecules, and neuropsychological tests. However, the high invasiveness of CSF and expensive costs of PET limit their wide application in clinical practice (Bateman et al., 2020; Khan et al., 2020). As a non-invasive means of AD diagnosis, structural magnetic resonance imaging (sMRI) is constantly used for early diagnosis and severity evaluation of AD (Fan et al., 2022; Zhang et al., 2022). For example, MRI is used to show patterns of brain damage and differentiate AD from other brain diseases (Chandra et al., 2019).
Alzheimer’s disease patients are found to have severe atrophy compared with cognitively normal subjects, and the atrophy degree increases with AD pathological alteration (Schwarz et al., 2016; Mårtensson et al., 2020). AD brain atrophy was mainly reported as medial temporal and parietal atrophy patterns (Kaye et al., 2005; Caspers et al., 2021). Thus, multiple visual rating scales, including medial temporal lobe atrophy (MTA), posterior atrophy (PA), global cerebral atrophy-frontal sub-scale (GCA-F), and Fazekas, play important roles in evaluating different brain variations and atrophy with AD (Harper et al., 2015, 2016; Rhodius-Meester et al., 2017). The MTA scale was put forward by Scheltens to evaluate in 1992 (Scheltens et al., 1992). Koedam et al. (2011) put forward PA in 2011, focusing on the structural changes of the posterior cingulate sulcus, parieto-occipital sulcus, precuneus, and parietal cortex. The GCA-F has been gradually applied to distinguish AD and other dementia (Scheltens et al., 1997; Zhu et al., 2021). AD patients were proved to have more severe whole white matter lesions (WMLs) than cognitively normal subjects, which could be evaluated by the Fazekas scale (Fazekas et al., 1987; McAleese et al., 2017; Zhu et al., 2021). Some previous studies used visual rating scales to build a model for predicting and diagnosing AD, identifying patients with AD from normal aging (Sheng et al., 2020), or distinguishing early- and late-onset AD (Yuan et al., 2019; Park et al., 2021; Silhan et al., 2021). Mao et al. (2021) reported that MTA was positively correlated with the age of patients with AD, rather than PA in a cohort of 112 AD patients; however, they did not report a correlation between visual rating scales and disease severity. There are no studies yet conducted to identify which of these scales have a significant advantage in detecting onset age and disease duration and which can be the best predictor of AD severity.
Cerebrospinal fluid (CSF) biomarkers are known as diagnostic tools for AD. Classic AD CSF biomarkers are characterized by low concentrations of amyloid-β (Aβ)1–42 and high concentrations of phosphorylated tau181p (p-tau) and total tau (t-tau) (Olsson et al., 2016; Jack et al., 2018). CSF biomarkers are great diagnostic tools for early onset cognitive impairment, and Joachim et al. (2018) reported that mild cognitive impairment (MCI) patients with a lower CSF Aβ1–42 level had higher risk of progressing to dementia, and CSF t-tau is mainly correlated to the progression of neurodegeneration. Recently, combinations of sMRI and CSF biomarkers are recommended for clinical diagnosis. Previous studies showed that in patients with low concentrations of Aβ1–42, sMRI biomarkers such as MTA and PA could predict MCI progression to AD (Van Rossum et al., 2012; Pyun et al., 2017), and also PA was associated with high levels of t-tau and p-tau (Lehmann et al., 2013). Thus, we aim to identify which visual rating scale is most consistent with CSF core biomarkers.
The current study is to determine the correlation of multiple visual rating scales (including MTA, PA, GCA-F, and Fazekas scales) with different clinical status, severity, and CSF of AD, and whether multiple visual rating scales can predict the stage of AD in a large Chinese south cohort.
Materials and methods
Subjects
A total of 438 AD patients (female: 266; onset age: 62.07 ± 10.113 years; age: 64.77 ± 9.99 years; disease duration: 2.723 ± 2.220; Mini-Mental State Examination (MMSE): 13.22 ± 6.290; Montreal Cognitive Assessment (MoCA): 8.336 ± 5.258; Clinical Dementia Rating (CDR): 1.282 ± 0.542) were recruited from the Department of Neurology, Xiangya Hospital, Central South University, between 2017 and 2021. The inclusion criteria for patients were as follows: (1) significant cognitive decline; (2) accessible to conduct physical examination and neuropsychological tests; (3) brain atrophy confirmed by MRI; and (4) all patients were “probable AD” diagnosed by the National Institute of Neurological and Communicative Disorders and Stroke and the Alzheimer’s Disease and Related Disorders Association (NINCDS-ADRDA) criteria. The exclusion criteria were as follows: (1) brain organic or functional disease; (2) cannot cooperate with MRI scanning, physical examination and neuropsychological tests; and (3) hypertension, diabetes, hyperhomocysteinemia, or other systemic diseases. Among them, all participants were evaluated by two experienced neurologists using the MMSE, MoCA, and CDR. The study was approved by the Ethics Committee of Xiangya Hospital, Central South University (equivalent to an institutional review board). All participants or guardians provided written informed consent.
Magnetic resonance imaging study
Brain magnetic resonance imaging (MRI) was obtained from a 3.0 T MRI scanner (Signa EXCITE, General Electric, Fairfield, Connecticut, United States). Volumetric (3D) T1-weighted images were acquired, with thickness/gap = 3/1 mm, echo time (TE) = 30 ms, pulse repetition time (TR) = 2,000 ms, TI = 380 ms, flip angle = 90, matrix = 64 × 64, field of view (FOV) = 220 mm × 220 mm, and voxel size = 0.5 mm × 0.5 mm × 0.5 mm. T1-weighted sequence, T1-weighted coronal thin layer scanning, T2-weighted sequence, and T2 FLAIR sequence were all collected.
Medial temporal lobe atrophy
The MTA scale is defined in the hippocampus, parahippocampal gyrus, and surrounding CSF spaces. It ranks the degree of MTA from 0 to 4, with grade 0 denoting no cortical atrophy; grade 1, enlargement of choroid fissure; grade 2, along with enlargement of the temporal horn of the lateral ventricle; grade 3, moderate loss of hippocampal volume; and grade 4, severe loss of hippocampal volume (Scheltens et al., 1992).
Posterior atrophy
The PA scale is defined in the posterior cingulate sulcus, parieto-occipital sulcus, precuneus, and parietal cortex. It ranks atrophy from 0 to 3, with grade 0 showing no cortical atrophy; grade 1, mild parietal cortical atrophy, with mild enlargement of the posterior cingulate and parieto-occipital sulcus; grade 2, substantial parietal atrophy, with substantial enlargement of the posterior cingulate and parieto-occipital sulcus; grade 3, end-stage “knife-blade” atrophy, with extreme enlargement of the posterior cingulate and parieto-occipital sulcus (Koedam et al., 2011).
Global cerebral atrophy-frontal sub-scale
The GCA-F is defined in the frontal cortex and sulcal. It ranks 0 to 3, with grade 0 representing no cortical atrophy; grade 1, mild atrophy (dilatation of sulci); grade 2, moderate atrophy (loss of gyri volume); and grade 3, end-stage “knife blade atrophy” (Zhu et al., 2021).
Fazekas scale
The Fazekas scale is defined in the whole WMLs. It ranks 0–3, with grade 0 showing no or single (max 3) punctate lesion; grade 1, multiple (≥3) punctate lesions; grade 2, beginning confluency of lesions (bridging); and grade 3, large confluent lesions (Fazekas et al., 1987).
In total, two experienced neurologists were trained on the consistency of visual rating scale evaluation; 379 MTA, 437 PA, 438 GCA-F, and 438 Fazekas rating scores were evaluated by two experienced neurologists independently, who were blinded to clinical and demographic information.
Apolipoprotein E genotyping
The venous blood was collected from 397 patients in tubes containing ethylenediaminetetraacetic acid (EDTA). Genomic DNA was extracted by using the standard phenol-chloroform extraction method. All DNA samples were diluted to 50 ng/μl. A 581-bp fragment was amplified by the following primers: forward 5′-CCTACAAATCGGAACTGG-3′ and reverse 5′-CTCGAACCAGCTCTTGAG-3′. PCR was performed as previous methods (Jiao et al., 2014). Each PCR product was sequenced by using an ABI 3730xl DNA analyzer (ABI, Louis, MO, United States).
Cerebrospinal fluid biomarker collection and analysis
The CSF was obtained from lumbar puncture samples, and 95 patients (female: 58; onset age: 55.82 ± 8.34 years; age: 58.56 ± 7.93 years; disease duration: 2.760 ± 2.172; MMSE: 12.76 ± 6.085; MoCA: 7.888 ± 5.129; CDR: 1.259 ± 0.560) were tested for CSF core biomarkers voluntarily. All analyses of CSF biomarkers (Aβ1–42, Aβ1–40, t-tau, and p-tau) were measured by enzyme-linked immunosorbent assay (ELISA) and performed by experienced technicians in strict accordance with the instructions of the manufacturer. Specifically, the Aβ1–42 level in CSF < 550 pg/ml, or Aβ1–42/1–40 ratio ≤0.1, is defined as positive amyloidosis; p-tau > 61 pg/ml in CSF is defined as neurofibrillary tangles; t-tau ≥ 452 pg/ml in CSF is defined as nerve cell death (Jiao et al., 2021).
Statistical analysis
Quantitative statistics (onset age, age, disease duration, scores on the MMSE, MoCA, CDR) were described as the mean and standard deviation. Categorical statistic (gender) was described as proportions. The Mann–Whitney U-test and Kruskal–Wallis H-test were applied for non-normally distributed statistical variable comparisons, and independent-sample t-tests or ANOVA was applied for the normally distributed continuous variable comparisons. In addition, the chi-square tests were applied for categorical variable comparisons. The partial correlation analysis was performed for the correlation of visual rating scales and AD onset age, age, disease duration, and neuropsychological assessment scales of AD patients with age, gender, and APOE allele adjustment. The prediction of visual rating scales to AD severity was performed using multivariate logistic regression analysis with age, gender, and APOE alleles adjustment and receiver operating characteristic (ROC) curve analysis. The area under the curve (AUC) and representative optimal sensitivity and specificity were conducted to evaluate the performance of the models. The statistical significance of the difference in AUCs was analyzed by Delong’s test. The statistical analysis was achieved by SPSS version 25.0, R version 4.2.1., and GraphPad prism 8.0. P < 0.05 was considered significant.
Results
Demographics and single visual rating scale values in Alzheimer’s disease
Demographic features and MTA scores of the samples are shown in Table 1. When patients were dichotomized into four groups by MTA scores, significantly higher MTA scores were found in patients with the following status: older age (p < 0.05), longer disease duration (p < 0.001), and worse cognition (p < 0.001). Cognition was evaluated by using the MMSE, MoCA, and CDR; all are proved in the progression of AD. The correlation between the MTA scores and AD characteristics is shown in Table 2. MTA scores had a positive correlation with the age and disease duration, and the correlation coefficients range were 0.141 and 0.137 (p < 0.001, p < 0.05, respectively). Disease severity had a positive correlation with the MTA degree, such that patients with a lower MMSE and MoCA scores had a high MTA degree, and the correlation coefficients were −0.361 and −0.301 (p < 0.001, p < 0.001, respectively). Higher CDR scores had a high MTA degree, and the correlation coefficient was 0.372 (p < 0.001).
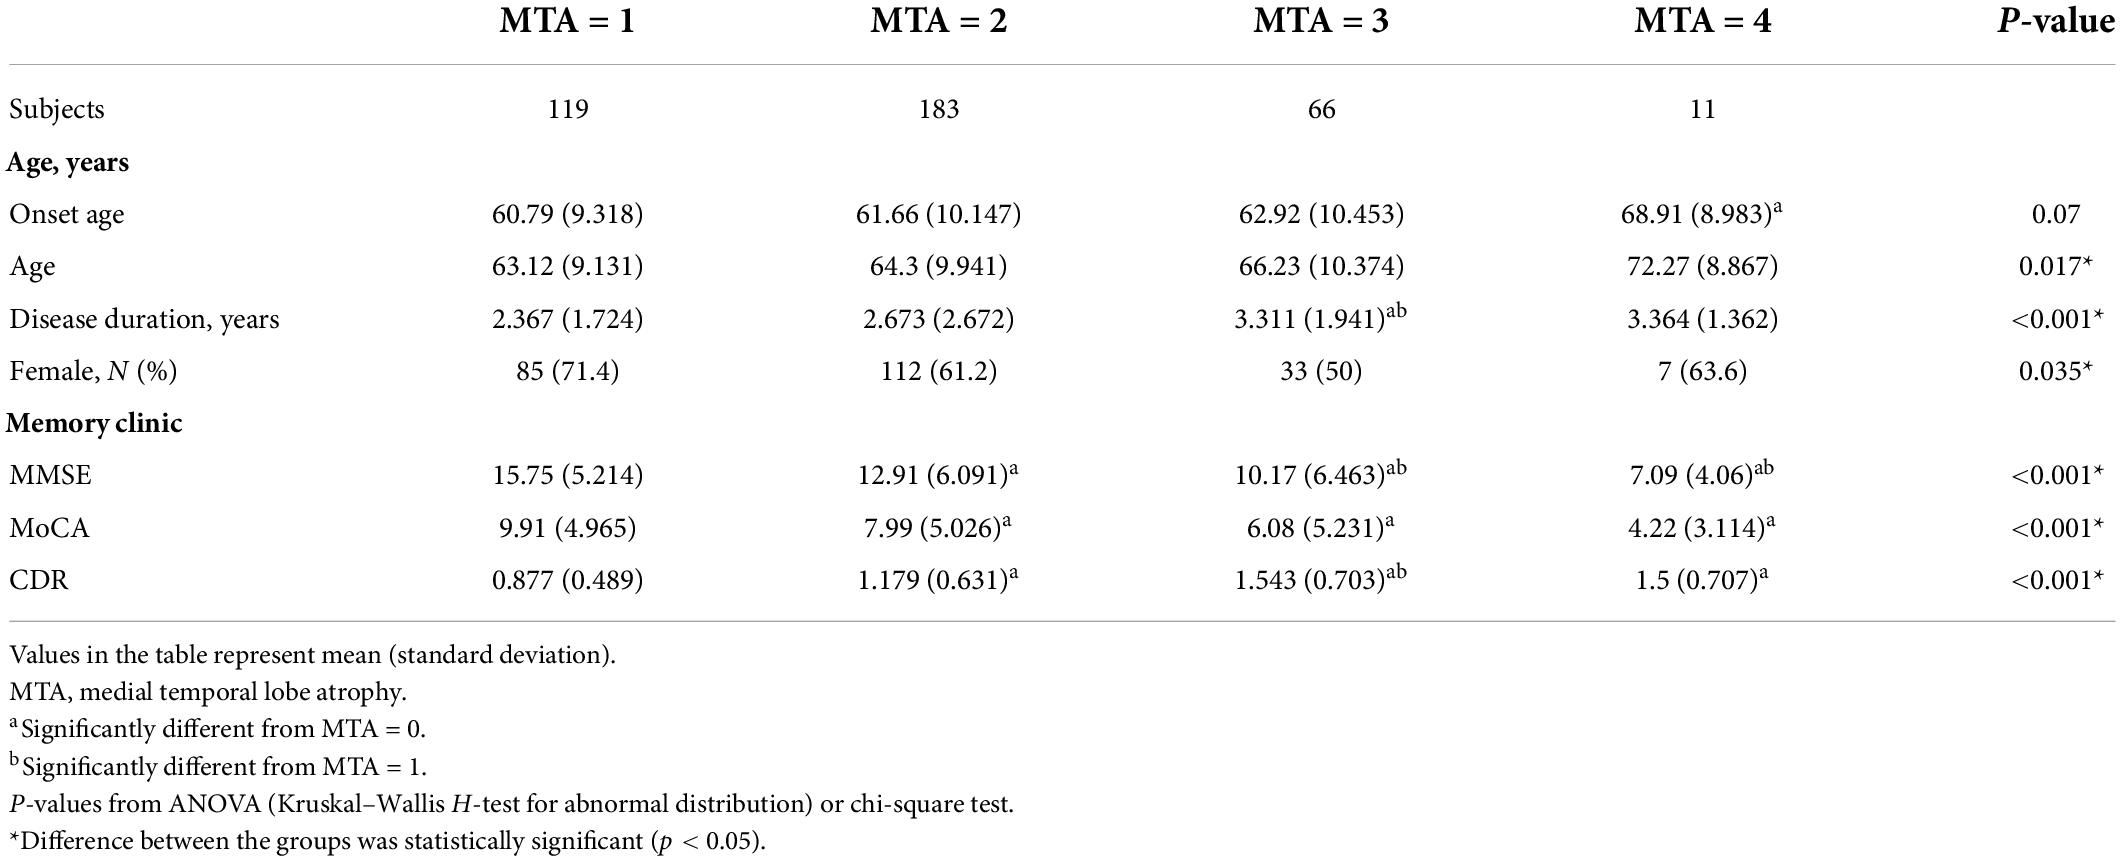
Table 1. Demographic features and MTA scores of the samples.
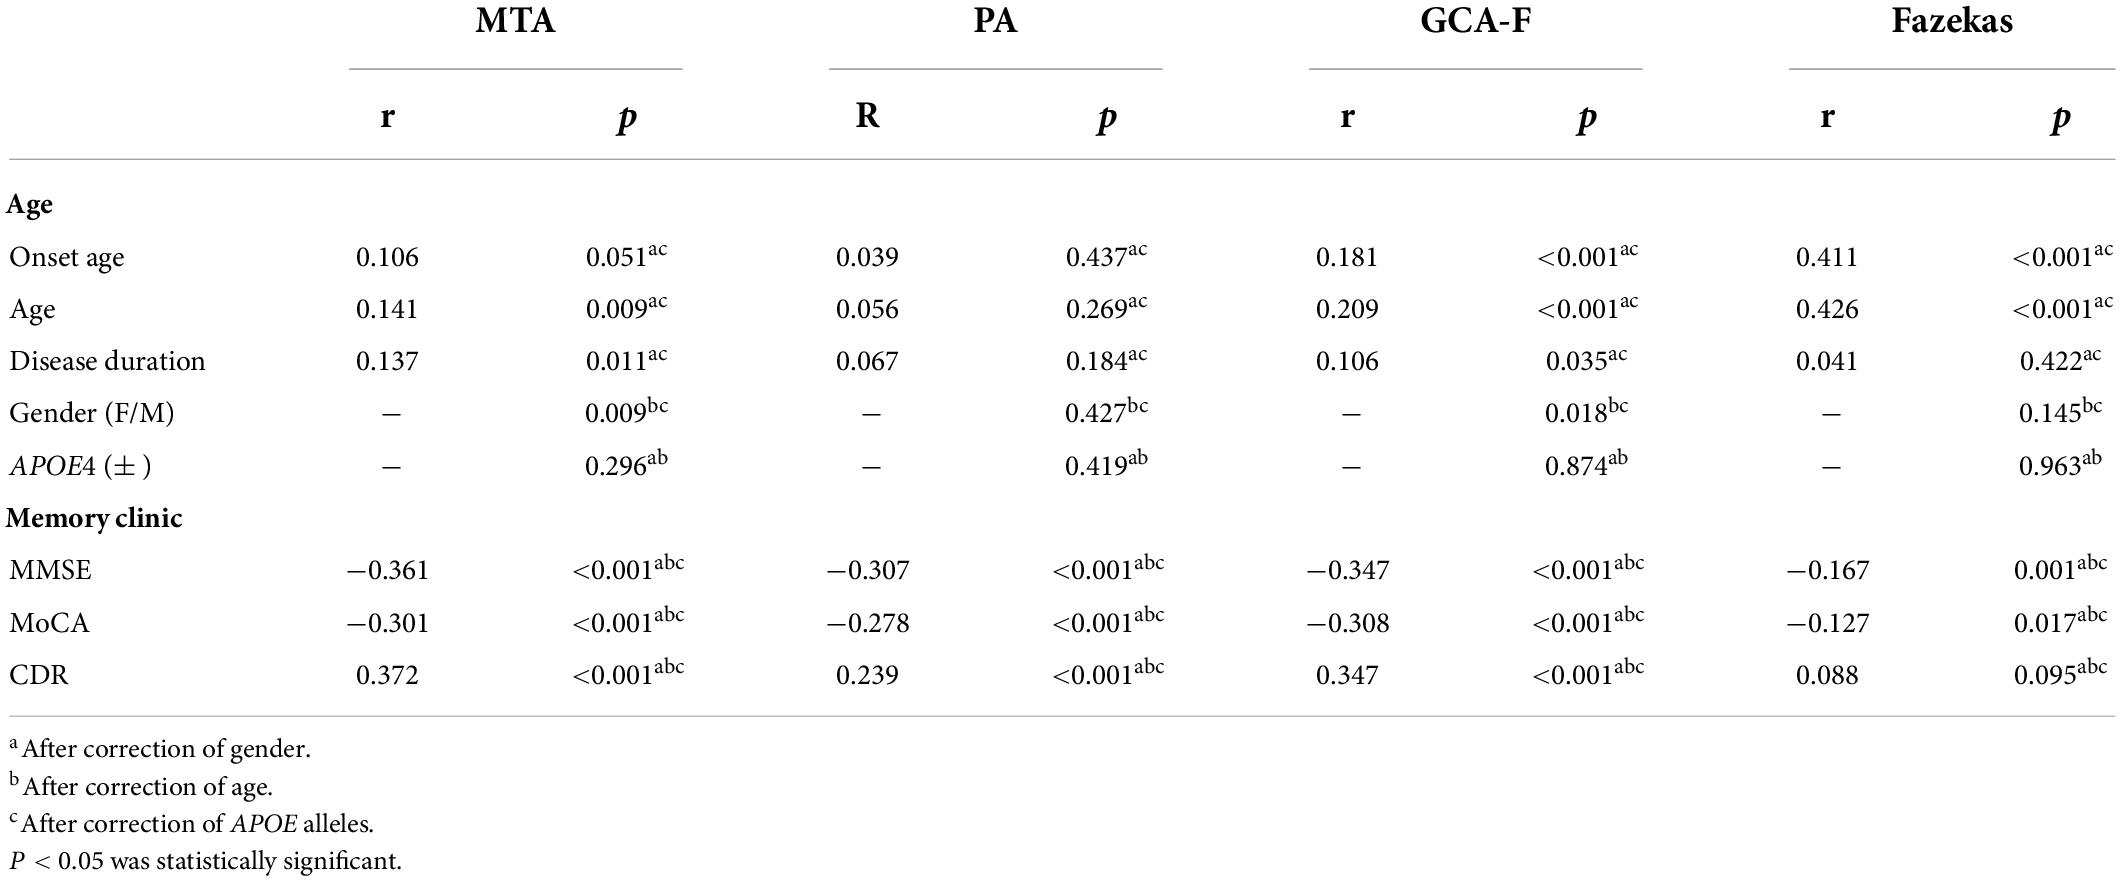
Table 2. Correlation analysis between each visual rating scale and AD status.
The demographic features and PA scale of the samples are shown in Table 3. The disease duration, MMSE, MoCA, and CDR were differently distributed among the different PA scores (p < 0.001, p < 0.001, p < 0.001, p < 0.001, respectively). From correlation analysis, disease severity also had a positive correlation with the PA score. The correlation coefficients of the MMSE and MoCA were −0.307 and −0.278, and the correlation coefficient of CDR was 0.239 (p < 0.001; Table 2).
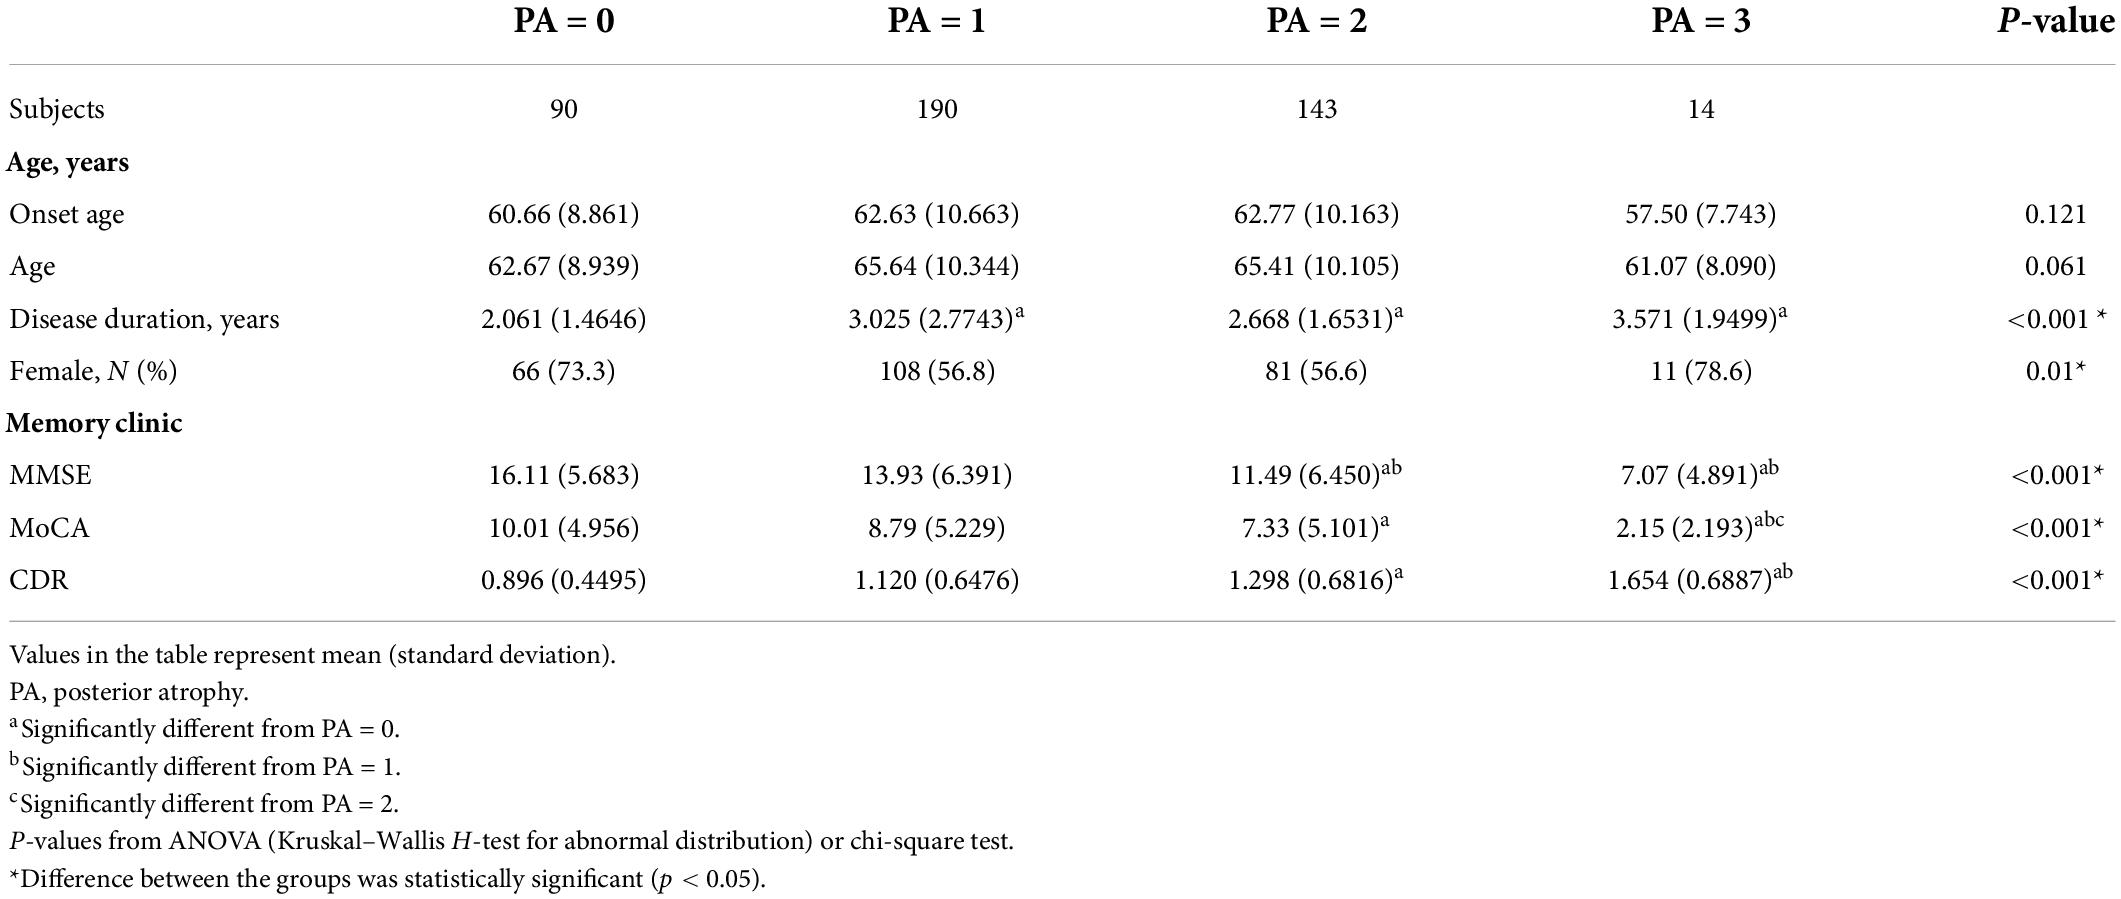
Table 3. Demographic features and PA scale of the samples.
The demographic features and GCA-F scale of the samples are shown in Table 4. Patients with severe GCA-F scores showed later onset age (p < 0.001) and older age (p < 0.001), as well as longer disease duration significantly (p < 0.01). Patients with severe frontal cerebral atrophy underwent severe AD, which was performed in the MMSE, MoCA, and CDR significantly (p < 0.001, p < 0.001, p < 0.01, respectively). Significant associations were observed between GCA-F scores and onset age, and age and disease duration. The correlation coefficient range was 0.106∼0.209 and in statistical significance (p < 0.001, p < 0.001, p < 0.05, respectively). The gender of patients showed a significant correlation with global cerebral-frontal atrophy, and male gender was in close correlation with severe atrophy (p < 0.01). AD severity had a positive correlation with GCA scores. The correlation coefficients of the MMSE and MoCA were −0.347 and −0.308, and the correlation coefficient of CDR was 0.347 (p < 0.001; Table 2).
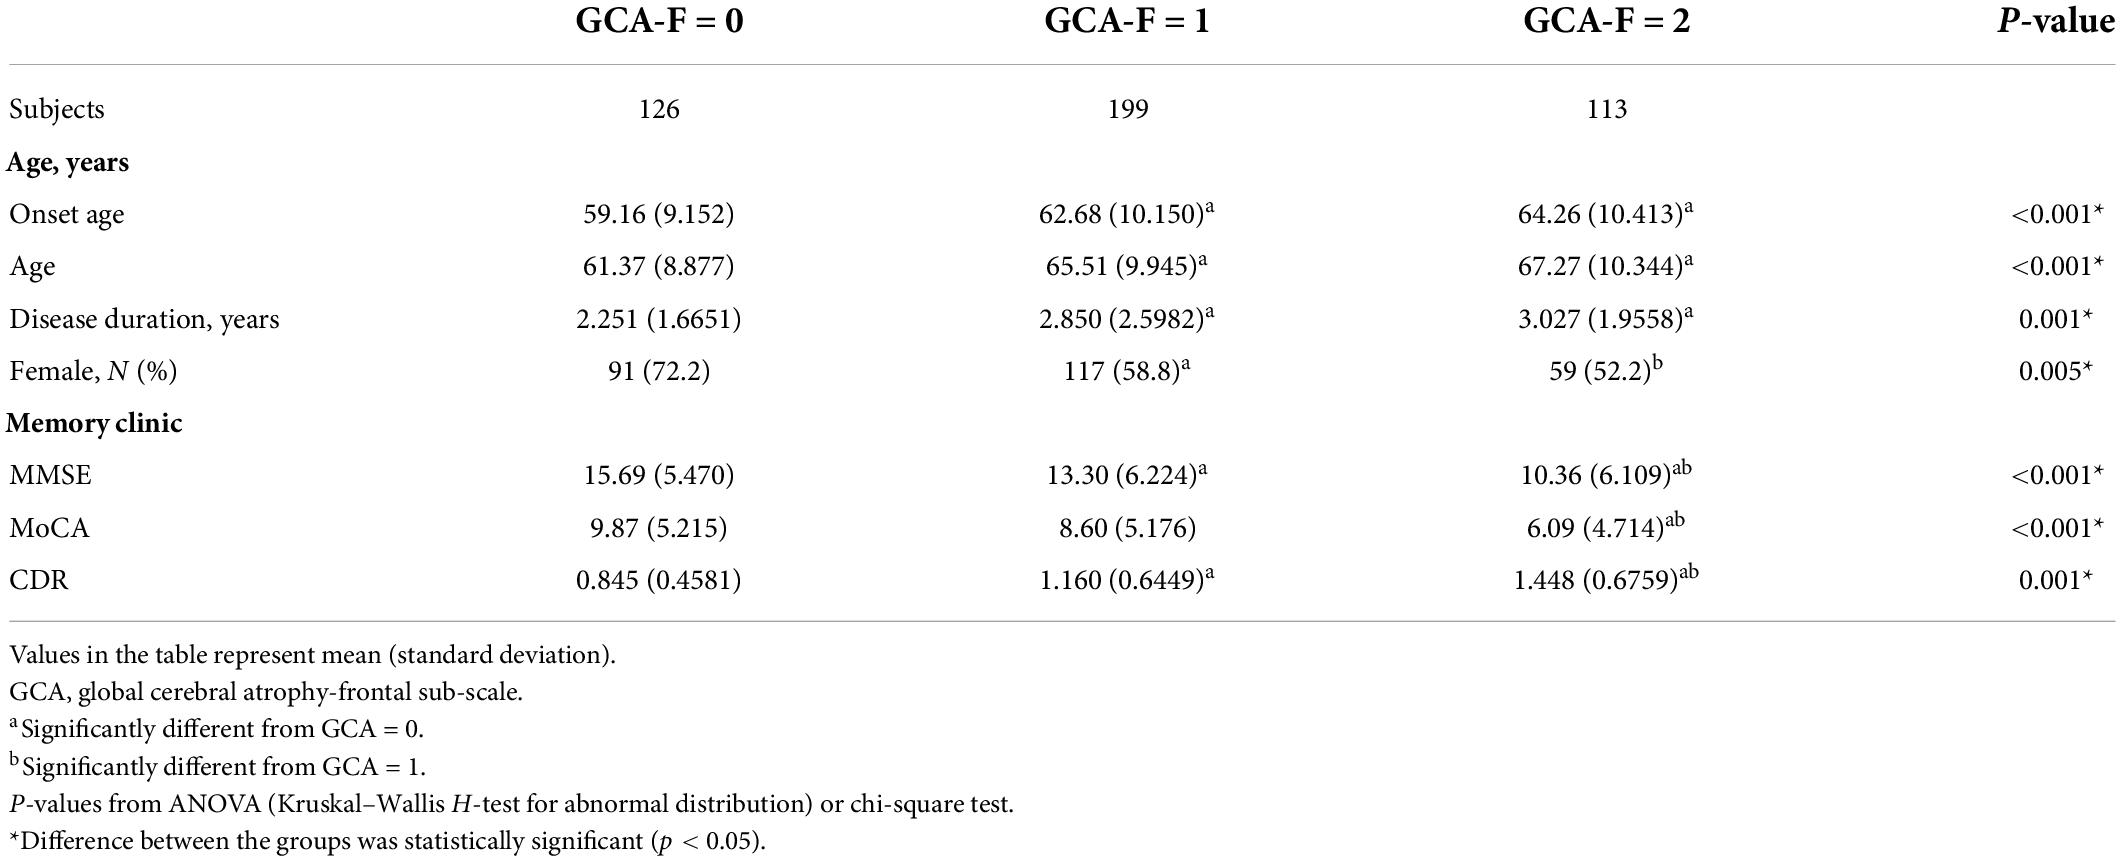
Table 4. Demographic features and GCA-F scale of the samples.
Demographic features and Fazekas of the samples are shown in Table 5. Patients with deteriorative WMLs showed later onset age (p < 0.001) and older age (p < 0.001) in statistical significance. Patients with higher Fazekas scores may undergo severe AD. A significant positively correlation was found between the Fazekas score and onset age and age (p < 0.001, p < 0.001). The correlation coefficients were 0.411 and 0.426. AD severity had a mild positive correlation with WMLs by the partial correlation analysis, and the correlation coefficients of the MMSE and MoCA were −0.167 and −0.127 (p < 0.01, p < 0.05, respectively; Table 2).
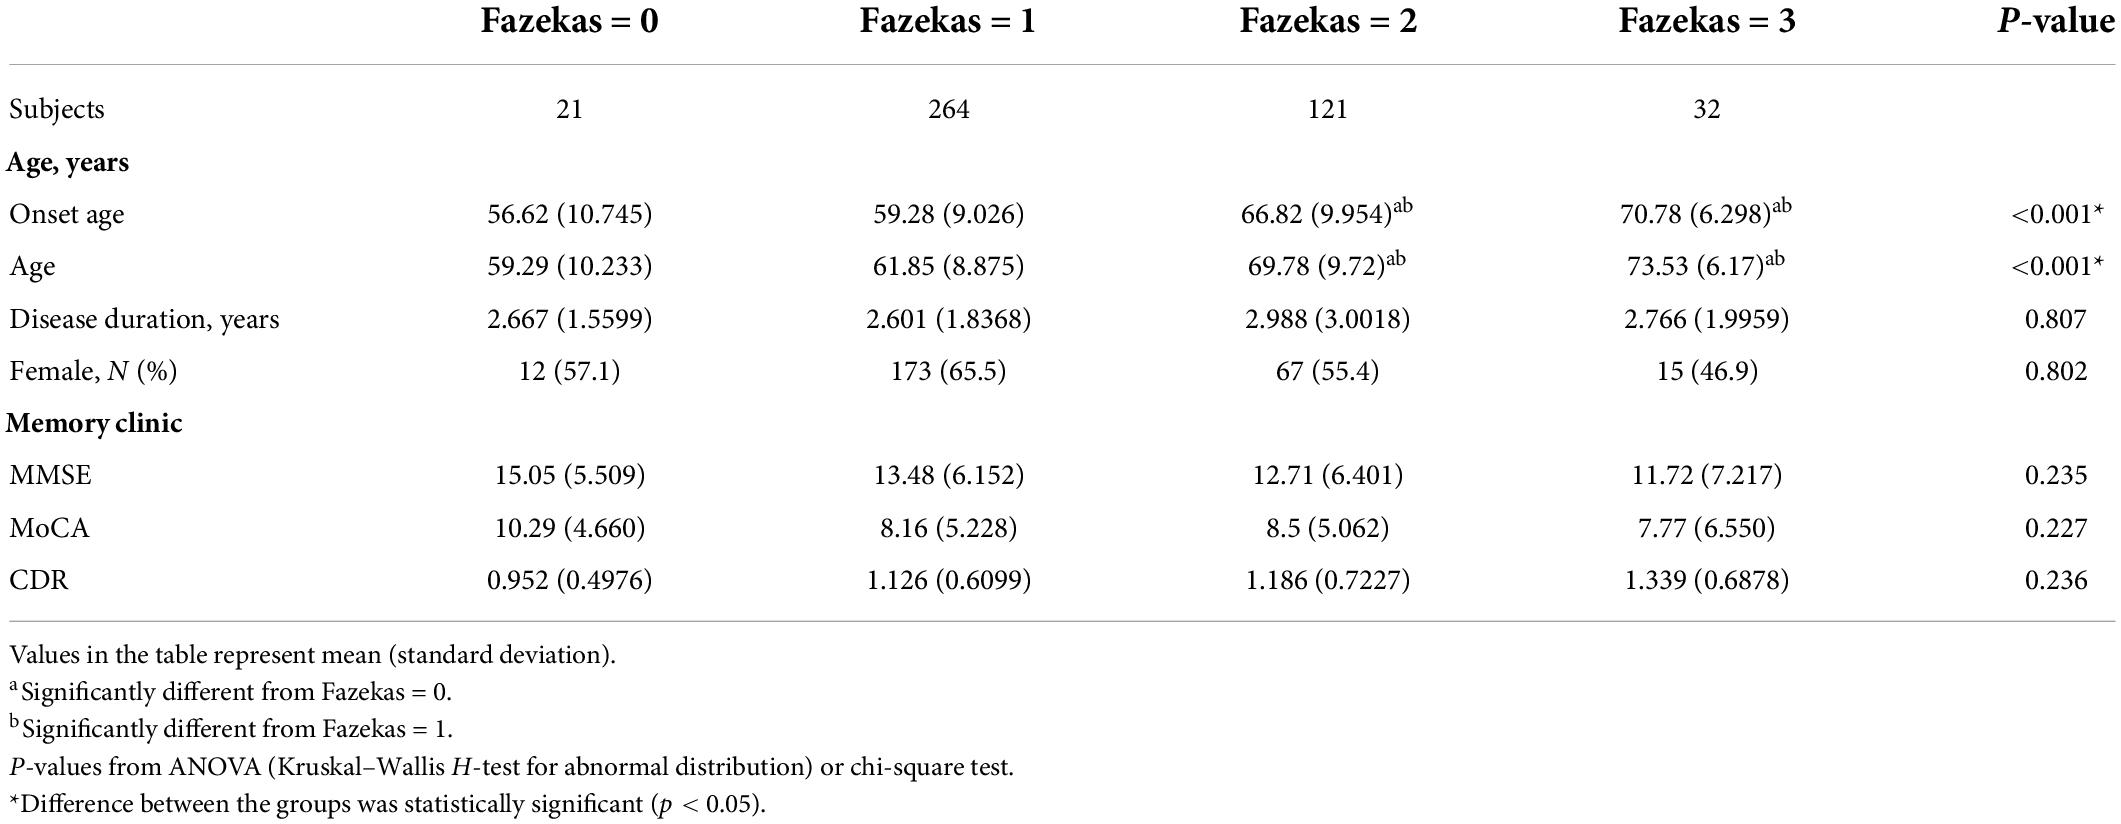
Table 5. Demographic features and Fazekas of the samples.
The 438 AD patients were divided into two groups according to the onset age: disease started before the age of 65 years was early onset AD (EOAD) and the other was late-onset AD (LOAD). Table 6 shows the characteristics of patients with EOAD compared to patients with LOAD. Patients with EOAD had worse cognitive function as measured by the MMSE and MoCA (p < 0.01, p < 0.001). In addition, patients with LOAD showed severe global cerebral atrophy and WMLs (p < 0.001, p < 0.001). The levels of CSF biomarkers were comparable among groups.
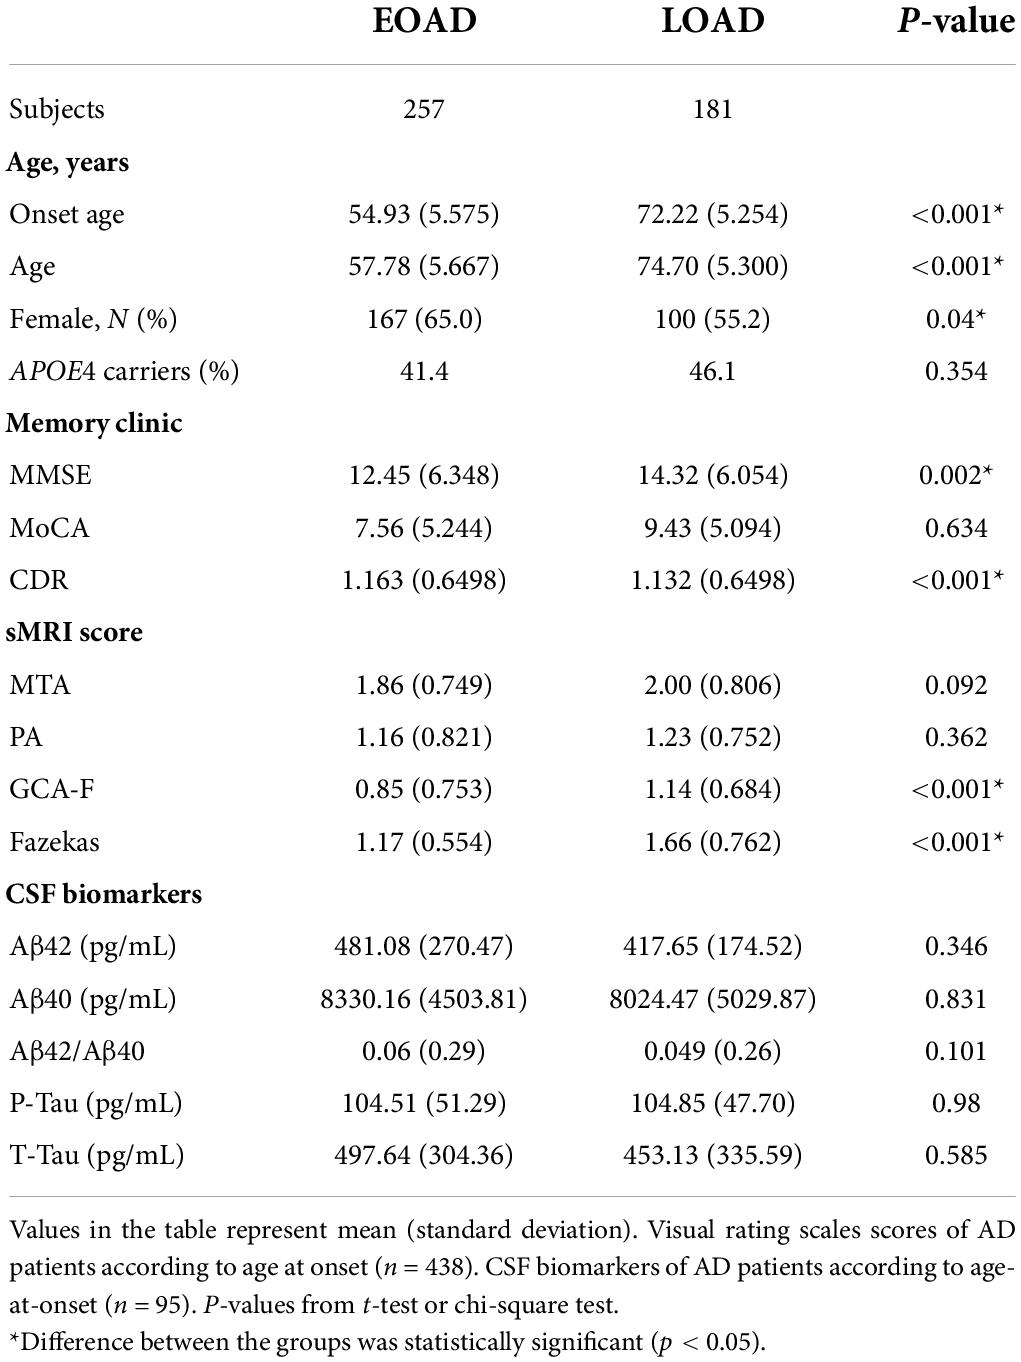
Table 6. Characteristics of AD patients according to age at onset.
The value of visual rating scales in the prediction of Alzheimer’s disease severity
The participants with AD were divided into two groups (133 mild AD patients, 302 moderate to severe AD patients) according to the MMSE scores. Mild AD was 18 points ≤ MMSE ≤ 23 points and moderate to severe AD was MMSE < 18 points (Yuan et al., 2019). The average age of mild AD patients was 66.26 ± 10.314, and the average age of moderate to severe AD patients was 64.12 ± 9.842. The proportion of female patients with mild AD was 54.1, and the proportion of female patients in moderate to severe AD was 64.2. We used multivariate logistic regression analysis to explore the value of rating scales in the prediction of the severity of AD, after adjusting for age, gender, and APOE alleles (Figure 1). Logistic regression analysis showed that female gender contributed statistical significance to the discrimination between mild and moderate to severe AD (B = 0.577, p < 0.05). The MTA scale was the only scale that contributed to moderate to severe AD in statistical significance independently (p < 0.05). Moreover, ROC curves were generated to evaluate the performance of the visual rating scales to predict the moderate to severe AD from mild AD (Figure 2). As a single scale, MTA showed best predictive efficacy (AUC = 0.622, sensitivity = 74%, specificity = 44.6%). After incorporating age, gender, APOE alleles, PA, GCA-F, and Fazekas into the model, the model showed best performance for the prediction of moderate to severe AD (AUC = 0.712, sensitivity = 51.5%, specificity = 84.6%).
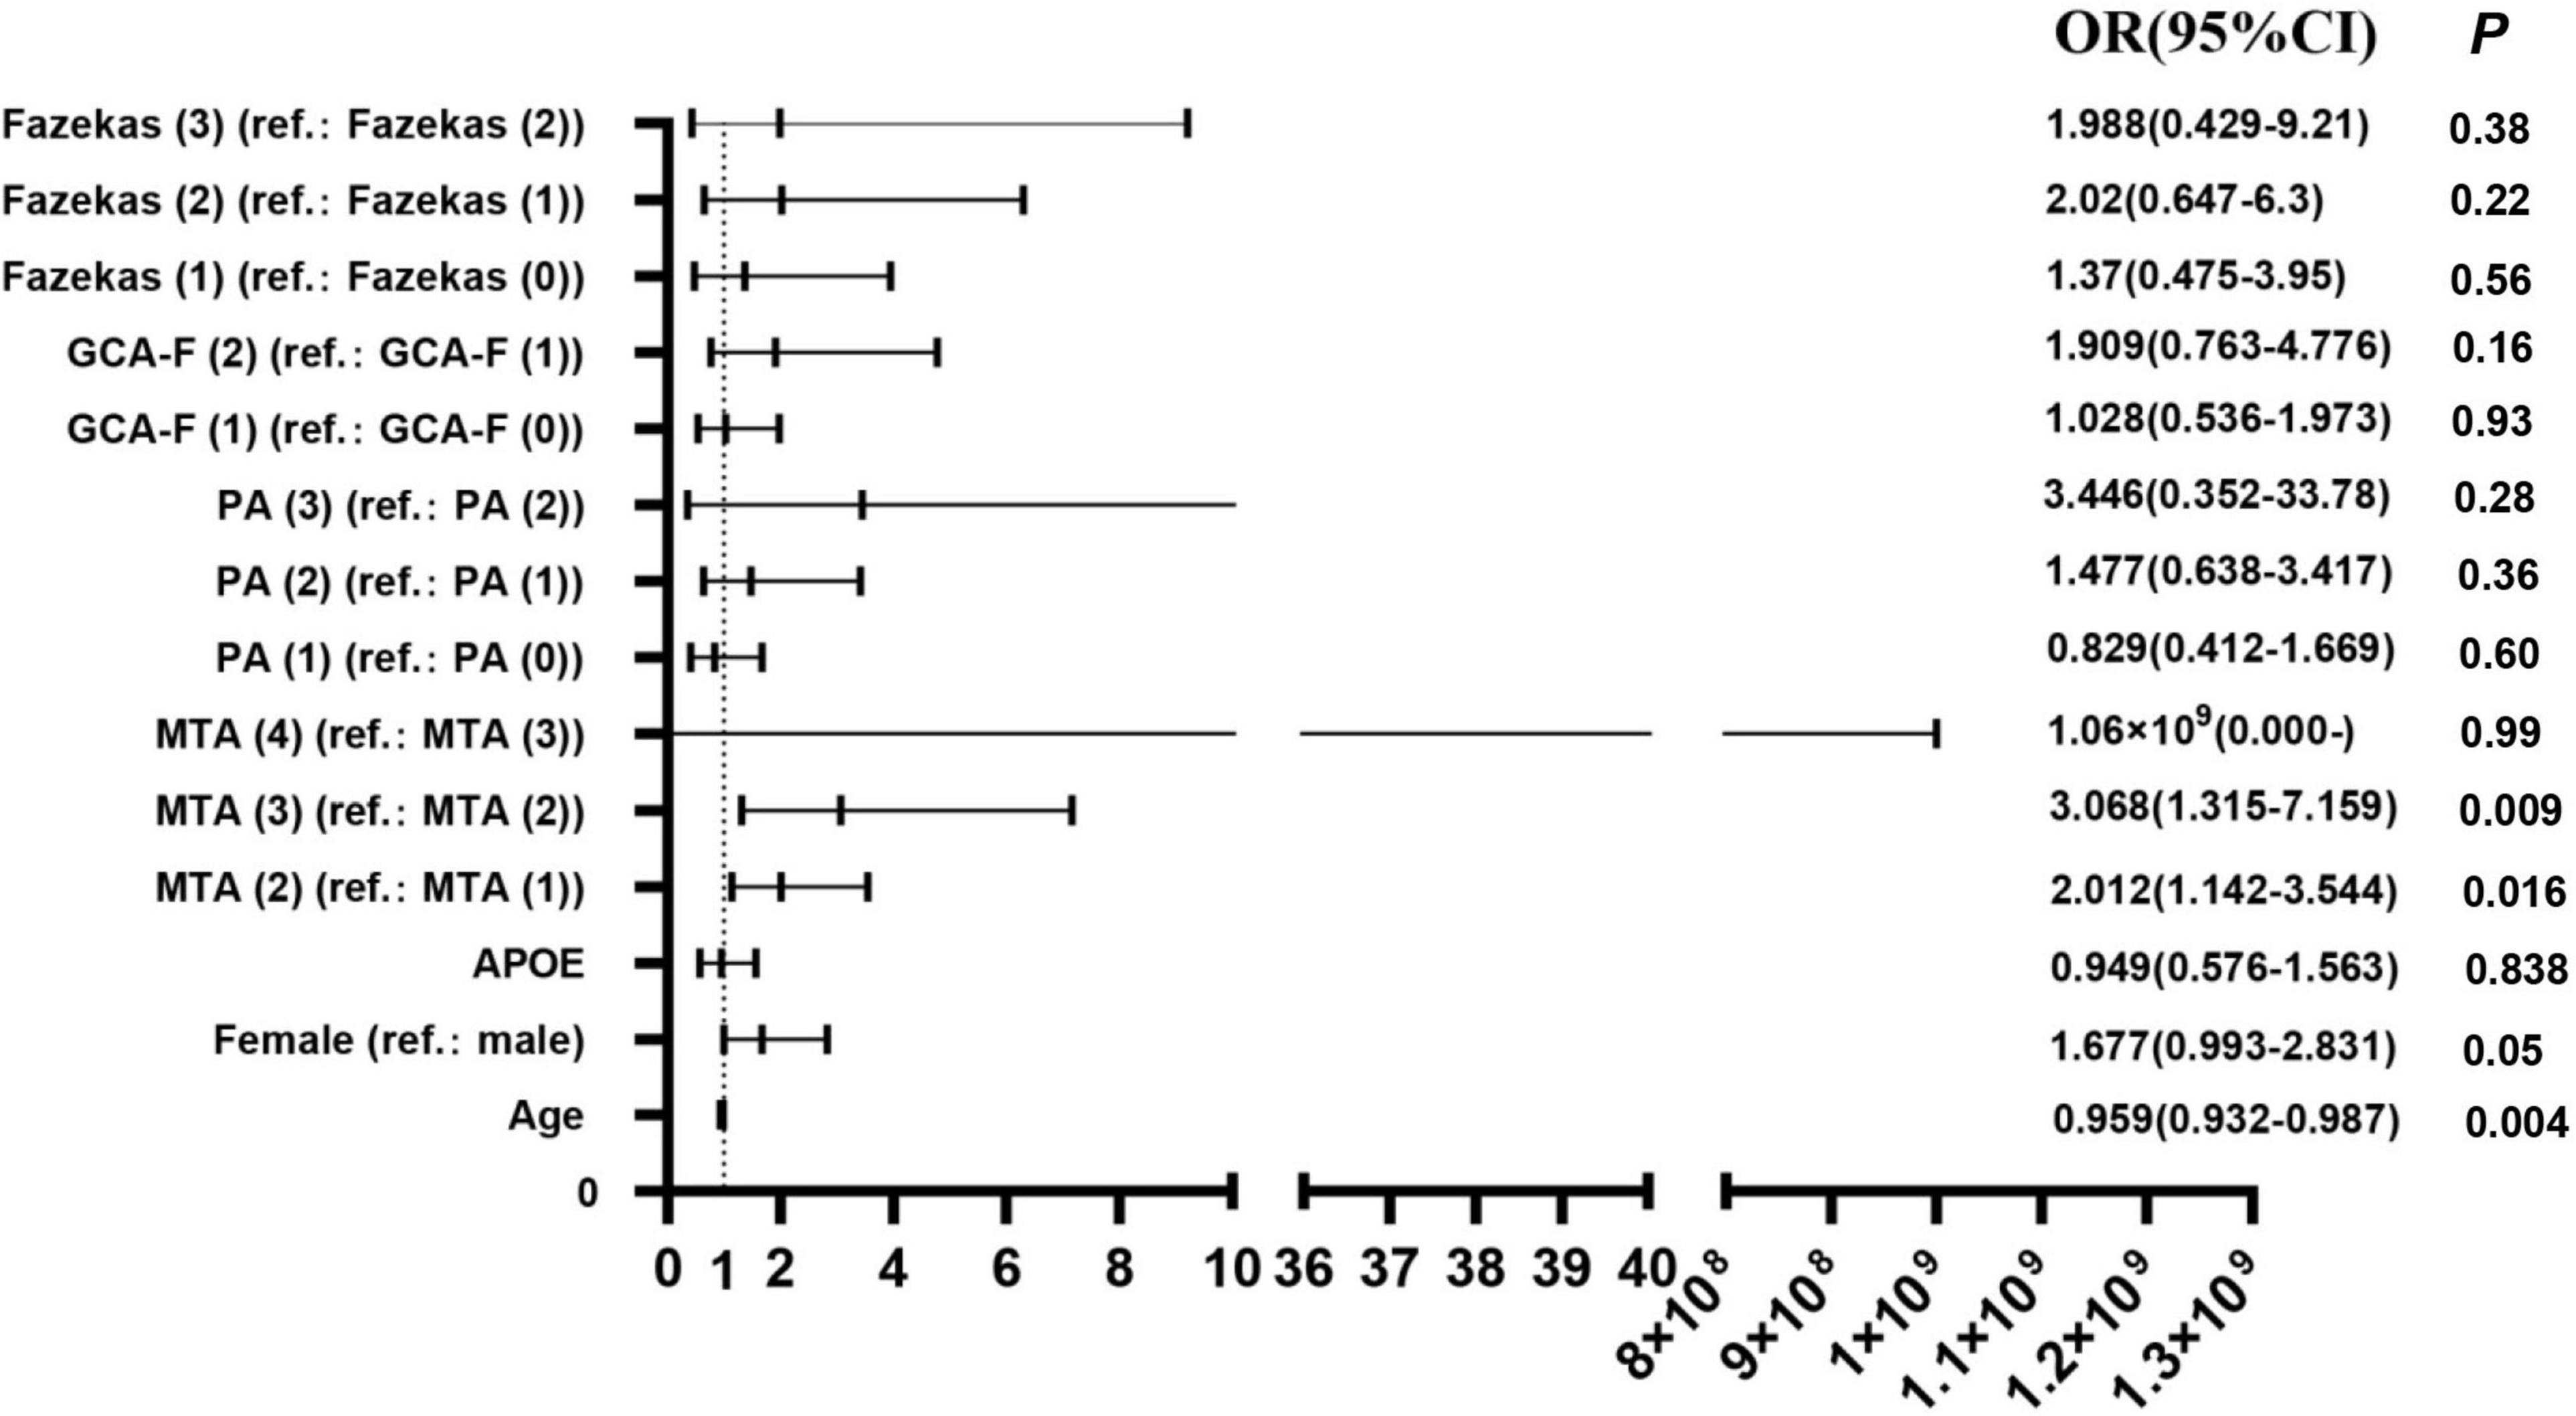
Figure 1. Regression analyses of visual rating scales in the prediction of AD severity (N = 435). OR, odds ratio; 95% CI, 95% confidence interval; B, regression coefficient. P < 0.05 was statistically significant.
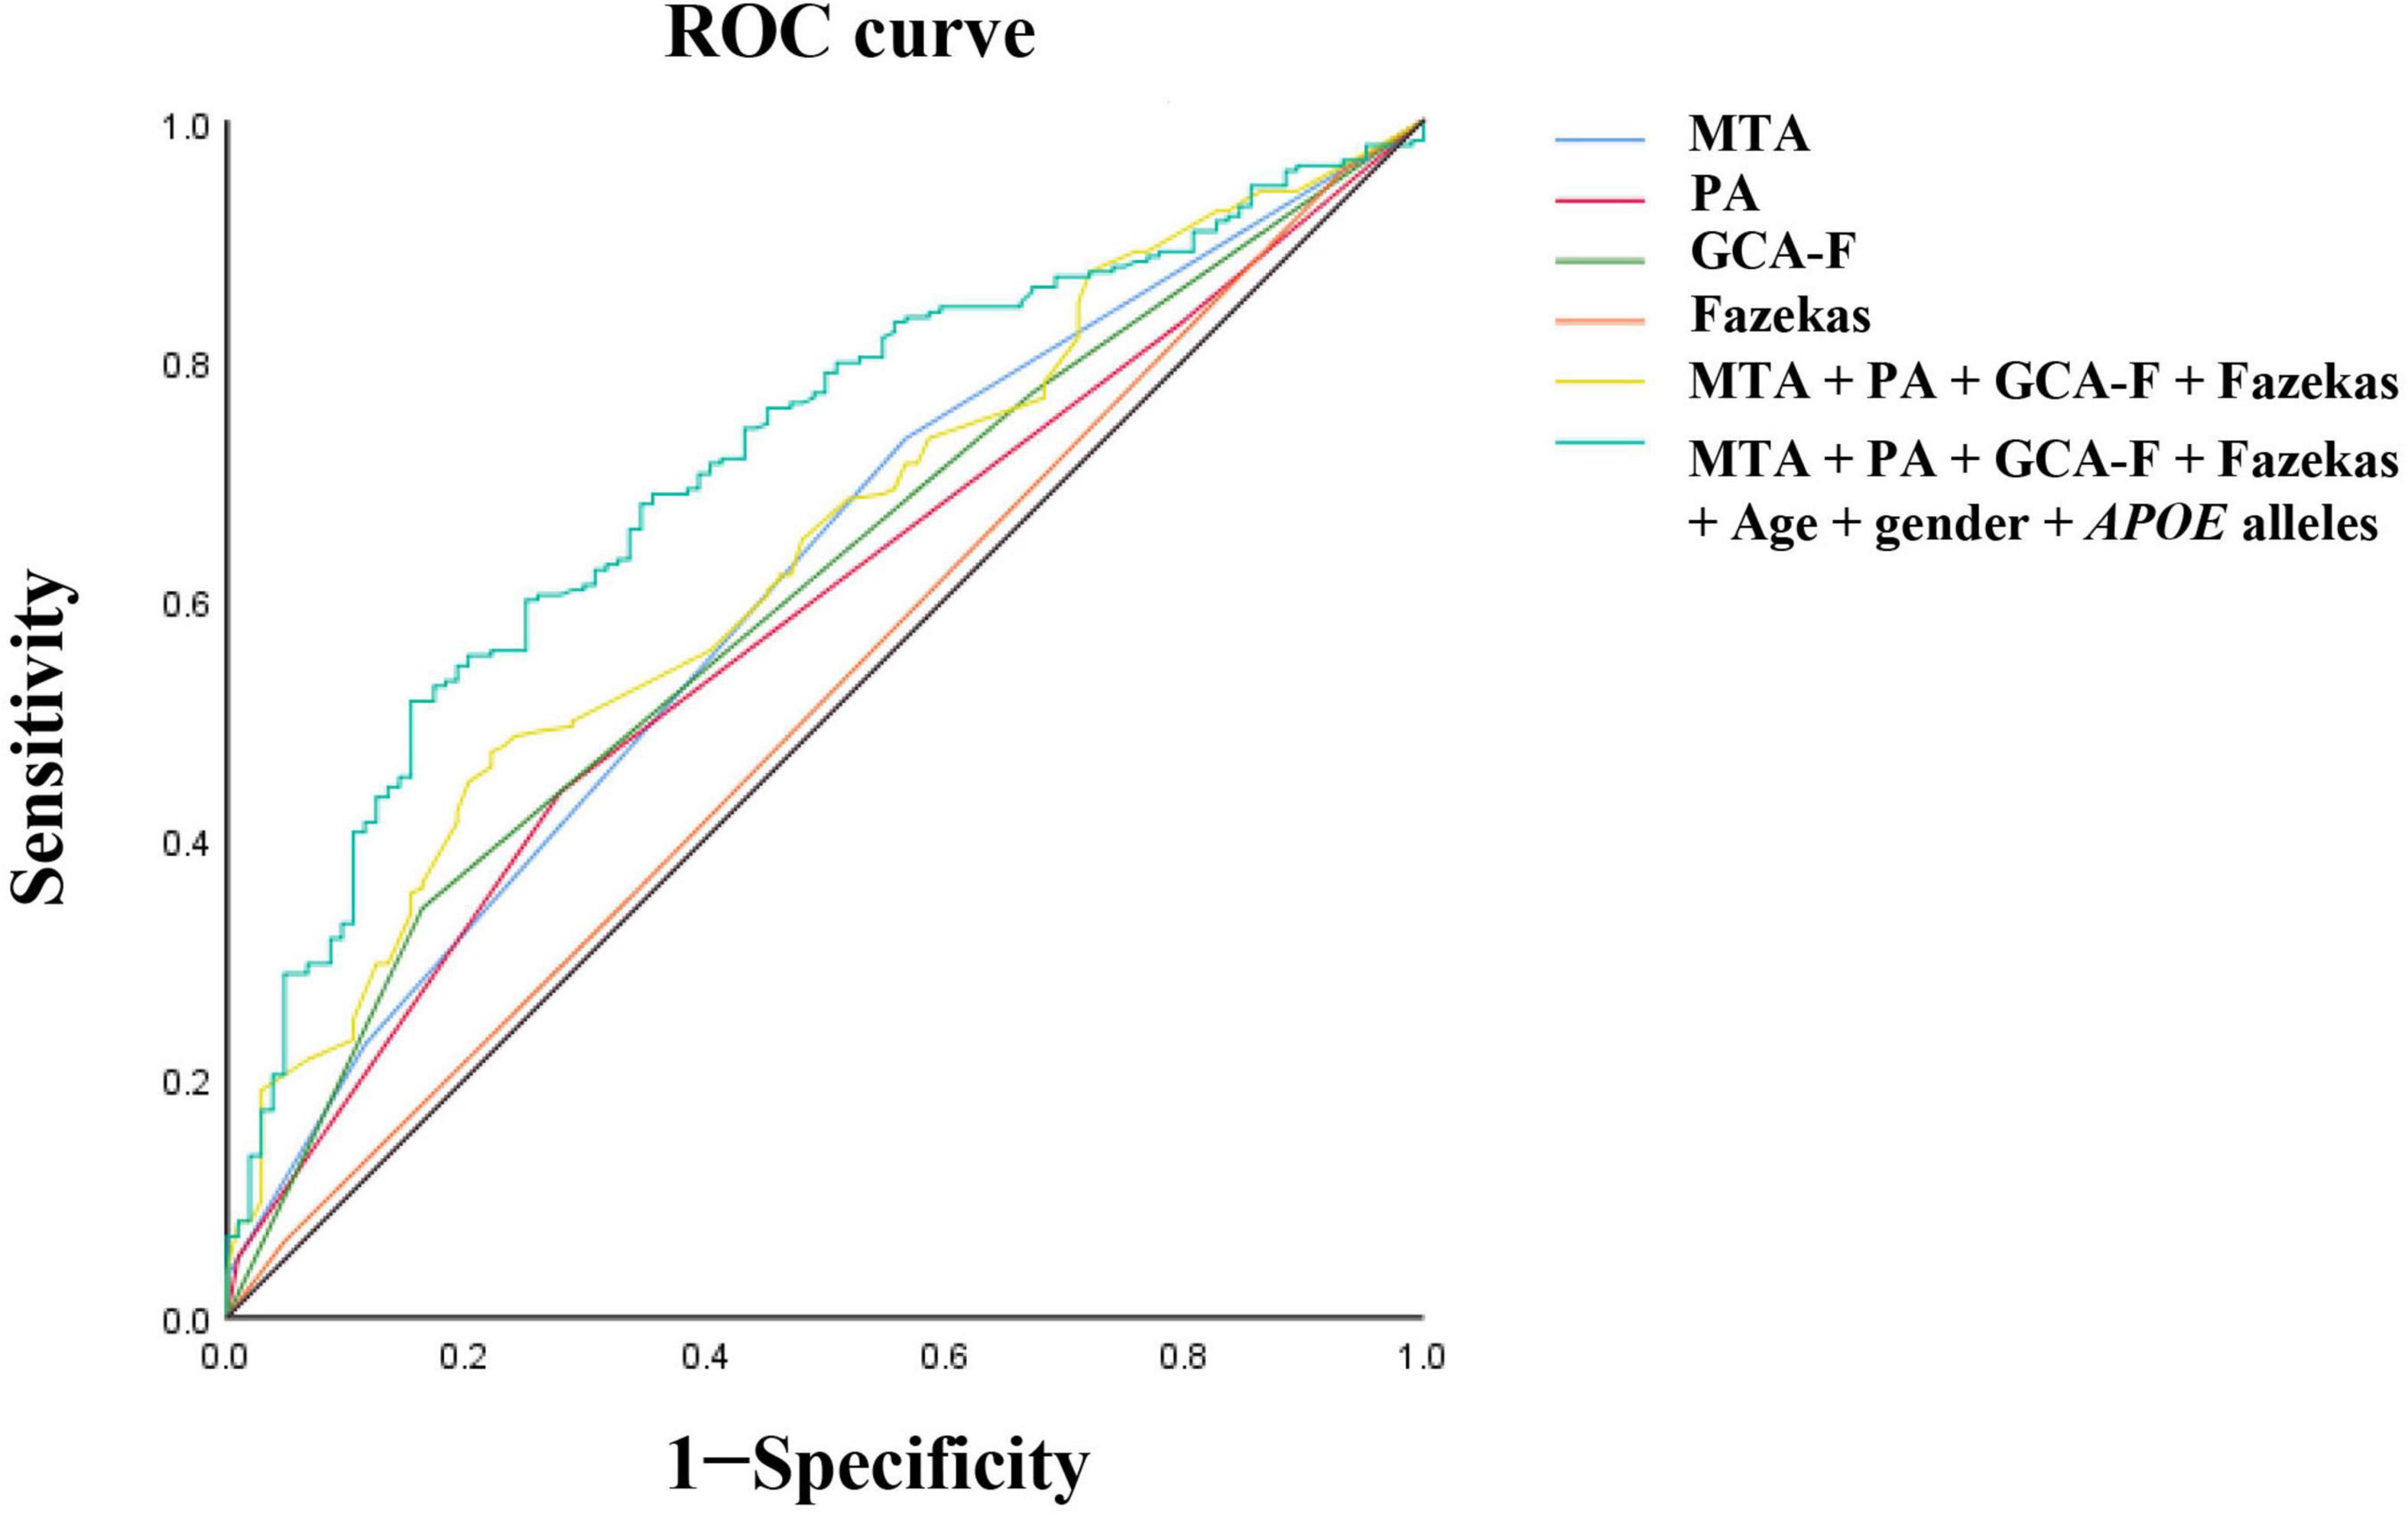
Figure 2. Receiver operating characteristic (ROC) curve analysis of visual rating scales for disease severity. The MTA exhibited the best predictive efficacy as a single indicator (AUC = 0.622, sensitivity = 74%, specificity = 44.6%). The PA, AUC = 0.59, sensitivity = 44.2%, specificity = 73.2%. The GCA-F, AUC = 0.609, sensitivity = 34.7%, specificity = 84.8%. The Fazekas, AUC = 0.51, sensitivity = 95.5%, specificity = 6.2%. The MTA combined with PA, GCA-F, and Fazekas; the predictive performance significantly improved (AUC = 0.654, sensitivity = 48.3%, specificity = 78.6%). The predictive model combining the MTA, PA, GCA-F, Fazekas, age, gender, and APOE alleles showed the best performance for the identification of moderate to severe AD significantly (AUC = 0.712, sensitivity = 51.5%, specificity = 84.6%). The Delong test was used to compare the difference of predictive models. AUC, area under the curve; ROC, receiver operating characteristic curve.
Visual rating scales and cerebrospinal fluid biomarkers
The relationships between visual rating scales including MTA, PA, GCA-F, Fazekas, and CSF biomarkers were shown in Figure 3. A lower concentration of Aβ1–42 was significantly associated with MTA. AD patients with MTA = 4 (235.65 ± 63.15 pg/mL) presented a significantly lower level of Aβ1–42 than patients with MTA = 1 (496.48 ± 264.08 pg/mL, p < 0.05) and MTA = 2 (500.93 ± 279.00 pg/mL, p < 0.05). White matter lesions were significantly associated with lower concentrations of Aβ1–42 and Aβ1–40. Compared to Fazekas = 1 (489.43 ± 288.59 pg/mL), the average levels of Aβ1–42 in Fazekas = 2 and Fazekas = 3 (332.91 ± 138.89 pg/mL and 291.80 ± 96.84 pg/mL, p < 0.05, p < 0.05, respectively) were lower. Compared to Fazekas = 1 (9023.63 ± 4649.50 pg/mL), the average level of Aβ1–40 in Fazekas = 2 (5594.98 ± 3012.56 pg/mL, p < 0.05) was lower. However, the remnant visual rating scales were not associated with the rest of CSF biomarkers, such as p-tau and t-tau (Jiao et al., 2021).
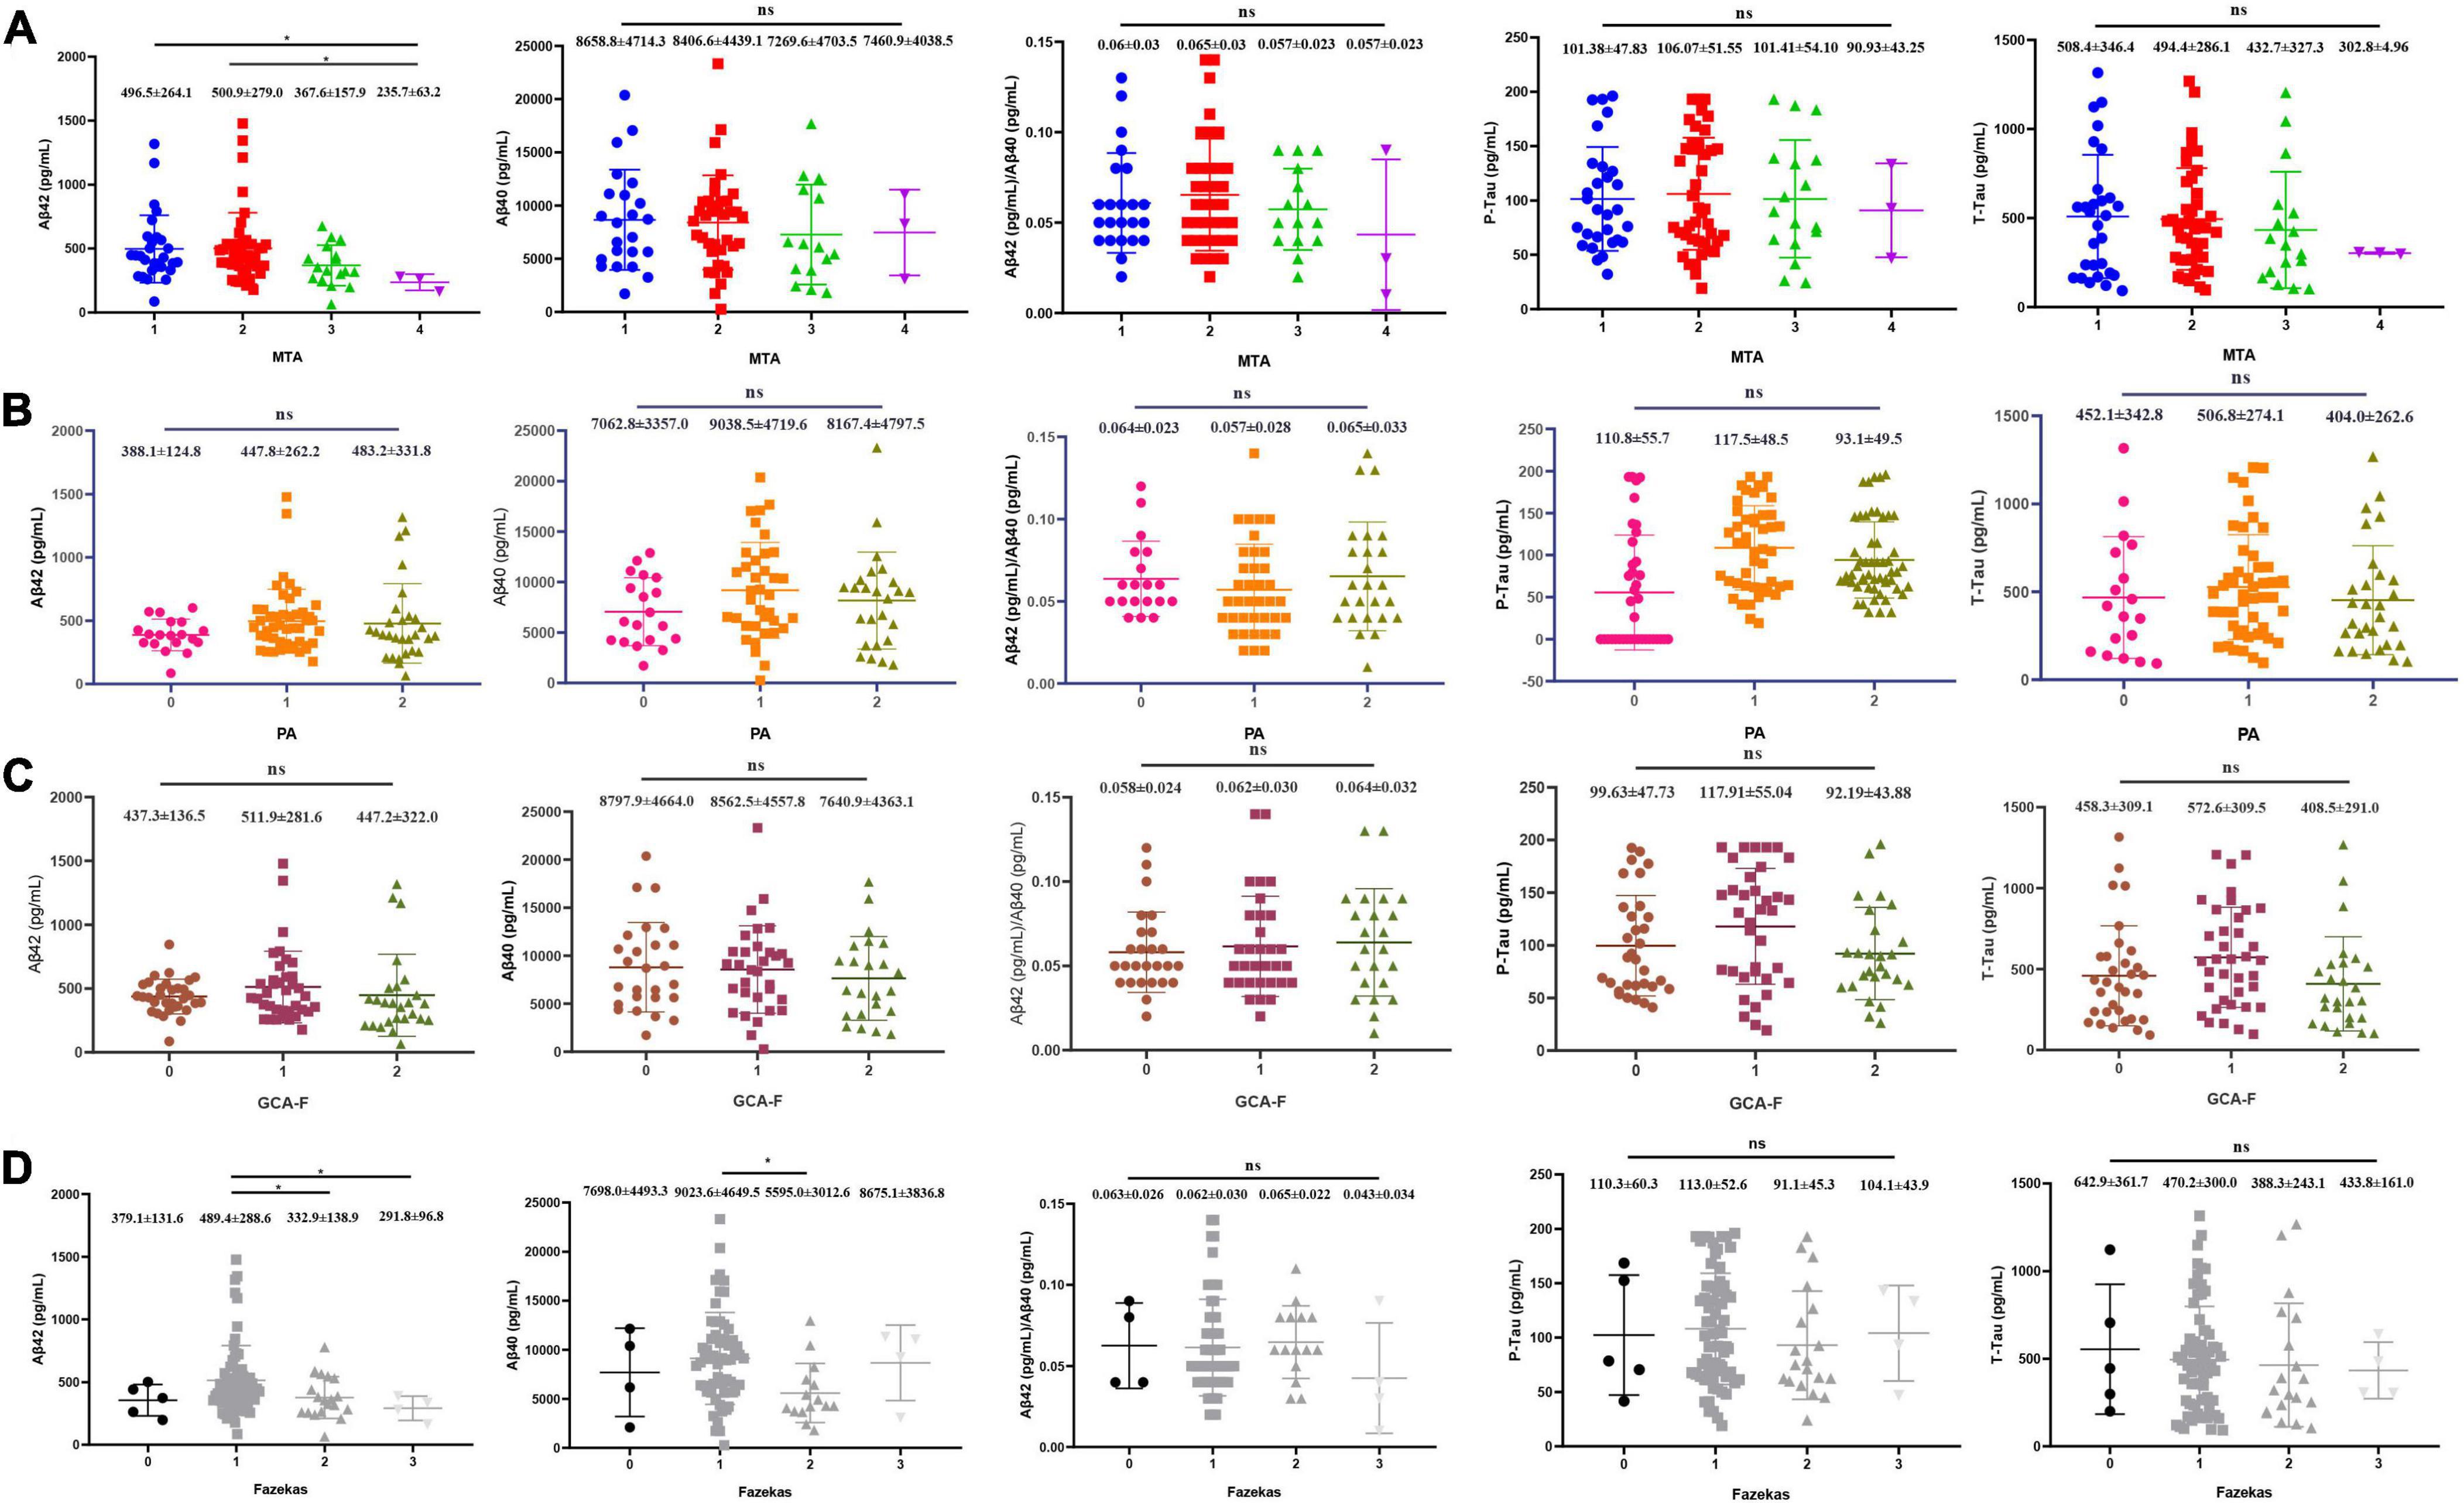
Figure 3. Each visual rating scale and correlation of CSF core biomarkers. (A) MTA (N = 92), (B) PA (N = 95), (C) GCA-F (N = 95), and (D) Fazekas (N = 95). P-values from ANOVA (Kruskal–Wallis H-test for abnormal distribution), and Games–Howell test for post-hoc comparison. *P < 0.05 was statistically significant; ns: no statistical difference.
Discussion
We systematically analyzed the benefits of multiple visual rating scales in presenting AD clinical status and disease severity in a Chinese south cohort. We found that visual rating scales played significant roles in presenting the AD status, including onset age, disease duration, and severity of AD, and different scales showed individual performance. To our knowledge, the MTA, GCA-F, and Fazekas were positively correlated with age at onset and age at diagnosis, and the Fazekas showed best performance. Previous studies showed neurodegenerative diseases like AD were performed with different patterns of brain atrophy (Scheltens et al., 2002; Silhan et al., 2020), and the different atrophy subtypes were with significantly different demographic and clinical characteristics (Poulakis et al., 2018). Claus et al. (2017) proposed the MTA scale strongly increased with age in a memory clinic in which only the MTA scale was conducted. In addition, small cohorts showed elderly AD patients had pronounced hippocampal atrophy, and early onset AD patients were more associated with generalized atrophy (Schoonenboom et al., 2008; Sluimer et al., 2008). Kao et al. (2019) suggested that age was significantly associated with WMLs. Most of the previous studies applied only a single visual rating scale, while we provided information on multiple visual rating scales with the onset age in a large Chinese south AD cohort. Thus, our study is more meaningful, although our findings might be inconsistent with them. Our observation of sMRI rating scales in patients with EOAD and LOAD showed that patients with LOAD scored higher on GCA-F and Fazekas. In terms of disease duration, a positive significant association emerged between disease duration with MTA and GCA-F, especially with MTA. We revealed the effect of disease duration on the integrity of the brain. Pyun et al. (2017) noted that women had an increased risk of brain atrophy (Ferretti et al., 2018; Sapkota et al., 2021), but our results showed men had a higher proportion of worse global cerebral frontal atrophy and MTA. This might be because brain atrophy accelerates over time, and many factors such as hypertension, hyperlipidemia, smoking, and drinking result in small vessel disease, which may lead to brain atrophy, while these factors occur mostly in men. Besides, male may perform relatively elder metabolic brain age in adulthood (Goyal et al., 2019). Also, it may be because the samples we enrolled were limited to AD patients.
In this study, the multivariate logistic regression analysis showed that after adjusting age, gender, and APOE alleles, the MTA scale showed the highest performance in the prediction of disease severity, compared with PA, GCA-F, and Fazekas. It was in accordance with some previous studies. The MTA was significantly associated with lower cognition evaluated by MMSE scores and showed the best diagnostic value and predictive performance compared to the GCA-F and PA scales in the Alzheimer’s Disease Neuroimaging Initiative (ADNI) cohort (Geroldi et al., 2006; Perneczky et al., 2009; Ferreira et al., 2015; Wei et al., 2019). Yuan et al. (2019) showed the medial temporal lobe and anterior cingulate atrophy were negatively correlated with the scores of the MMSE in a small AD cohort. In addition, Hett et al. (2021) presented a framework to apply the multiscale graph-based grading method to analyze the alterations in whole-brain structures. They found the most prominent zones were the post-central gyrus, anterior cingulate gyrus, hippocampus, and precuneus and proved it was a competitive tool to predict AD progression in the ADNI dataset (Hett et al., 2021). However, their method depended on the quality of graph segmentations and computer-aided diagnostic systems, thereby increasing the complexity of application for clinicians. Thus, the MTA remains the most typical imaging biomarker to predict the progression and severity of AD, and the visual rating scale is an easier and faster option for clinical practice. To our knowledge, both PA and GCA scales are also positively correlated with clinical cognition, following the MTA scale. Claus et al. (2017) and Pyun et al. (2017) showed PA was associated with rapid progression of AD, and the GCA-F was significantly associated with worse clinical cognition with lower MMSE and CDR scores (Stenset et al., 2008). Interestingly, the model combining multiple visual rating scales, age, gender, and APOE alleles showed the best performance for the predicting moderate to severe AD. It was feasible and necessary to systematically analyze multiple visual rating scales and incorporate the multiple scales into clinical practice. Within this study, the MMSE, MoCA, and CDR were combined to synthetically evaluate the severity of AD, for the first time. We found that all of them were significantly associated with visual rating scales, while in many previous studies, only the MMSE or CDR was applied to evaluate the disease severity.
Cerebrospinal fluid core biomarkers such as Aβ and tau were associated with a cognitive decline and had little change over time (Li et al., 2016; Bos et al., 2017). As brain atrophy progresses with disease advancement, the rate of atrophy could be considered a marker for disease progression (Rusinek et al., 2004). No studies before systematically evaluated the correlation between multiple visual rating scales and CSF biomarkers in the same population. Previous studies mainly focused on the association between CSF biomarkers and the MTA and PA in European cohorts. For example, Contador J proposed that CSF Aβ1–42 was correlated with faster cortical thinning, and some research studies also showed that the MTA scale was in correlation with a lower level of Aβ (Fjell et al., 2008; Schuff et al., 2009; Lehmann et al., 2013). Moreover, Berron et al. (2020) also found functional association between the medial temporal lobe and regions in the anterior–temporal system was impaired in Aβ-positive individuals. However, most of them were studied in a small cohort. Our results supported a lower concentration of Aβ1–42 in MTA in the Chinese south population. In addition, a significant association was found between the lower concentrations of Aβ1–42 and WMLs in our study, which might imply a link between white matter macrostructural and amyloid pathology microstructural damage (Pietroboni et al., 2018). Although PA was found to be associated with an increased concentration of p-tau181 in AD in previous studies (Lehmann et al., 2013; Mao et al., 2021), we did not find any association between CSF tau and brain atrophy possibly because CSF tau was a biomarker of global neurodegeneration, whereas visual rating scales were markers of local neurodegeneration (Abdelnour et al., 2020). Furthermore, the employment of multiple visual rating scales to correlate the CSF core biomarkers with different regional brain atrophy might be a useful predictive tool for clinicians to use in clinical practice.
In conclusion, compared with PA, GCA-F, and Fazekas scales, the MTA scale performs best in predicting the severity of AD, whereas the visual rating scales combined with age, gender, and APOE alleles showed the best performance in predicting the severity of AD. AD patients with severe global cerebral atrophy and WML load were prone to present at a later onset age, and CSF biomarkers had no association with onset age. The combination of MRI biomarkers and CSF core biomarkers can be recommended for clinical practice.
Data availability statement
The raw data supporting the conclusions of this article will be made available by the authors, without undue reservation.
Ethics statement
The studies involving human participants were reviewed and approved by the Ethics Committee of Xiangya Hospital, Central South University. The patients/participants provided their written informed consent to participate in this study.
Author contributions
M-DW, BJ, and LS were responsible for the study design, acquisition of data, analysis of data, and drafting/revising the manuscript. HL, X-XLiu, W-WZ, X-WX, S-ZZ, Y-IJ, HZ, X-XLia, Y-FZ, B-ST, J-LW, and J-fG collected the data and revised the manuscript. All authors agreed to the submitted manuscript.
Funding
This study was supported by the National Key R&D Program of China (No. 2020YFC2008500), the National Major Projects in Brain Science and Brain-like Research (No. 2021ZD0201803), the National Natural Science Foundation of China (Nos. 81971029, 82071216, and 81901171), Hunan Innovative Province Construction Project (No. 2019SK2335), and Hu-Xiang Youth Project (No. 2021RC3028).
Acknowledgments
We would like to thank all the patients and their guardians for their participation in this study and all the colleagues in the Department of Neurology, Xiangya Hospital, Central South University, China.
Conflict of interest
The authors declare that the research was conducted in the absence of any commercial or financial relationships that could be construed as a potential conflict of interest.
Publisher’s note
All claims expressed in this article are solely those of the authors and do not necessarily represent those of their affiliated organizations, or those of the publisher, the editors and the reviewers. Any product that may be evaluated in this article, or claim that may be made by its manufacturer, is not guaranteed or endorsed by the publisher.
References
Abdelnour, C., Ferreira, D., Oppedal, K., Cavallin, L., Bousiges, O., Wahlund, L. O., et al. (2020). The combined effect of amyloid-β and tau biomarkers on brain atrophy in dementia with Lewy bodies. NeuroImage. Clini. 27:102333. doi: 10.1016/j.nicl.2020.102333
Avila, J., and Perry, G. (2021). A multilevel view of the development of Alzheimer’s Disease. Neuroscience 457, 283–293.
Bateman, R. J., Barthélemy, N. R., and Horie, K. (2020). Another step forward in blood-based diagnostics for Alzheimer’s disease. Nat. Med. 26, 314–316. doi: 10.1038/s41591-020-0797-4
Berron, D., Van Westen, D., Ossenkoppele, R., Strandberg, O., and Hansson, O. (2020). Medial temporal lobe connectivity and its associations with cognition in early Alzheimer’s disease. Brain 143, 1233–1248.
Bos, I., Verhey, F. R., Ramakers, I. H. G. B., Jacobs, H. I. L., Soininen, H., Freund-Levi, Y., et al. (2017). Cerebrovascular and amyloid pathology in predementia stages: the relationship with neurodegeneration and cognitive decline. Alzheimer’s Res, Ther. 9:101.
Caspers, J., Heeger, A., Turowski, B., and Rubbert, C. (2021). Automated age- and sex-specific volumetric estimation of regional brain atrophy: workflow and feasibility. Eur. Radiol. 31, 1043–1048. doi: 10.1007/s00330-020-07196-8
Chandra, A., Dervenoulas, G., and Politis, M. (2019). Magnetic resonance imaging in Alzheimer’s disease and mild cognitive impairment. J. Neurol. 266, 1293–1302.
Claus, J. J., Staekenborg, S. S., Holl, D. C., Roorda, J. J., Schuur, J., Koster, P., et al. (2017). Practical use of visual medial temporal lobe atrophy cut-off scores in Alzheimer’s disease: validation in a large memory clinic population. Eur. Radiol. 27, 3147–3155. doi: 10.1007/s00330-016-4726-3
Fan, C.-C., Peng, L., Wang, T., Yang, H., Zhou, X.-H., Ni, Z.-L., et al. (2022). “TR-Gan: multi-session future MRI prediction with temporal recurrent generative adversarial Network,” in IEEE Transactions on Medical Imaging, Piscataway, NJ: IEEE. doi: 10.1109/TMI.2022.3151118
Fazekas, F., Chawluk, J. B., Alavi, A., Hurtig, H. I., and Zimmerman, R. A. (1987). Mr signal abnormalities at 1.5 T in Alzheimer’s dementia and normal aging. Am. J. Roentgenol. 149, 351–356.
Ferreira, D., Cavallin, L., Larsson, E. M., Muehlboeck, J. S., Mecocci, P., Vellas, B., et al. (2015). Practical cut-offs for visual rating scales of medial temporal, frontal and posterior atrophy in Alzheimer’s disease and mild cognitive impairment. J. Int. Med. 278, 277–290.
Ferretti, M. T., Iulita, M. F., Cavedo, E., Chiesa, P. A., Schumacher Dimech, A., Santuccione Chadha, A., et al. (2018). Sex differences in Alzheimer disease - the gateway to precision medicine. Nat. Rev. Neurol. 14, 457–469.
Fjell, A. M., Walhovd, K. B., Amlien, I., Bjørnerud, A., Reinvang, I., Gjerstad, L., et al. (2008). Morphometric changes in the episodic memory network and tau pathologic features correlate with memory performance in patients with mild cognitive impairment. Am. J. Neuroradiol. 29, 1183–1189. doi: 10.3174/ajnr.A1059
Geroldi, C., Rossi, R., Calvagna, C., Testa, C., Bresciani, L., Binetti, G., et al. (2006). Medial temporal atrophy but not memory deficit predicts progression to dementia in patients with mild cognitive impairment. J. Neurol. Neurosurg. Psychiatry 77, 1219–1222.
Goyal, M. S., Blazey, T. M., Su, Y., Couture, L. E., Durbin, T. J., Bateman, R. J., et al. (2019). Persistent metabolic youth in the aging female brain. Proc. Nal. Acad. Sci. U.S.A. 116, 3251–3255.
Harper, L., Barkhof, F., Fox, N. C., and Schott, J. M. (2015). Using visual rating to diagnose dementia: a critical evaluation of Mri atrophy scales. J. Neurol. Neurosurg. Psychiatry 86, 1225–1233. doi: 10.1136/jnnp-2014-310090
Harper, L., Fumagalli, G. G., Barkhof, F., Scheltens, P., O’brien, J. T., Bouwman, F., et al. (2016). Mri visual rating scales in the diagnosis of dementia: evaluation in 184 post-mortem confirmed cases. Brain 139, 1211–1225. doi: 10.1093/brain/aww005
Hett, K., Ta, V.-T., Oguz, I., ManjóN, J. V., and Coupé, P. (2021). Multi-scale graph-based grading for Alzheimer’s disease prediction. Med. Image Anal. 67:101850. doi: 10.1016/j.media.2020.101850
Jack, C. R., Bennett, D. A., Blennow, K., Carrillo, M. C., Dunn, B., Haeberlein, S. B., et al. (2018). Nia-Aa research framework: toward a biological definition of Alzheimer’s disease. Alzheimer’s Dement. 14, 535–562. doi: 10.1016/j.jalz.2018.02.018
Jiao, B., Liu, H., Guo, L., Liao, X., Zhou, Y., Weng, L., et al. (2021). Performance of plasma amyloid β, total tau, and neurofilament light chain in the identification of probable Alzheimer’s Disease in South China. Front. Aging Neurosci. 13:749649. doi: 10.3389/fnagi.2021.749649
Jiao, B., Liu, X., Tang, B., Hou, L., Zhou, L., Zhang, F., et al. (2014). Investigation of Trem2, Pld3, and Unc5C variants in patients with Alzheimer’s disease from mainland China. Neurobiol. Aging 35, 2422.e9–2422.e11. doi: 10.1016/j.neurobiolaging.2014.04.025
Joachim, L. K., Frölich, L., Rüther, E., Wiltfang, J., Maier, W., Kornhuber, J., et al. (2018). Correlation of Csf- and Mri-biomarkers and progression of cognitive decline in an open label mci trial. J. Prevention Alzheimer’s Dis. 5, 202–206. doi: 10.14283/jpad.2018.5
Kao, Y.-H., Chou, M.-C., Chen, C.-H., and Yang, Y.-H. (2019). White Matter changes in patients with Alzheimer’s Disease and associated factors. J. Clin. Med. 8:167.
Kaye, J. A., Moore, M. M., Dame, A., Quinn, J., Camicioli, R., Howieson, D., et al. (2005). Asynchronous regional brain volume losses in presymptomatic to moderate Ad. J. Alzheimer’s Dis. 8, 51–56. doi: 10.3233/jad-2005-8106
Khan, S., Barve, K. H., and Kumar, M. S. (2020). Recent advancements in pathogenesis, diagnostics and treatment of Alzheimer’s Disease. Curr. Neuropharmacol. 18, 1106–1125.
Koedam, E. L. G. E., Lehmann, M., Van Der Flier, W. M., Scheltens, P., Pijnenburg, Y. A. L., Fox, N., et al. (2011). Visual assessment of posterior atrophy development of a Mri rating scale. Eur. Radiol. 21, 2618–2625.
Lehmann, M., Koedam, E. L., Barnes, J., Bartlett, J. W., Barkhof, F., Wattjes, M. P., et al. (2013). Visual ratings of atrophy in Mci: prediction of conversion and relationship with Csf biomarkers. Neurobiol. Aging 34, 73–82. doi: 10.1016/j.neurobiolaging.2012.03.010
Li, J.-Q., Tan, L., Wang, H.-F., Tan, M.-S., Tan, L., Xu, W., et al. (2016). Risk factors for predicting progression from mild cognitive impairment to Alzheimer’s disease: a systematic review and meta-analysis of cohort studies. J. Neurol. Neurosurg. Psychiatry 87, 476–484.
Mao, C., Sha, L., Li, J., Huang, X., Chu, S., Lei, D., et al. (2021). Relationship between general cognition, visual assessed cortical atrophy, and cerebrospinal fluid biomarkers in Alzheimer’s Disease: a cross-sectional study from a Chinese pumch cohort. J. Alzheimer’s Dis. 82, 205–214. doi: 10.3233/JAD-210344
Mårtensson, G., Håkansson, C., Pereira, J. B., Palmqvist, S., Hansson, O., Van Westen, D., et al. (2020). Medial temporal atrophy in preclinical dementia: visual and automated assessment during six year follow-up. NeuroImage. Clin. 27:102310. doi: 10.1016/j.nicl.2020.102310
McAleese, K. E., Walker, L., Graham, S., Moya, E. L. J., Johnson, M., Erskine, D., et al. (2017). Parietal white matter lesions in Alzheimer’s disease are associated with cortical neurodegenerative pathology, but not with small vessel disease. Acta Neuropathol. 134, 459–473.
Olsson, B., Lautner, R., Andreasson, U., Öhrfelt, A., Portelius, E., Bjerke, M., et al. (2016). Csf and blood biomarkers for the diagnosis of Alzheimer’s disease: a systematic review and meta-analysis. Lancet. Neurol. 15, 673–684.
Park, H. Y., Park, C. R., Suh, C. H., Shim, W. H., and Kim, S. J. (2021). Diagnostic performance of the medial temporal lobe atrophy scale in patients with Alzheimer’s disease: a systematic review and meta-analysis. Eur. Radiol. 31, 9060–9072.
Perneczky, R., Wagenpfeil, S., Lunetta, K. L., Cupples, L. A., Green, R. C., Decarli, C., et al. (2009). Education attenuates the effect of medial temporal lobe atrophy on cognitive function in Alzheimer’s disease: the Mirage study. J. Alzheimer’s Dis. 17, 855–862. doi: 10.3233/JAD-2009-1117
Pietroboni, A. M., Scarioni, M., Carandini, T., Basilico, P., Cadioli, M., Giulietti, G., et al. (2018). Csf β-amyloid and white matter damage: a new perspective on Alzheimer’s disease. J. Neurol. Neurosurg. Psychiatry 89, 352–357. doi: 10.1136/jnnp-2017-316603
Pimenova, A. A., Raj, T., and Goate, A. M. (2018). Untangling GENETIC RISK FOR Alzheimer’s Disease. Biol. Psychiatry 83, 300–310.
Poulakis, K., Pereira, J. B., Mecocci, P., Vellas, B., Tsolaki, M., Kłoszewska, I., et al. (2018). Heterogeneous patterns of brain atrophy in Alzheimer’s disease. Neurobiol. Aging 65, 98–108.
Pyun, J.-M., Park, Y. H., Kim, H.-R., Suh, J., Kang, M. J., Kim, B. J., et al. (2017). Posterior atrophy predicts time to dementia in patients with amyloid-positive mild cognitive impairment. Alzheimer’s Res. Ther. 9:99. doi: 10.1186/s13195-017-0326-y
Rhodius-Meester, H. F. M., Benedictus, M. R., Wattjes, M. P., Barkhof, F., Scheltens, P., Muller, M., et al. (2017). MRI visual ratings of brain atrophy and white matter hyperintensities across the spectrum of cognitive decline are differently affected by age and diagnosis. Front. Aging Neurosci. 9:117. doi: 10.3389/fnagi.2017.00117
Rusinek, H., Endo, Y., De Santi, S., Frid, D., Tsui, W. H., Segal, S., et al. (2004). Atrophy rate in medial temporal lobe during progression of Alzheimer disease. Neurology 63, 2354–2359.
Sapkota, S., Ramirez, J., Yhap, V., Masellis, M., and Black, S. E. (2021). Brain atrophy trajectories predict differential functional performance in Alzheimer’s disease: moderations with apolipoprotein E and sex. Alzheimer’s Dement. 13:e12244. doi: 10.1002/dad2.12244
Scheltens, P., Fox, N., Barkhof, F., and De Carli, C. (2002). Structural magnetic resonance imaging in the practical assessment of dementia: beyond exclusion. Lancet. Neurol. 1, 13–21.
Scheltens, P., Leys, D., Barkhof, F., Huglo, D., Weinstein, H. C., Vermersch, P., et al. (1992). Atrophy of medial temporal lobes on Mri in “probable” Alzheimer’s disease and normal ageing: diagnostic value and neuropsychological correlates. J. Neurol. Neurosurg. Psychiatry 55, 967–972.
Scheltens, P., Pasquier, F., Weerts, J. G., Barkhof, F., and Leys, D. (1997). Qualitative assessment of cerebral atrophy on Mri: inter- and intra-observer reproducibility in dementia and normal aging. Eur. Neurol. 37, 95–99. doi: 10.1159/000117417
Schoonenboom, N. S. M., Van Der Flier, W. M., Blankenstein, M. A., Bouwman, F. H., Van Kamp, G. J., Barkhof, F., et al. (2008). Csf and Mri markers independently contribute to the diagnosis of Alzheimer’s disease. Neurobiol. Aging 29, 669–675. doi: 10.1016/j.neurobiolaging.2006.11.018
Schuff, N., Woerner, N., Boreta, L., Kornfield, T., Shaw, L. M., Trojanowski, J. Q., et al. (2009). Mri of hippocampal volume loss in early Alzheimer’s disease in relation to ApoE genotype and biomarkers. Brain 132, 1067–1077. doi: 10.1093/brain/awp007
Schwarz, C. G., Gunter, J. L., Wiste, H. J., Przybelski, S. A., Weigand, S. D., Ward, C. P., et al. (2016). A large-scale comparison of cortical thickness and volume methods for measuring Alzheimer’s disease severity. NeuroImage Clin. 11, 802–812. doi: 10.1016/j.nicl.2016.05.017
Sheng, C., Sun, Y., Wang, M., Wang, X., Liu, Y., Pang, D., et al. (2020). Combining visual rating scales for medial temporal lobe atrophy and posterior atrophy to identify amnestic mild cognitive impairment from cognitively normal older adults: evidence based on two cohorts. J. Alzheimer’s Dis. 77, 323–337.
Silhan, D., Bartos, A., Mrzilkova, J., Pashkovska, O., Ibrahim, I., and Tintera, J. (2020). The parietal atrophy score on brain magnetic resonance imaging is a reliable visual scale. Curr. Alzheimer Res. 17, 534–539. doi: 10.2174/1567205017666200807193957
Silhan, D., Pashkovska, O., and Bartos, A. (2021). Hippocampo-horn percentage and parietal atrophy score for easy visual assessment of brain atrophy on magnetic resonance imaging in early- and late-onset Alzheimer’s Disease. J. Alzheimer’s Dis. 84, 1259–1266. doi: 10.3233/JAD-210372
Sluimer, J. D., Vrenken, H., Blankenstein, M. A., Fox, N. C., Scheltens, P., Barkhof, F., et al. (2008). Whole-brain atrophy rate in Alzheimer disease: identifying fast progressors. Neurology 70, 1836–1841. doi: 10.1212/01.wnl.0000311446.61861.e3
Stenset, V., Hofoss, D., Johnsen, L., Skinningsrud, A., Berstad, A. E., Negaard, A., et al. (2008). White matter lesion severity is associated with reduced cognitive performances in patients with normal Csf Abeta42 levels. Acta Neurol. Scand. 118, 373–378. doi: 10.1111/j.1600-0404.2008.01045.x
Van Rossum, I. A., Vos, S. J. B., Burns, L., Knol, D. L., Scheltens, P., Soininen, H., et al. (2012). Injury markers predict time to dementia in subjects with Mci and amyloid pathology. Neurology 79, 1809–1816.
Wan, T., Fu, M., Jiang, Y., Jiang, W., Li, P., and Zhou, S. (2022). Research progress on mechanism of neuroprotective roles of Apelin-13 in prevention and treatment of Alzheimer’s Disease. Neurochem. Res. 47, 205–217. doi: 10.1007/s11064-021-03448-1
Wei, M., Shi, J., Ni, J., Zhang, X., Li, T., Chen, Z., et al. (2019). A new age-related cutoff of medial temporal atrophy scale on Mri improving the diagnostic accuracy of neurodegeneration due to Alzheimer’s disease in a Chinese population. BMC Geriatr. 19:59. doi: 10.1186/s12877-019-1072-8
Yuan, Z., Pan, C., Xiao, T., Liu, M., Zhang, W., Jiao, B., et al. (2019). Multiple visual rating scales based on structural mri and a novel prediction model combining visual rating scales and age stratification in the diagnosis of Alzheimer’s Disease in the Chinese population. Front. Neurol. 10:93. doi: 10.3389/fneur.2019.00093
Zhang, J., He, X., Qing, L., Gao, F., and Wang, B. (2022). Bpgan: brain pet synthesis from MRI using generative adversarial network for multi-modal Alzheimer’s disease diagnosis. Comput. Methods Programs Biomed. 217:106676. doi: 10.1016/j.cmpb.2022.106676
Keywords: Alzheimer’s disease, visual rating scale, medial temporal lobe atrophy, posterior atrophy, global cerebral frontal atrophy, white matter lesions, cerebrospinal fluid
Citation: Wan M-d, Liu H, Liu X-x, Zhang W-w, Xiao X-w, Zhang S-z, Jiang Y-l, Zhou H, Liao X-x, Zhou Y-f, Tang B-s, Wang J-L, Guo J-f, Jiao B and Shen L (2022) Associations of multiple visual rating scales based on structural magnetic resonance imaging with disease severity and cerebrospinal fluid biomarkers in patients with Alzheimer’s disease. Front. Aging Neurosci. 14:906519. doi: 10.3389/fnagi.2022.906519
Received: 28 March 2022; Accepted: 13 July 2022;
Published: 29 July 2022.
Edited by:
Paolo Caffarra, University of Parma, ItalyReviewed by:
Yong Ji, Beijing Tiantan Hospital, Capital Medical University, ChinaJianqing Ding, Shanghai Jiao Tong University School of Medicine, China
Copyright © 2022 Wan, Liu, Liu, Zhang, Xiao, Zhang, Jiang, Zhou, Liao, Zhou, Tang, Wang, Guo, Jiao and Shen. This is an open-access article distributed under the terms of the Creative Commons Attribution License (CC BY). The use, distribution or reproduction in other forums is permitted, provided the original author(s) and the copyright owner(s) are credited and that the original publication in this journal is cited, in accordance with accepted academic practice. No use, distribution or reproduction is permitted which does not comply with these terms.
*Correspondence: Lu Shen, c2hlbmx1QGNzdS5lZHUuY24=; Bin Jiao, amlhb2JpbkBjc3UuZWR1LmNu