 Ruilin Chen1,2†
 Guiyan Cai1,2†
 Shurui Xu1,2†Qianqian Sun2Jia Luo2Yajun Wang1,2Ming Li3Hui Lin4
 Jiao Liu1,5,6,7*
- 1National-Local Joint Engineering Research Center of Rehabilitation Medicine Technology, Fujian University of Traditional Chinese Medicine, Fuzhou, China
- 2College of Rehabilitation Medicine, Fujian University of Traditional Chinese Medicine, Fuzhou, China
- 3Affiliated Rehabilitation Hospital, Fujian University of Traditional Chinese Medicine, Fuzhou, China
- 4Department of Physical Education, Fujian University of Traditional Chinese Medicine, Fuzhou, China
- 5Fujian Key Laboratory of Rehabilitation Technology, Fuzhou, China
- 6Traditional Chinese Medicine Rehabilitation Research Center of State Administration of Traditional Chinese Medicine, Fujian University of Traditional Chinese Medicine, Fuzhou, China
- 7Key Laboratory of Orthopedics and Traumatology of Traditional Chinese Medicine and Rehabilitation, Ministry of Education, Fujian University of Traditional Chinese Medicine, Fuzhou, China
Objective: This study aims to explore whether body mass index (BMI) level affects the executive function and hippocampal subregion volume of subjective cognitive decline (SCD).
Materials and methods: A total of 111 participants were included in the analysis, including SCD (38 of normal BMI, 27 of overweight and obesity) and normal cognitive control (NC) (29 of normal BMI, 17 of overweight and obesity). All subjects underwent the Chinese version of the Stroop Color-Word Test (SCWT) to measure the executive function and a high-resolution 3D T1 structural image acquisition. Two-way ANOVA was used to examine the differences in executive function and gray matter volume in hippocampal subregions under different BMI levels between the SCD and NC.
Result: The subdimensions of executive function in which different BMI levels interact with SCD and NC include inhibition control function [SCWT C-B reaction time(s): F(1,104) = 5.732, p = 0.018], and the hippocampal subregion volume of CA1 [F(1,99) = 8.607, p = 0.004], hippocampal tail [F(1,99) = 4.077, p = 0.046], and molecular layer [F(1,99) = 6.309, p = 0.014]. After correction by Bonferroni method, the population × BMI interaction only had a significant effect on the CA1 (p = 0.004). Further analysis found that the SCWT C-B reaction time of SCD was significantly longer than NC no matter whether it is at the normal BMI level [F(1,104) = 4.325, p = 0.040] or the high BMI level [F(1,104) = 21.530, p < 0.001], and the inhibitory control function of SCD was worse than that of NC. In the normal BMI group, gray matter volume in the hippocampal subregion (CA1) of SCD was significantly smaller than that of NC [F(1,99) = 4.938, p = 0.029]. For patients with SCD, the high BMI group had worse inhibitory control function [F(1,104) = 13.499, p < 0.001] and greater CA1 volume compared with the normal BMI group [F(1,99) = 7.619, p = 0.007].
Conclusion: The BMI level is related to the inhibition control function and the gray matter volume of CA1 subregion in SCD. Overweight seems to increase the gray matter volume of CA1 in the elderly with SCD, but it is not enough to compensate for the damage to executive function caused by the disease. These data provide new insights into the relationship between BMI level and executive function of SCD from the perspective of imaging.
Introduction
Subjective cognitive decline (SCD) refers to the decline in subjective memory or cognitive function, but there is no obvious cognitive dysfunction and no obvious impairment of daily living ability in objective behavioral examination (Jessen et al., 2014). SCD is a state between normal aging and mild cognitive impairment (MCI), which is considered to be one of the most initial cognitive change in the pathogenesis of Alzheimer’s disease (AD) (Jessen et al., 2020). A recent study found that the prevalence of SCD in the elderly population > 50 years was 26.6% (Liew, 2019), and SCD increased the risk of progression to MCI in the elderly by 1.73 times and the risk of progression to AD by 1.9 times (Pike et al., 2021).
One variable that may play an important role in the development of AD is obesity, which is associated with numerous deleterious health conditions (Mallorquí-Bagué et al., 2018; Piché et al., 2020) including late-life dementia (Kivipelto et al., 2018). Body mass index (BMI), one measure of obesity, has a complex relationship with cognitive function in the elderly. Previous studies found that the cognitive dimensions of BMI’s impact are different across clinical stages of AD. For instance, in dementia or MCI stage of AD, a higher BMI is related to the worse overall cognitive function, memory, attention, and executive function in the elderly (Calderón-Garcidueñas et al., 2019; Sanchez-Flack et al., 2021). In the elderly population with normal cognitive status, higher BMI predicts worse executive function (Gunstad et al., 2007; Beyer et al., 2017), while BMI is not significantly associated with attention and memory dimensions (Schmeidler et al., 2019). These studies suggested that different from other cognitive dimensions the effects of BMI on executive function may appear to be present throughout different clinical stages of AD. However, the relationship between BMI and executive function in SCD (an early stage of AD) is unclear. In addition, our previous preliminary study found that overweight and obese patients with SCD had a worse executive function compared with patients with SCD in the normal weight group (Xu et al., 2021). However, a previous study lacked further investigation in normal controls (NCs) to check the interaction of BMI level and disease on executive function in patients with SCD. In addition, the underlying mechanism is also unclear.
Neuroimaging studies have suggested early AD-like structural brain alterations in SCD (Pini and Wennberg, 2021). The hippocampus plays a critical role in cognition (Lisman et al., 2017). A previous study found that SCD exhibits a consistent pattern of hippocampal atrophy (Chen et al., 2021). Some studies have observed a decreased hippocampal volume in individuals with SCD both at baseline and during a significant longitudinal decline (Scheef et al., 2012; Sánchez-Benavides et al., 2018; van Rooden et al., 2018; Yue et al., 2018), with an annual decrease of 1.9% (Cherbuin et al., 2015; Wang et al., 2020). The hippocampus is composed of multiple subregions such as the dentate gyrus (DG), cornu ammonis (CA) region, and subiculum (SUB), all of which play specific roles in the circuits of the hippocampus (O’Keefe et al., 2007). For example, the CA1 subregion and the entorhinal cortex can represent a variety of different information (time, space, etc.), and the SUB, as a transition region between the two subregions, can accept the direct input of synapses in CA1 subregion and project it to different cortex and subcortical regions (Matsumoto et al., 2019); CA1, CA2/3, and DG play complementary roles in supporting episodic memory by allowing one to remember specific items, as well as their relationships, within a shared context (Dimsdale-Zucker et al., 2018). With the progression of AD, the volume of hippocampal subregions shows an obvious decreasing trend (Zhao et al., 2019). Studies have found that in people with risk of AD smaller volumes of the hippocampal fimbria, presubiculum, and SUB showed the associations with poor performance on executive function (Evans et al., 2018). While in patients with MCI, smaller hippocampal subregion (CA1) volume is associated with worse executive function (Suo et al., 2017). However, the relationship between the hippocampal subregion and the executive function subdimension in SCD is still not clear.
It is worth mentioning that the hippocampus is a key structure involved in body weight regulation (Davidson et al., 2007; Kanoski and Grill, 2017). Neuroimaging studies incorporating structural magnetic resonance imaging (MRI) reported that patients with AD with higher BMI levels have a smaller hippocampal volume (Ly et al., 2021). However, the relationship between BMI and cognitive function/hippocampal volume in different stages of AD is inconsistent. Kivimäki et al. (2018) reported that when BMI was assessed > 20 years before the diagnosis of dementia, a higher BMI was associated with an increased risk of dementia, whereas when BMI was assessed < 10 years before the diagnosis, a lower BMI predicted dementia. In addition, studies reported that overweight/obesity was positively correlated with the hippocampal volume of subjects (Widya et al., 2011; Ma et al., 2019). Animal experiments show that obesity affects the hippocampal subregion (CA1, CA3) of rats with pre-AD and MCI models (Ivanova et al., 2020). However, it is unclear what the effects are of different BMIs on the volume of the hippocampal subregion in the elderly with SCD and whether there is an interactive effect between the BMI and disease condition on the volume of hippocampal subregions.
This study aims to compare the difference in executive function of the elderly SCD and NC with different BMI levels and explore whether there are differences in hippocampal subregions related to BMI levels in different cognitive states. We hypothesized that the effect of BMI level on executive function in patients with SCD may be related especially to the hippocampal subregion gray matter volume.
Materials and methods
Participants
In this study, we recruited 111 elderly subjects aged > 60 years, who voluntarily participated in a free questionnaire survey and physical examination in communities in Fuzhou, Fujian Province, including 65 elderly people with SCD and 46 elderly NC. The SCD and NC participants were divided into normal BMI group and overweight/obesity (high BMI) group according to the Chinese adult overweight and obesity prevention and control guidelines (China Obesity Working Group, 2004) (normal weight, BMI between 18.5 and 23.9 kg/m2; overweight and obese, BMI ≥ 24.0 kg/m2). This study was approved by the Medical Ethics Committee of the Affiliated Rehabilitation Hospital of Fujian University of Traditional Chinese Medicine. All participants signed an informed consent form before taking the tests.
Inclusion criteria of SCD included (1) meeting the SCD conceptual framework proposed by Jessen et al. (2014) and China AD Preclinical Alliance (Ying Han, 2018); (2) aged 60–75 years; (3) BMI ≥ 18.5 kg/m2; and (4) informed consent, voluntary participation. The SCD conceptual framework was as follows: (1) subjective decline in memory rather than other domains of cognition; (2) onset of SCD within the last 5 years; (3) age at SCD onset of at least 60 years; (4) worries associated with SCD; (5) worse self-perceived memory than others in the same age group; and (6) absence of objective clinical impairment of MCI, Montreal Cognitive Assessment (MoCA) (Nasreddine et al., 2005) total score ≥ 26 (Langa and Levine, 2014).
Normal cognitive control inclusion criteria included (1) normal activities of daily living; (2) no self-SCD and no obvious memory impairment; (3) normal cognitive testing (MoCA score ≥ 26 points); (4) no significant behavioral and language impairments; (5) aged 60–75 years; (6) BMI ≥ 18.5 kg/m2; and (7) informed consent, voluntary participation.
Subjective cognitive decline and NC exclusion criteria included (1) hypertensive patients with uncontrolled blood pressure; (2) history of alcohol and drug abuse; (3) severe anxiety and depression, as indicated by the Hamilton Depression Scale (HAMD) (Hamilton, 1960) score > 24 points or Hamilton Anxiety Scale (HAMA) (Hamilton, 1959) score > 29 points; (4) decline in cognitive function caused by other diseases (such as mental diseases and poisoning); and (5) unable to cooperate with the tester due to other physiological and psychological reasons.
Clinical assessment
In the form of a questionnaire, the basic demographic data of the subjects (age, gender, BMI, years of education) and medical history (hypertension, hyperlipidemia, type II diabetes mellitus [T2DM], etc.), as well as medication history, were recorded in detail by professionally trained assessors. Medication history refers to the last 3-month routine medication self-reported by subjects when receiving the questionnaire of this study. We mainly recorded the use of drugs that control hypertension, hyperlipidemia, and T2DM. In addition, any other medication the participant used within the last 3 months was also recorded.
Neuropsychological assessment
Montreal Cognitive Assessment was used to assess the global cognitive function of subjects, with a total score of 30 points (the higher the score, the better the global cognitive function). HAMD and HAMA were used to assess the severity of depression and anxiety.
The Stroop Color-Word Test (SCWT) (Golden and Golden, 1981) evaluates the executive function. The SCWT version (Xu et al., 2021) adopted in this study consists of three cards, each with 24 characters. SCWT A is composed of red, yellow, blue, or green dots; SCWT B is composed of Chinese characters printed in the same color (red, yellow, blue, or green, the color of the characters is consistent with the meaning of the word); and SCWT C prints four kinds of Chinese characters with different colors (red, yellow, blue, or green, the color of the characters is inconsistent with the meaning of the word, such as “yellow” printed in red color). The longer the response time of each card, the worse the execution function (Wecker et al., 2000; Homack and Riccio, 2004). The analysis indicators are the reaction time of each card and the SCWT C-B reaction time. A larger SCWT C-B reaction time represents greater interference from conflicting response sets or poorer inhibitory control (Scarpina and Tagini, 2017; Rabi et al., 2020).
Brain imaging acquisition
The brain MRI data were acquired on a 3.0 T Prisma scanner system (Siemens Medical Solutions, Erlangen, Germany) with a 64–channel head coil. Before MRI scanning, inform the precautions of MRI scanning again and sign the consent form for MRI scanning. Confirm that the subjects have no scanning contraindications such as metal implants and claustrophobia. Ask the subjects to stay still during the scanning process, use rubber earplugs and soft head pads to reduce noise, and fix the position of the head. If they feel uncomfortable, press the alarm in their hand to instruct the staff to stop the scanning. The T1–MPRAGE images were collected using the following parameters: field of view, 256 mm * 256 mm; repetition time, 2,300 ms; echo time, 2.94 ms; flip angle, 15°; slice thickness, 1 mm; and slices, 160. In addition, all subjects in this study were screened with an appropriate MRI scan (T2-weighted sequence) to check the vascular injuries such as stroke and brain tumor before initiation of the study. None of the eligible subjects included had obvious vascular lesions.
Brain imaging processing
The T1 image data were preprocessed using the MRIconvert (a toolbox for image data conversion, version 2.0 Rev. 2351) and FreeSurfer software (a toolbox for image data analysis, version 7.1.02) under the Lunix system.
The FreeSurfer 7.1.0 software was used to extract the hippocampal volume in the subcortical nucleus segmentation file of each subject generated by pretreatment. During segmentation, the image of each subject is first converted from the individual space to the FreeSurfer standard space to ensure accurate segmentation, and then the hippocampus of each subject is divided into 19 regions according to the hippocampal subregion segmentation template on the official website of FreeSurfer.3 According to Supplementary Table 1, the subdivided 19 regions were combined into hippocampal tail, hippocampal fissure, fimbria, parasubiculum, subiculum, presubiculum, CA1, CA3, CA4, molecular layer, granule cell layer, and molecular layer of the dentate gyrus (GC-ML-DG) and hippocampal amygdala transition area (HATA), the 12 hippocampal subregions, and CA2 is always included in CA3 (Fischl, 2012; Iglesias et al., 2015; Supplementary Figure 1).
Statistical analysis
Behavioral data analysis
Analysis was performed using the SPSS software (version 26.0 for Windows, IL, United States). The categorical variables are expressed by the number of cases n (%), and the comparison between groups was performed using chi-square test. The continuous variables are expressed as mean ± SD, and the comparison between groups was performed using one-way ANOVA. If p < 0.05, the difference was considered to be statistically significant, and the post hoc comparison was performed using Fisher’s least significant difference method.
Two-way ANOVA was used for the comparison between groups of SCWT test (the first factor was population grouping and the second factor was BMI grouping, to explore the main effects of population grouping and BMI grouping and the interaction between them). Age, gender, and years of education were used as covariates; p < 0.05 was considered to be statistically significant. When there is an interaction between population grouping and BMI grouping, simple main effect and paired comparative analysis were used to further study whether different populations and different BMI improve or reduce executive function.
Brain imaging analysis
The volume of each subject’s hippocampal subregion was extracted and analyzed by two-way ANOVA based on region of interest (ROI) level (the first factor is population grouping and the second factor is BMI grouping) with the total hippocampal volume, intracranial volume, age/gender/years of education/hypertension/hyperlipidemia/T2DM as covariates. The brain regions with interactive gray matter volume differences were obtained, and the interaction effects between them were further analyzed using the SPSS 26.0 software. When there is an interaction between population grouping and BMI grouping, simple main effect and paired comparative analysis were used to further study whether different populations and different BMI increase or decrease the gray matter volume of hippocampal subregions. For the brain area with significant interaction, the association between the gray matter volume and the corresponding score of SCWT test was done using the partial correlation analysis with age, gender, and years of education as covariates. Multiple comparisons were corrected using Bonferroni method.
Results
Demographic characteristics
The comparison of general demographic data and personal medical history of each group (i.e., NC-normal BMI, NC-high BMI, SCD-normal BMI, SCD-high BMI) is shown in Table 1. The results of intergroup comparison showed that no significant group difference was found among the general demographic data of the four groups except BMI. After adjusting for age, gender, and years of education, the mean MoCA score of subjects with SCD included in this study was 27.40 ± 1.07 ≥ 26, which suggested that there was no obvious objective index abnormality.
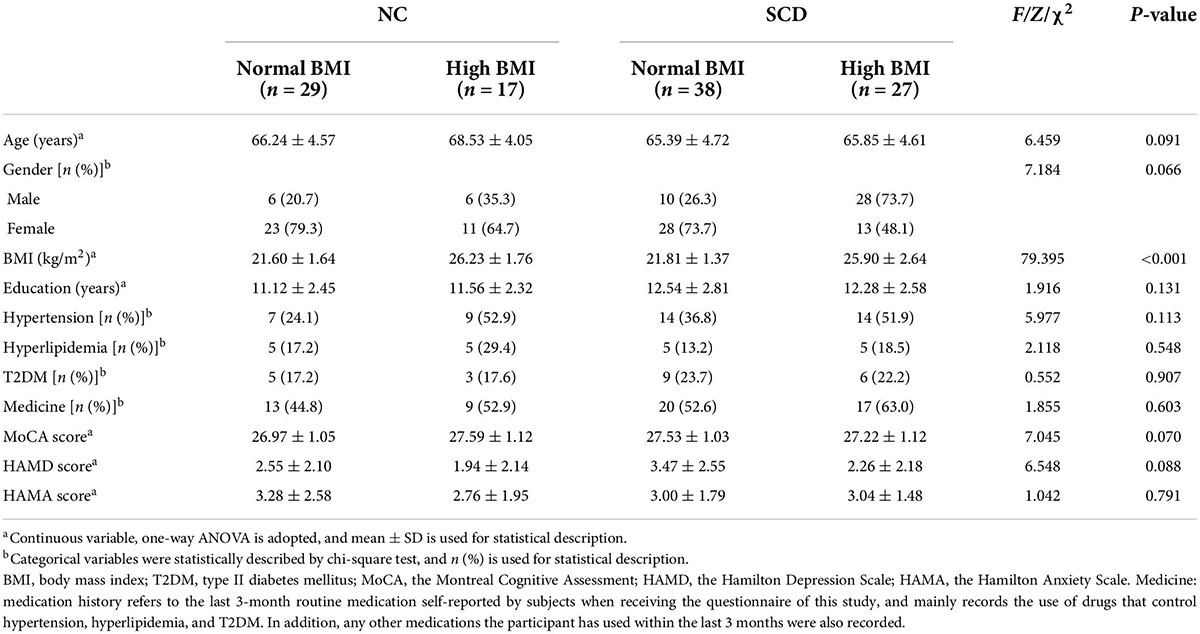
Table 1. Demographics, disease medical history, and cognitive features of participants.
Neuropsychological characteristics
Montreal Cognitive Assessment score, HAMD score, and HAMA score of each group (NC-normal BMI, NC-high BMI, SCD-normal BMI, and SCD-high BMI) are compared in Table 1. The results of intergroup comparison showed that there was no significant difference in MOCA score, HAMD score, and HAMA score among the four groups (p > 0.05).
The comparison of SCWT scores of each group is shown in Table 2. We observed significant interaction effects for SCWT C reaction time (s) [F(1,104) = 8.017, p = 0.006, partial η2 = 0.072] and SCWT C-B reaction time (s) [F(1,104) = 5.732, p = 0.018, partial η2 = 0.052], as well as significant population main effects [SCWT C reaction time (s): F(1,104) = 32.745, p < 0.001; SCWT C-B reaction time (s): F(1,104) = 23.411, p < 0.001] and BMI main effects [SCWT C reaction time (s): F(1,104) = 7.593, p = 0.007; SCWT C-B reaction time (s): F(1,104) = 5.33, p = 0.023], respectively.
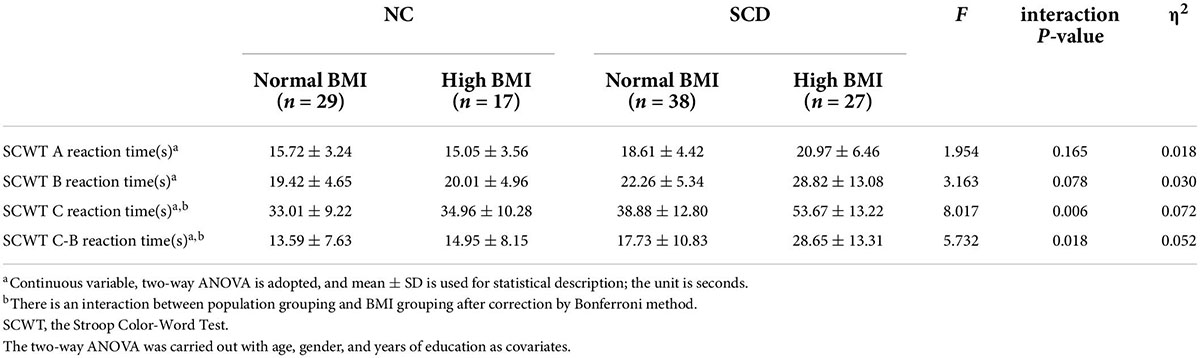
Table 2. Comparison of SCWT response time of participants.
Post hoc analysis showed that the SCWT C reaction time (s) and SCWT C-B reaction time (s) of the SCD-normal BMI group were significantly larger than the NC-normal BMI group, which indicates that the inhibitory control function of the SCD-normal BMI group was worse than the NC-normal BMI group [SCWT C reaction time (s): F(1,104) = 6.050, p = 0.016; SCWT C-B reaction time (s): F(1,104) = 4.325, p = 0.040]. The SCWT C-B reaction time (s) of SCD-high BMI group was significantly higher than the NC-high BMI group, indicating that the inhibitory control function of the SCD-high BMI group was worse than the NC-high BMI group [SCWT C reaction time (s): F(1,104) = 30.115, p < 0.001; SCWT C-B reaction time (s): F(1,104) = 21.530, p < 0.001]. The SCWT C reaction time (s) and SCWT C-B reaction time (s) of the SCD-normal BMI group were significantly smaller than the SCD-high BMI group, suggesting that the inhibitory control function of the SCD-normal BMI group was better than those of the SCD-high BMI group [SCWT C reaction time (s): F(1,104) = 19.053, p < 0.001; SCWT C-B reaction time (s): F(1,104) = 13.499, p < 0.001]. There was no significant difference in the inhibitory control function [SCWT C reaction time (s): p = 0.982 > 0.05; SCWT C-B reaction time (s): p = 0.973 > 0.05] between the NC-normal BMI group and the NC-high BMI group. The results of SCWT C reaction time (s) and SCWT C-B reaction time (s) are given in Tables 2, 3.
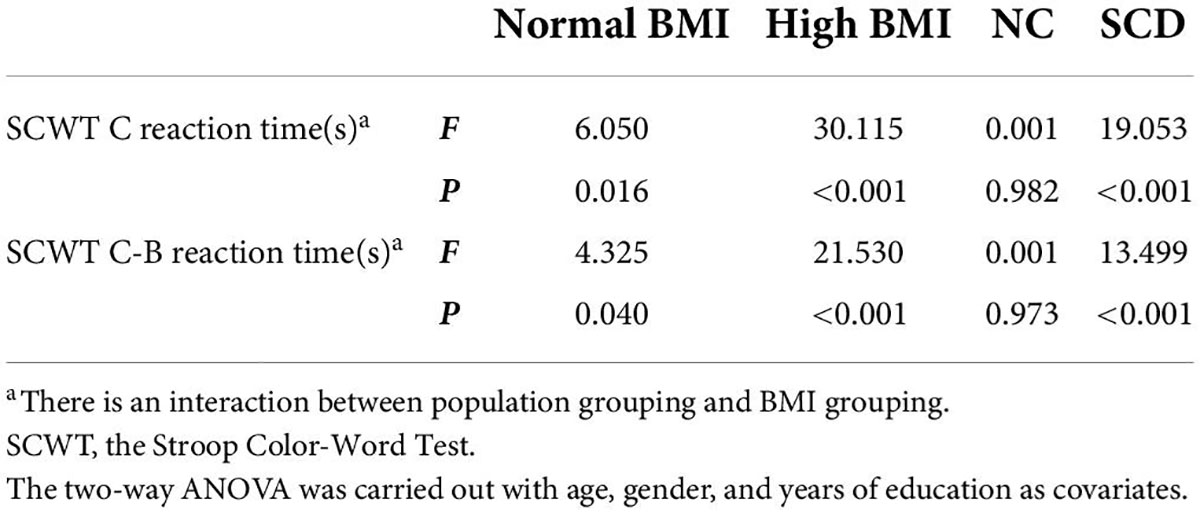
Table 3. Post hoc analysis of SCWT tests with interactions.
For SCWT A reaction time (s) and SCWT B reaction time (s), we did not find significant differences in the interaction terms between population grouping and BMI grouping (p > 0.05; see Table 2).
Brain imaging characteristics
A comparison of hippocampal subregion volume among the four groups is shown in Table 4. ANOVA showed that the population × BMI interaction had a significant effect on CA1 [F(1,99) = 8.607, p = 0.004, partial η2 = 0.080], molecular layer [F(1,99) = 6.309, p = 0.014, partial η2 = 0.060], and hippocampal tail [F(1,99) = 4.077, p = 0.046, partial η2 = 0.040]. Post hoc analysis showed that compared with SCD-normal BMI, CA1 [F(1,99) = 7.619, p = 0.007], molecular layer [F(1,99) = 6.351, p = 0.013], and hippocampal tail [F(1,99) = 4.481, p = 0.037] volumes were larger in the SCD-high BMI group. The volume of CA1 [F(1,99) = 4.938, p = 0.029] was smaller in the SCD-normal BMI group compared with the NC-normal BMI group. For other hippocampal subregions (hippocampal tail, hippocampal fissure, fimbria, parasubiculum, subiculum, presubiculum, CA3, CA4, GC-ML-DG, HATA), we did not find significant differences in the interaction term between population grouping and BMI grouping (p > 0.05; see Table 5).
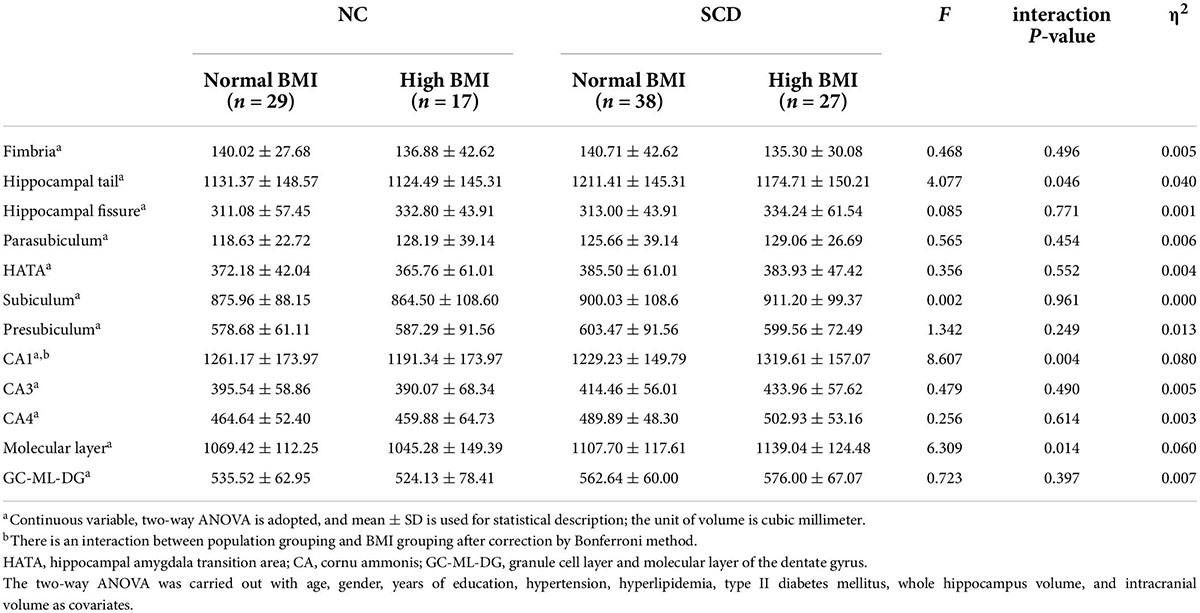
Table 4. Comparison of the gray matter volume of hippocampal subregions.
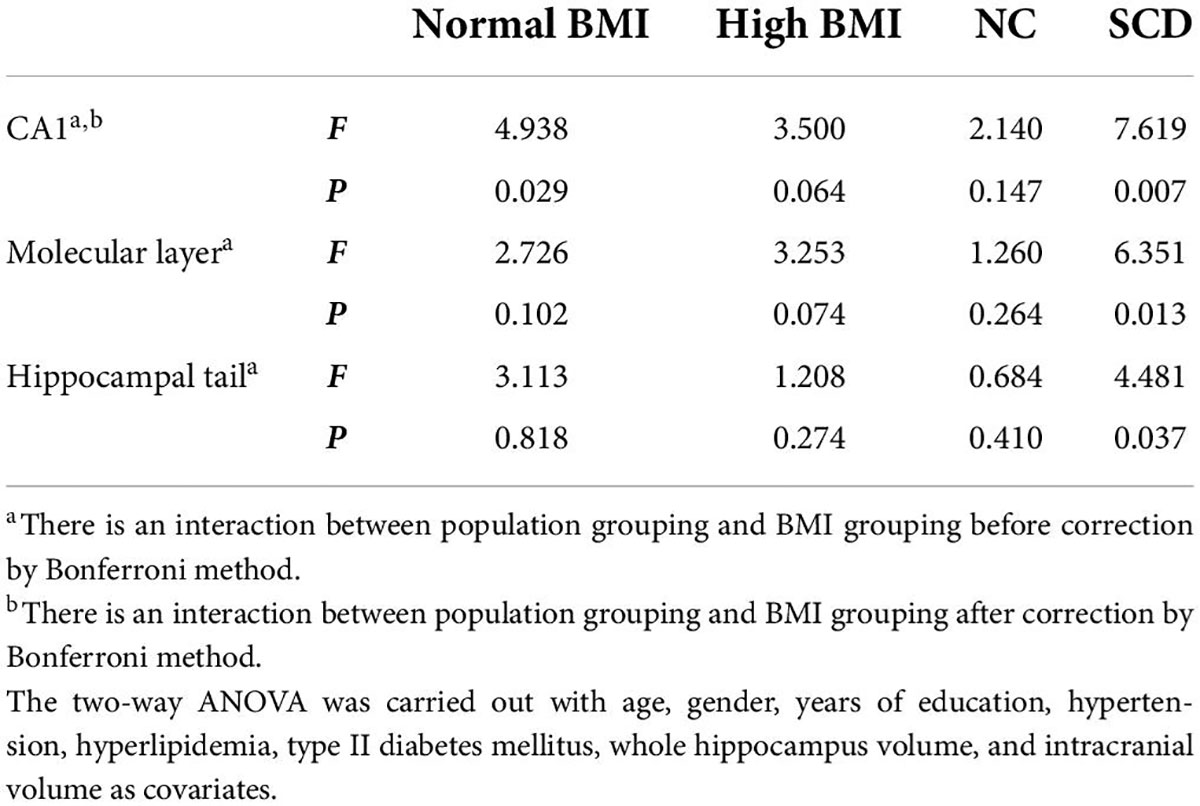
Table 5. Post hoc analysis of hippocampal subregions with interactions.
After correction by Bonferroni’s method, ANOVA showed that the population × BMI interaction had a significant effect on CA1. Post hoc analysis showed that in the normal BMI group gray matter volume was decreased in CA1 of SCD compared with NC; in the SCD population, gray matter volume of CA1 in the high BMI group was significantly increased compared with normal BMI (see Figure 1). In the NC population, we did not observe any significant effect of changes in BMI level on CA1 gray matter volume (p > 0.05). In the high BMI population, we did not observe any significant difference in CA1 gray matter volume between the SCD and NC population (p > 0.05).
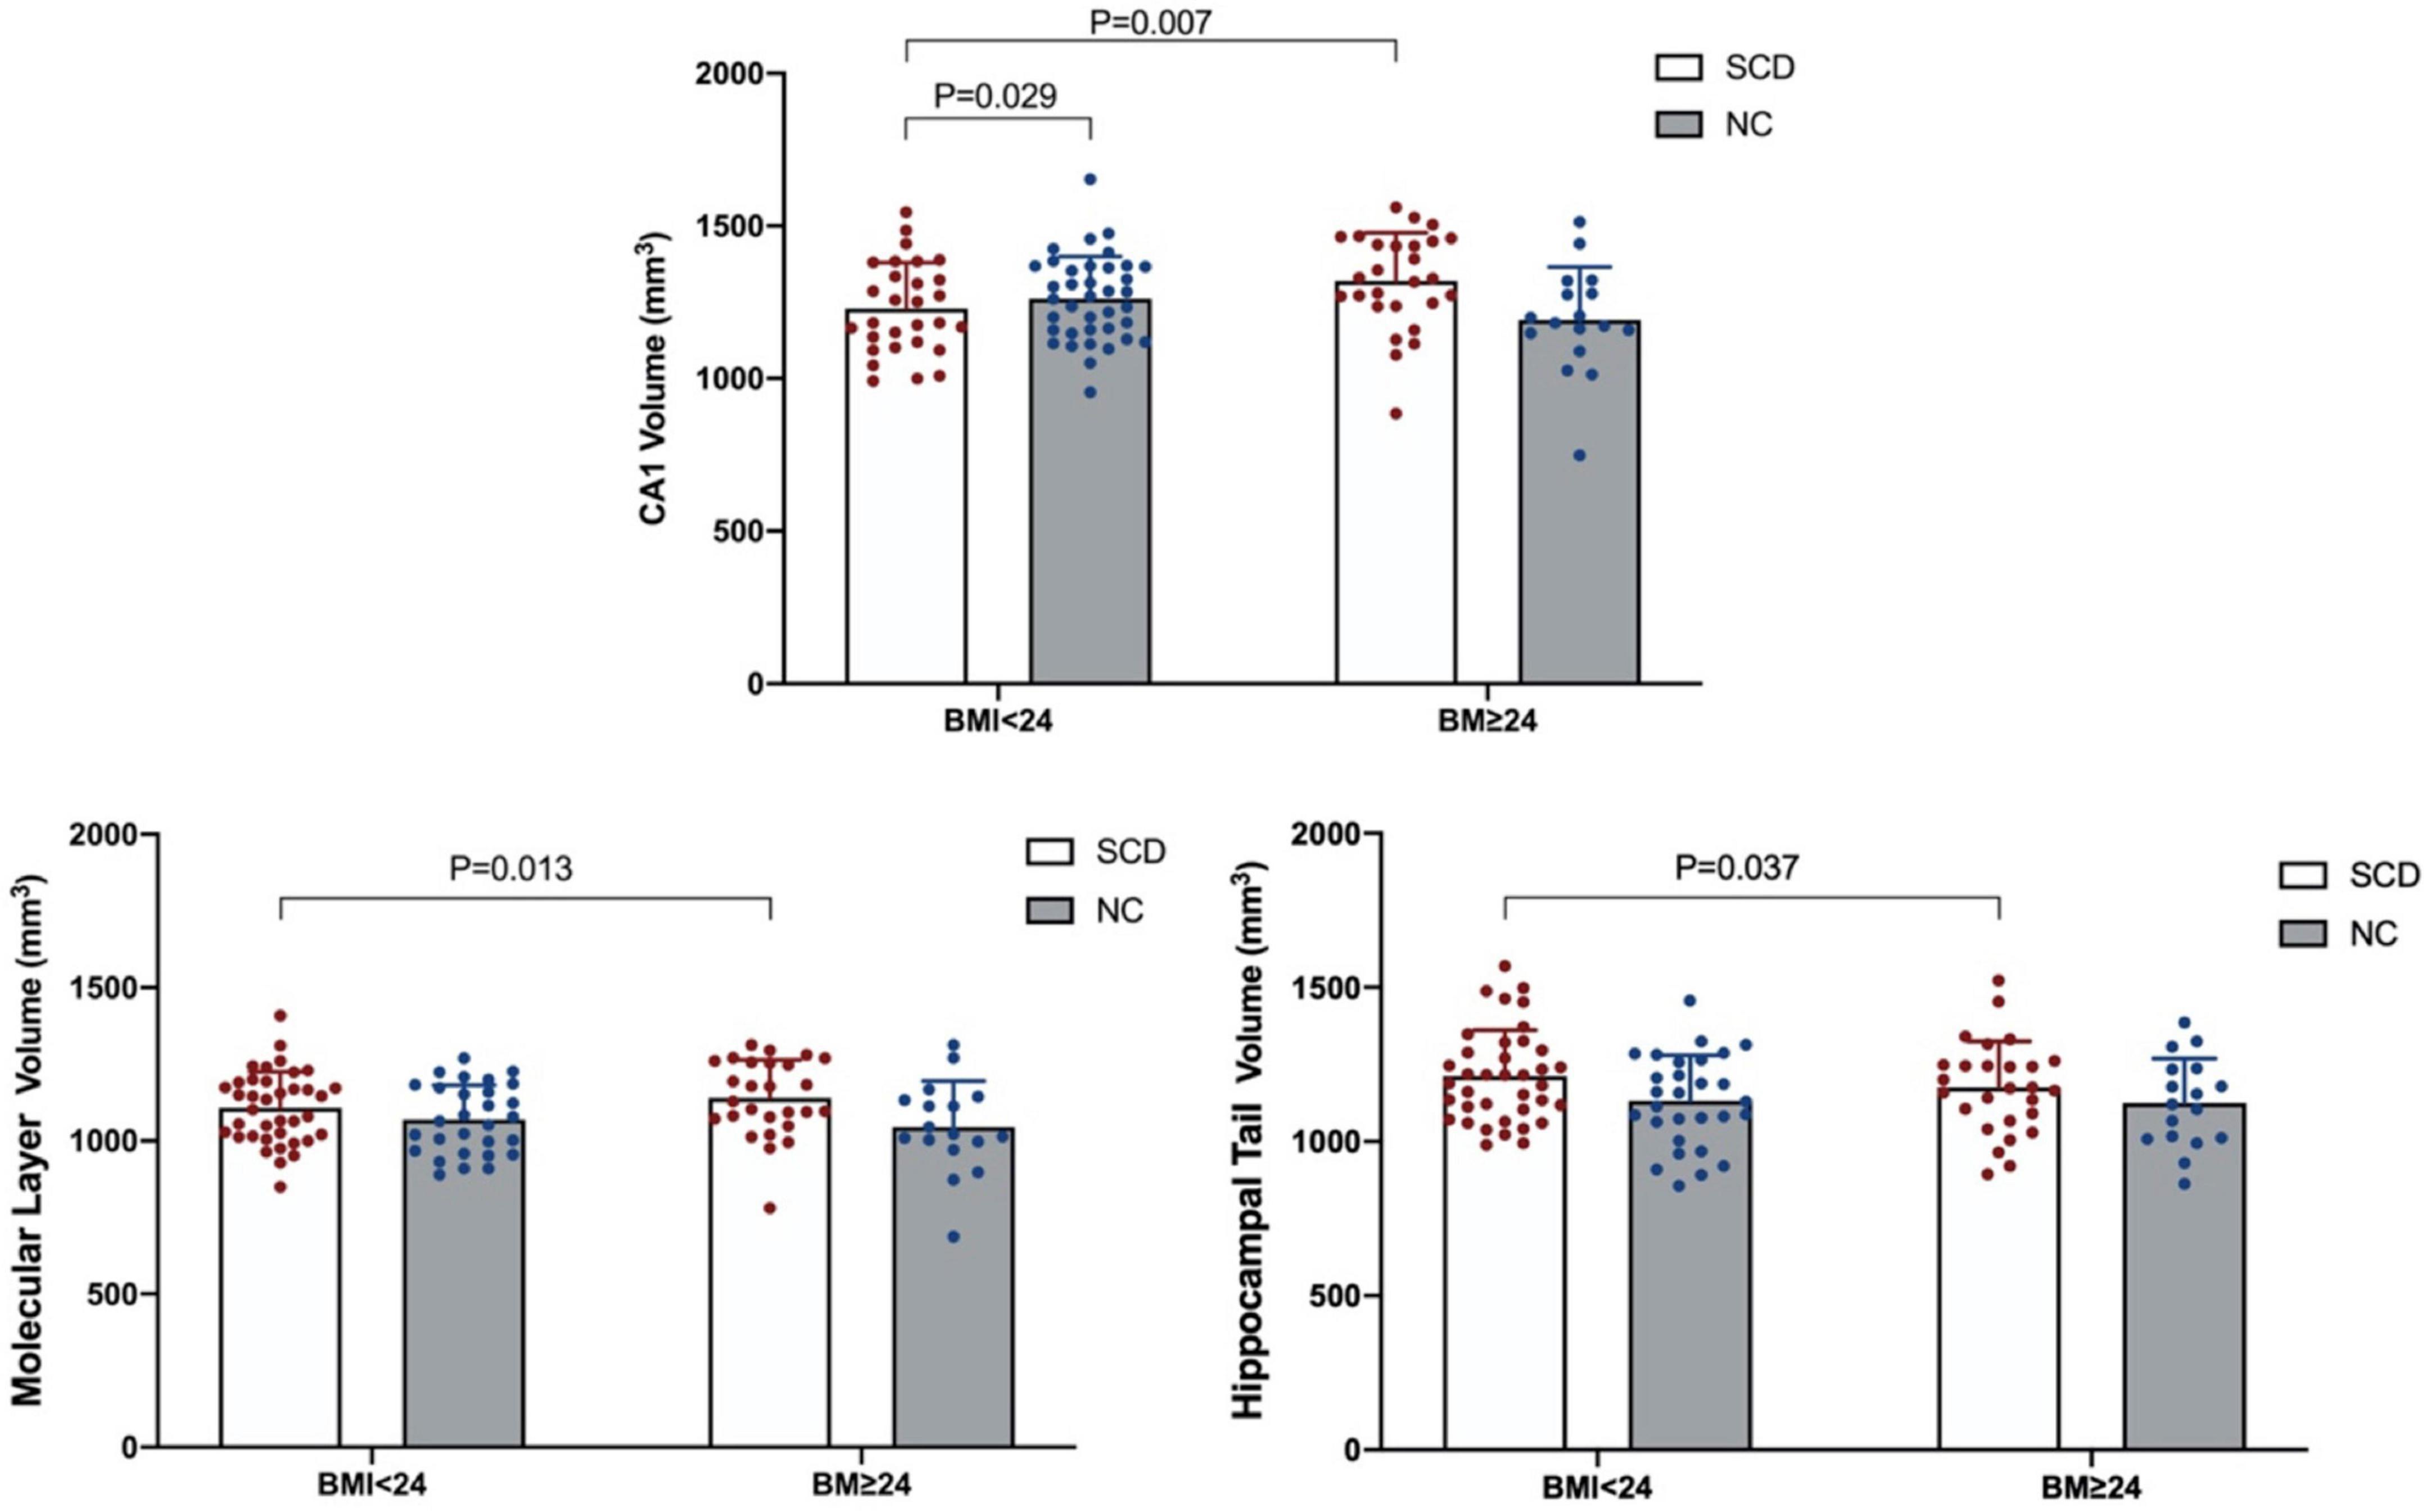
Figure 1. Significant population × BMI interaction effect on gray matter volume in the hippocampal subregion.
After correction by the Bonferroni method, we did not find significant correlation between gray matter volume changes in CA1 and SCWT C reaction time (s) (p > 0.05/4) or CA1 and SCWT C-B reaction time (s) (p > 0.05/4; see Supplementary Tables 2, 3).
Discussion
This study compared the effects of different BMI levels (high BMI and normal BMI) and different populations (SCD and NC) on executive function and hippocampal subregion volume. Our results showed significant interaction effects between the population group and BMI group in the executive function (inhibitory control function) and hippocampal subregion (CA1) gray matter volume. In addition, we found significant main effects in the BMI group and population group. Our results suggested that SCD has a worse executive function (inhibitory control function) than NC regardless of the BMI level, but overweight and obesity aggravate the degree of impairment of executive function in the elderly with SCD. For the normal BMI subgroup, the CA1 volume of SCD was smaller than that of NC. Furthermore, we found that in the SCD population the CA1 gray matter volume of high BMI was larger than that of normal BMI.
The present results suggest that SCD has a worse executive function (inhibitory control function) than NC in both overweight/obese and normal weight, which is partly consistent with previous studies. A study from Spain (López-Higes et al., 2017) showed that the executive function test (use the Stroop interference index to test) performance scores in the elderly with SCD were lower than healthy controls. This study found that the worse executive function of SCD compared with NC is mainly manifested in inhibitory control function. Although repeating the results of previous studies, this study considered the effect of BMI on patients with SCD and found that elevated BMI aggravated the impairment of inhibitory control function in patients with SCD. A meta-analysis (Yang Y. et al., 2018) showed that individuals who are overweight have deficits in working memory and inhibitory control function. Inhibitory control is an important subdimension of executive function (Dempster, 1992; Bjorklund and Harnishfeger, 1995). The impairment of inhibitory control functions has been identified as the most affected function in the subdomain of MCI executive function (Traykov et al., 2007; Brandt et al., 2009; Johns et al., 2012). These results may be explained from a neurophysiological perspective. Inhibitory-controlled behavior was found to be electrophysiologically correlated in patients with MCI, and neurocognitive mechanisms associated with response inhibition (No Go P300) were impaired in patients with MCI compared with healthy controls (López Zunini et al., 2016). In the preclinical stage of MCI, SCD may also have the same neurocognitive impairment as MCI, so we observed worse inhibitory control function in SCD compared with healthy subjects. As for the impact of BMI on the executive function of SCD, studies have shown that overweight or obesity can significantly reduce brain blood flow, lead to insufficient cerebral perfusion, with the brain lacking enough oxygen and nutrients for a long time, which is the early mechanism of AD (Knight et al., 2021), and is also related to worse executive function (Alosco et al., 2012). This may explain why the increase in BMI leads to the aggravation of executive function impairment in patients with SCD.
In addition, we also found a significant interaction between population grouping and BMI grouping in the hippocampal subregion (CA1), and the hippocampal subregion of CA1 significant atrophy in SCD compared with NC. A recent study (Worker et al., 2018) showed that patients with AD experience greater hippocampal subregional atrophy over time compared to NC subjects, including CA1, molecular layer, CA3, hippocampal tail, fissure, and presubiculum, among which CA1 and molecular layer is more obvious. We also found atrophy in the molecular layer of the hippocampus in SCD before Bonferroni correction, which is partly consistent with a previous study. The results seem plausible as the most distinctive AD-related neuron loss was seen in the CA1 region of the hippocampus, and the neuronal loss in CA1 is not an age-related phenomenon but rather characterizes an overt AD process (West et al., 1994). Some studies considered a sequential pattern of atrophy starting within entorhinal and transentorhinal areas and moving to CA1 and eventually other hippocampus subregions (Csernansky et al., 2005; Apostolova et al., 2010). SCD showed a similar pattern of volume atrophy in the hippocampal subregion as AD, preferentially and mainly involving the CA1 region (Perrotin et al., 2015). These findings may be related to the unique structure and function of hippocampal CA1. The CA1 region of the hippocampus maintains its neuroplastic flexibility well into adulthood and plays an important role in external and internal demands to serve cognitive processes (Walhovd et al., 2014b). However, studies have found that brain regions with high neuroplasticity are more prone to neurodegeneration (Neill, 2012; Bufill et al., 2013). The ability of CA1 may increase its vulnerability to neurotoxic effects, ultimately leading to structural atrophy and functional decline (Walhovd et al., 2014a; Nemeth et al., 2017). Deposition of Aβ occurs in the neocortex and hippocampus many years before the onset of clinical symptoms of AD (Sadigh-Eteghad et al., 2015), while the CA1 area is highly sensitive to pathological changes (Pluta et al., 2021). We therefore speculate that the loss of CA1 volume in subjects with SCD may be significantly associated with neuroplasticity in the hippocampal CA1 region.
It is worth mentioning that the result of this study also showed that the hippocampal subregion (CA1) volume of high BMI index in SCD is significantly higher than that of normal BMI population. A recent longitudinal imaging study (Sun et al., 2020) found that higher BMI in AD populations was associated with larger hippocampus volumes, which is partly consistent with the present result. Sun et al. (2020) pointed out that subjects with higher BMI showed a significant lower Aβ load using PET imaging. Previous studies have suggested that Aβ peptide deposition triggers tau hyperphosphorylation and aggregation in the form of neurofibrillary tangles, and these aggregates lead to inflammation, synaptic damage, neuronal loss, and thus decrease the brain volume (Nelson et al., 2012; He et al., 2018; Vogel et al., 2020; Roda et al., 2022). The accumulation of Aβ pathology enhances hippocampal atrophy in pre-AD (Gordon et al., 2016; Wang et al., 2016). In addition, in contrast to previous study, we found that the increased hippocampal volume caused by the increase in BMI is mainly in the CA1 area. A previous study found that medium and large Aβ plaques are significantly more numerous in CA1 than in other hippocampal subregions (Ugolini et al., 2018), and CA1 may be the most vulnerable region of the hippocampus to neuronal loss (Padurariu et al., 2012; Yang X. et al., 2018). We therefore reasoned that the increased CA1 volume in high-BMI subjects with SCD might be partly mediated by obesity reducing the accumulation of Aβ in the hippocampus.
However, the compensatory increase in CA1 volume in patients with SCD in this study does not appear to be sufficient to compensate for the impairment of executive function in patients with SCD, which is manifested by worse performance on executive function tests in patients with SCD compared with NC. Recent studies have shown that the hippocampus plays an important role in appetite and weight regulation (Alosco et al., 2017; Hsu et al., 2018; Li et al., 2021), and is crucial in the mediation of executive function (Li et al., 2019). Obesity, however, can lead to impaired executive function (Willeumier et al., 2011; Davidson et al., 2019). The results of this study may be explained by the leptin synthesized and secreted by adipocytes. Leptin is transported across the blood–brain barrier (BBB) via a saturable transport system (Banks, 2004) and is a potent modulator of excitatory synaptic transmission at hippocampal CA1 synapses (Irving and Harvey, 2014, 2021). Consequently, the ability of leptin to regulate excitatory synaptic efficacy at CA1 synapses suggests that leptin is likely to influence cognition processes (Hamilton and Harvey, 2021; Harvey, 2022). However, leptin transport across the BBB is impaired in high BMI phenotypes (Banks et al., 1999), which has an adverse effect on the synaptic transmission of hippocampal CA1 (Grillo et al., 2011). Furthermore, circulating leptin levels were significantly reduced in patients with cognitive impairment (Power et al., 2001; Johnston et al., 2014), which may explain why patients with SCD have increased CA1 gray matter volume and impaired executive function.
In this study, we did not find significant association between gray matter volume changes in CA1 and inhibitory control function. Previous studies have found that the impairment of executive function is not always correlated with the change of hippocampal subregion volume that is partly consistent with our results. Ge et al. (2021) showed that the volume of hippocampal subregions such as CA1 gradually decreased from the amyloid-negative group to the amyloid-positive group in the elderly people (including 87 individuals with normal cognition, 46 with MCI, and 10 with AD), and as amyloid pathology persisted, impairment of executive function was more significantly associated with changes in hippocampal tau lesions/volume. There seems to be a threshold effect in the relationship between hippocampal atrophy and executive function (Oosterman et al., 2012), that is, severe to very severe but not moderate hippocampal atrophy is associated with lower executive function. We speculate that due to the SCD in the preclinical stage of AD, its behavioral or brain pathological changes are not very serious, resulting in the weak correlation between executive function and hippocampal CA1 volume. Further study is needed to confirm this hypothesis.
This study has several limitations. First, the subjects we included did not contain any BMI level such as lower than 18.5 kg/m2, so it was impossible to examine the effects of insufficient body mass on executive function and hippocampal subregion. Secondly, the sample size included in this study is insufficient, which may lead to the instability of the research results. Furthermore, this is a cross-sectional study, and it is impossible to follow the subjects for a long time to observe the changes, correlations, and possible causes of cognitive function and hippocampal subregions caused by different BMI with the development of disease and age. Further longitudinal study should be done.
Conclusion
Our results showed that higher BMI was associated with lower levels of executive function in the SCD and larger hippocampal subregion (CA1) gray matter volume. These associations suggest that obesity increases hippocampal gray matter volume in the elderly with SCD but is not sufficient to compensate for the impairment of executive function caused by the disease. Future studies are necessary to better elucidate these associations from the perspective of other mechanisms.
Data availability statement
The raw data supporting the conclusions of this article will be made available by the authors, without undue reservation.
Ethics statement
The studies involving human participants were reviewed and approved by Medical Ethics Committee of the Affiliated Rehabilitation Hospital of Fujian University of Traditional Chinese Medicine, Fuzhou, Fujian, China. The patients/participants provided their written informed consent to participate in this study. Written informed consent was obtained from the individual(s) for the publication of any potentially identifiable images or data included in this article.
Author contributions
JLi: experimental design, analysis, and manuscript preparation and revision. RC: data analysis and manuscript preparation and revision. GC and SX: data collection and data analysis. QS and JLu: data collection. YW, ML, and HL: data analysis. All authors contributed to drafting the manuscript and have read and approved the final manuscript.
Funding
This study was supported by the National Natural Science Foundation of China (grant no. 81904270), the Natural Science Foundation of Fujian Province (grant no. 2019J01362), the Educational Department of Fujian Province Outstanding Youth Scientific Research Talent Cultivation Program (grant no. MinJiaoKe [2018] 47), and the Science and Technology Platform Construction Project of Fujian Science and Technology Department (grant no. 2015Y2001).
Acknowledgments
We thank the Affiliated Rehabilitation Hospital, Fujian University of Traditional Chinese Medicine, for assistance.
Conflict of interest
The authors declare that the research was conducted in the absence of any commercial or financial relationships that could be construed as a potential conflict of interest.
Publisher’s note
All claims expressed in this article are solely those of the authors and do not necessarily represent those of their affiliated organizations, or those of the publisher, the editors and the reviewers. Any product that may be evaluated in this article, or claim that may be made by its manufacturer, is not guaranteed or endorsed by the publisher.
Supplementary material
The Supplementary Material for this article can be found online at: https://www.frontiersin.org/articles/10.3389/fnagi.2022.905035/full#supplementary-material
Footnotes
- ^ https://www.softpedia.com/get/Science-CAD/MRIConvert.shtml
- ^ http://surfer.nmr.mgh.harvard.edu
- ^ https://surfer.nmr.mgh.harvard.edu/fswiki/HippocampalSubfieldsAn dNucleiOfAmygdala
References
Alosco, M. L., Duskin, J., Besser, L. M., Martin, B., Chaisson, C. E., Gunstad, J., et al. (2017). Modeling the relationships among late-life body mass index, cerebrovascular disease, and Alzheimer’s disease neuropathology in an autopsy sample of 1,421 subjects from the national Alzheimer’s coordinating center data set. J. Alzheimers Dis. 57, 953–968. doi: 10.3233/JAD-161205
Alosco, M. L., Spitznagel, M. B., Raz, N., Cohen, R., Sweet, L. H., Colbert, L. H., et al. (2012). Obesity interacts with cerebral hypoperfusion to exacerbate cognitive impairment in older adults with heart failure. Cerebrovasc. Dis. Extra 2, 88–98. doi: 10.1159/000343222
Apostolova, L. G., Mosconi, L., Thompson, P. M., Green, A. E., Hwang, K. S., Ramirez, A., et al. (2010). Subregional hippocampal atrophy predicts Alzheimer’s dementia in the cognitively normal. Neurobiol. Aging 31, 1077–1088. doi: 10.1016/j.neurobiolaging.2008.08.008
Banks, W. A. (2004). The many lives of leptin. Peptides 25, 331–338. doi: 10.1016/j.peptides.2004.02.014
Banks, W. A., DiPalma, C. R., and Farrell, C. L. (1999). Impaired transport of leptin across the blood-brain barrier in obesity. Peptides 20, 1341–1345. doi: 10.1016/s0196-9781(99)00139-4
Beyer, F., Kharabian Masouleh, S., Huntenburg, J. M., Lampe, L., Luck, T., Riedel-Heller, S. G., et al. (2017). Higher body mass index is associated with reduced posterior default mode connectivity in older adults. Hum. Brain Mapp. 38, 3502–3515. doi: 10.1002/hbm.23605
Bjorklund, D. F., and Harnishfeger, K. K. (1995). “The evolution of inhibition mechanisms and their role in human cognition and behavior,” in Interference and inhibition in cognition, eds F. N. Dempster and C. J. Brainerd (San Diego, CA: Academic Press), 141–173.
Brandt, J., Aretouli, E., Neijstrom, E., Samek, J., Manning, K., Albert, M. S., et al. (2009). Selectivity of executive function deficits in mild cognitive impairment. Neuropsychology 23, 607–618.
Bufill, E., Blesa, R., and Augustí, J. (2013). Alzheimer’s disease: An evolutionary approach. J. Anthropol. Sci. 91, 135–157.
Calderón-Garcidueñas, L., Mukherjee, P. S., Kulesza, R. J., Torres-Jardón, R., Hernández-Luna, J., Ávila-Cervantes, R., et al. (2019). Mild cognitive impairment and dementia involving multiple cognitive domains in Mexican Urbanites. J. Alzheimers Dis. 68, 1113–1123. doi: 10.3233/jad-181208
Chen, B., Wang, Q., Zhong, X., Mai, N., Zhang, M., Zhou, H., et al. (2021). Structural and functional abnormalities of olfactory-related regions in subjective cognitive decline, mild cognitive impairment and Alzheimer’s disease. Int. J. Neuropsychopharmacol. 25, 361–374. doi: 10.1093/ijnp/pyab091
Cherbuin, N., Sargent-Cox, K., Fraser, M., Sachdev, P., and Anstey, K. J. (2015). Being overweight is associated with hippocampal atrophy: The PATH through life study. Int. J. Obes. 39, 1509–1514. doi: 10.1038/ijo.2015.106
China Obesity Working Group (2004). Guidelines for the prevention and control of overweight and obesity in Chinese adults (excerpt). Acta Nutr. Sin. 26, 1–4.
Csernansky, J. G., Wang, L., Swank, J., Miller, J. P., Gado, M., McKeel, D., et al. (2005). Preclinical detection of Alzheimer’s disease: Hippocampal shape and volume predict dementia onset in the elderly. Neuroimage 25, 783–792. doi: 10.1016/j.neuroimage.2004.12.036
Davidson, T. L., Jones, S., Roy, M., and Stevenson, R. J. (2019). The cognitive control of eating and body weight: It’s more than what you “Think”. Front. Psychol. 10:62. doi: 10.3389/fpsyg.2019.00062
Davidson, T. L., Kanoski, S. E., Schier, L. A., Clegg, D. J., and Benoit, S. C. (2007). A potential role for the hippocampus in energy intake and body weight regulation. Curr. Opin. Pharmacol. 7, 613–616. doi: 10.1016/j.coph.2007.10.008
Dempster, F. N. (1992). The rise and fall of the inhibitory mechanism: Toward a unified theory of cognitive development and aging. Dev. Rev. 12, 45–75.
Dimsdale-Zucker, H. R., Ritchey, M., Ekstrom, A. D., Yonelinas, A. P., and Ranganath, C. (2018). CA1 and CA3 differentially support spontaneous retrieval of episodic contexts within human hippocampal subfields. Nat. Commun. 9, 294–294. doi: 10.1038/s41467-017-02752-1
Evans, T. E., Adams, H. H. H., Licher, S., Wolters, F. J., van der Lugt, A., Ikram, M. K., et al. (2018). Subregional volumes of the hippocampus in relation to cognitive function and risk of dementia. Neuroimage 178, 129–135. doi: 10.1016/j.neuroimage.2018.05.041
Ge, X., Zhang, D., Qiao, Y., Zhang, J., Xu, J., and Zheng, Y. (2021). Association of Tau pathology with clinical symptoms in the subfields of hippocampal formation. Front. Aging Neurosci. 13:672077. doi: 10.3389/fnagi.2021.672077
Golden, C., and Golden, C. (1981). Stroop color and word test: A manual for clinical and experimental uses. Wood Dale, IL: Stoelting Company.
Gordon, B. A., Blazey, T., Su, Y., Fagan, A. M., Holtzman, D. M., Morris, J. C., et al. (2016). Longitudinal β-amyloid deposition and hippocampal volume in preclinical Alzheimer disease and suspected non-Alzheimer disease pathophysiology. JAMA Neurol. 73, 1192–1200. doi: 10.1001/jamaneurol.2016.2642
Grillo, C. A., Piroli, G. G., Evans, A. N., Macht, V. A., Wilson, S. P., Scott, K. A., et al. (2011). Obesity/hyperleptinemic phenotype adversely affects hippocampal plasticity: Effects of dietary restriction. Physiol. Behav. 104, 235–241. doi: 10.1016/j.physbeh.2010.10.020
Gunstad, J., Paul, R. H., Cohen, R. A., Tate, D. F., Spitznagel, M. B., and Gordon, E. (2007). Elevated body mass index is associated with executive dysfunction in otherwise healthy adults. Compr. Psychiatry 48, 57–61. doi: 10.1016/j.comppsych.2006.05.001
Hamilton, K., and Harvey, J. (2021). Leptin regulation of hippocampal synaptic function in health and disease. Vitam. Horm. 115, 105–127. doi: 10.1016/bs.vh.2020.12.006
Hamilton, M. (1960). A rating scale for depression. J. Neurol. Neurosurg. Psychiatry 23, 56–62. doi: 10.1136/jnnp.23.1.56
Harvey, J. (2022). Leptin regulation of synaptic function at hippocampal TA-CA1 and SC-CA1 synapses. Vitam. Horm. 118, 315–336. doi: 10.1016/bs.vh.2021.12.002
He, Z., Guo, J. L., McBride, J. D., Narasimhan, S., Kim, H., Changolkar, L., et al. (2018). Amyloid-β plaques enhance Alzheimer’s brain tau-seeded pathologies by facilitating neuritic plaque tau aggregation. Nat. Med. 24, 29–38. doi: 10.1038/nm.4443
Homack, S., and Riccio, C. A. (2004). A meta-analysis of the sensitivity and specificity of the Stroop color and word test with children. Arch. Clin. Neuropsychol. 19, 725–743. doi: 10.1016/j.acn.2003.09.003
Hsu, T. M., Noble, E. E., Reiner, D. J., Liu, C. M., Suarez, A. N., Konanur, V. R., et al. (2018). Hippocampus ghrelin receptor signaling promotes socially-mediated learned food preference. Neuropharmacology 131, 487–496. doi: 10.1016/j.neuropharm.2017.11.039
Iglesias, J. E., Augustinack, J. C., Nguyen, K., Player, C. M., Player, A., Wright, M., et al. (2015). A computational atlas of the hippocampal formation using ex vivo, ultra-high resolution MRI. Neuroimage 115, 115–137. doi: 10.1016/j.neuroimage.2015.04.042
Irving, A., and Harvey, J. (2021). Regulation of hippocampal synaptic function by the metabolic hormone leptin: Implications for health and disease. Prog. Lipid Res. 82:101098. doi: 10.1016/j.plipres.2021.101098
Irving, A. J., and Harvey, J. (2014). Leptin regulation of hippocampal synaptic function in health and disease. Philos. Trans. R Soc. Lond. B Biol. Sci. 369:20130155. doi: 10.1098/rstb.2013.0155
Ivanova, N., Liu, Q., Agca, C., Agca, Y., Noble, E. G., Whitehead, S. N., et al. (2020). White matter inflammation and cognitive function in a co-morbid metabolic syndrome and prodromal Alzheimer’s disease rat model. J. Neuroinflamm. 17, 29. doi: 10.1186/s12974-020-1698-7
Jessen, F., Amariglio, R. E., Boxtel, M. V., Breteler, M., Ceccaldi, M., Chételat, G., et al. (2014). A conceptual framework for research on subjective cognitive decline in preclinical Alzheimer’s disease. Alzheimers Dement. 10, 844–852.
Jessen, F., Amariglio, R. E., Buckley, R. F., van der Flier, W. M., Han, Y., Molinuevo, J. L., et al. (2020). The characterisation of subjective cognitive decline. Lancet 19, 271–278. doi: 10.1016/S1474-4422(19)30368-0
Johns, E. K., Phillips, N. A., Belleville, S., Goupil, D., Babins, L., Kelner, N., et al. (2012). The profile of executive functioning in amnestic mild cognitive impairment: Disproportionate deficits in inhibitory control. J. Int. Neuropsychol. Soc. 18, 541–555. doi: 10.1017/S1355617712000069
Johnston, J. M., Hu, W. T., Fardo, D. W., Greco, S. J., Perry, G., Montine, T. J., et al. (2014). Low plasma leptin in cognitively impaired ADNI subjects: Gender differences and diagnostic and therapeutic potential. Curr. Alzheimer Res. 11, 165–174. doi: 10.2174/1567205010666131212114156
Kanoski, S. E., and Grill, H. J. (2017). Hippocampus contributions to food intake control: Mnemonic, neuroanatomical, and endocrine mechanisms. Biol. Psychiatry 81, 748–756. doi: 10.1016/j.biopsych.2015.09.011
Kivimäki, M., Luukkonen, R., Batty, G. D., Ferrie, J. E., Pentti, J., Nyberg, S. T., et al. (2018). Body mass index and risk of dementia: Analysis of individual-level data from 1.3 million individuals. Alzheimers Dement. 14, 601–609. doi: 10.1016/j.jalz.2017.09.016
Kivipelto, M., Mangialasche, F., and Ngandu, T. (2018). Lifestyle interventions to prevent cognitive impairment, dementia and Alzheimer disease. Nat. Rev. Neurol. 14, 653–666. doi: 10.1038/s41582-018-0070-3
Knight, S. P., Laird, E., Williamson, W., O’Connor, J., Newman, L., Carey, D., et al. (2021). Obesity is associated with reduced cerebral blood flow – Modified by physical activity. Neurobiol. Aging 105, 35–47. doi: 10.1016/j.neurobiolaging.2021.04.008
Langa, K. M., and Levine, D. A. (2014). The diagnosis and management of mild cognitive impairment: A clinical review. JAMA 312, 2551–2561. doi: 10.1001/jama.2014.13806
Li, G., Hu, Y., Zhang, W., Ding, Y., Wang, Y., Wang, J., et al. (2021). Resting activity of the hippocampus and amygdala in obese individuals predicts their response to food cues. Addict. Biol. 26:e12974. doi: 10.1111/adb.12974
Li, Y., Shen, M., Stockton, M. E., and Zhao, X. (2019). Hippocampal deficits in neurodevelopmental disorders. Neurobiol. Learn. Memory 165:106945. doi: 10.1016/j.nlm.2018.10.001
Liew, T. M. (2019). Depression, subjective cognitive decline, and the risk of neurocognitive disorders. Alzheimers Res. Ther. 11:70. doi: 10.1186/s13195-019-0527-7
Lisman, J., Buzsáki, G., Eichenbaum, H., Nadel, L., Ranganath, C., and Redish, A. D. (2017). Viewpoints: How the hippocampus contributes to memory, navigation and cognition. Nat. Neurosci. 20, 1434–1447. doi: 10.1038/nn.4661
López Zunini, R. A., Knoefel, F., Lord, C., Breau, M., Sweet, L., Goubran, R., et al. (2016). P300 amplitude alterations during inhibitory control in persons with mild cognitive impairment. Brain Res. 1646, 241–248. doi: 10.1016/j.brainres.2016.06.005
López-Higes, R., Prados, J. M., Rubio, S., Montejo, P., and Del Río, D. (2017). Executive functions and linguistic performance in SCD older adults and healthy controls. Neuropsychol. Dev. Cogn. B Aging Neuropsychol. Cogn. 24, 717–734. doi: 10.1080/13825585.2016.1256370
Ly, M., Raji, C. A., Yu, G. Z., Wang, Q., Wang, Y., Schindler, S. E., et al. (2021). Obesity and white matter neuroinflammation related edema in Alzheimer’ disease dementia biomarker negative cognitively normal individuals. J. Alzheimers Dis. 79, 1801–1811. doi: 10.3233/JAD-201242
Ma, L.-Z., Huang, Y.-Y., Wang, Z.-T., Li, J.-Q., Hou, X.-H., Shen, X.-N., et al. (2019). Metabolically healthy obesity reduces the risk of Alzheimer’s disease in elders: A longitudinal study. Aging 11, 10939–10951. doi: 10.18632/aging.102496
Mallorquí-Bagué, N., Lozano-Madrid, M., Toledo, E., Corella, D., Salas-Salvadó, J., Cuenca-Royo, A., et al. (2018). Type 2 diabetes and cognitive impairment in an older population with overweight or obesity and metabolic syndrome: Baseline cross-sectional analysis of the PREDIMED-plus study. Sci. Rep. 8:16128. doi: 10.1038/s41598-018-33843-8
Matsumoto, N., Kitanishi, T., and Mizuseki, K. (2019). The subiculum: Unique hippocampal hub and more. Neurosci. Res. 143, 1–12. doi: 10.1016/j.neures.2018.08.002
Nasreddine, Z. S., Phillips, N. A., Bédirian, V., Charbonneau, S., and Chertkow, H. (2005). The montreal cognitive assessment, MoCA: A brief screening tool for mild cognitive impairment. J. Am. Geriatr. Soc. 53, 695–699. doi: 10.1111/j.1532-5415.2005.53221.x
Neill, D. (2012). Should Alzheimer’s disease be equated with human brain ageing?: A maladaptive interaction between brain evolution and senescence. Ageing Res. Rev. 11, 104–122. doi: 10.1016/j.arr.2011.06.004
Nelson, P. T., Alafuzoff, I., Bigio, E. H., Bouras, C., Braak, H., Cairns, N. J., et al. (2012). Correlation of Alzheimer disease neuropathologic changes with cognitive status: A review of the literature. J. Neuropathol. Exp. Neurol. 71, 362–381. doi: 10.1097/NEN.0b013e31825018f7
Nemeth, V. L., Must, A., Horvath, S., Király, A., Kincses, Z. T., and Vécsei, L. (2017). Gender-specific degeneration of dementia-related subcortical structures throughout the lifespan. J. Alzheimers dis. 55, 865–880. doi: 10.3233/JAD-160812
O’Keefe, J., Morris, R., Andersen, P., Bliss, T., and Amaral, D. G. (2007). The hippocampus book. Oxford: Oxford University Press.
Oosterman, J. M., Oosterveld, S., Rikkert, M. G., Claassen, J. A., and Kessels, R. P. (2012). Medial temporal lobe atrophy relates to executive dysfunction in Alzheimer’s disease. Int. Psychogeriatr. 24, 1474–1482. doi: 10.1017/s1041610212000506
Padurariu, M., Ciobica, A., Mavroudis, I., Fotiou, D., and Baloyannis, S. (2012). Hippocampal neuronal loss in the CA1 and CA3 areas of Alzheimer’s disease patients. Psychiatria Danubina 24, 152–158.
Perrotin, A., de Flores, R., Lamberton, F., Poisnel, G., La Joie, R., de la Sayette, V., et al. (2015). Hippocampal subfield volumetry and 3D surface mapping in subjective cognitive decline. J. Alzheimers Dis. 48, S141–S150. doi: 10.3233/JAD-150087
Piché, M.-E., Tchernof, A., and Després, J.-P. (2020). Obesity phenotypes, diabetes, and cardiovascular diseases. Circ. Res. 126, 1477–1500. doi: 10.1161/CIRCRESAHA.120.316101
Pike, K. E., Cavuoto, M. G., Li, L., Wright, B. J., and Kinsella, G. J. (2021). Subjective cognitive decline: Level of risk for future dementia and mild cognitive impairment, a meta-analysis of longitudinal studies. Neuropsychol. Rev. doi: 10.1007/s11065-021-09522-3 [Epub ahead of print].
Pini, L., and Wennberg, A. M. (2021). Structural imaging outcomes in subjective cognitive decline: Community vs. clinical-based samples. Exp. Gerontol. 145:111216. doi: 10.1016/j.exger.2020.111216
Pluta, R., Ouyang, L., Januszewski, S., Li, Y., and Czuczwar, S. J. (2021). Participation of amyloid and tau protein in post-ischemic neurodegeneration of the hippocampus of a nature identical to Alzheimer’s disease. Int. J. Mol. Sci. 22:2460. doi: 10.3390/ijms22052460
Power, D. A., Noel, J., Collins, R., and O’Neill, D. (2001). Circulating leptin levels and weight loss in Alzheimer’s disease patients. Dement. Geriatr. Cogn. Disord. 12, 167–170. doi: 10.1159/000051252
Rabi, R., Vasquez, B. P., Alain, C., Hasher, L., Belleville, S., and Anderson, N. D. (2020). Inhibitory control deficits in individuals with amnestic mild cognitive impairment: A meta-analysis. Neuropsychol. Rev. 30, 97–125. doi: 10.1007/s11065-020-09428-6
Roda, A. R., Serra-Mir, G., Montoliu-Gaya, L., Tiessler, L., and Villegas, S. (2022). Amyloid-beta peptide and tau protein crosstalk in Alzheimer’s disease. Neural Regen. Res. 17, 1666–1674. doi: 10.4103/1673-5374.332127
Sadigh-Eteghad, S., Sabermarouf, B., Majdi, A., Talebi, M., Farhoudi, M., and Mahmoudi, J. (2015). Amyloid-beta: A crucial factor in Alzheimer’s disease. Med. Princ. Pract. 24, 1–10. doi: 10.1159/000369101
Sánchez-Benavides, G., Grau-Rivera, O., Suárez-Calvet, M., Minguillon, C., Cacciaglia, R., Gramunt, N., et al. (2018). Brain and cognitive correlates of subjective cognitive decline-plus features in a population-based cohort. Alzheimers Res. Ther. 10:123. doi: 10.1186/s13195-018-0449-9
Sanchez-Flack, J. C., Tussing-Humphreys, L., Lamar, M., Fantuzzi, G., Schiffer, L., Blumstein, L., et al. (2021). Building research in diet and cognition (BRIDGE): Baseline characteristics of older obese African American adults in a randomized controlled trial to examine the effect of the Mediterranean diet with and without weight loss on cognitive functioning. Prev. Med. Rep. 22:101302. doi: 10.1016/j.pmedr.2020.101302
Scarpina, F., and Tagini, S. (2017). The stroop color and word test. Front. Psychol. 8:557. doi: 10.3389/fpsyg.2017.00557
Scheef, L., Spottke, A., Daerr, M., Joe, A., Striepens, N., Kölsch, H., et al. (2012). Glucose metabolism, gray matter structure, and memory decline in subjective memory impairment. Neurology 79, 1332–1339. doi: 10.1212/WNL.0b013e31826c1a8d
Schmeidler, J., Mastrogiacomo, C. N., Beeri, M. S., Rosendorff, C., and Silverman, J. M. (2019). Distinct age-related associations for body mass index and cognition in cognitively healthy very old veterans. Int. Psychogeriatr. 31, 895–899. doi: 10.1017/s1041610218001412
Sun, Z., Wang, Z.-T., Sun, F.-R., Shen, X.-N., Xu, W., Ma, Y.-H., et al. (2020). Late-life obesity is a protective factor for prodromal Alzheimer’s disease: A longitudinal study. Aging 12, 2005–2017. doi: 10.18632/aging.102738
Suo, C., Gates, N., Fiatarone Singh, M., Saigal, N., Wilson, G. C., Meiklejohn, J., et al. (2017). Midlife managerial experience is linked to late life hippocampal morphology and function. Brain Imaging Behav. 11, 333–345. doi: 10.1007/s11682-016-9649-8
Traykov, L., Raoux, N., Latour, F., Gallo, L., Hanon, O., Baudic, S., et al. (2007). Executive functions deficit in mild cognitive impairment. Cogn. Behav. Neurol. 20, 219–224.
Ugolini, F., Lana, D., Nardiello, P., Nosi, D., Pantano, D., Casamenti, F., et al. (2018). Different patterns of neurodegeneration and glia activation in CA1 and CA3 hippocampal regions of TgCRND8 Mice. Front. Aging Neurosci. 10:372. doi: 10.3389/fnagi.2018.00372
van Rooden, S., van den Berg-Huysmans, A. A., Croll, P. H., Labadie, G., Hayes, J. M., Viviano, R., et al. (2018). Subjective cognitive decline is associated with greater white matter hyperintensity volume. J. Alzheimers Dis. 66, 1283–1294. doi: 10.3233/JAD-180285
Vogel, J. W., Iturria-Medina, Y., Strandberg, O. T., Smith, R., Levitis, E., Evans, A. C., et al. (2020). Spread of pathological tau proteins through communicating neurons in human Alzheimer’s disease. Nat. Commun. 11:2612. doi: 10.1038/s41467-020-15701-2
Walhovd, K. B., Tamnes, C. K., and Fjell, A. M. (2014b). Brain structural maturation and the foundations of cognitive behavioral development. Curr. Opin. Neurol. 27, 176–184. doi: 10.1097/WCO.0000000000000074
Walhovd, K. B., Fjell, A. M., and Espeseth, T. (2014a). Cognitive decline and brain pathology in aging – Need for a dimensional, lifespan and systems vulnerability view. Scand. J. Psychol. 55, 244–254. doi: 10.1111/sjop.12120
Wang, L., Benzinger, T. L., Su, Y., Christensen, J., Friedrichsen, K., Aldea, P., et al. (2016). Evaluation of tau imaging in staging Alzheimer disease and revealing interactions between β-amyloid and tauopathy. JAMA Neurol. 73, 1070–1077. doi: 10.1001/jamaneurol.2016.2078
Wang, X., Huang, W., Su, L., Xing, Y., Jessen, F., Sun, Y., et al. (2020). Neuroimaging advances regarding subjective cognitive decline in preclinical Alzheimer’s disease. Mol. Neurodegen. 15:55. doi: 10.1186/s13024-020-00395-3
Wecker, N. S., Kramer, J. H., Wisniewski, A., Delis, D. C., and Kaplan, E. (2000). Age effects on executive ability. Neuropsychology 14, 409–414. doi: 10.1037//0894-4105.14.3.409
West, M. J., Coleman, P. D., Flood, D. G., and Troncoso, J. C. (1994). Differences in the pattern of hippocampal neuronal loss in normal ageing and Alzheimer’s disease. Lancet 344, 769–772. doi: 10.1016/s0140-6736(94)92338-8
Widya, R. L., de Roos, A., Trompet, S., de Craen, A. J., Westendorp, R. G., Smit, J. W., et al. (2011). Increased amygdalar and hippocampal volumes in elderly obese individuals with or at risk of cardiovascular disease. Am. J. Clin. Nutr. 93, 1190–1195. doi: 10.3945/ajcn.110.006304
Willeumier, K. C., Taylor, D. V., and Amen, D. G. (2011). Elevated BMI is associated with decreased blood flow in the prefrontal cortex using SPECT imaging in healthy adults. Obesity (Silver Spring, MD) 19, 1095–1097. doi: 10.1038/oby.2011.16
Worker, A., Dima, D., Combes, A., Crum, W. R., Streffer, J., Einstein, S., et al. (2018). Test-retest reliability and longitudinal analysis of automated hippocampal subregion volumes in healthy ageing and Alzheimer’s disease populations. Hum. Brain Mapp. 39, 1743–1754. doi: 10.1002/hbm.23948
Xu, S., Jia, L., Ruilin, C., Guiyan, C., and Jiao, L. (2021). Correlation between different BMI levels and executive function in patients with subjective cognitive decline. Modern Prev. Med. 48, 3247–3253. doi: 10.26355/eurrev_201712_13937
Yang, Y., Shields, G. S., Guo, C., and Liu, Y. (2018). Executive function performance in obesity and overweight individuals: A meta-analysis and review. Neurosci. Biobehav. Rev. 84, 225–244. doi: 10.1016/j.neubiorev.2017.11.020
Yang, X., Yao, C., Tian, T., Li, X., Yan, H., Wu, J., et al. (2018). A novel mechanism of memory loss in Alzheimer’s disease mice via the degeneration of entorhinal-CA1 synapses. Mol. Psychiatry 23, 199–210. doi: 10.1038/mp.2016.151
Ying Han. (2018). Recommendations for diagnosis and treatment of subjective cognitive decline due to preclinical Alzheimer disease in China. J. China Clin. Med. Imaging 29, 5–5. doi: 10.1136/bmjopen-2018-028317
Yue, L., Wang, T., Wang, J., Li, G., Wang, J., Li, X., et al. (2018). Asymmetry of hippocampus and amygdala defect in subjective cognitive decline among the community dwelling Chinese. Front. Psychiatry 9:226. doi: 10.3389/fpsyt.2018.00226
Keywords: subjective cognitive decline, executive function, inhibition control function, hippocampal subregion, CA1
Citation: Chen R, Cai G, Xu S, Sun Q, Luo J, Wang Y, Li M, Lin H and Liu J (2022) Body mass index related to executive function and hippocampal subregion volume in subjective cognitive decline. Front. Aging Neurosci. 14:905035. doi: 10.3389/fnagi.2022.905035
Received: 26 March 2022; Accepted: 25 July 2022;
Published: 17 August 2022.
Edited by:
Fermín Segovia, University of Granada, SpainReviewed by:
Yoo Hyun Um, Catholic University of Korea, South KoreaXia Li, Shanghai Jiao Tong University, China
Copyright © 2022 Chen, Cai, Xu, Sun, Luo, Wang, Li, Lin and Liu. This is an open-access article distributed under the terms of the Creative Commons Attribution License (CC BY). The use, distribution or reproduction in other forums is permitted, provided the original author(s) and the copyright owner(s) are credited and that the original publication in this journal is cited, in accordance with accepted academic practice. No use, distribution or reproduction is permitted which does not comply with these terms.
*Correspondence: Jiao Liu, bGl1amlhbzA0MTVAb3V0bG9vay5jb20=
†These authors have contributed equally to this work and share first authorship