 Quhong Song
 Yanli Zhao
 Taiping Lin
 Jirong Yue
94% of researchers rate our articles as excellent or good
Learn more about the work of our research integrity team to safeguard the quality of each article we publish.
Find out more
ORIGINAL RESEARCH article
Front. Aging Neurosci. , 18 July 2022
Sec. Neurocognitive Aging and Behavior
Volume 14 - 2022 | https://doi.org/10.3389/fnagi.2022.897802
Background: It remains unknown whether perivascular spaces (PVS) are associated with delirium in older hospitalized patients. We aimed to determine the association between magnetic resonance imaging (MRI)-visible PVS and the risk of delirium in a cohort of older patients.
Methods: We consecutively recruited older patients (≥70 years) admitted to the Geriatric Department of West China Hospital between March 2016 and July 2017, and their imaging data within one year before admission were reviewed retrospectively. PVS was rated on axial T2-weighted images in the basal ganglia (BG) and centrum semiovale (CS) using the validated semiquantitative 4-point ordinal scale. Delirium was screened within 24 h of admission and three times daily thereafter, using the confusion assessment method. Binary logistic regression analyses were performed to investigate the associations between PVS and delirium.
Results: Among 114 included patients (mean age 84.3 years, 72.8% male), delirium occurred in 20 (17.5%). In patients with MRI examined within 6 months before admission, CS-PVS was found to be associated with delirium (odds ratio [OR] 3.88, 95% confidence interval [CI] 1.07-14.06, unadjusted; and OR 4.24, 95% CI 1.11-16.28, adjusted for age). The associations were enhanced and remained significant even after full adjustment of covariates (OR 7.16, 95% CI 1.16-44.32, adjusted for age, cognitive impairment, smoking, and Charlson Comorbidity Index). Similarly, the relationships between high CS-PVS and delirium were also strengthened after sequentially adjusting all variables of interest, with OR 4.17 (95% CI 1.04-16.73) in unadjusted model and OR 7.95 (95% CI 1.14-55.28) in fully-adjusted model. Adding CS-PVS to the established risk factors improved the risk reclassification for delirium (continuous net reclassification index 62.1%, P = 0.04; and integrated discrimination improvement 12.5%, P = 0.01).
Conclusions: CS-PVS on MRI acquired 6 months earlier predicts subsequent delirium in older patients and may have clinical utility in delirium risk stratification to enable proactive interventions.
Delirium is a neuropsychiatric syndrome characterized by acute fluctuating disturbances in attention, consciousness, and cognition (Inouye et al., 2014; Marcantonio, 2017). It is common in older hospitalized adults, affecting one-third of those aged 70 years and over (Laurila et al., 2004; Marcantonio, 2017), and is associated with numerous poor outcomes including prolonged hospital stay, cognitive impairment, functional disability, and mortality (Fong et al., 2009; Inouye et al., 2014; Marcantonio, 2017; Goldberg et al., 2020). Though some progress has been made in diagnosis, elucidation of risk factors and prognosis, the neurobiological basis of delirium has not yet been completely clarified. Consequently, few effective and mechanism-based treatments for delirium are available. It is therefore imperative to explore neurobiological biomarkers associated with delirium, which may not only advance our understanding of the pathogenesis of delirium but also aid in delirium risk stratification to implement proactive interventions.
The advancement of neuroimaging particularly magnetic resonance imaging (MRI) provides a unique chance to study the neural substrates of delirium, and certain abnormalities on brain MRI have been reported to be associated with delirium (Nitchingham et al., 2018; Kalvas and Monroe, 2019). Several studies have indicated that white matter hyperintensities, markers of cerebral small vessel disease (CSVD), can predict the occurrence of delirium (Omiya et al., 2015; Nitchingham et al., 2018; Clancy et al., 2021; Pendlebury et al., 2022). Nevertheless, for other CSVD markers, especially MRI-visible perivascular spaces (PVS), this is still unknown. PVS are fluid-filled spaces around the brain perforating small vessels and are hypothesized to act as part of the drainage systems which facilitate fluid exchange and clearance of metabolic wastes from the brain (Wardlaw et al., 2020; Gouveia-Freitas and Bastos-Leite, 2021). Although it is normal to have a few visible PVSs on MRI in healthy young brains (Piantino et al., 2020; Barisano et al., 2021), they may become increasingly common and even enlarge in the context of aging, vascular risk factors, and other features of CSVD (Wardlaw et al., 2020), which may have important clinical implications to brain health (Wardlaw et al., 2020; Gouveia-Freitas and Bastos-Leite, 2021). And growing studies have shown that PVS burden is related to cognitive decline and dementia in older adults (Ding et al., 2017; Debette et al., 2019; Paradise et al., 2021). However, no studies have previously explored PVS in relation to delirium. Whether PVS plays a role in the development of delirium remains unclear.
Therefore, in the present study, we aimed to determine the association between PVS and risk of future delirium and to examine the predictive ability of PVS for delirium in older hospitalized patients. We hypothesized that older patients with a higher PVS burden at baseline would be at greater risk of subsequent delirium.
Patients in this study were a subsample of our previous cohort study, which prospectively consecutively recruited older internal medical patients admitted to the Department of Geriatric (across four floors), West China Hospital of Sichuan University between March 2016 and July 2017. The details of this cohort have been described previously (Zhao et al., 2021). In brief, eligible patients were aged 70 years and older, with an anticipated stay in the hospital of at least 3 days. Exclusion criteria included delirium on admission, inability to communicate due to severe deafness or severe dementia, terminal conditions with life expectancy <6 months, and incomplete data. A total of 740 patients who met all eligibility criteria were enrolled in this cohort (Supplementary Figure 1), and their imaging data were reviewed retrospectively through our electronic medical systems.
In the present study, patients were further excluded if they did not undergo brain MRI scanning within one year prior to admission or if the MRI image quality was poor, making PVS assessment difficult. This study was approved by the Biomedical Research Ethics Committee of West China Hospital, and conformed to the ethical guidelines of the Declaration of Helsinki. Written informed consent was obtained from all participants.
The following data were collected by trained research nurses within 24 h after admission: age, sex, body mass index (BMI), marital status, education level, smoking, and alcohol drinking. Cognitive function was evaluated using the Short Portable Mental Status Questionnaire (SPMSQ), and errors ≥3 were defined as having cognitive impairment (Pfeiffer, 1975). The severity of comorbidities was rated using the Charlson Comorbidity Index (CCI), a score based on 19 chronic diseases (Charlson et al., 1987). Visual acuity was assessed with the Snellen eye chart, and hearing ability was evaluated with the whispered voice test. Laboratory tests (blood glucose, white blood cell counts, blood urea nitrogen, creatinine, and albumin) were conducted within 24 hours of admission.
All included patients underwent brain MRI within the past 1 year prior to this hospital admission using a 3.0 T scanner (Magnetom, Siemens, Erlangen, Germany), with a slice thickness of 5-mm and matrix size of 256 × 256 pixels. MRI sequences included T1-weighted (repetition time [TR] 1600 ms, echo time [TE] 8.6 ms), T2-weighted (TR 4500 ms, TE 105 ms), and fluid-attenuated inversion recovery (FLAIR) images (TR 6000 ms, TE 100 ms).
The MRI markers were defined and reported following the STandards for ReportIng Vascular changes on nEuroimaging (STRIVE) recommendations (Wardlaw et al., 2013). All MRI images were assessed independently by two trained raters blinded to the patients’ clinical data, and disagreements were resolved by consensus. For patients who underwent multiple MRI imaging during the past 1 year, we used data from the last MRI only.
PVS was defined as fluid-filled compartments surrounding the penetrating vessels, with cerebrospinal fluid (CSF)-like signals on all MRI sequences. They appear linear, round or ovoid, generally smaller than 3 mm in diameter without the surrounding FLAIR hyperintense rim (Wardlaw et al., 2013). PVS was counted on axial T2-weighted images in the basal ganglia (BG) and centrum semiovale (CS), using the validated semiquantitative scale as 0 = none, 1 = 1-10, 2 = 11–20, 3 = 21–40, and 4 ≥40 PVS (Potter et al., 2015a,b). Rating of PVS in the BG was done above the anterior commissure, and included those in the insular cortex (Potter et al., 2015a). For both regions, the slice and side with the most PVS were chosen. High BG-PVS or CS-PVS was defined as a score ≥3, as used previously (Charidimou et al., 2014). The total PVS burden (0-8) was calculated as the sum scores of BG-PVS and CS-PVS. In this study, the interrater weighted kappa for the class of PVS (0-4) was 0.75 for BG-PVS and 0.71 for CS-PVS.
Lacunes were defined as round or ovoid, subcortical CSF-containing cavities measuring between 3 and 15 mm in diameter with a hyperintense rim on FLAIR (Wardlaw et al., 2013). The presence, number, and location of lacunes were recorded. White matter hyperintensity (WMH) was defined as abnormal hyperintensity of periventricular white matter (PWMH) or deep white matter (DWMH) on FLAIR images. The Fazekas rating scale (a 3-point ordinal scale ranging from 0 to 3) was used to assess the severity of WMH (Fazekas et al., 1987). Extensive WMH was defined as a PWMH score of 3 or DWMH score ≥2. The total WMH burden was calculated by summing the PVWM and DWMH scores. The interrater Cohen-weighted kappa values were 0.65 for lacunes, 0.93 for PWMH, and 0.90 for DWMH.
To assess the cumulative impact of small vessel injury on the brain, we chose lacunes, WMH, and PVS to calculate the “total CSVD burden”. According to the validated ordinal scale (Klarenbeek et al., 2013), one point was allocated if lacune number ≥1, or PVWMH score = 3 and/or DWMH score ≥2, or BG-PVS score ≥2, generating a total score of 0 to 3.
The main outcome measure was the development of delirium during hospitalization. Delirium was assessed using the confusion assessment method (CAM), a well-validated and standardized assessment tool for delirium that has a high sensitivity (94-100%), specificity (90-95%), and interrater reliability (0.70-1.00) (Wei et al., 2008). The Chinese-language version of the CAM has been used in Mandarin-speaking populations, demonstrating comparable sensitivity and specificity (Gao et al., 2019). The CAM diagnostic algorithm requires the presence of acute onset and fluctuating course, inattention, and either disorganized thinking or an altered level of consciousness to fulfill the criteria for delirium.
Research nurses were trained heavily in screening delirium before the start of the study to ensure high interrater and intrarater reliability (kappa ≥0.9). Then all patients were screened for delirium by well-trained nurses within 24 h after admission and three times daily thereafter until discharge or for a maximum of 13 days, whichever came first. In addition, to minimize misdiagnosis and maximize reliability, experienced clinical researchers further independently assessed patients every 48 h. In case of any doubt, an expert panel was consulted to screen patients according to the Diagnostic and Statistical Manual of Mental Disorders, Fourth Edition criteria (American Psychiatric Association, 2000).
Continuous data were presented as mean with standard deviation (SD) or median with interquartile range (IQR), and categorical data were reported as frequencies and percentages. Intergroup differences in patients with delirium versus those without delirium were detected using the χ2 test or Fisher’s exact test for categorical variables and Student’s t-test or the Mann-Whitney U test for continuous variables.
The binary logistic regression analyses were used to investigate the association between PVS and delirium. Given the limited sample size, only covariates with P < 0.05 identified in univariate analysis were included in the multivariate analysis. The following models were generated sequentially: (1) unadjusted; (2) adjusted only for age (model 1); (3) adjusted for age and cognitive impairment (model 2); and (4) adjusted for age, cognitive impairment, smoking, and CCI (model 3). To mitigate the potential bias induced by changes in PVS over time, a similar analysis was performed after excluding patients who underwent MRI more than 6 months before admission.
The receiver operating characteristic (ROC) curve was conducted to evaluate the predictive ability of PVS for delirium. Pairwise comparison of the area under the receiver operating curves (AUCs) was performed using the Delong test (DeLong et al., 1988). In addition, the net reclassification index (NRI) and integrated discrimination improvement (IDI) were further calculated to evaluate the incremental predictive value of PVS beyond conventional risk factors.
All statistical analyses were conducted using Stata 15.0 (StataCorp, College Station, TX, United States) and MedCalc version 20 (MedCalc Software Ltd., Ostend, Belgium). A two-sided P < 0.05 was considered to be statistically significant, and multiple comparisons correction was not made due to the exploratory nature of this study.
Among 740 patients initially recruited between March 2016 and July 2017, 116 patients underwent brain MRI within the past 1 year, and 2 of those patients with poor MRI quality were further excluded. Therefore, a total of 114 patients were included in the final analysis (Supplementary Figure 1). Compared with the included patients, those excluded patients were younger, had lower education level and lower CCI (all P < 0.05, Supplementary Table 1).
Among the 114 included patients, the mean age at admission was 84.3 ± 4.8 years (72.8% male). The median time from MRI scanning to hospital admission was 179 days (IQR, 82-283 days). PVS was detected in all patients, and the median (IQR) PVS scores in the BG and CS were 2 (2-3) and 3 (2-3), respectively. There were twenty (17.5%) patients who experienced delirium during hospitalization. The median time from admission to delirium occurrence was 5 days (IQR, 3-9 days), and the median length of hospital stay was 16 days (IQR 13-25 days). The demographic and clinical characteristics of patients are presented in Table 1. Univariate analysis identified the following characteristics associated with delirium: age, smoking, cognitive impairment, and CCI (all P < 0.05); while there was no significant difference in sex, BMI, marital status, education level, alcohol drinking, vision or hearing impairment, or laboratory data.
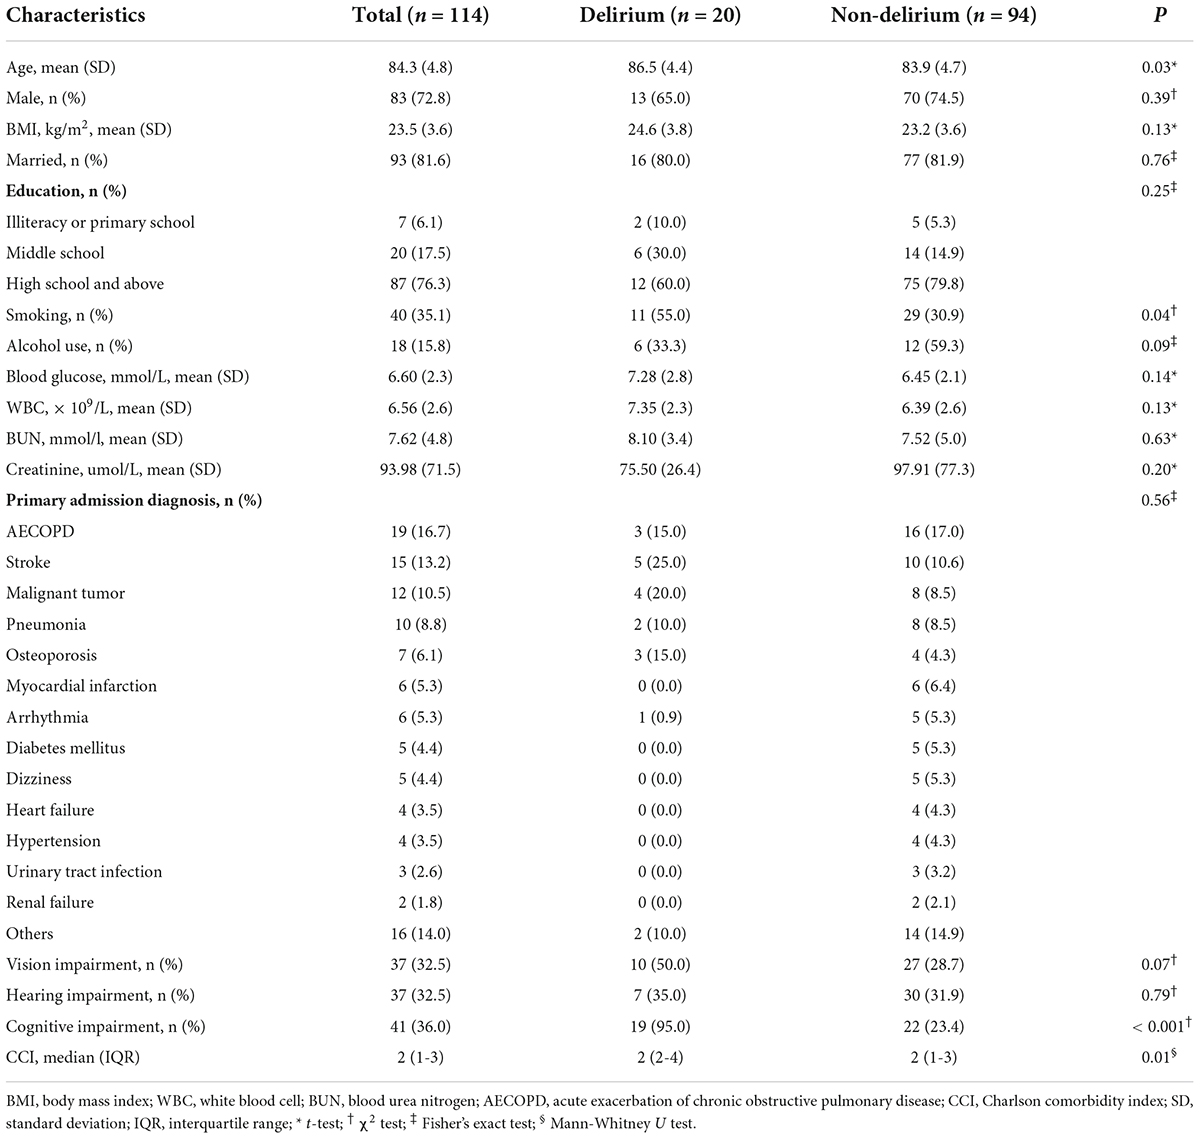
Table 1. Demographic and clinical characteristics of study participants.
The relationships between radiological features and delirium are shown in Table 2 and Supplementary Figure 2. The median BG-PVS score was significantly higher in patients with delirium than in those without delirium (median score 3 vs. 2, P = 0.03, Supplementary Figure 2). Delirious patients also had higher PWMH and total WMH scores, while there was no significant difference in CS-PVS, DWMH, or total CSVD burden. In the multivariable analyses, after sequentially adjusting for age, cognitive impairment, smoking and CCI, neither BG-PVS nor CS-PVS was independently associated with delirium (Figure 1).
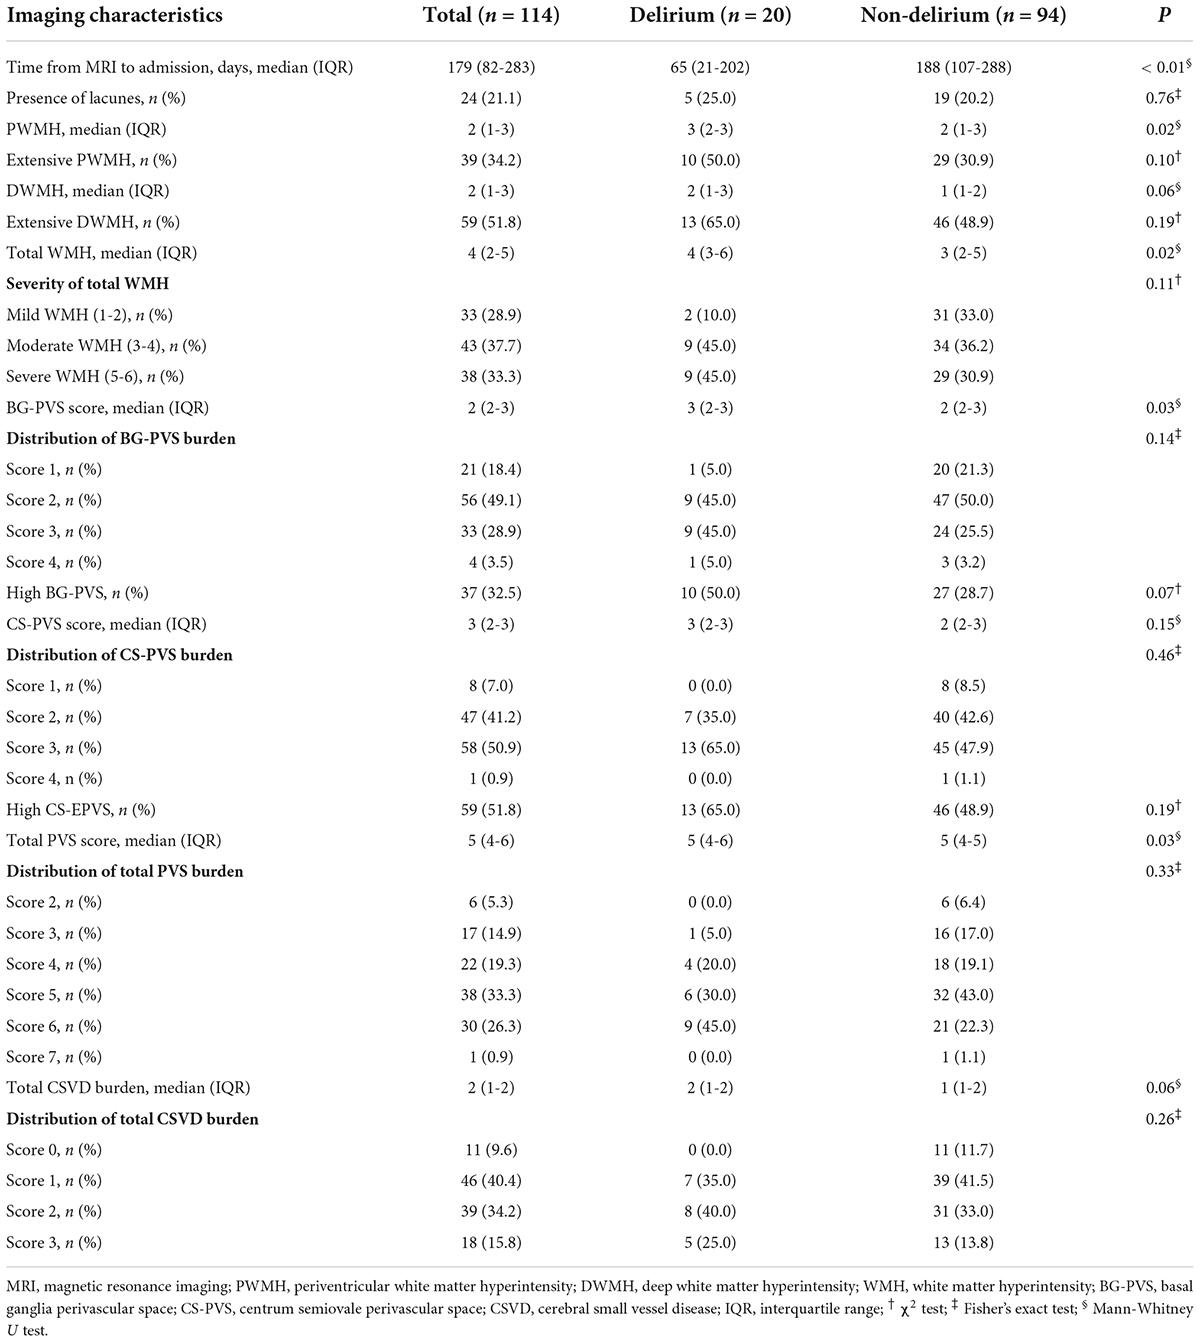
Table 2. Imaging characteristics of patients with and without delirium.
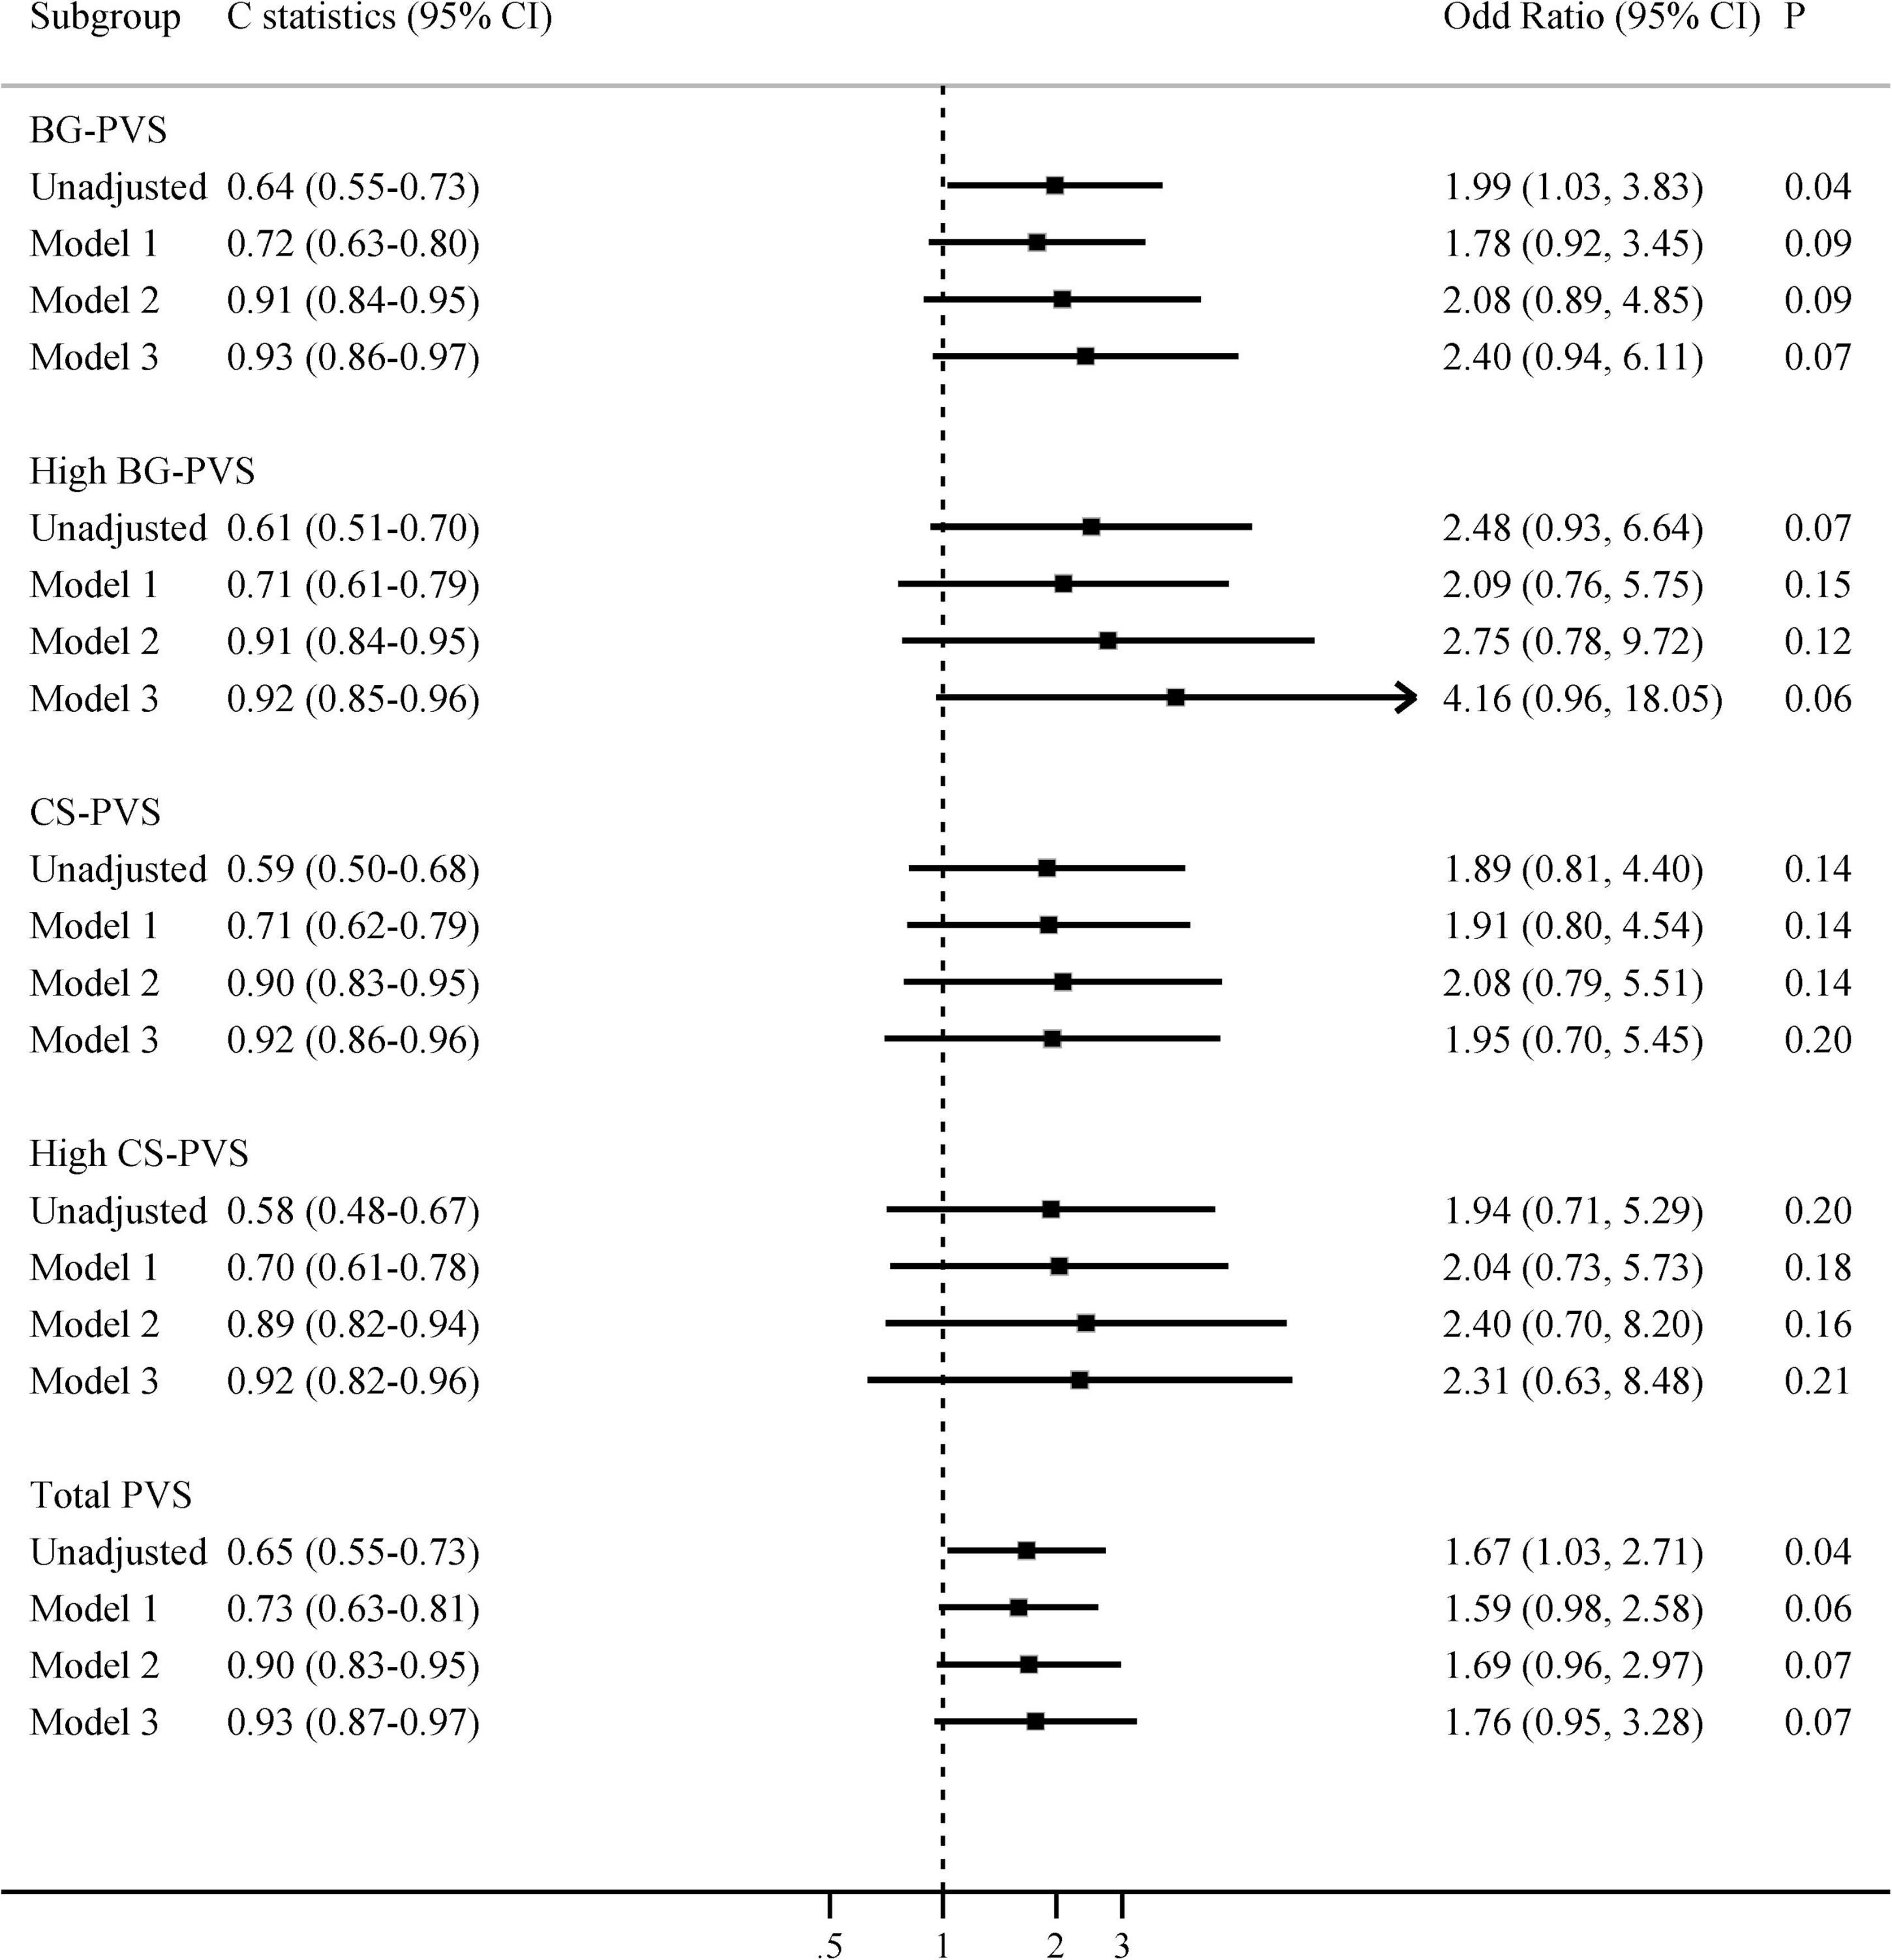
Figure 1. Multivariate associations between PVS and delirium in all patients. Model 1 adjusted for age; Model 2 adjusted for age and cognitive impairment; Model 3 adjusted for age, cognitive impairment, smoking, and Charlson comorbidity index. BG-PVS, basal ganglia perivascular space; CS-PVS, centrum semiovale perivascular space; CI, confidence interval.
When analyses were restricted to patients with MRI performed ≤6 months prior to hospital admission (n = 62), we found that CS-PVS and high CS-PVS were related to delirium in the univariate analysis (median 3 vs. 2, P = 0.03; 80.0% vs. 48.9%, P = 0.04, Supplementary Table 2). The associations of CS-PVS with delirium were enhanced and remained significant even after full adjustment of covariates: OR 3.88 (95% CI 1.07-14.06) unadjusted, OR 4.24 (95% CI 1.11-16.28) (model 1, adjusted for age), OR 6.52 (95% CI 1.29-32.90) (model 2, adjusted for age and cognitive impairment), and OR 7.16 (95% CI 1.16-44.32) (model 3, adjusted for age, cognitive impairment, smoking and CCI, Figure 2). Similarly, the associations between high CS-PVS and delirium were also strengthened after sequentially adjusting all variables of interest, with an OR of 4.17 (95% CI 1.04-16.73) in the unadjusted model and an OR of 7.95 (95% CI 1.14-55.28) in model 3 (Figure 2). In contrast, no associations were seen for PVS in patients with MRI examined >6 months prior to admission (Supplementary Table 3).
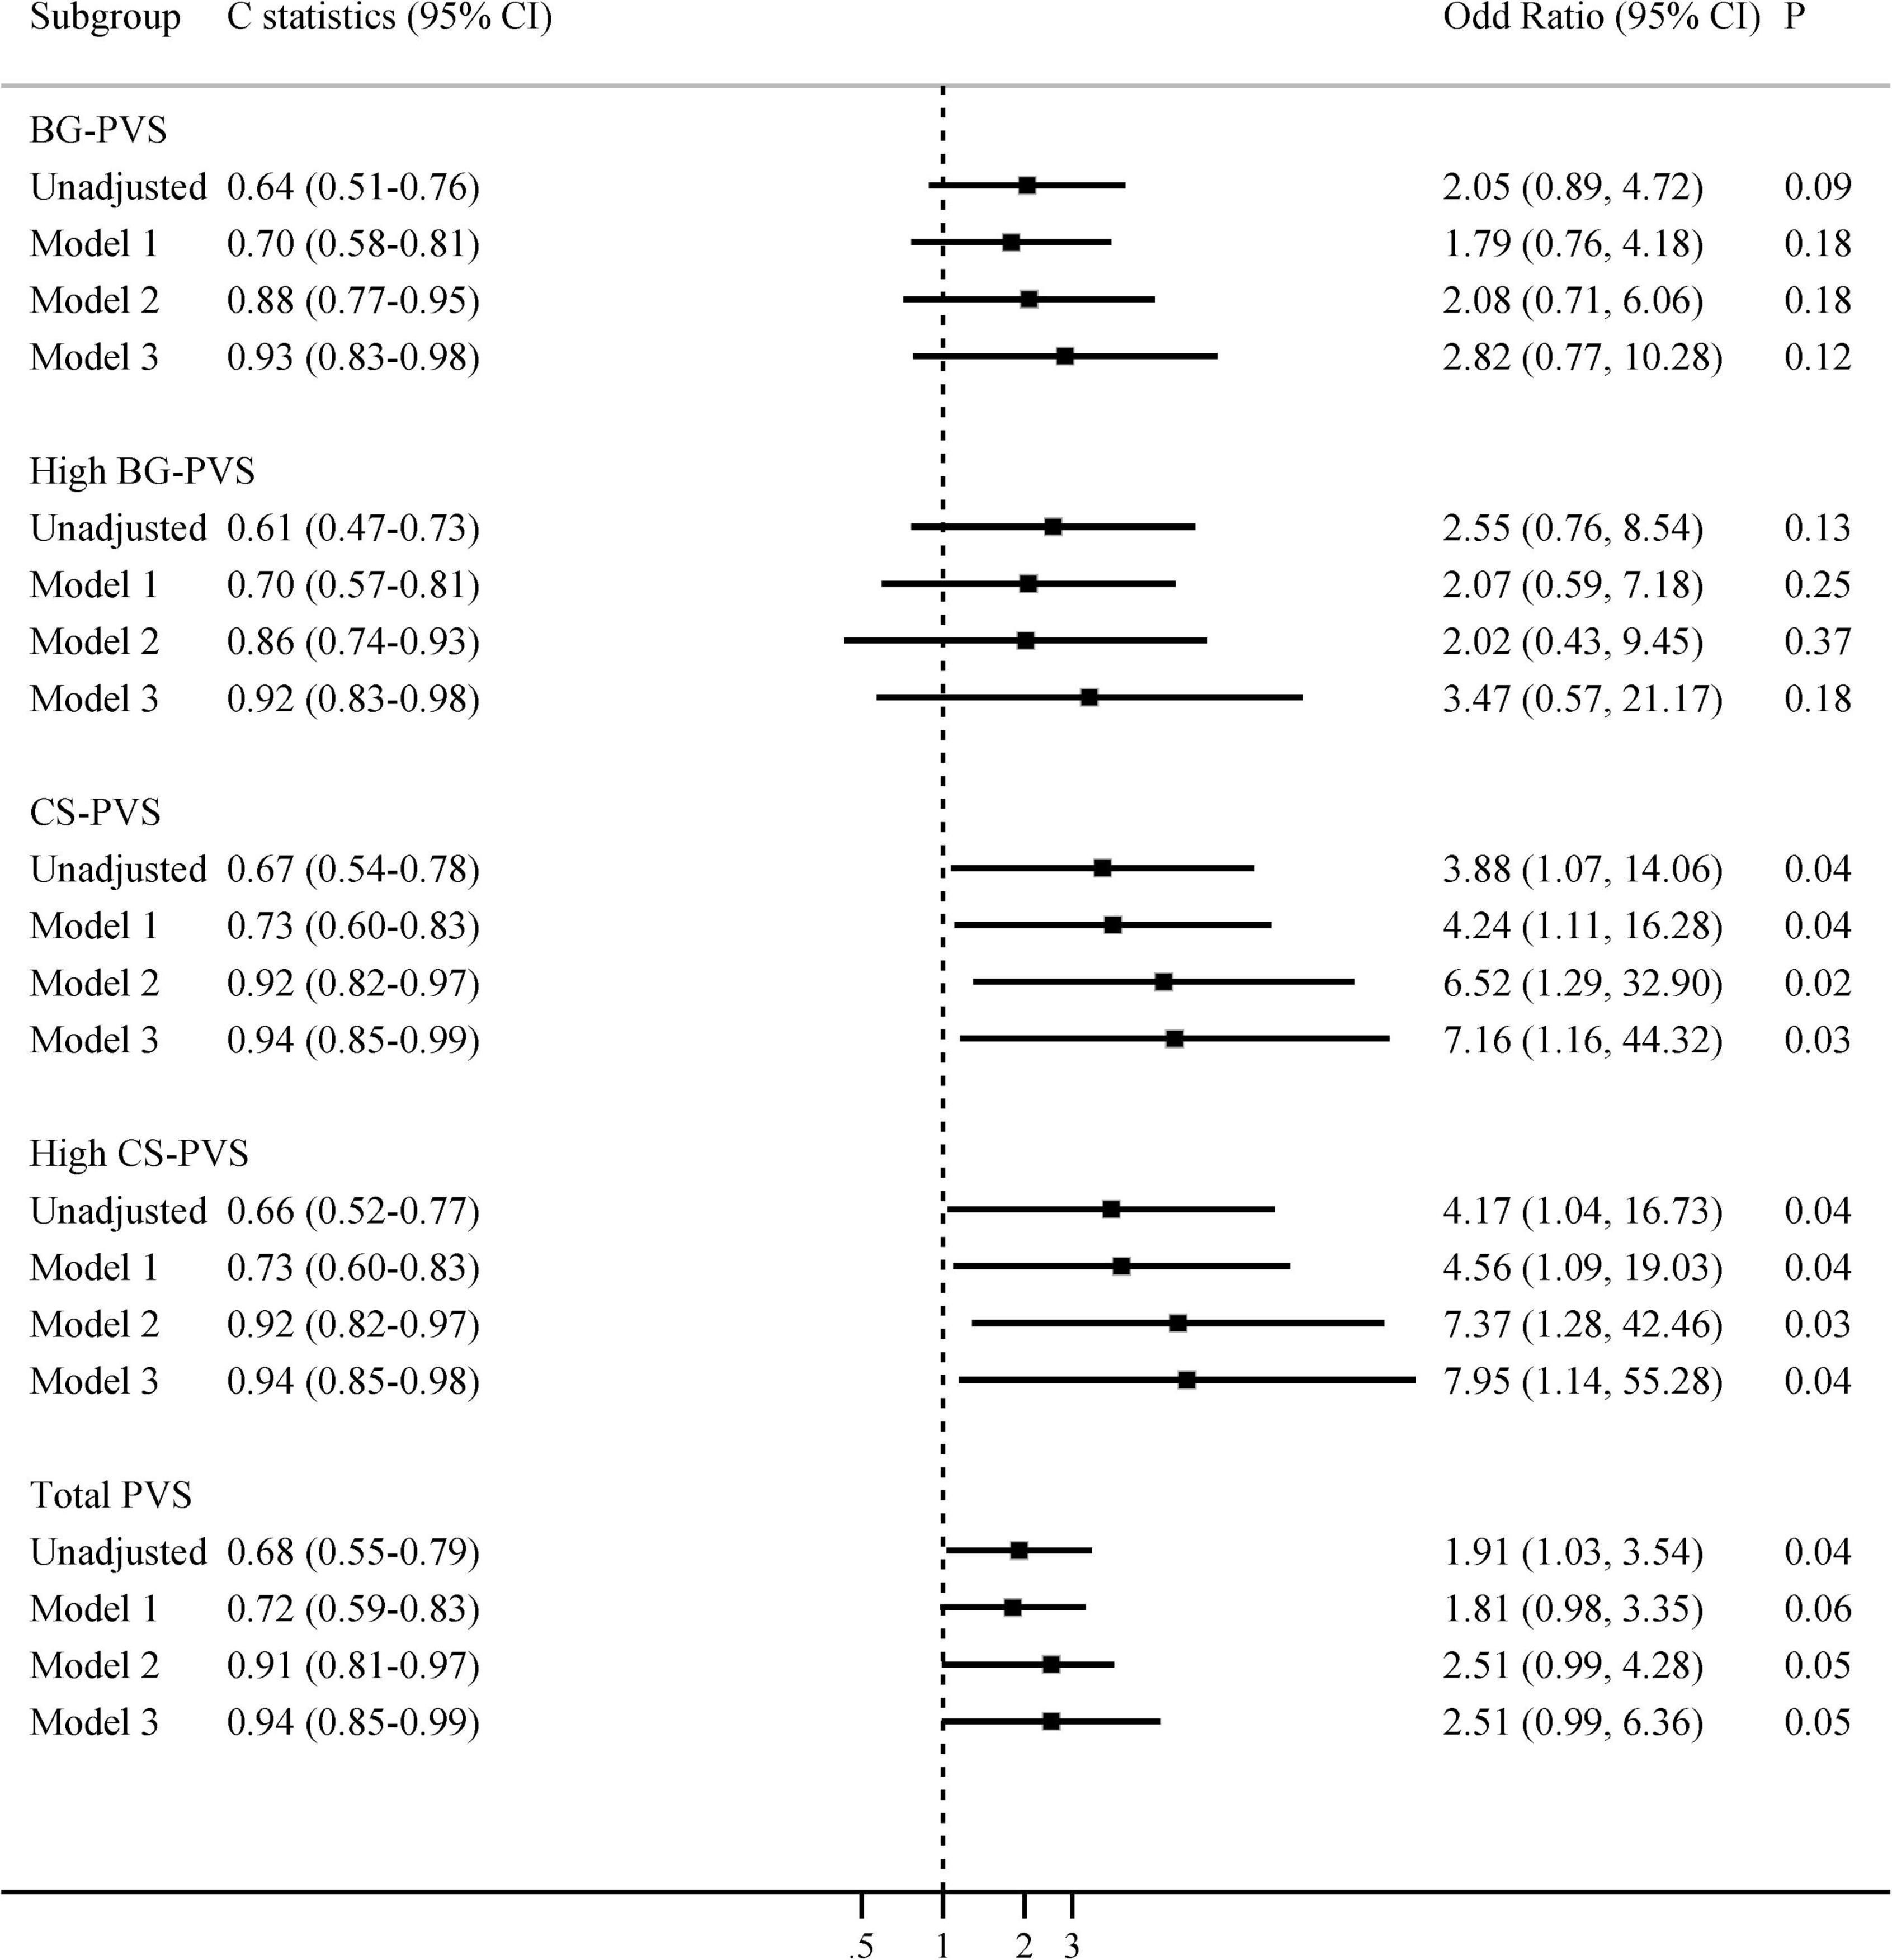
Figure 2. Multivariate associations between PVS and delirium, restricted to patients with MRI examined within the past 6 months. Model 1 adjusted for age; Model 2 adjusted for age and cognitive impairment; Model 3 adjusted for age, cognitive impairment, smoking, and Charlson comorbidity index. BG-PVS, basal ganglia perivascular space; CS-PVS, centrum semiovale perivascular space; CI, confidence interval.
Regarding other CSVD markers, additional analyses found that PWMH, DWMH, total WMH, and total CSVD burden were not independently associated with the occurrence of delirium during hospitalization (Supplementary Table 4).
The predictive values of PVS for delirium were summarized in Figures 1, 2 and Supplementary Table 5. The results showed that the predictive ability of BG or CS-PVS for delirium was moderate, but the multivariate models integrating PVS had good discriminatory powers. As CS-PVS burden on MRI acquired within the past 6 months was independently associated with delirium, we then evaluated the incremental predictive value of CS-PVS over the established risk factors for delirium. ROC curve analyses showed an AUC of 0.85 (95% CI 0.74-0.93) for cognitive impairment, 0.67 (95% CI 0.54-0.78) for CS-PVS, and 0.86 (95% CI 0.75-0.94) for the model including age and cognitive impairment (Figure 3). For the model containing age, cognitive impairment and CS-PVS, the AUC was 0.92 (95% CI 0.82-0.97), which was significantly higher than that of cognitive impairment (Delong test, P = 0.02) and CS-PVS (Delong test, P < 0.001). Although adding CS-PVS to the conventional model containing age and cognitive impairment did not significantly improve discriminatory power (AUC 0.92 vs. 0.86, Delong test P = 0.05), the risk reclassification for delirium was significantly improved, with a continuous NRI of 62.1% (P = 0.04) and an IDI of 12.5% (P = 0.01). Similar results were found for high CS-PVS (Supplementary Table 6).
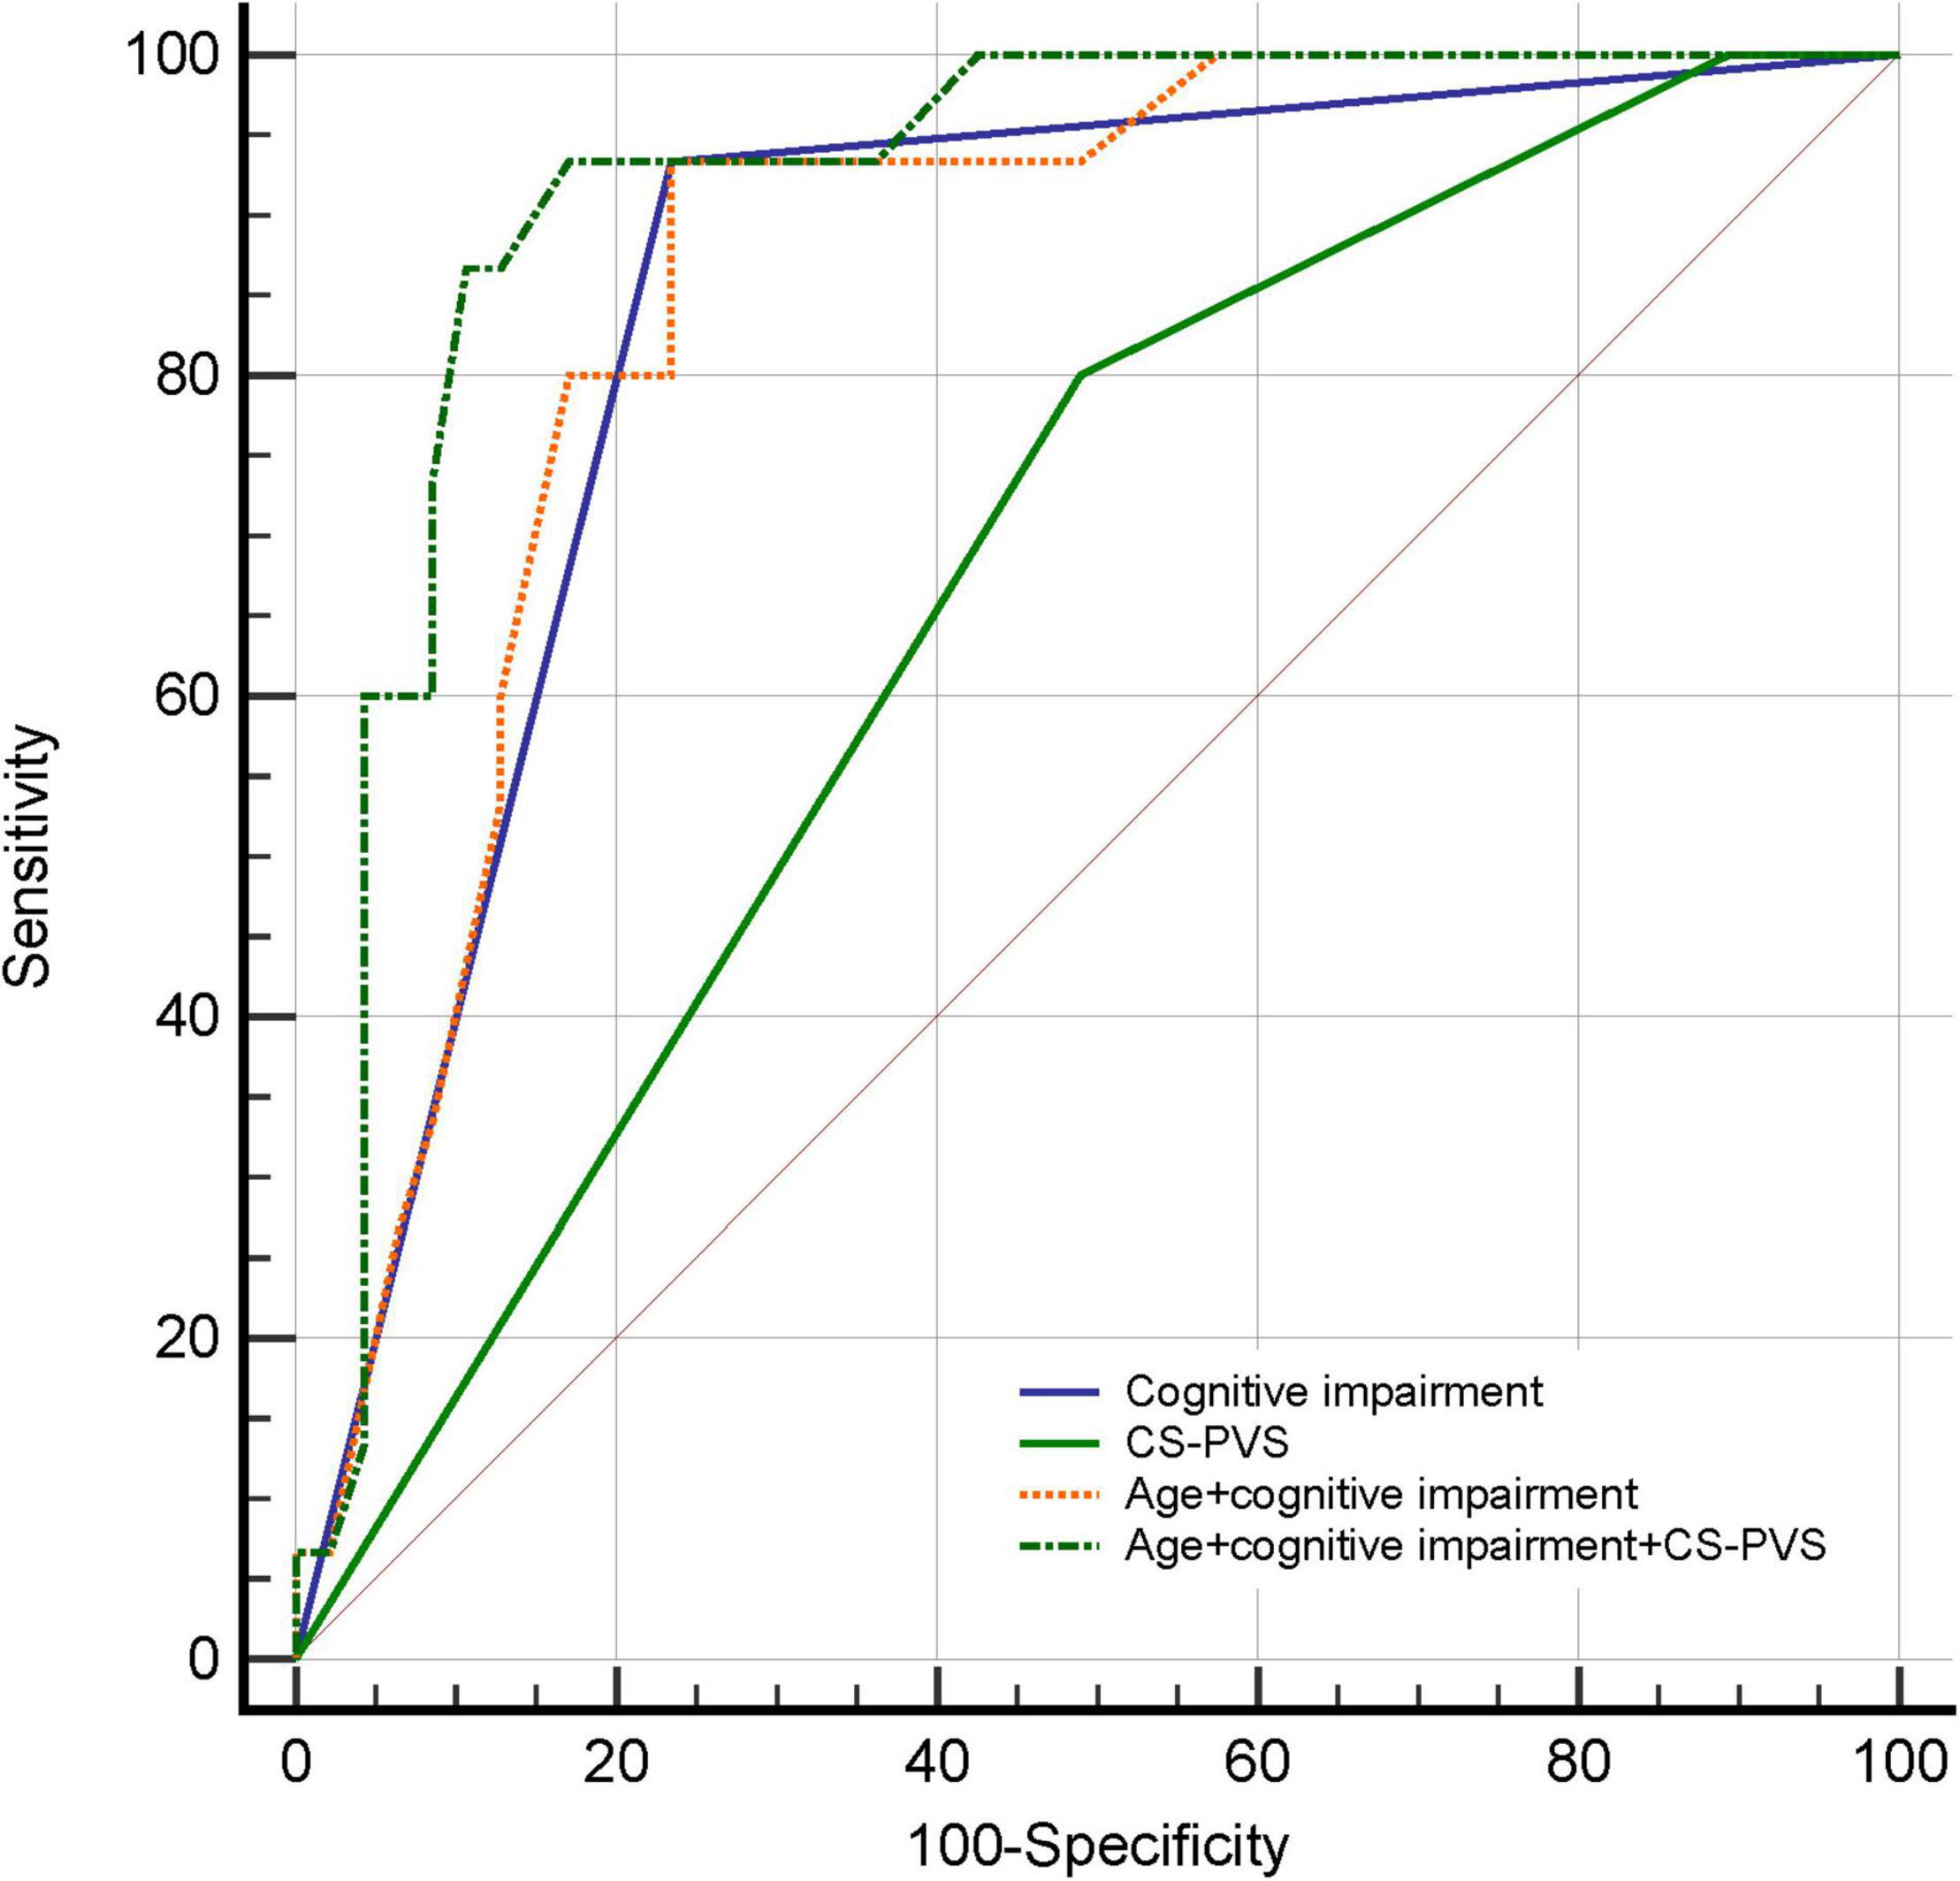
Figure 3. Receiver operating characteristic curves for predicting delirium in patients with MRI examined within the past 6 months. CS-PVS, centrum semiovale perivascular space.
In the present study, we found that CS-PVS on MRI acquired within 6 months prior to admission was independently associated with subsequent delirium in older hospitalized patients. Our study suggests that existing previously acquired brain MRI may represent an underlying resource, and CS-PVS visible on these MRIs may serve as a risk factor of delirium and may provide important predictive information for delirium occurrence. Incorporating CS-PVS into delirium prediction algorithms might have potential clinical utility in aiding delirium risk stratification, and this needs to be confirmed by future studies.
Although a few studies have investigated brain CSVD markers (e.g., WMH and cerebral microbleeds) in relation to delirium (Omiya et al., 2015; Nitchingham et al., 2018; Lachmann et al., 2019; Clancy et al., 2021; Pendlebury et al., 2022), no previous study has yet explored the link between MRI-visible PVS and delirium. PVS is frequently seen in the aging brain (Bown et al., 2022) and has been proposed as a key contributor to cognitive decline and dementia in older adults (Debette et al., 2019; Paradise et al., 2021). It has been reported that PVS could affect specific cognitive domains, and a negative association of PVS burden with nonverbal reasoning and visuospatial ability has been observed (Maclullich et al., 2004). Recent studies also indicated that PVS was correlated with worse executive function, information processing speed, and mild cognitive impairment (Ding et al., 2017; Passiak et al., 2019; Sepehrband et al., 2021). However, whether PVS plays a role in the development of delirium remains unknown. Our present study adds to evidence on the association of PVS with delirium, suggesting that PVS (particularly that in CS) may be an important risk marker of delirium. The previously reported significant relationship between deep WMH and delirium (Hatano et al., 2013; Omiya et al., 2015) may support our findings regarding PVS in the CS region. However, as the PVS-WMH association has not been fully elucidated (Francis et al., 2019) and the limited studies were available about the correlation of CSVD markers and their distributions with delirium, more investigations are warranted to validate our results and to explore the relationship between PVS locations and delirium. Besides, in this study, we found that the associations between CS-PVS and delirium persisted and remained significant even after adjusting for cognitive impairment, one of the strongest predictors of delirium, which implies that CS-PVS is an independent risk factor for delirium rather than a surrogate measure of cognitive performance.
Several explanations might account for the observed association between CS-PVS and delirium. First, CS-PVS is considered a marker of cerebral amyloid angiopathy (van Veluw et al., 2016; Charidimou et al., 2017). Abnormal protein aggregation (e.g., β-amyloid) can block the upstream within the cortical arteries and impair the external drainage of interstitial fluid in the deep white matter, thus contributing to the retrograde enlargement of PVS in CS (Gouveia-Freitas and Bastos-Leite, 2021), and the relationship between β-amyloid accumulation and CS-PVS has been demonstrated in previous studies (Roher et al., 2003; Charidimou et al., 2015). Furthermore, the impaired perivascular pathway may cause a vicious feed-forward cycle, further prompting PVS dysfunction and β-amyloid deposition in the vascular wall and brain (Gouveia-Freitas and Bastos-Leite, 2021; Bown et al., 2022), which may exacerbate neurovascular dysfunction, neuroinflammation, and neurodegeneration (Carrano et al., 2012; Parodi-Rullan et al., 2021), making the brain vulnerable to delirium (Idland et al., 2017; Maldonado, 2018; Chan et al., 2021).
In addition, PVS contains a range of immune cells contributing to immune surveillance and potentially neuroinflammation (Gouveia-Freitas and Bastos-Leite, 2021). Enlarged PVS is likely to involve inflammation (Wuerfel et al., 2008; Wardlaw et al., 2020) and is proposed as a marker of blood-brain barrier dysfunction (Potter et al., 2015b), which may cause disturbances in the neuronal network and predispose patients to subsequent delirium (Maldonado, 2018). Moreover, it has been reported that metabolite clearance via PVS occurs particularly during sleep (Hablitz et al., 2020; Wardlaw et al., 2020), and sleep deficiency may lead to structural changes in PVS (Del Brutto et al., 2019; Lysen et al., 2021). Growing studies have shown that sleep disruption and circadian dysfunctions, also known contributing factors of delirium (Maldonado, 2018), are involved in the occurrence of enlarged PVS (Berezuk et al., 2015; Del Brutto et al., 2019; Opel et al., 2019; Lysen et al., 2021). These data suggest that the observed relationship between PVS and delirium might be mediated by sleep disturbances. As assessment of sleep-related parameters was not available in the present study, we were unable to explore the potential effect of sleep disturbances. Further studies are warranted to elucidate the complex interrelationships between sleep, PVS, and delirium.
The strengths of our study include that delirium was ascertained at the bedside by trained assessors using the well-validated standardized assessment tool, rather than diagnosed directly from electronic medical records or hospital administrative diagnostic codes (e.g., ICD-10). The rigorous measures of delirium increase the reliability and reduce the misdiagnosis. In addition, this study was the first investigation to explore the association between PVS and delirium. Our study adds new, clinically relevant information to the literature on PVS and delirium, suggesting that CS-PVS on brain MRI could predict delirium occurring up to 6 months later. In other words, our present study suggests that existing previously acquired brain MRIs may represent an underutilized resource, and incorporating neuroimaging markers (e.g., CS-PVS) on these brain MRIs into delirium prediction algorithms may have the potential to identify delirium high-risk patients who may benefit from proactive interventions.
However, some study limitations warrant attention. First, this study was a retrospective analysis based on an internal medicine population in a single geographic area, and our findings may not be generalizable to other populations. Second, the sample size was relatively small and was unequal between delirium and non-delirium groups (the delirium group was 3 times smaller than the non-delirium group), which limited the statistical power and may raise the chance of false positives or false negatives. Besides, given the limited number of outcome events, to avoid overcontrolling, we did not adjust for other potential confounders (such as sensory impairment, treatments after admission, reasons for MRI scans, type and severity of patients’ acute diseases, etc.), and residual confounding cannot be excluded. Our study therefore should be considered preliminary, and future studies with larger sample sizes are needed to validate our findings. Third, correction was not made for multiple comparisons, which may increase the risk of type I error. Our results should be considered as hypothesis generating, and the P values should be interpreted with caution. Fourth, potential selection bias may be introduced since many patients without MRI scans were excluded, although there was no significant difference in most baseline characteristics between patients with and those without MRI scans (Supplementary Table 1). Compared to relatively healthier patients who didn’t require MRI, those with MRI might have a lower brain reserve and may have a higher PVS burden, which may potentially affect the relationship between PVS and delirium and limit the generalizability of our results to all older patients. More prospective, multicenter, large-sample studies are warranted to verify our findings. Fifth, as our original cohort was designed to investigate the incidence of delirium, patients with delirium on admission were excluded. Thus, the association between PVS and subsequent delirium observed in this study may be underestimated. In addition, we did not collect data on delirium severity, and whether PVS is related to delirium severity requires further investigation. Finally, PVS was assessed using a semiquantitative visual rating scale. Although practical to use in clinical research with good reliability and repeatability (Potter et al., 2015a), the scale is relatively insensitive and constrained by floor and ceiling effects (Wardlaw et al., 2020; Gouveia-Freitas and Bastos-Leite, 2021). The automated measures of PVS number and volume seem more precise, and further studies are needed to explore their value in predicting delirium.
CS-PVS on MRI acquired 6 months earlier was independently associated with the occurrence of subsequent delirium in older hospitalized patients. Integration of CS-PVS to the established risk factors enhanced the risk refinement and reclassification for delirium. CS-PVS may serve as a promising marker to identify delirium high-risk patients for proactive implementation of preventive interventions.
The raw data supporting the conclusions of this article will be made available by the authors, without undue reservation.
The studies involving human participants were reviewed and approved by the Biomedical Research Ethics Committee of West China Hospital, and conformed to the ethical guidelines of the Declaration of Helsinki. The patients/participants provided their written informed consent to participate in this study.
JY and QS conceptualized and designed the study. QS, YZ, and TL collected and interpreted the data. QS analyzed the data, prepared and reviewed the figures, and wrote the original draft. JY provided critical revisions to the manuscript. All authors contributed to the article and approved the submitted version.
This study was supported by grants from the Chinese National Science & Technology Pillar Program (2020YFC2005600), Sichuan Science and Technology Program (2019YFS0277), 1.3.5 project for disciplines of excellence, West China Hospital, Sichuan University (ZYJC21005), 1.3.5 project for disciplines of excellence-Clinical Research Incubation Project, West China Hospital, Sichuan University (19HXFH012), and National Clinical Research Center for Geriatrics, West China Hospital, Sichuan University (Z20191003).
The authors declare that the research was conducted in the absence of any commercial or financial relationships that could be construed as a potential conflict of interest.
All claims expressed in this article are solely those of the authors and do not necessarily represent those of their affiliated organizations, or those of the publisher, the editors and the reviewers. Any product that may be evaluated in this article, or claim that may be made by its manufacturer, is not guaranteed or endorsed by the publisher.
We thank the staff of the Department of Geriatrics Medicine, West China Hospital and all participants for their great contribution. We also appreciate Professor Deying Kang (Department of Evidence-based Medicine and Clinical Epidemiology, West China Hospital, Sichuan University) for providing statistical consultation.
The Supplementary Material for this article can be found online at: https://www.frontiersin.org/articles/10.3389/fnagi.2022.897802/full#supplementary-material
American Psychiatric Association (2000). DSM-IV-TR: Diagnostic and Statistical Manual of Mental Disorders, 4th Edn. Washington, DC: American Psychiatric Association.
Barisano, G., Sheikh-Bahaei, N., Law, M., Toga, A. W., and Sepehrband, F. (2021). Body mass index, time of day and genetics affect perivascular spaces in the white matter. J. Cereb. Blood Flow Metab. 41, 1563–1578. doi: 10.1177/0271678X20972856
Berezuk, C., Ramirez, J., Gao, F., Scott, C. J., Huroy, M., Swartz, R. H., et al. (2015). Virchow-Robin Spaces: Correlations with Polysomnography-Derived Sleep Parameters. Sleep 38, 853–858. doi: 10.5665/sleep.4726
Bown, C. W., Carare, R. O., Schrag, M. S., and Jefferson, A. L. (2022). Physiology and Clinical Relevance of Enlarged Perivascular Spaces in the Aging Brain. Neurology 98, 107–117. doi: 10.1212/WNL.0000000000013077
Carrano, A., Hoozemans, J. J., van der Vies, S. M., van Horssen, J., de Vries, H. E., and Rozemuller, A. J. (2012). Neuroinflammation and blood-brain barrier changes in capillary amyloid angiopathy. Neurodegener Dis. 10, 329–331. doi: 10.1159/000334916
Chan, C. K., Song, Y., Greene, R., Lindroth, H., Khan, S., Rios, G., et al. (2021). Meta-analysis of ICU Delirium Biomarkers and Their Alignment With the NIA-AA Research Framework. Am. J. Crit. Care 30, 312–319. doi: 10.4037/ajcc2021771
Charidimou, A., Boulouis, G., Pasi, M., Auriel, E., van Etten, E. S., Haley, K., et al. (2017). MRI-visible perivascular spaces in cerebral amyloid angiopathy and hypertensive arteriopathy. Neurology 88, 1157–1164. doi: 10.1212/WNL.0000000000003746
Charidimou, A., Hong, Y. T., Jager, H. R., Fox, Z., Aigbirhio, F. I., Fryer, T. D., et al. (2015). White matter perivascular spaces on magnetic resonance imaging: marker of cerebrovascular amyloid burden? Stroke 46, 1707–1709. doi: 10.1161/STROKEAHA.115.009090
Charidimou, A., Jager, R. H., Peeters, A., Vandermeeren, Y., Laloux, P., Baron, J. C., et al. (2014). White matter perivascular spaces are related to cortical superficial siderosis in cerebral amyloid angiopathy. Stroke 45, 2930–2935. doi: 10.1161/STROKEAHA.114.005568
Charlson, M. E., Pompei, P., Ales, K. L., and MacKenzie, C. R. (1987). A new method of classifying prognostic comorbidity in longitudinal studies: development and validation. J. Chronic. Dis. 40, 373–383. doi: 10.1016/0021-9681(87)90171-8
Clancy, U., Gilmartin, D., Jochems, A. C. C., Knox, L., Doubal, F. N., and Wardlaw, J. M. (2021). Neuropsychiatric symptoms associated with cerebral small vessel disease: a systematic review and meta-analysis. Lancet Psychiatry 8, 225–236. doi: 10.1016/S2215-0366(20)30431-4
Debette, S., Schilling, S., Duperron, M. G., Larsson, S. C., and Markus, H. S. (2019). Clinical Significance of Magnetic Resonance Imaging Markers of Vascular Brain Injury: A Systematic Review and Meta-analysis. JAMA Neurol. 76, 81–94. doi: 10.1001/jamaneurol.2018.3122
Del Brutto, O. H., Mera, R. M., Del Brutto, V. J., and Castillo, P. R. (2019). Enlarged basal ganglia perivascular spaces and sleep parameters. A population-based study. Clin. Neurol. Neurosurg. 182, 53–57. doi: 10.1016/j.clineuro.2019.05.002
DeLong, E. R., DeLong, D. M., and Clarke-Pearson, D. L. (1988). Comparing the areas under two or more correlated receiver operating characteristic curves: a nonparametric approach. Biometrics 44, 837–845.
Ding, J., Sigurethsson, S., Jonsson, P. V., Eiriksdottir, G., Charidimou, A., Lopez, O. L., et al. (2017). Large Perivascular Spaces Visible on Magnetic Resonance Imaging, Cerebral Small Vessel Disease Progression, and Risk of Dementia: The Age, Gene/Environment Susceptibility-Reykjavik Study. JAMA Neurol. 74, 1105–1112. doi: 10.1001/jamaneurol.2017.1397
Fazekas, F., Chawluk, J. B., Alavi, A., Hurtig, H. I., and Zimmerman, R. A. (1987). MR signal abnormalities at 1.5 T in Alzheimer’s dementia and normal aging. Am. J. Roentgenol. 149, 351–356. doi: 10.2214/ajr.149.2.351
Fong, T. G., Jones, R. N., Shi, P., Marcantonio, E. R., Yap, L., Rudolph, J. L., et al. (2009). Delirium accelerates cognitive decline in Alzheimer disease. Neurology 72, 1570–1575. doi: 10.1212/WNL.0b013e3181a4129a
Francis, F., Ballerini, L., and Wardlaw, J. M. (2019). Perivascular spaces and their associations with risk factors, clinical disorders and neuroimaging features: A systematic review and meta-analysis. Int. J. Stroke 14, 359–371. doi: 10.1177/1747493019830321
Gao, L. L., Feng, D. M., Wang, R. H., Jiang, Y. Y., Zhang, M., and Yue, J. R. (2019). Validity and reliability of the Chinese version of short form of confused assessment method for the detection of delirium in the elderly [in Chinese]. Shiyong Laonian Yixue. 33, 133–136. doi: 10.3969/j.issn.1003-9198.2019.02.007
Goldberg, T. E., Chen, C., Wang, Y., Jung, E., Swanson, A., Ing, C., et al. (2020). Association of Delirium With Long-term Cognitive Decline: A Meta-analysis. JAMA Neurol. 77, 1373–1381. doi: 10.1001/jamaneurol.2020.2273
Gouveia-Freitas, K., and Bastos-Leite, A. J. (2021). Perivascular spaces and brain waste clearance systems: relevance for neurodegenerative and cerebrovascular pathology. Neuroradiology 63, 1581–1597. doi: 10.1007/s00234-021-02718-7
Hablitz, L. M., Pla, V., Giannetto, M., Vinitsky, H. S., Staeger, F. F., Metcalfe, T., et al. (2020). Circadian control of brain glymphatic and lymphatic fluid flow. Nat. Commun. 11:4411. doi: 10.1038/s41467-020-18115-2
Hatano, Y., Narumoto, J., Shibata, K., Matsuoka, T., Taniguchi, S., Hata, Y., et al. (2013). White-matter hyperintensities predict delirium after cardiac surgery. Am. J. Geriatr. Psychiatry 21, 938–945. doi: 10.1016/j.jagp.2013.01.061
Idland, A. V., Wyller, T. B., Stoen, R., Eri, L. M., Frihagen, F., Raeder, J., et al. (2017). Preclinical Amyloid-beta and Axonal Degeneration Pathology in Delirium. J. Alzheimers Dis. 55, 371–379. doi: 10.3233/JAD-160461
Inouye, S. K., Westendorp, R. G., and Saczynski, J. S. (2014). Delirium in elderly people. Lancet 383, 911–922. doi: 10.1016/S0140-6736(13)60688-1
Kalvas, L. B., and Monroe, T. B. (2019). Structural Brain Changes in Delirium: An Integrative Review. Biol. Res. Nurs. 21, 355–365. doi: 10.1177/1099800419849489
Klarenbeek, P., van Oostenbrugge, R. J., Rouhl, R. P., Knottnerus, I. L., and Staals, J. (2013). Ambulatory blood pressure in patients with lacunar stroke: association with total MRI burden of cerebral small vessel disease. Stroke 44, 2995–2999. doi: 10.1161/STROKEAHA.113.002545
Lachmann, G., Kant, I., Lammers, F., Windmann, V., Spies, C., Speidel, S., et al. (2019). Cerebral microbleeds are not associated with postoperative delirium and postoperative cognitive dysfunction in older individuals. PLoS One 14:e0218411. doi: 10.1371/journal.pone.0218411
Laurila, J. V., Pitkala, K. H., Strandberg, T. E., and Tilvis, R. S. (2004). Detection and documentation of dementia and delirium in acute geriatric wards. Gen. Hosp. Psychiatry 26, 31–35. doi: 10.1016/j.genhosppsych.2003.08.003
Lysen, T. S., Yilmaz, P., Dubost, F., Ikram, M. A., de Bruijne, M., Vernooij, M. W., et al. (2021). Sleep and perivascular spaces in the middle-aged and elderly population. J. Sleep Res. 31:e13485. doi: 10.1111/jsr.13485
Maclullich, A. M., Wardlaw, J. M., Ferguson, K. J., Starr, J. M., Seckl, J. R., and Deary, I. J. (2004). Enlarged perivascular spaces are associated with cognitive function in healthy elderly men. J. Neurol. Neurosurg. Psychiatry 75, 1519–1523. doi: 10.1136/jnnp.2003.030858
Maldonado, J. R. (2018). Delirium pathophysiology: An updated hypothesis of the etiology of acute brain failure. Int. J. Geriatr. Psychiatry 33, 1428–1457. doi: 10.1002/gps.4823
Marcantonio, E. R. (2017). Delirium in Hospitalized Older Adults. N. Engl. J. Med. 377, 1456–1466. doi: 10.1056/NEJMcp1605501
Nitchingham, A., Kumar, V., Shenkin, S., Ferguson, K. J., and Caplan, G. A. (2018). A systematic review of neuroimaging in delirium: predictors, correlates and consequences. Int. J. Geriatr. Psychiatry 33, 1458–1478. doi: 10.1002/gps.4724
Omiya, H., Yoshitani, K., Yamada, N., Kubota, Y., Takahashi, K., Kobayashi, J., et al. (2015). Preoperative brain magnetic resonance imaging and postoperative delirium after off-pump coronary artery bypass grafting: a prospective cohort study. Can. J. Anaesth. 62, 595–602. doi: 10.1007/s12630-015-0327-x
Opel, R. A., Christy, A., Boespflug, E. L., Weymann, K. B., Case, B., Pollock, J. M., et al. (2019). Effects of traumatic brain injury on sleep and enlarged perivascular spaces. J. Cereb. Blood Flow Metab. 39, 2258–2267. doi: 10.1177/0271678X18791632
Paradise, M., Crawford, J. D., Lam, B. C. P., Wen, W., Kochan, N. A., Makkar, S., et al. (2021). Association of Dilated Perivascular Spaces With Cognitive Decline and Incident Dementia. Neurology 96:e1501–e1511. doi: 10.1212/WNL.0000000000011537
Parodi-Rullan, R. M., Javadov, S., and Fossati, S. (2021). Dissecting the Crosstalk between Endothelial Mitochondrial Damage, Vascular Inflammation, and Neurodegeneration in Cerebral Amyloid Angiopathy and Alzheimer’s Disease. Cells 10:2903. doi: 10.3390/cells10112903
Passiak, B. S., Liu, D., Kresge, H. A., Cambronero, F. E., Pechman, K. R., Osborn, K. E., et al. (2019). Perivascular spaces contribute to cognition beyond other small vessel disease markers. Neurology 92:e1309–e1321. doi: 10.1212/WNL.0000000000007124
Pendlebury, S. T., Thomson, R. J., Welch, S. J. V., Kuker, W., and Rothwell, P. M. (2022). Utility of white matter disease and atrophy on routinely acquired brain imaging for prediction of long-term delirium risk: population-based cohort study. Age Ageing 51:afab200. doi: 10.1093/ageing/afab200
Pfeiffer, E. (1975). A short portable mental status questionnaire for the assessment of organic brain deficit in elderly patients. J. Am. Geriatr. Soc. 23, 433–441. doi: 10.1111/j.1532-5415.1975.tb00927.x
Piantino, J., Boespflug, E. L., Schwartz, D. L., Luther, M., Morales, A. M., Lin, A., et al. (2020). Characterization of MR Imaging-Visible Perivascular Spaces in the White Matter of Healthy Adolescents at 3T. AJNR 41, 2139–2145. doi: 10.3174/ajnr.A6789
Potter, G. M., Chappell, F. M., Morris, Z., and Wardlaw, J. M. (2015a). Cerebral perivascular spaces visible on magnetic resonance imaging: development of a qualitative rating scale and its observer reliability. Cerebrovasc. Dis. 39, 224–231. doi: 10.1159/000375153
Potter, G. M., Doubal, F. N., Jackson, C. A., Chappell, F. M., Sudlow, C. L., Dennis, M. S., et al. (2015b). Enlarged perivascular spaces and cerebral small vessel disease. Int. J. Stroke 10, 376–381. doi: 10.1111/ijs.12054
Roher, A. E., Kuo, Y. M., Esh, C., Knebel, C., Weiss, N., Kalback, W., et al. (2003). Cortical and leptomeningeal cerebrovascular amyloid and white matter pathology in Alzheimer’s disease. Mol. Med. 9, 112–122.
Sepehrband, F., Barisano, G., Sheikh-Bahaei, N., Choupan, J., Cabeen, R. P., Lynch, K. M., et al. (2021). Volumetric distribution of perivascular space in relation to mild cognitive impairment. Neurobiol. Aging 99, 28–43. doi: 10.1016/j.neurobiolaging.2020.12.010
van Veluw, S. J., Biessels, G. J., Bouvy, W. H., Spliet, W. G., Zwanenburg, J. J., Luijten, P. R., et al. (2016). Cerebral amyloid angiopathy severity is linked to dilation of juxtacortical perivascular spaces. J. Cereb. Blood Flow Metab. 36, 576–580. doi: 10.1177/0271678X15620434
Wardlaw, J. M., Benveniste, H., Nedergaard, M., Zlokovic, B. V., Mestre, H., Lee, H., et al. (2020). Perivascular spaces in the brain: anatomy, physiology and pathology. Nat. Rev. Neurol. 16, 137–153. doi: 10.1038/s41582-020-0312-z
Wardlaw, J. M., Smith, E. E., Biessels, G. J., Cordonnier, C., Fazekas, F., Frayne, R., et al. (2013). Neuroimaging standards for research into small vessel disease and its contribution to ageing and neurodegeneration. Lancet Neurol. 12, 822–838. doi: 10.1016/s1474-4422(13)70124-8
Wei, L. A., Fearing, M. A., Sternberg, E. J., and Inouye, S. K. (2008). The Confusion Assessment Method: a systematic review of current usage. J. Am. Geriatr. Soc. 56, 823–830. doi: 10.1111/j.1532-5415.2008.01674.x
Wuerfel, J., Haertle, M., Waiczies, H., Tysiak, E., Bechmann, I., Wernecke, K. D., et al. (2008). Perivascular spaces–MRI marker of inflammatory activity in the brain? Brain 131, 2332–2340. doi: 10.1093/brain/awn171
Keywords: delirium, perivascular spaces, cerebral small vessel disease, magnetic resonance imaging, older people
Citation: Song Q, Zhao Y, Lin T and Yue J (2022) Perivascular spaces visible on magnetic resonance imaging predict subsequent delirium in older patients. Front. Aging Neurosci. 14:897802. doi: 10.3389/fnagi.2022.897802
Received: 16 March 2022; Accepted: 28 June 2022;
Published: 18 July 2022.
Edited by:
Junko Kikuta, Juntendo University, JapanReviewed by:
Yuya Saito, Juntendo University Graduate School of Medicine, JapanCopyright © 2022 Song, Zhao, Lin and Yue. This is an open-access article distributed under the terms of the Creative Commons Attribution License (CC BY). The use, distribution or reproduction in other forums is permitted, provided the original author(s) and the copyright owner(s) are credited and that the original publication in this journal is cited, in accordance with accepted academic practice. No use, distribution or reproduction is permitted which does not comply with these terms.
*Correspondence: Jirong Yue, eXVlamlyb25nMTFAaG90bWFpbC5jb20=
Disclaimer: All claims expressed in this article are solely those of the authors and do not necessarily represent those of their affiliated organizations, or those of the publisher, the editors and the reviewers. Any product that may be evaluated in this article or claim that may be made by its manufacturer is not guaranteed or endorsed by the publisher.
Research integrity at Frontiers
Learn more about the work of our research integrity team to safeguard the quality of each article we publish.