 Ulrich Hoppe
 Thomas Hocke2
- 1Department of Audiology, ENT-Clinic, University of Erlangen-Nürnberg, Erlangen, Germany
- 2Cochlear Deutschland GmbH & Co. KG, Hanover, Germany
Hearing loss is one of the most common disorders worldwide. It affects communicative abilities in all age groups. However, it is well known that elderly people suffer more frequently from hearing loss. Two different model approaches were employed: A generalised linear model and a random forest regression model were used to quantify the relationship between pure-tone hearing loss, age, and speech perception. Both models were applied to a large clinical data set of 19,801 ears, covering all degrees of hearing loss. They allow the estimation of age-related decline in speech recognition for different types of audiograms. Our results show that speech scores depend on the specific type of hearing loss and life decade. We found age effects for all degrees of hearing loss. A deterioration in speech recognition of up to 25 percentage points across the whole life span was observed for constant pure-tone thresholds. The largest decrease was 10 percentage points per life decade. This age-related decline in speech recognition cannot be explained by elevated hearing thresholds as measured by pure-tone audiometry.
Introduction
More than 5% of the world’s population, approximately 460 million people, suffer from disabling hearing loss (WHO, 2021). Hearing disability is associated with reduced speech perception and, in consequence, reduced communication function. Hearing deteriorates with age (Zwaardemaker, 1891; Technical Committee ISO/TC 43 Acoustics, 2017). The ISO standard describes the age-dependent frequency-specific loss (ISO 7029:2017, 2017). The slope of the decline increases with growing age and frequency: While for 250 Hz the decline is in the order of 1 dB per decade in the fourth life decade, about 20 dB per decade can be observed for 6,000 Hz in the eighth life decade. While the ISO standard provides detailed information about the relationship between age and pure-tone sensitivity loss (PTSL), it makes no reference to speech recognition.
Given our ageing society and the prevalence of age-related hearing loss (ARHL), it is clear that hearing loss is a common public-health issue of increasing importance in the near future (WHO, 2021). Individuals with ARHL experience social withdrawal (Pronk et al., 2011), mental and physical decline (Shukla et al., 2020), and poorer quality of life (Davis et al., 2007).
Speech perception deficits in hearing-impaired people are mainly attributable to decreased audibility of the speech signal over part or all of the speech frequency range. Within Carhart’s (1951) framework for word recognition in quiet, this was referred to as loss of acuity. Additionally, Carhart introduced a second component which stems from impaired processing of the audible speech signal, resulting in a loss of clarity. Plomp (1978) referred to these components of hearing loss as attenuation (class A) and distortion (class D), respectively. The attenuation component can be assessed by pure-tone audiometry. The distortion component describes the impact of reduced temporal and frequency resolution. It is thought that the distortion component explains the deterioration of speech recognition which is not described by attenuation, namely pure-tone thresholds. Both attenuation and distortion are part of ARHL (van Rooij et al., 1989).
A large number of studies have focussed upon hearing in the elderly and have investigated PTSL and speech perception. However, the interpretation of these results remains challenging, as pure-tone thresholds change substantially with increasing age. Hence, it is necessary to correct for the effect of PTSL when investigating the effect of age on speech perception. One of the first attempts to do this was described by Jerger (1973) in a report on speech recognition in a large group of older subjects. He analysed scores from the clinical records of 2,162 patients. With subjects grouped according to age and average hearing loss at 0.5, 1 and 2 kHz, results suggested that speech recognition, defined as the maximum score (WRSmax) obtained by using a monosyllabic word list, declines above the age of sixty. In particular, he found that age had an effect on speech recognition of approximately 4% per life decade for individuals with mild hearing loss, but that it had a greater effect (e.g., 10% per decade) upon those with higher degrees of hearing loss. Unfortunately, he did not report on hearing loss at higher frequencies. It is known for a long time that hearing thresholds at these higher frequencies are, in particular, worse for older subjects (Zwaardemaker, 1891; Technical Committee ISO/TC 43 Acoustics, 2017).
Several studies have revealed that deterioration in speech understanding occurs in addition to deterioration in hearing sensitivity and includes components beyond elevated hearing thresholds (Bergman et al., 1976; Jerger and Hayes, 1977; Marshall and Bacon, 1981; Pedersen et al., 1991; Divenyi and Haupt, 1997; Kronlachner et al., 2018).
Some authors (Dubno et al., 1997; Humes, 2007) have highlighted the challenge of separating varying auditory thresholds from age, a factor affecting all sensory modalities (Humes and Young, 2016). In recent studies, speech recognition and its relation to age were investigated either by correcting for PTSL (Hoppe et al., 2014; Müller et al., 2016) or by using a longitudinal study design (Dubno et al., 2008). In a clinical population Hoppe et al. (2014) investigated speech recognition with hearing aids and WRSmax for different age groups in relation to average hearing loss at 0.5, 1, 2, and 4 kHz (4FPTA). They found a monotonic decrease in speech recognition with increasing age and a significant drop of about 2–4% per decade. This drop was attributed to age-dependent distortion. Müller et al. (2016) investigated, as well, the WRSmax as a function of age. After correcting for 4FPTA they found a significant, though smaller, drop for people aged above 70 years of about 2–3% per decade. Neither study included a hearing threshold beyond 4 kHz, and therefore, a small overestimation of the influence of age cannot be excluded. However, Dubno et al. (2008) found a larger effect, around 7–8% per life decade. They performed a longitudinal study including 256 subjects with age-related hearing loss, aged 50–82 years, over a period of 3–15 years. The speech recognition scores were corrected for by changing hearing thresholds during the observation phase; this was done by using the individuals’ articulation index as an importance-weighted metric for speech audibility. Unfortunately, longitudinal studies suffer from other disadvantages relating to population size, loss of follow-up etc., and their duration can approach the limits of the clinician’s working life span. The special characteristics of the study population and methods—neither the WRSmax nor hearing-aid scores were measured—differ from the studies mentioned above. This impedes a direct comparison with the above-mentioned studies and therefore does not imply a contradiction amongst them.
In summary, increased PTSL is the most common expression of ARHL. However, there is evidence that a number of other auditory functions are affected as well (Profant et al., 2019). These functions decline with increasing age and the PTSL does not predict speech recognition sufficiently well.
The goal of this study is to describe the relationship between hearing loss, age, and speech recognition by means of a machine-learning algorithm (Random Forest Regression, RFR, Breiman, 2001). RFR is an algorithm that uses an ensemble method of decision-tree-based regressions to determine a response from a set of input variables. It does not rely on any particular assumptions regarding data distribution. This algorithm is applied to a large data set from routine clinical audiometry in order to investigate the influence of age. The result is a representation of the relationship between pure-tone thresholds and age on the input side and speech recognition on the target side. The model reflects the influence of the age-related distortion component on speech perception.
Additionally, the results of the RFR model will be compared with those of a generalised linear model (GLM) approach. In contrast to the RFR, the GLM requires assumptions about the qualitative relation between input and target variables, whereas the RFR does not need a pre-defined equation framework.
In order to categorise pure-tone thresholds, standard audiograms as proposed by Bisgaard et al. (2010) are used as model input. Both derived models (the RFR and GLM) will be applied to these standard audiograms.
Materials and Methods
Audiometric data were retrieved from a clinical data base at the Audiological Department of Erlangen University Hospital. From the routine audiometric measurements, pure-tone thresholds for both bone and air conduction were extracted. Additionally, speech recognition scores for monosyllabic word lists of 20 items for each presentation level of the Freiburg Test (Hahlbrock, 1957) were evaluated. The complete discrimination function, ranging from 65 dBSPL up to 120 dBSPL was measured. All measurements had been conducted in clinical routine in sound-shielded booths with clinical class A audiometers (AT900/AT1000 AURITEC Medizindiagnostische Systeme GmbH, Hamburg, Germany). Approval for this study was received from the Institutional Review Board of the University of Erlangen (Ref. No. 162_17 Bc). All methods were carried out in accordance with relevant guidelines and regulations.
Data Preparation
Among 91,991 patients who underwent audiometry at our centre from 2002 to 2020 we identified 53,782 adults aged at least 18 years at the time of first investigation. Initially, the data were screened for repeated measurements. Only the first audiometric assessment of each patient was retained. Subsequently, the data from 107,564 ears (hereinafter “cases”) were checked for a complete set of air and bone conduction thresholds. After removal of incomplete data sets there remained 107,010 cases. In the next step, cases with missing or incomplete speech audiometry data were deleted, whereafter 26,324 cases remained. The data were then screened for cases of mixed hearing loss; the latter was defined as a difference between air and bone conduction thresholds greater than 10 dB for frequencies within the range 0.5–3 kHz. After removal of mixed-hearing-loss cases, the remaining 19,929 cases were checked for inconsistent results (<1%) caused e.g., by simulation or lack of collaboration on the part of the patient. If, within the discrimination function for monosyllabic words, a score larger than zero was observed while the presentation level was below the hearing threshold, the data set for that case was not used. For some cases it was observed that the measurement of the discrimination function had not been fully completed, so that a score of 100% was not reached, with the presentation level well (>15 dB) below the discomfort level. Those cases were removed as well. The 19,801 cases (19,801 ears of 12,040 patients) finally remaining were used for model-building and for error analysis.
The following data were used for analysis:
1. Air-conduction hearing thresholds at 0.125, 0.25, 0.5, 0.75, 1, 1.5, 2, 3, 4, 6, and 8 kHz,
2. Word recognition score at 65 dBSPL (WRS65),
3. Maximum word recognition score (WRSmax) and corresponding level (Lmax).
WRS65 describes speech perception at a typical conversational level. While WRS65 is primarily dependent on the attenuation and reflects the loss of speech perception ability in everyday life, WRSmax describes the maximum information that can be processed to the auditory system. The difference WRSmax – WRS65 can be used to estimate the acceptance of acoustic amplification (Halpin and Rauch, 2012).
In order to summarise audiometric constellation of our study population we used an established WHO classification (Olusanya et al., 2019). The average of hearing thresholds, measured at 0.5, 1, 2, and 4 kHz (4FPTA) was used to classify according to the WHO categories: WHO0 (≤ 25 dBHL), WHO1 (26 dBHL < 4FPTA ≤ 40 dBHL), WHO2 (40 dBHL < 4FPTA ≤ 60 dBHL), WHO3 (60 dBHL < 4FPTA ≤ 80 dBHL) or WHO4 (80 dBHL < 4FPTA). The Kruskal–Wallis Test was used for group comparisons of the medians for WRS65 and WRSmax.
Model Setup
For data analysis, model calculation, statistics and figures, the software Matlab R2019B including the Statistics and Machine Learning Toolbox V11.6 (The Mathworks Inc. Natick, Massachusetts) was used. Data were rounded before the RFR model calculation: hearing thresholds to 5 dB and the patients’ ages to life decades. Two models (GLM and RFR) were used to describe the relationship between age and PTSL as input variables and speech recognition variables (WRS65, WRSmax and Lmax) as target variables. Equation 1 describes the applied GLM for the target variables WRS65 and WRSmax. Equation 2 describes the GLM for Lmax.:
PTSLi refer to the air-conduction hearing thresholds at the test frequencies 125 Hz to 8 kHz as mentioned above. In order to represent correctly the overall data distribution according to age and 4FPTA, a stratified fivefold cross-validation was applied. In detail, both models, the RFR and GLM, were trained with 80% of the data (training group). The models were then tested in the remaining 20% of the study population (test group). Before group assignment, the data sets were sorted according to 4FPTA and age. Subsequently, every fifth data set was assigned to the test group. This procedure was repeated five times with disjoint training and test sets. The pure-tone thresholds at all frequencies and the patients’ age were input variables, while the WRS65, WRSmax and Lmax were targets. For each of the three output variables a separate model was built.
As a parameter for optimisation and estimating the RFR performance, the median absolute error (MAE, resulting from measured minus predicted score) was used as cost function for both the training group and the test group. The MAE of the test group varied up to 25% for different parameters.
For a large range (50–1,000) of the number of learning cycles (equivalent to number of decision trees) the resulting MAE varied by less than 10%. Finally, a value of 100 for the number of learning cycles was used. A small effect on the MAE was found for the other parameters as well. In summary, the following values were used for the Matlab function “fitrensemble()”: “MergeLeaves” = off, the decision tree does not merge leaves. “MinLeafSize” = 5, the minimum number of observations per leaf. “MinParentSize” = 10, the minimum number of observations per branch node. “NumVariablesToSample” = square root of the number of predictors for classification. “PredictorSelection” = allsplits, selects the split predictor that maximises the split-criterion gain over all possible splits of all predictors. The number of nodes per binary decision tree, one result of the model calculation, varied for each model: around 2,150 for WRSmax, around 2,700 for WRS65, and around 3,650 for Lmax.
The RFR and GLM were applied to Bisgaard standard audiograms. These standard audiograms are well established and widely used for audiological investigations (e.g., Tu et al., 2021; van Beurden et al., 2021). They are based on a large clinical data base. The standard set comprises ten standard audiograms (see Figure 1) covering a frequency range of 250 Hz to 6,000 Hz. Flat and moderately sloping (N1–N7) and steep (S1–S3) audiograms are considered. Higher indices correspond to greater PTSL.
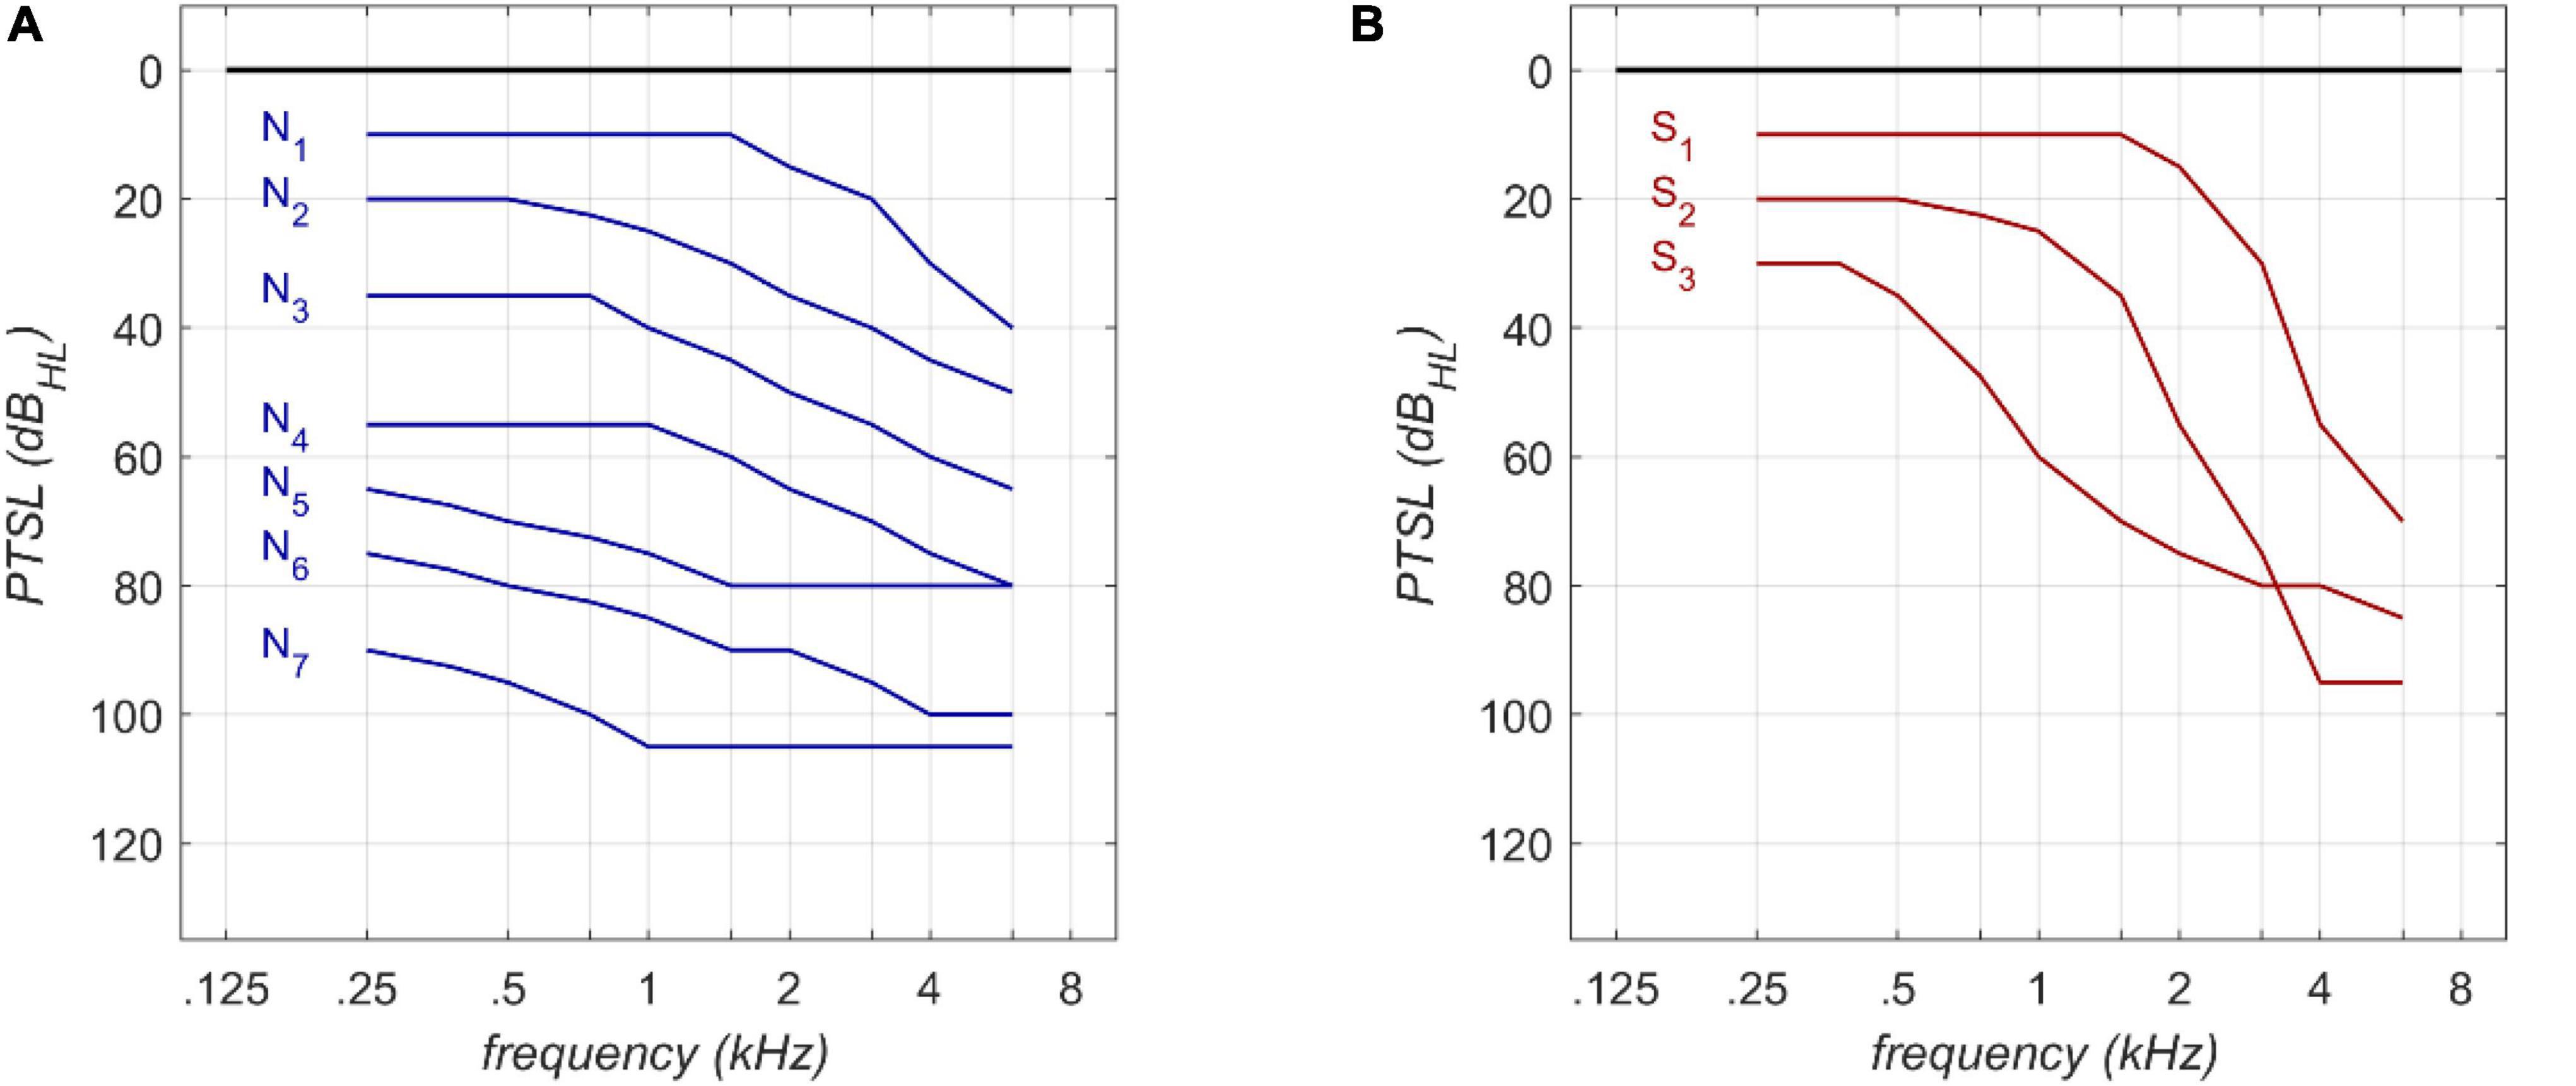
Figure 1. Audiogram types according to Bisgaard et al. (2010) for flat (A) and steep (B) audiograms.
Results
Figures 2, 3 depict the basic characteristics of the clinical population investigated. The stacked bar plot (Figure 2) shows the case distribution in our clinical population (N = 19,801). The mean ages of the different groups were 50, 61, 66, 65, and 59 years for WHO0, WHO1, WHO2, WHO3 and WHO4. The vast majority (77%) of cases involved persons between 40 and 80 years of age. The subjects aged 40–80 years dominated all WHO grades except WHO0. The smallest data coverage with respect to age and hearing loss was observed for very young adults in the WHO4 group and for subjects above 80 years of age in the WHO0 group.
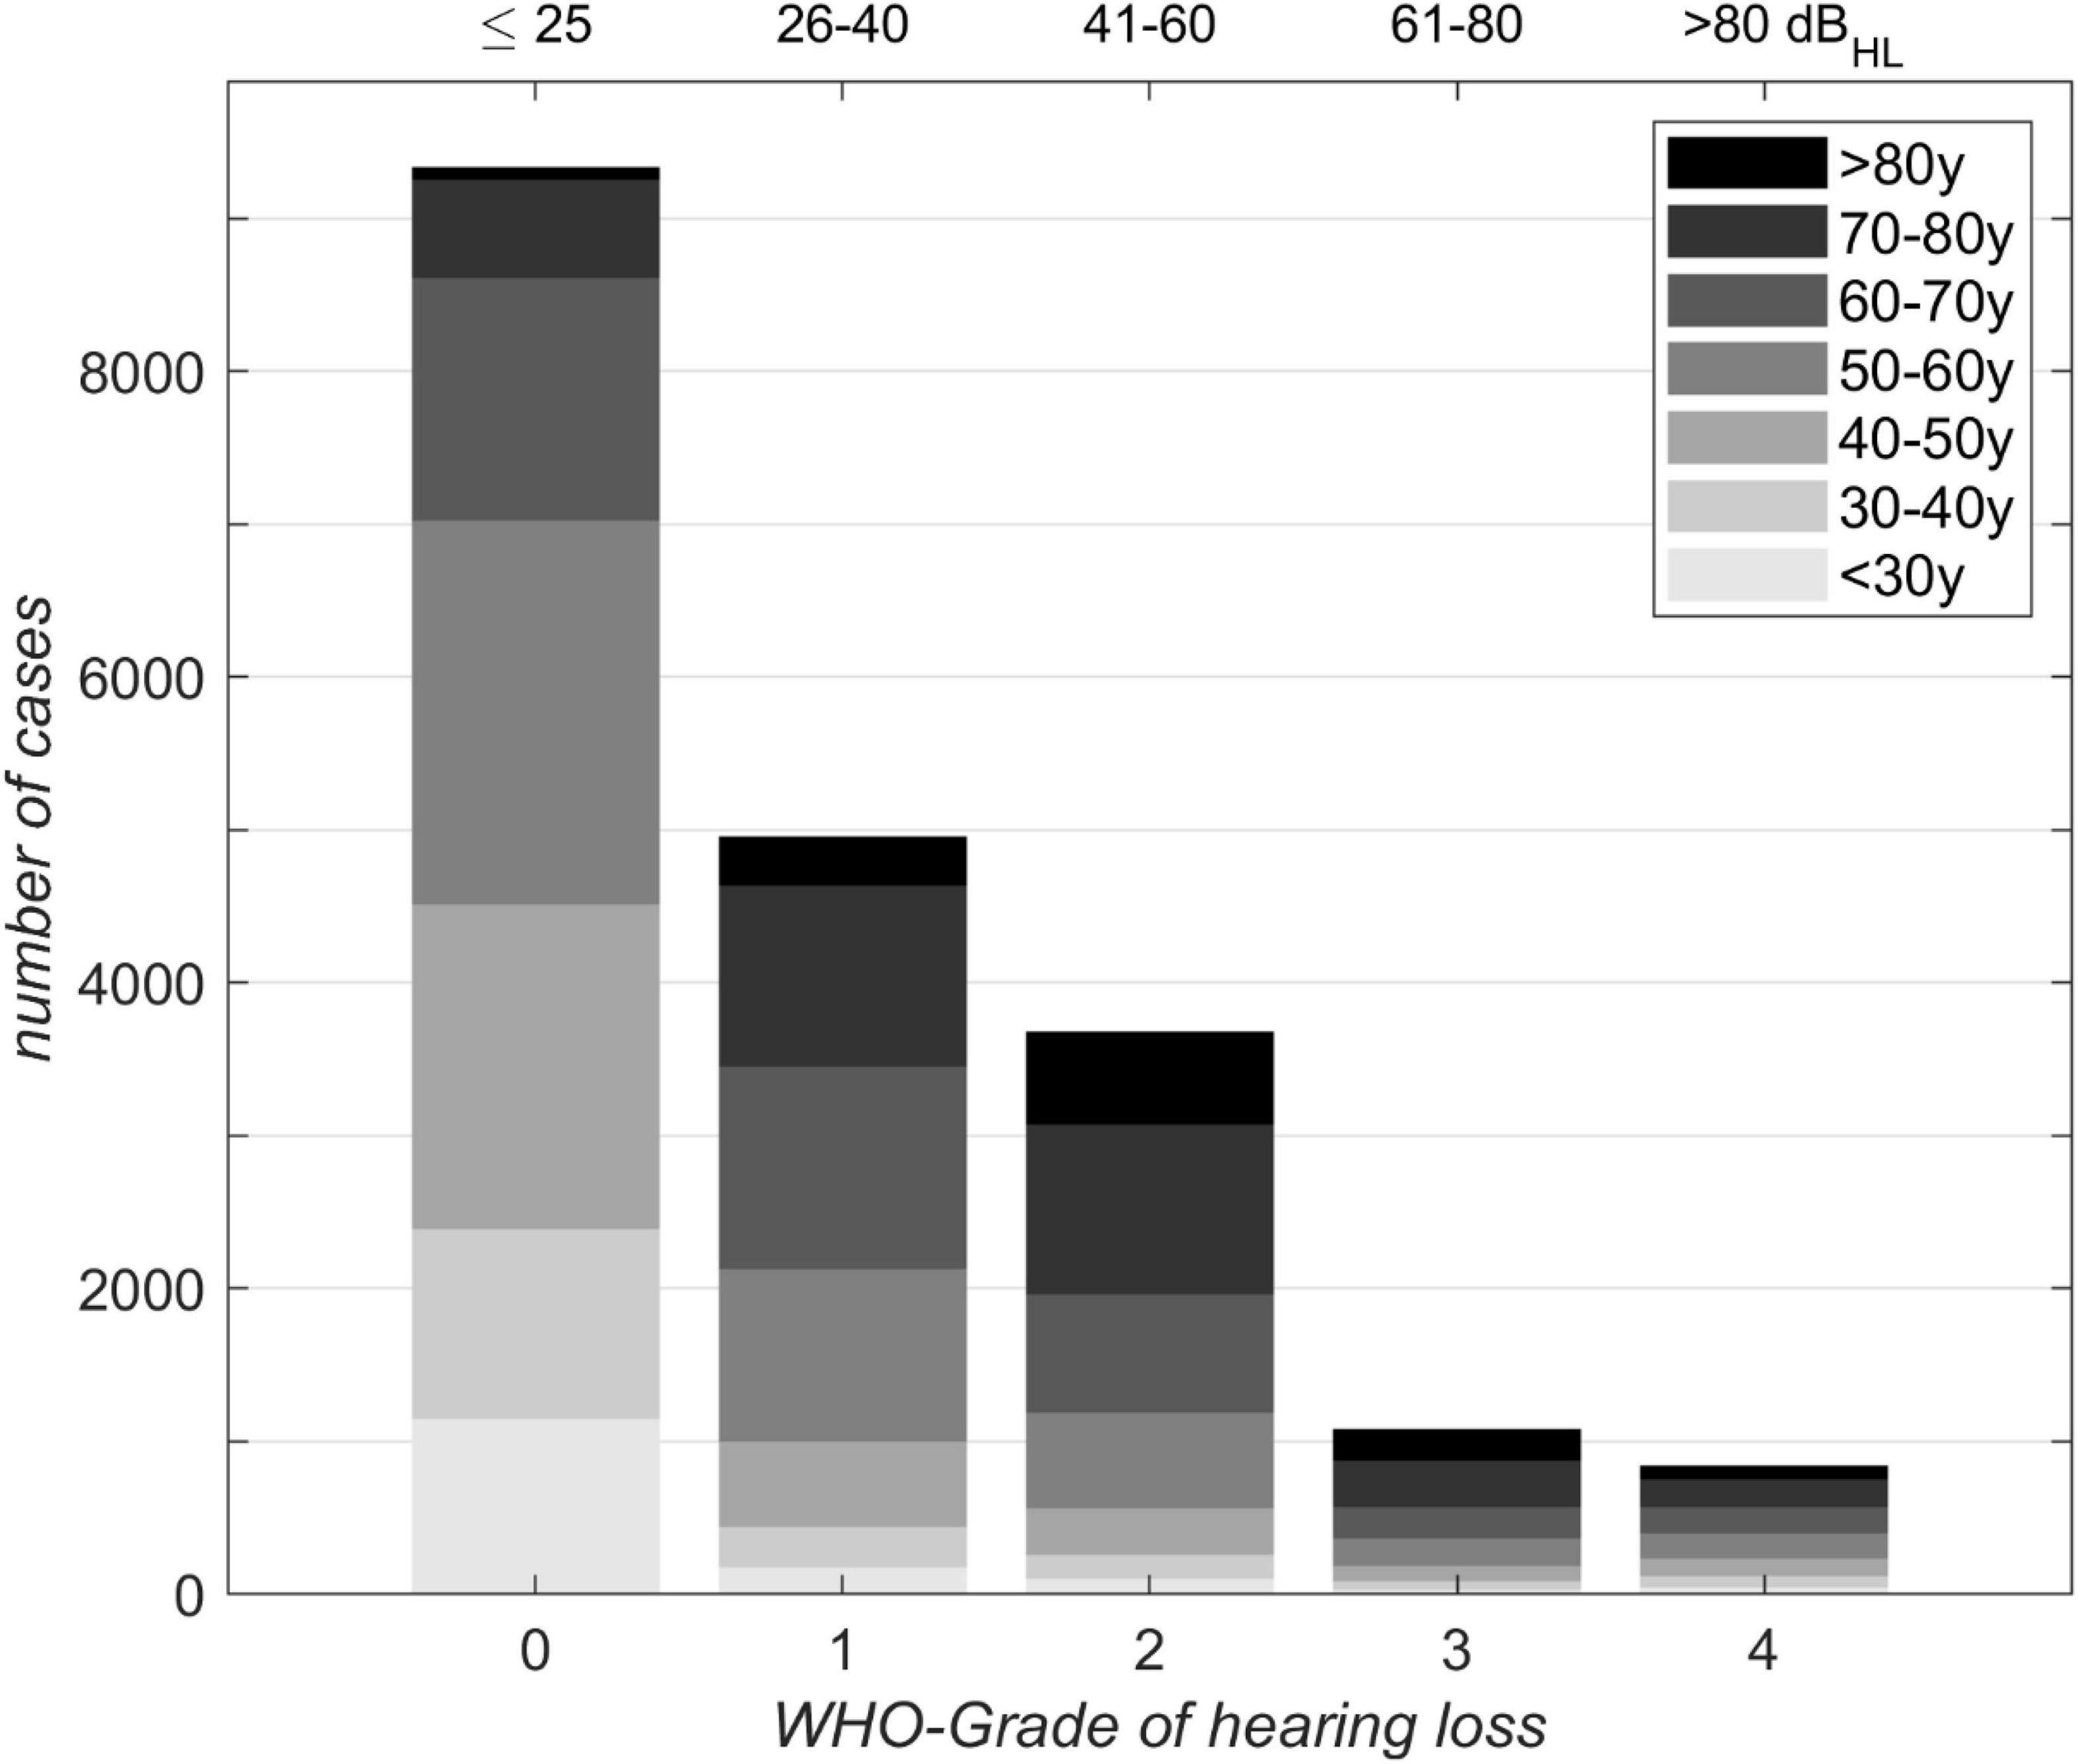
Figure 2. Distribution of 19,801 cases with respect to age for different WHO grades of hearing loss. Corresponding 4FPTA ranges are shown on the upper x-axis.
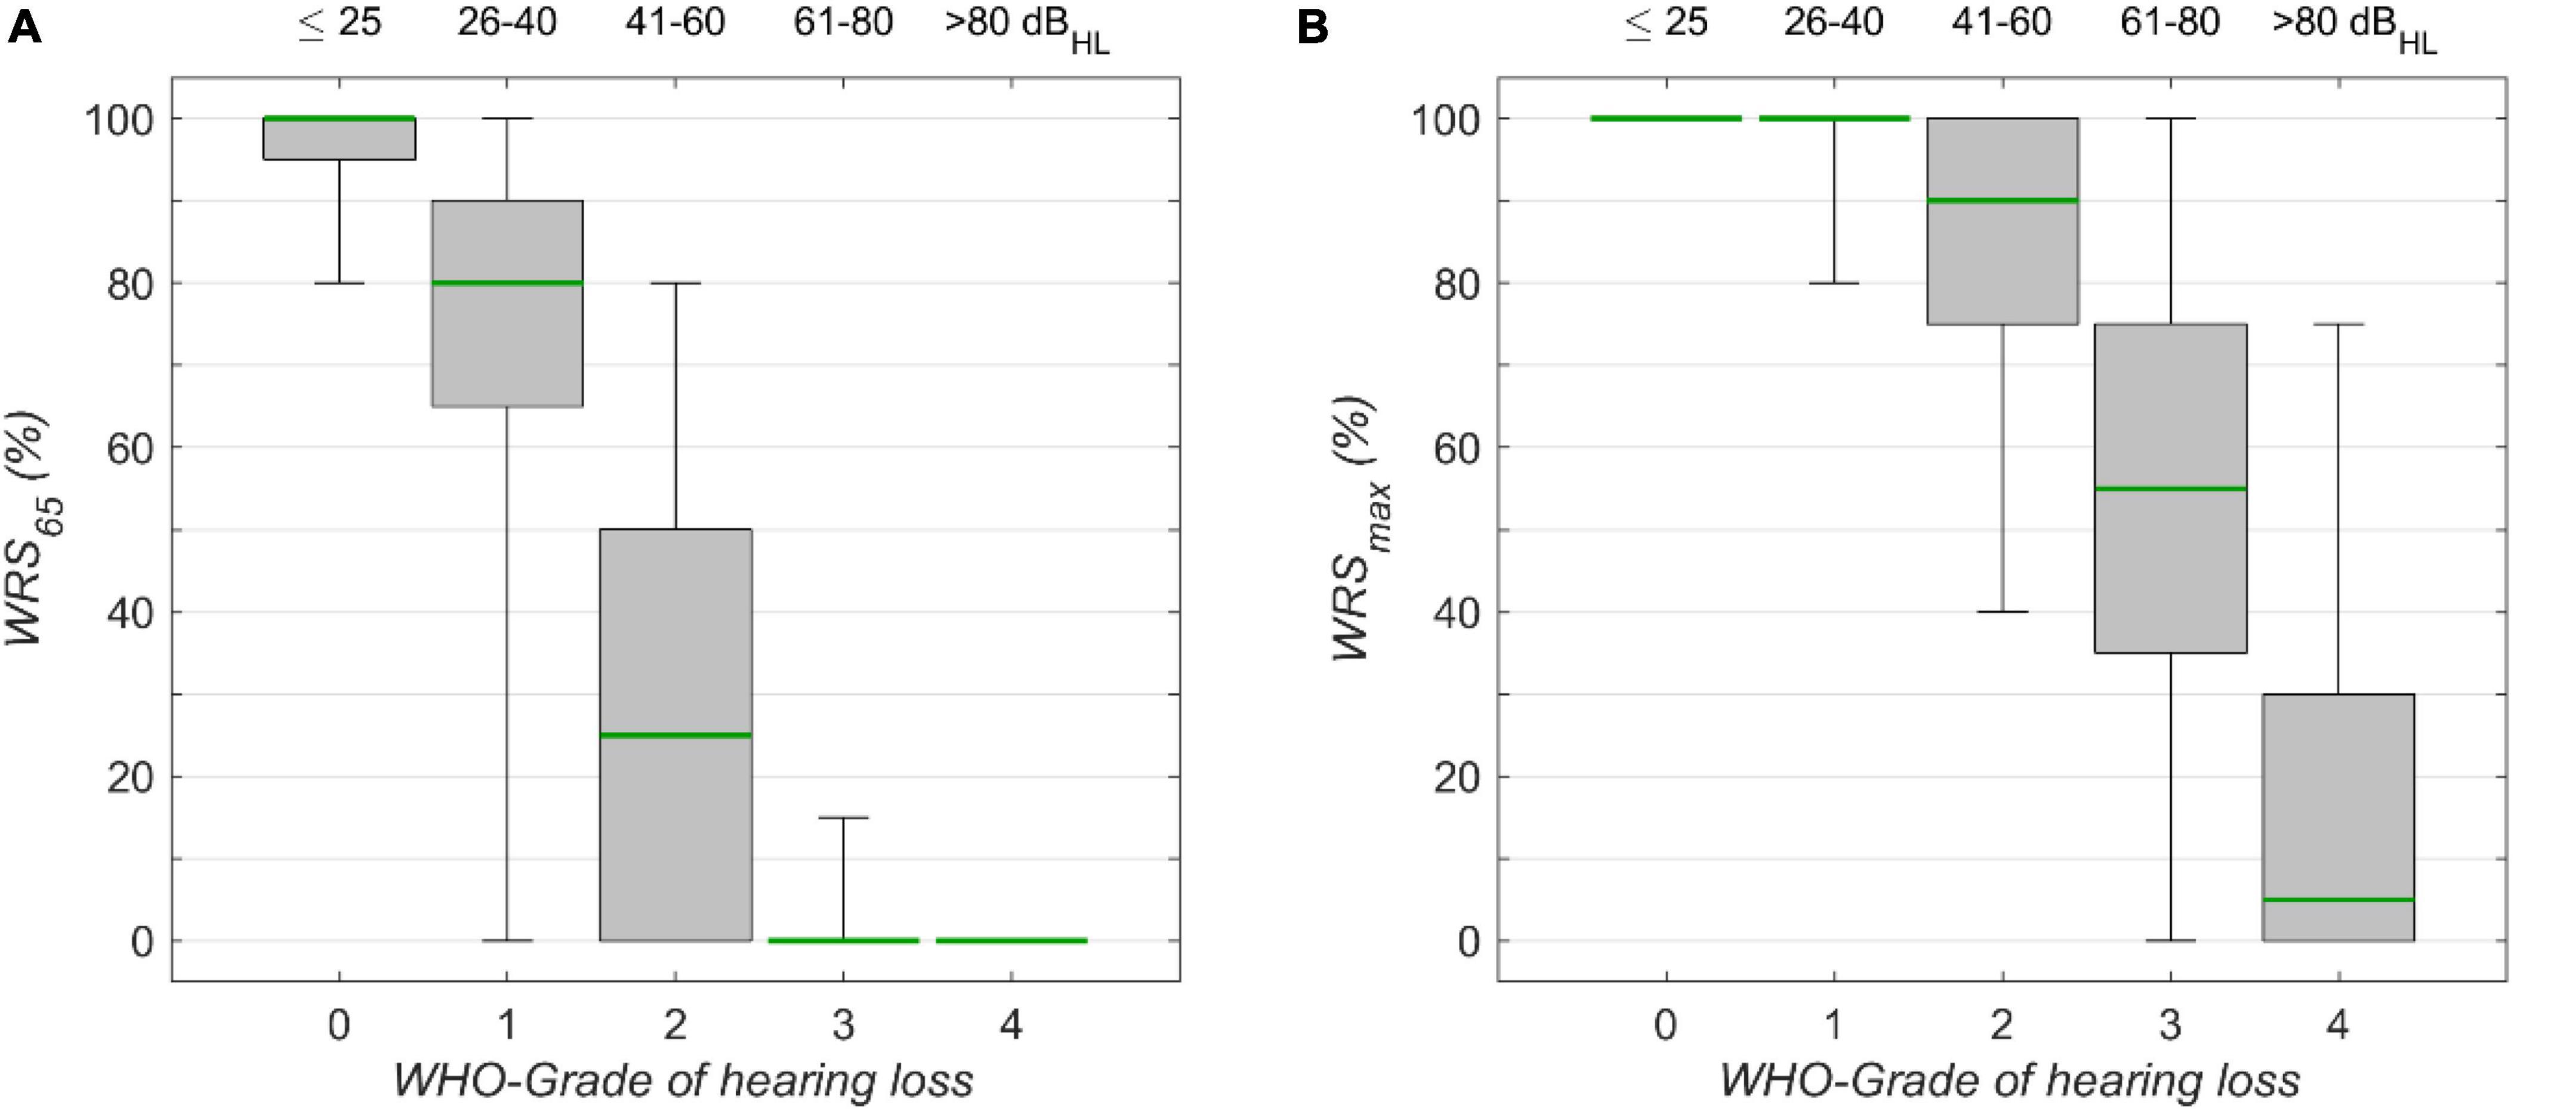
Figure 3. The monosyllabic score (A) at 65 dBSPL presentation level (WRS65) and (B) the maximum word recognition score (WRSmax), for different WHO grades of hearing loss. Corresponding 4FPTA ranges are shown on the upper x-axis. The boxplots show medians (green) with 1st and 3rd quartiles. The whiskers denote the 2.5 and 97.5 percentiles.
The speech audiometric results for the model’s target scores, WRS65 and WRSmax, are shown in Figures 3A,B, respectively. For both measures the median decreased with increasing degrees of hearing loss. The Kruskal–Wallis Test yielded significant group effects for WRS65 (χ2 = 15.055, p < 10–15, df = 4) WRS65 and WRSmax (χ2 = 11.873, p < 10–15, df = 4). The interquartile ranges for WRS65 were 5, 25, 50, 0, and 0% for WHO0, WHO1, WHO2, WHO3, and WHO4, respectively. The interquartile ranges for WRSmax were 0, 0, 25, 40, and 30% for the corresponding WHO groups. The variability for WRS65 was largest for WHO1, while for WRSmax the largest variability was found for WHO3. In this rather rough classification the interpretation of some outliers may benefit from additional information about the specific configuration of hearing loss. In particular, the WHO classification employs the hearing thresholds at only four frequencies, while other frequencies are not considered. The lowest quartile of the WHO0 cases shows a WRS65 lower than 95%. In this subgroup the mean threshold for high frequencies (>4 kHz) was 48 dBHL, while for the cases with WRS65 above 95% in the WHO0 group the mean threshold for high frequencies was 25 dBHL in the WHO0 group.
GLM and RFR
Tables 1–3 show the derived GLM parameters β for each target variable including statistical parameters. For the word recognition scores, WRS65 and WRSmax, the lowest frequency (125 Hz) did not contribute significantly to the model output. None of the other frequencies provided a consistent picture. For Lmax all but one frequency (750 Hz) contributed significantly to the target variable. For the subject’s age the GLM revealed a significant effect on all target variables. For comparison, the permutation feature importance of the RFR is added in the right-hand column of Tables 1–3. Larger values for a feature indicate a greater impact on the target variable.
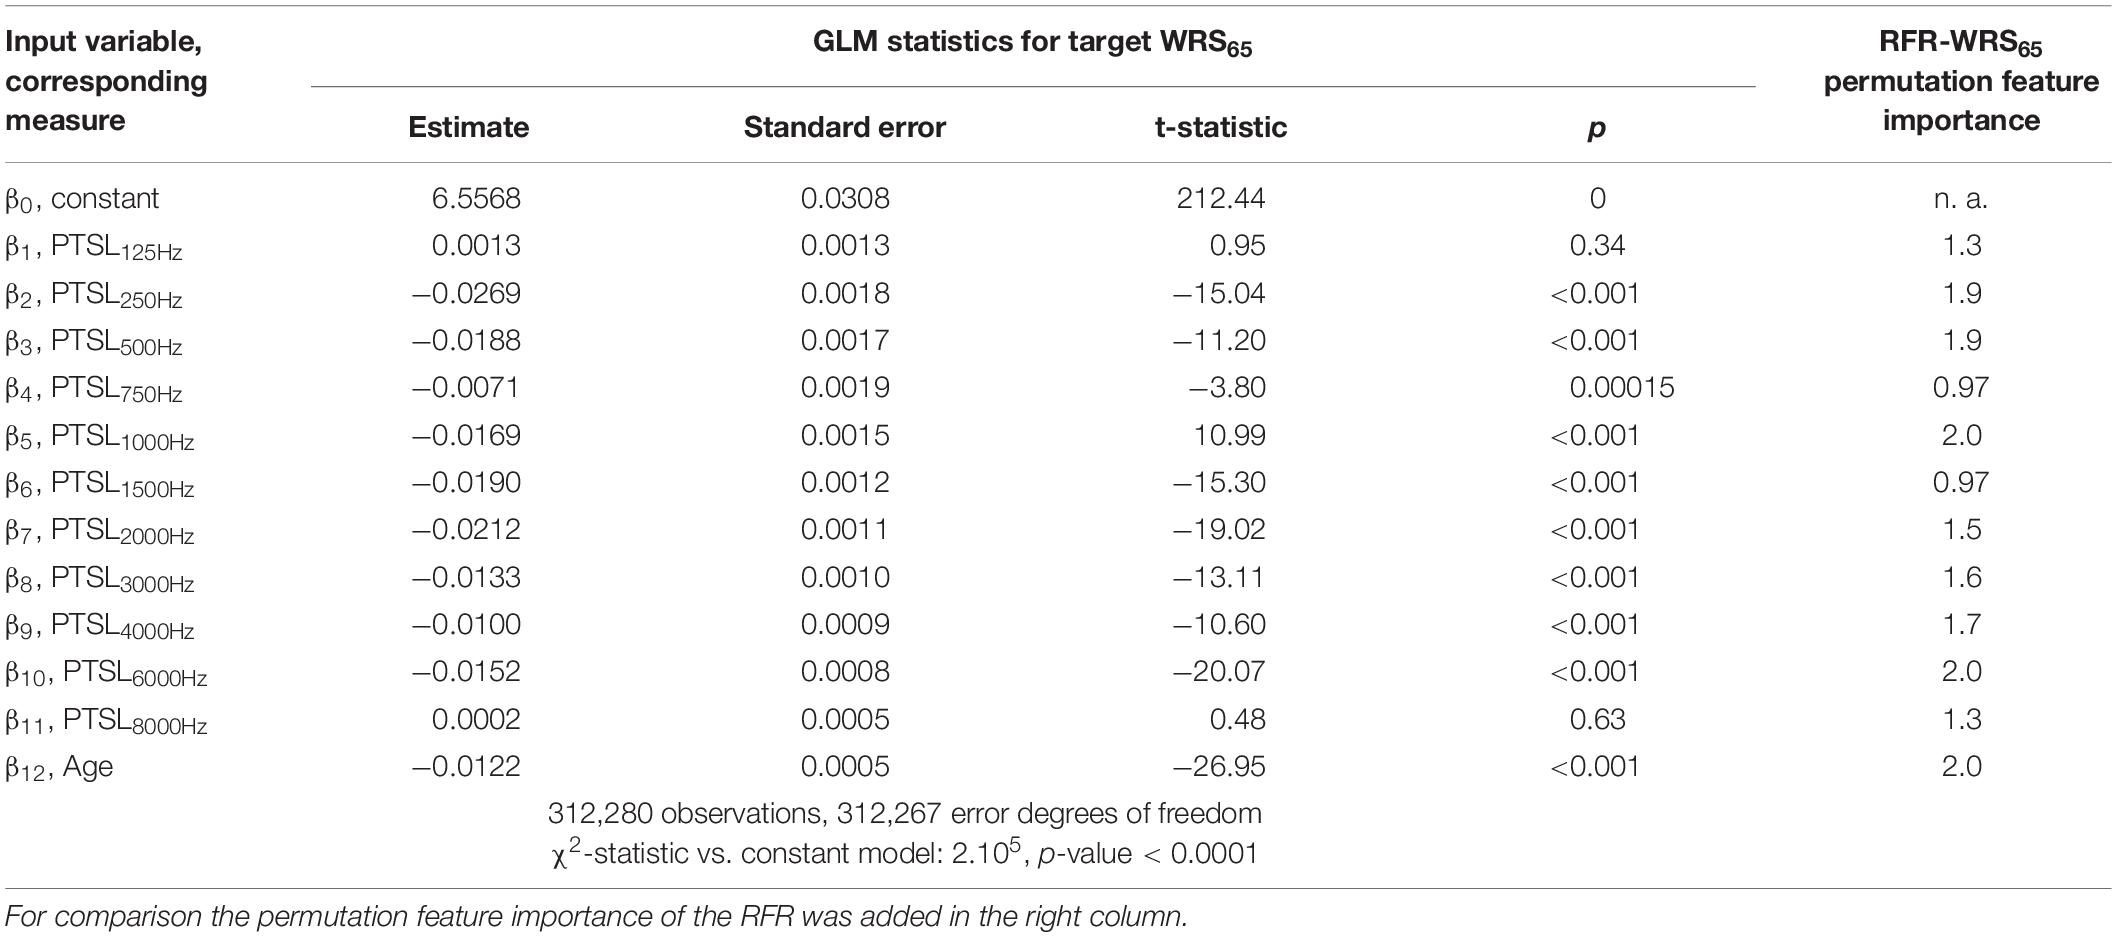
Table 1. GLM parameters for target variable WRS65.
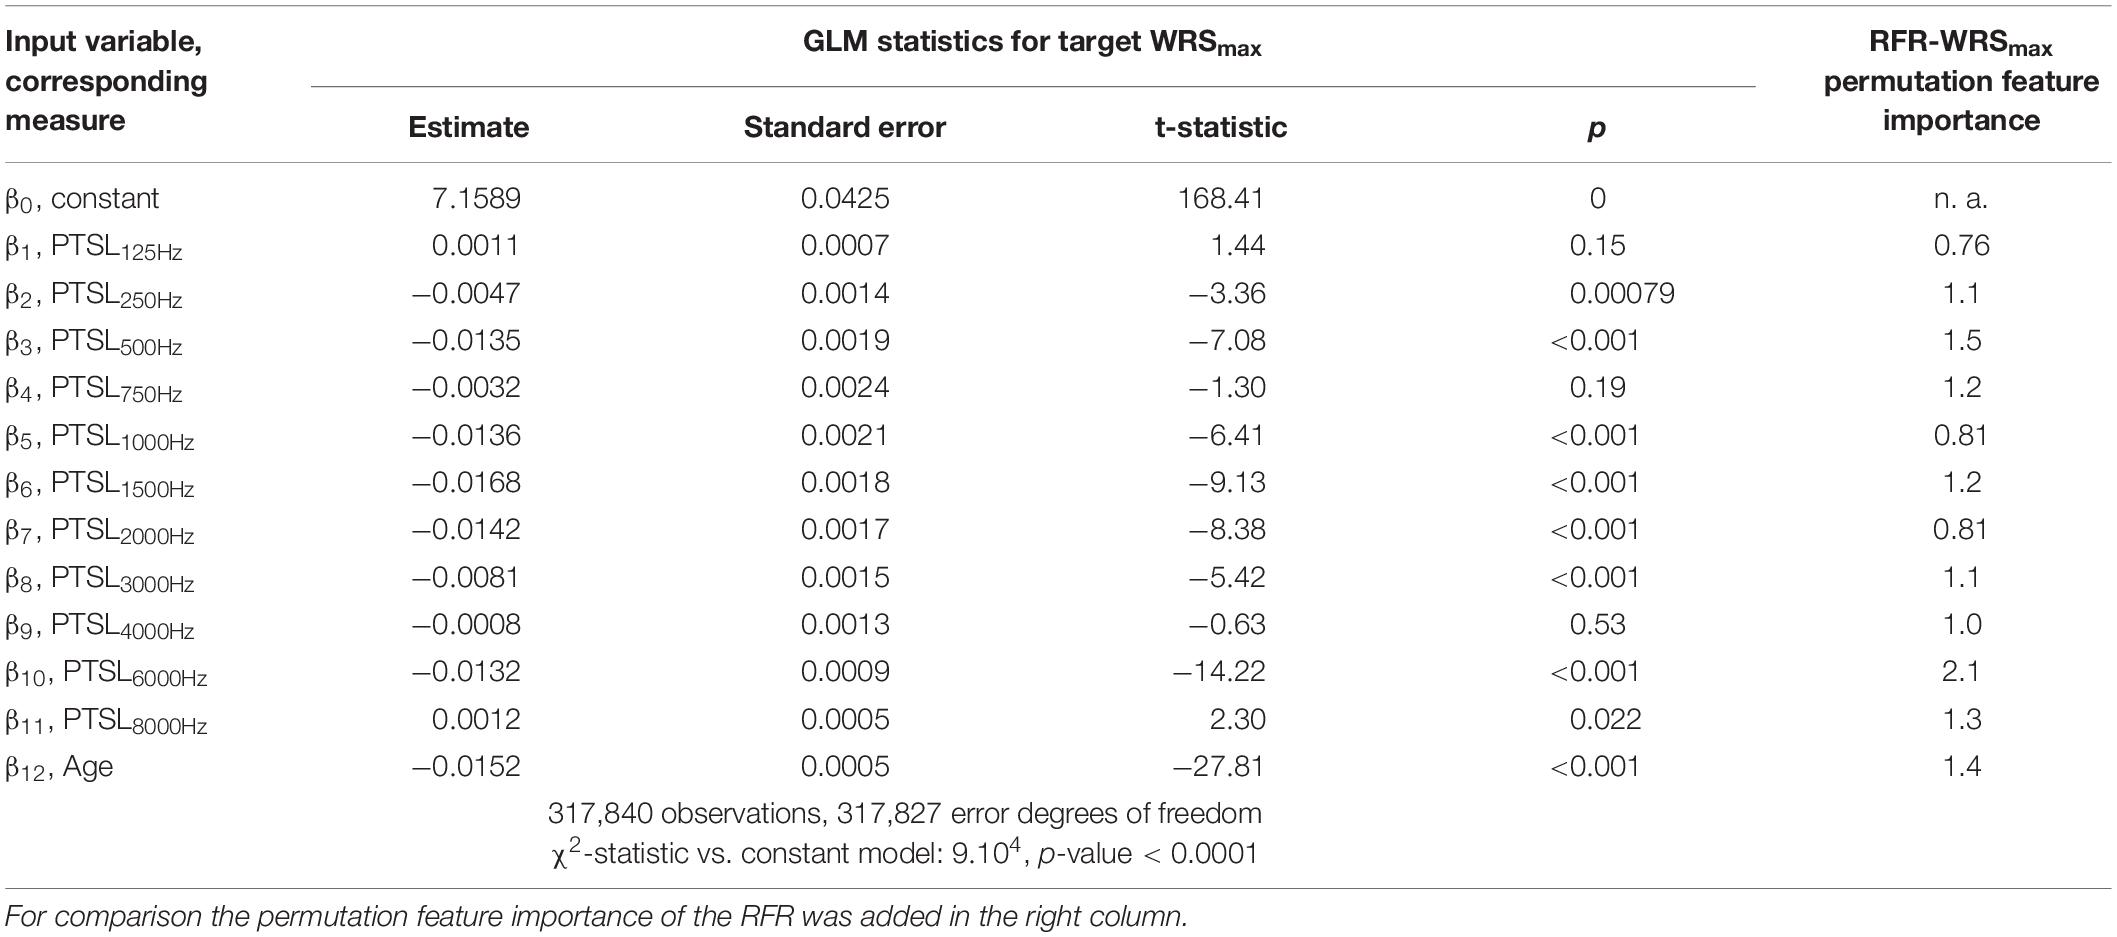
Table 2. GLM parameters for target variable WRSmax.
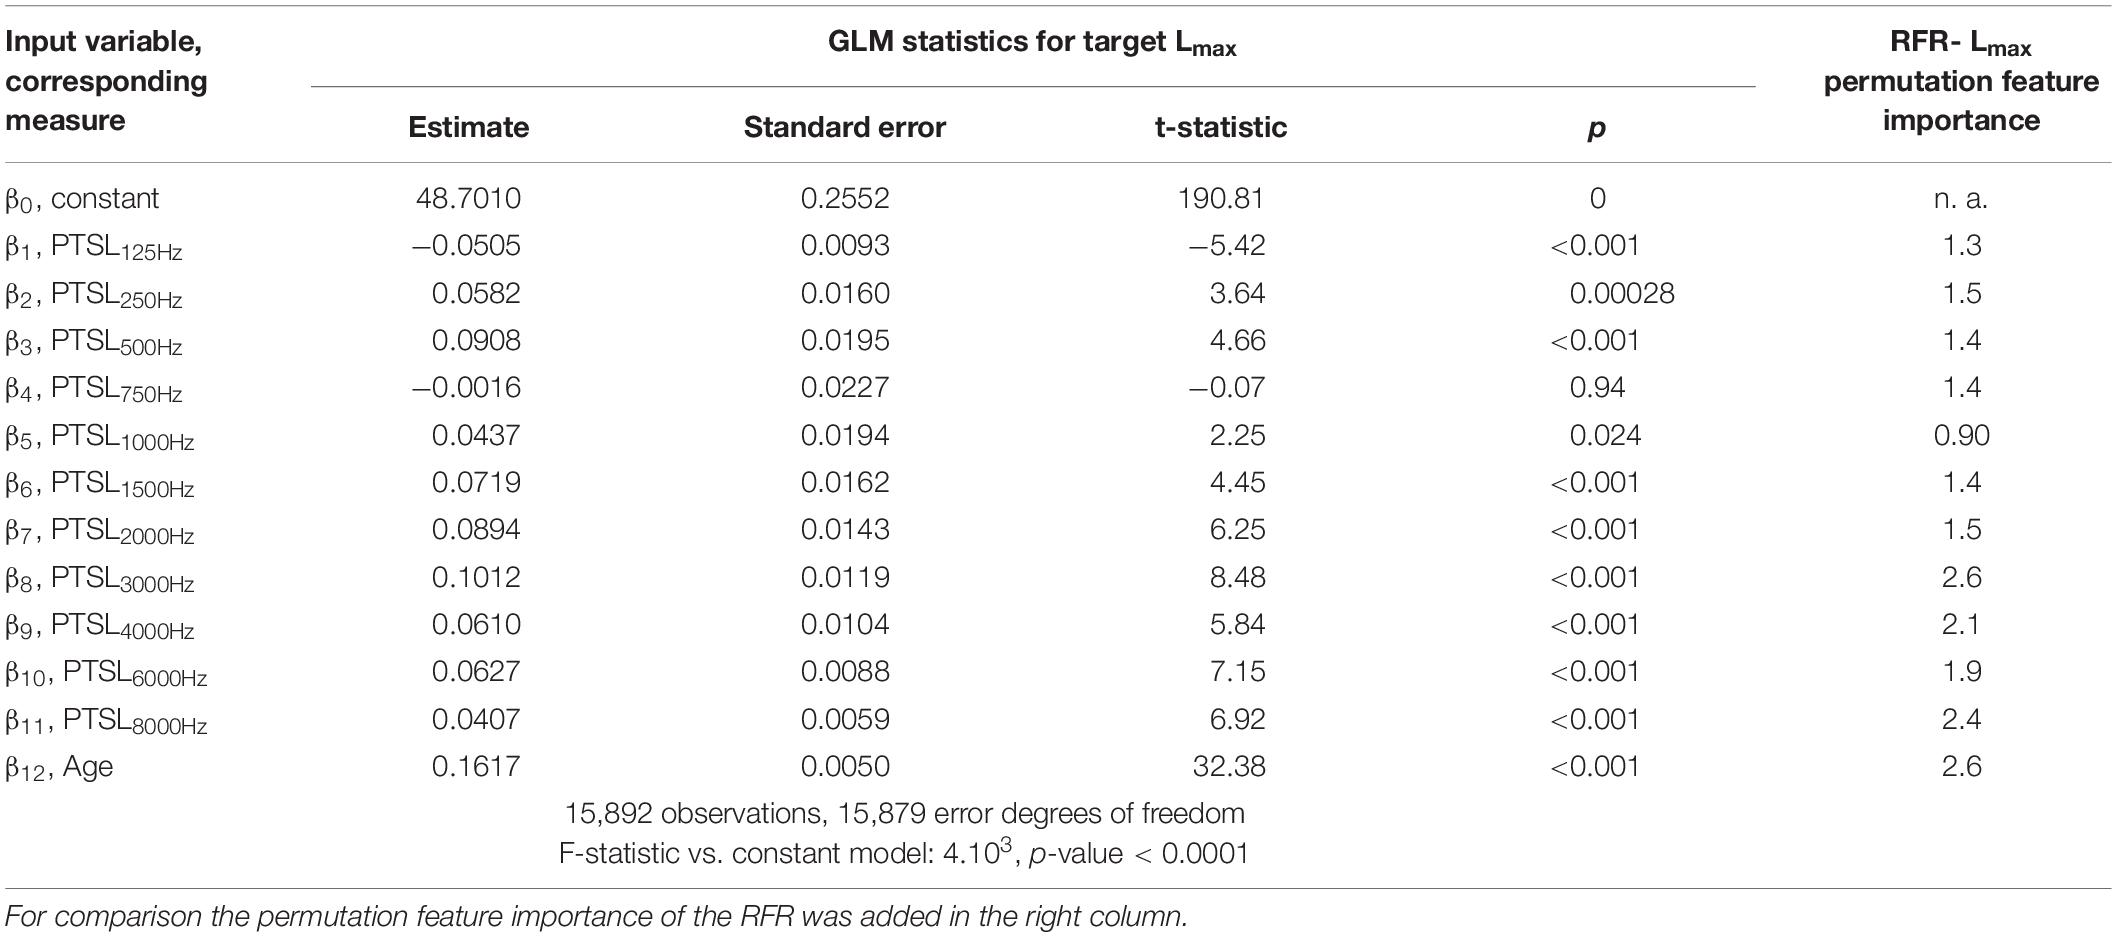
Table 3. GLM parameters for target variable Lmax.
Table 4 summarises the performance of the model as assessed by MAE for both the training and the test group by means of fivefold cross-validation. The results are given separately for the GLM and the RFR model. Owing to the composition of our study population the WHO0 is by far the largest group. The MAE of this group would have dominated the overall summary. For this reason, Table 4 shows the error estimation for each grade of hearing loss separately. Evidently, there was a great variation of the MAE among the WHO groups. With the RFR the largest errors were observed in WHO2 for the WRS65 group and in WHO3 and WHO4 for WRSmax. For those WHO groups the MAE of the training and test groups differed by a factor of 1.5 to 1.7. Unlike the RFR, the GLM yielded comparable MAE for the training and test groups.
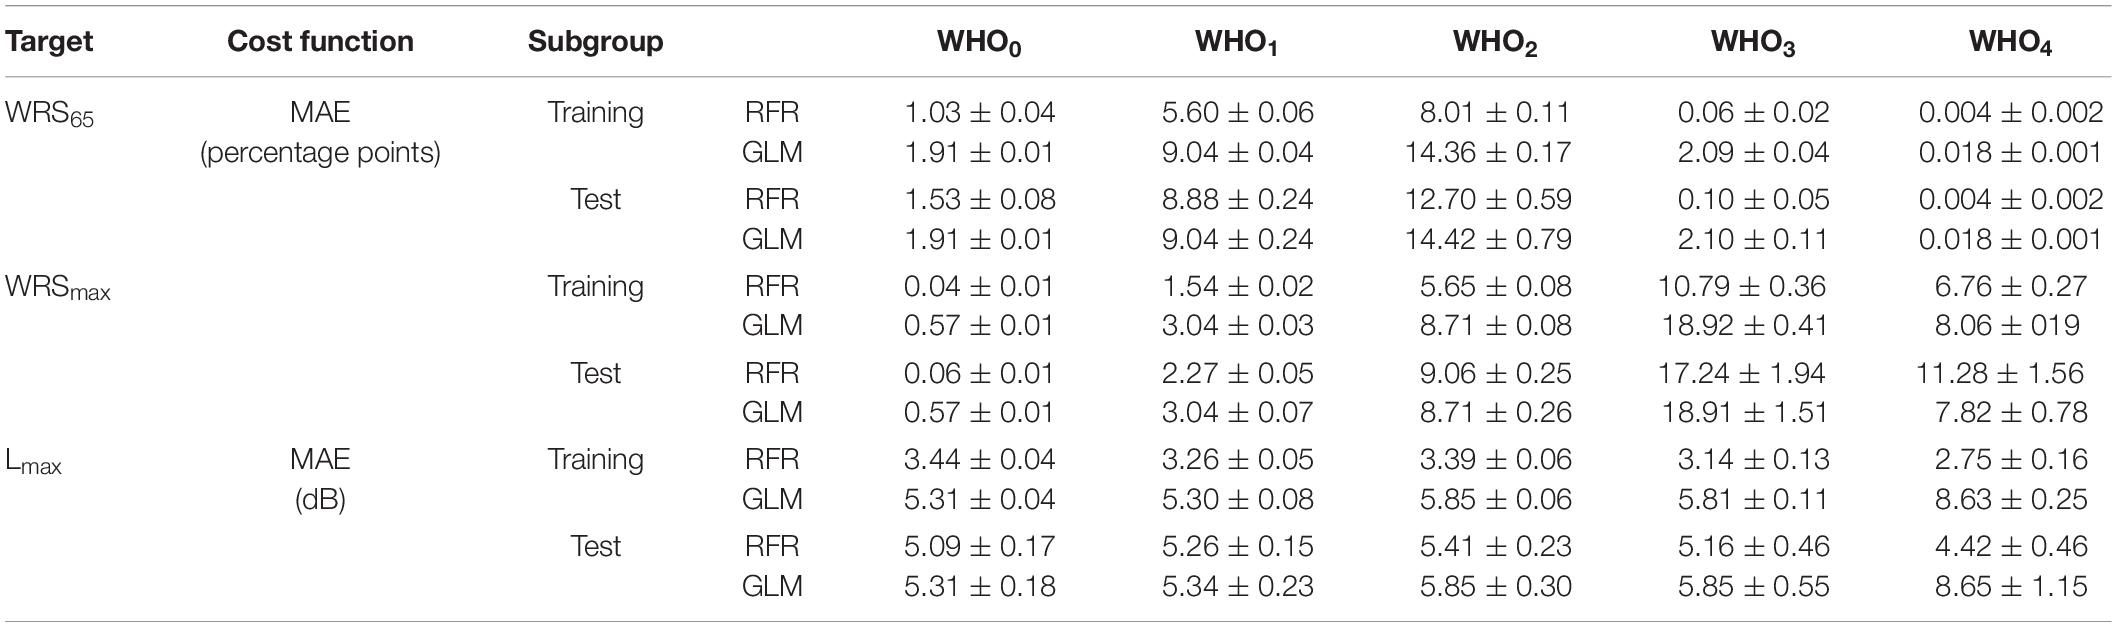
Table 4. Median absolute error and its standard error of the RFR and GLM model for the monosyllabic score at a presentation level of 65 dBSPL (WRS65), the maximum word recognition score (WRSmax) and the presentation level for the maximum word recognition score, Lmax.
Application of the Model
One possible application of the model is shown in Figure 4. The model input was one of the standard audiograms (N1–N7, S1–S3) and the subjects’ age was varied between 18 and 99 years. Owing to the relation between age and hearing thresholds hardly any subjects were in our population aged > 85 years for N1 and S1. Therefore, this range was excluded from model calculations.
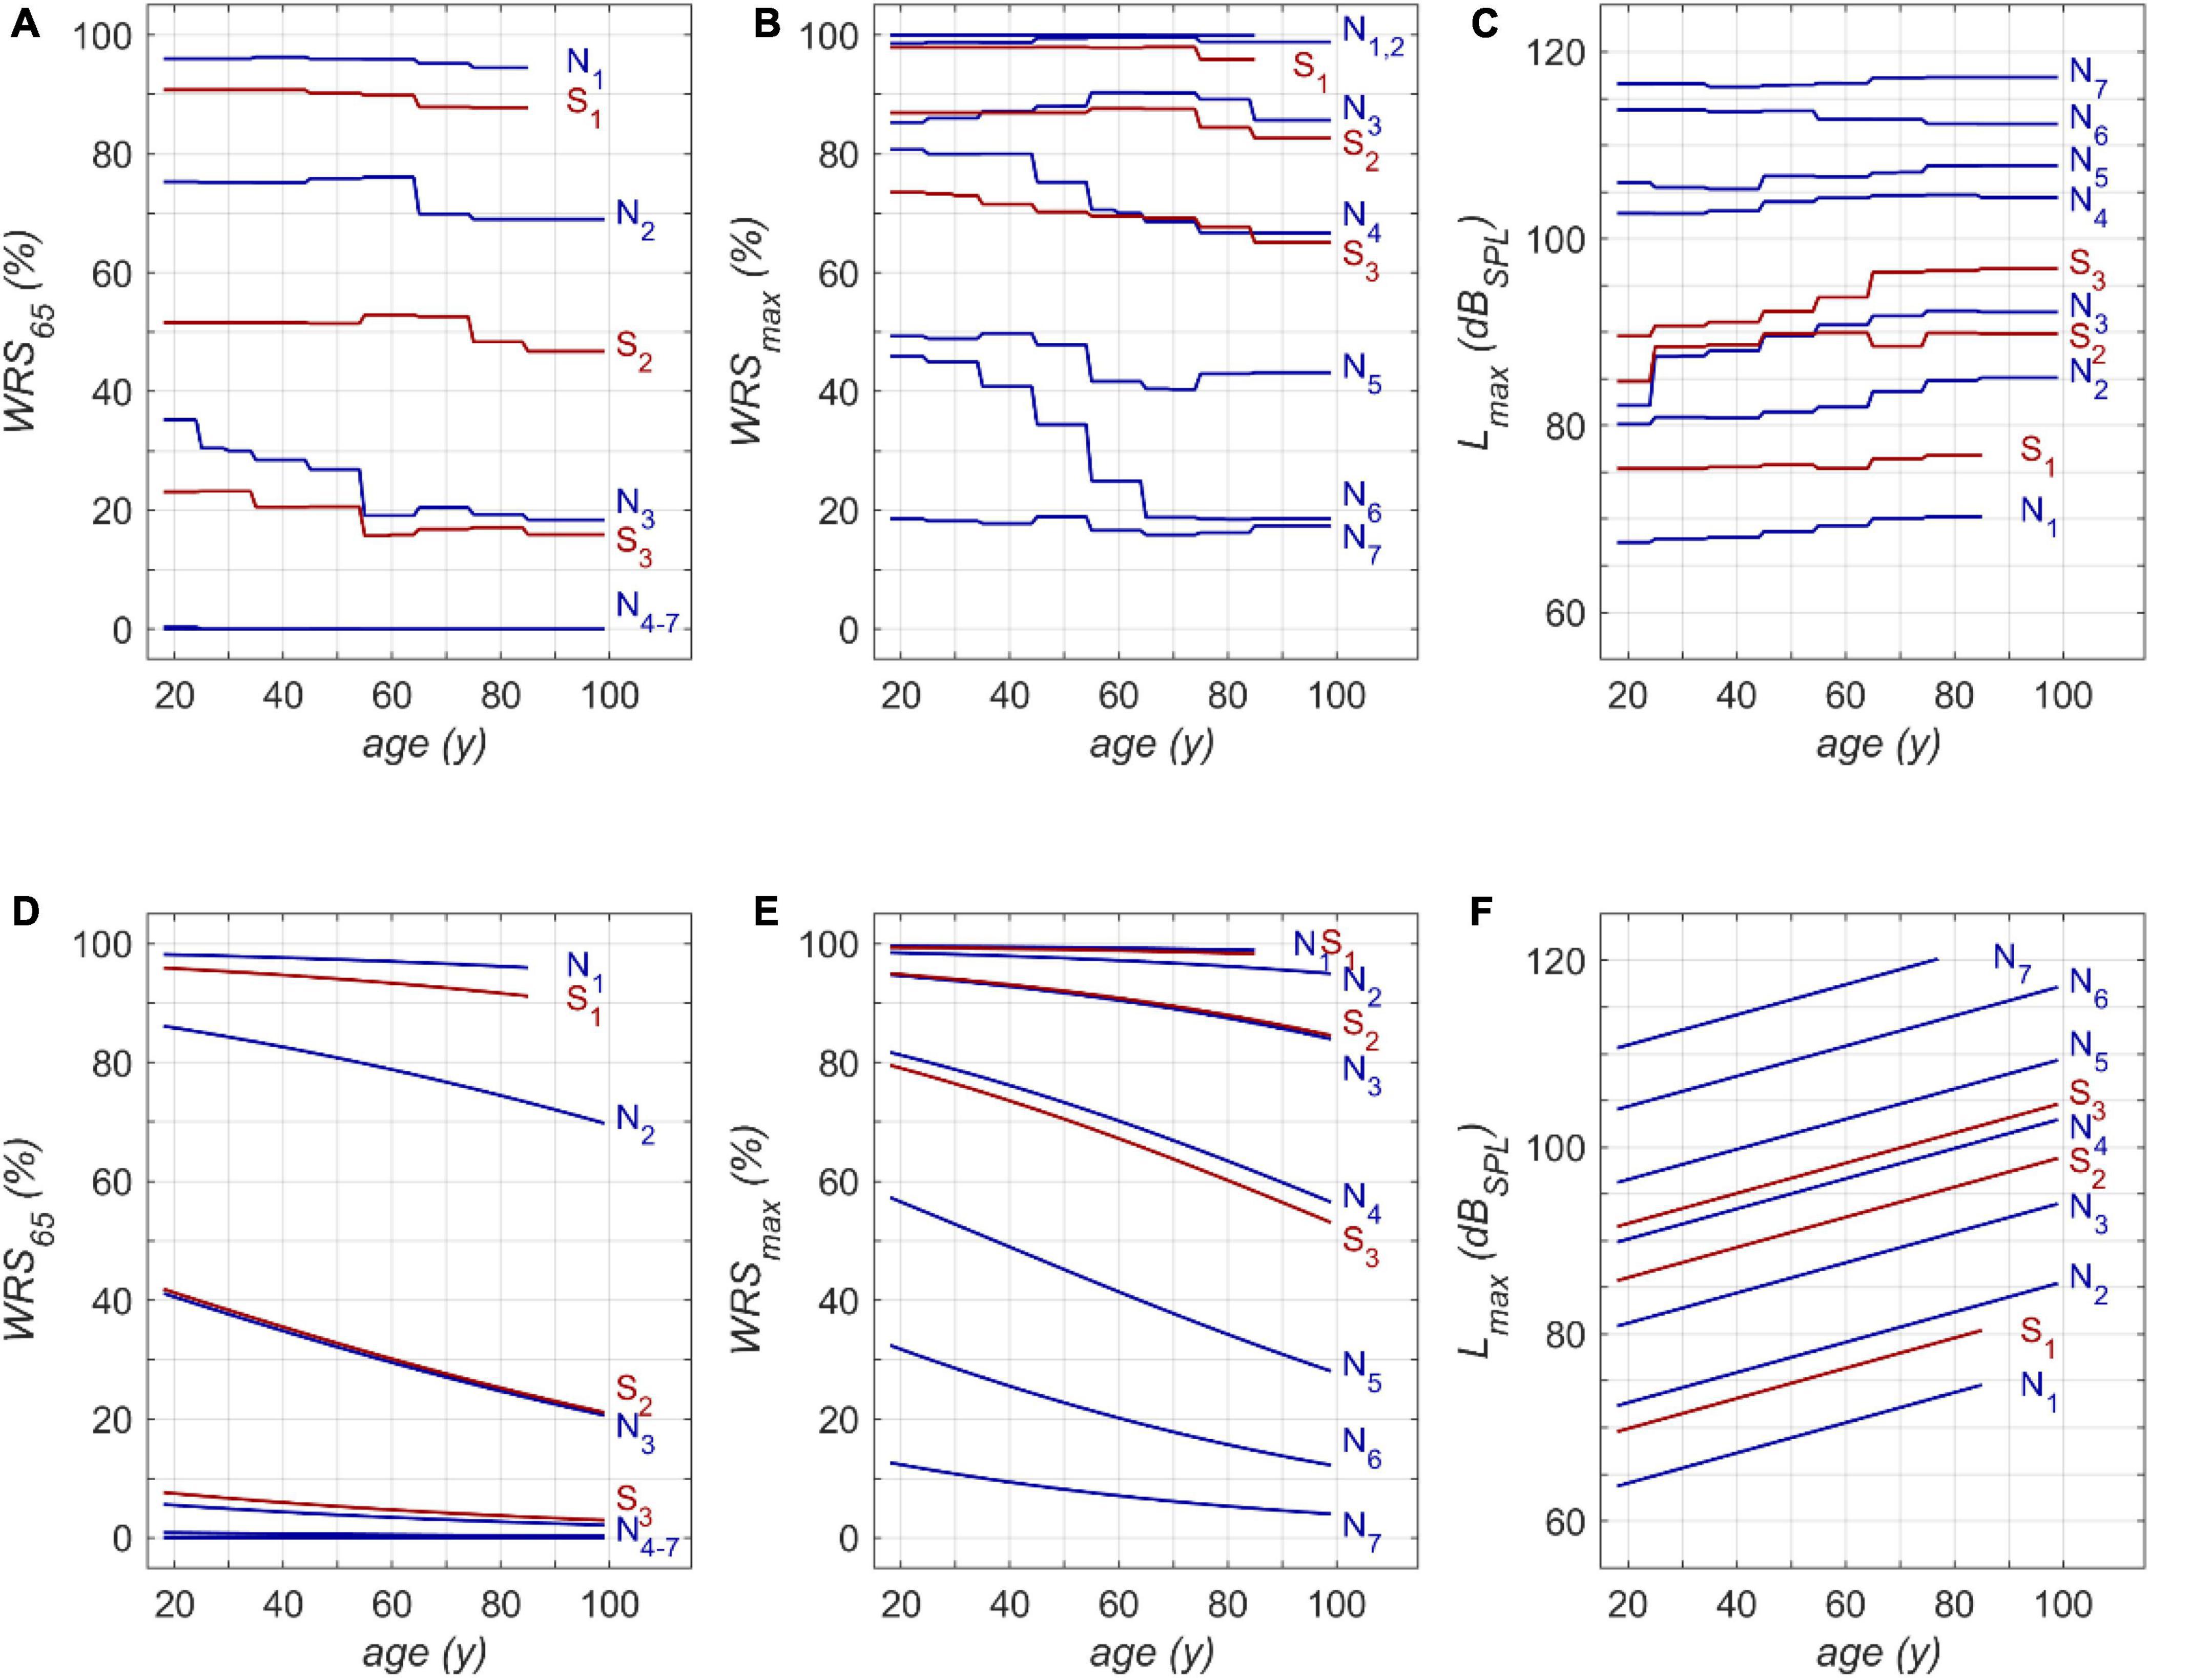
Figure 4. Model results for RFR (A–C) and GLM (D–F): (A) age dependence of monosyllabic score at 65 dBSPL presentation level (WRS65), (B) maximum word recognition score (WRSmax) and (C) applied presentation level (Lmax). N1 to N7 and S1 to S3 refer to the Bisgaard types of audiograms. The second row (D–F) shows the results of the GLM equivalent to the upper row (A–C). WRS65 and WRSmax were calculated according to equation 1 (D,E). Lmax was calculated according to equation 2 (F).
Figures 4A,D show that both models indicate a decrease in WRS65 with increasing age of up to 20 percentage points across the whole life span. The GLM suggests a rather constant decline of speech recognition over life span. The RFR on the other hand yields specific periods with different amounts of age-dependent decline. The largest decrease was observed for N3 in the fifth life decade with 10 percentage points per decade.
The RFR results become even more complex if the WRSmax and Lmax are considered, as shown in Figures 4B,C, respectively. The presentation level shows, for all types except N6, an increased presentation level for WRSmax with increasing age. A considerable decrease in score can be observed in N6, accompanied by a slight but significant decrease of Lmax. For the N4 and S3 types the RFR model gives a significant decrease in WRSmax which is somehow weakened by an increased presentation Lmax for this type. For all other types the WRSmax does not change with age. However, for these types the RFR model results in an increased presentation level. In comparison, the GLM output indicates a decline for WRSmax over age while Lmax increases for all audiogram types. For both models a decrease of up to 25 percentage points across the whole life span was observed.
Discussion
The analysis of a large clinical database allows the description of the age-related decline of speech perception in detail. In comparison with previous studies, more detailed information about the time course and amount of degradation was achieved by means of RFR. Both models, the GLM and the RFR, describe an age-related decline in speech recognition after being corrected for PTSL. The GLM is based on predefined hypotheses and confirms significant age effects. Inevitably, the relationship between age and speech scores follows the underlying functional relations. The GLM results in an age-related decline for WRSmax of about 3–4% per decade for N4-N6, and S3. For all other audiogram types smaller effects were found owing to saturation effects. This is in concordance with previous studies (Jerger, 1973; Dubno et al., 2008). WRS65 decreases at a rate of up to 2.5% per decade for mild hearing losses, i.e., N2/3 and S2. For the other audiogram types the GLM yielded smaller rates of decline. Owing to the lower presentation level of 65 dBSPL floor effects were observed even for moderate hearing losses, i.e., N4–7. The RFR model yielded more specific information about the time course and rate of decline. Additionally, the RFR model allows the quantitative description of the two basic effects of hearing loss and its relation to age: On the one hand the impact of the attenuation component of ARHL, and on the other hand the impact of the distortion component of ARHL. This could be achieved by keeping constant the model input variables representing PTSL (attenuation), and by modifying the model input variable representing age. It therefore offers the opportunity to overcome a bias that was immanent in previous investigations (Jerger, 1973; Marshall and Bacon, 1981; Dubno et al., 1997; Hoppe et al., 2014; Müller et al., 2016) by isolating age-related hearing threshold elevation from age-related decline in speech recognition as such.
This study should not be misunderstood as an attempt to predict speech recognition scores on the basis of PTSL. These scores have to be measured individually. The large variability of individual scores necessitates speech audiometry. The purpose of the model in this study was to analyse the impact of age for larger patient populations with respect to specific audiogram types. It can be seen in Figure 4 that those age-related changes are present for the entire duration of adulthood. However, apart from the fact that higher age relates to lower speech recognition scores, no common quantitative trend, for any age groups or PTSL, can be discerned. This may be regarded as the major outcome of the RFR model calculations. The measurable age-related decline in speech recognition depends on the age range considered, the specific audiogram, and the specific application of speech audiometry. Owing to saturation effects of the WRS65 measured at typical conversation level, we observed the largest age effect for moderate hearing losses (N3-type audiograms). For the WRSmax measured at substantially higher levels, the largest effects were observed for audiogram types corresponding to severe hearing losses (N4, N5, N6). This result of the RFR is in agreement with findings of Jerger (1973). Even though the variability in his data is considerable (as in our data) one may conclude that a stronger age-related decline can be observed for later life decades and greater hearing loss. Additionally, Jerger’s data also indicated that the onset of age-related decline may occur already at younger age. This is in line with our results where the RFR model e.g., yielded for N6 the strongest decline for WRSmax of 20% per decade around the fifth and sixth life decade.
According to the RFR, the decrease in the WRSmax was counterbalanced by an increased presentation level for all audiogram types except N6. The N6 -type audiogram showed the largest age-related decline in speech recognition. The decreased tolerance of higher presentation levels may have contributed to this decline. This might reflect certain underlying pathomechanisms that are more likely to be present in patients with this audiogram type compared with others. Complementary to attenuation and distortion, a causal and more differentiated breakdown with respect to presbyacusis was proposed early on. Finally, five main types were proposed, namely sensory, neural, metabolic, mechanical, and vascular presbyacusis (Schuknecht, 1964; Johnsson and Hawkins, 1972). This was complemented by the term central presbyacusis in order to reserve the term neural for degeneration of the cochlear nerve. Sensory presbyacusis is congruent with the attenuation component and is, as pointed out above, represented by the audiogram type as a fixed parameter in Figure 4. The effects of all the other types of presbyacusis are included in the specific relationships between age and WRSs, respectively, Lmax. Moreover, the specific and different root causes may potentially explain why, for some degrees of hearing loss, different changes in speech perception occur in different life decades. However, possible interactions between—or even independent mechanisms—of the main types of presbyacusis are still not completely understood (Bao and Ohlemiller, 2010; Profant et al., 2019).
It is not possible to confirm all these explanatory hypotheses by retrospective data analyses, a fact that clearly underlines the limits of our study design. We found differences in age effects in comparison with some of the studies referred to above. This is partly due to the neglect of hearing loss at higher frequencies for the elderly in those studies. On the other hand, for some hearing losses and audiogram types, this study may underestimate age effects, as ceiling effects of speech tests in quiet are included. Another aspect of this study is the inclusion of a considerable number of subjects with mild hearing loss, as seen in group S1. Even in that group, age effects play a part. Especially the WRS65 illustrates how everyday communicative ability in quiet might be already affected by mild to moderate hearing loss in a population in which the use of hearing aids does not reach the penetration level needed (Halpin and Rauch, 2012).
Other possible applications of the RFR model are related to acoustic amplification with hearing aids: As shown in Figure 4, in all groups except N6, the level for best speech recognition (Lmax) increases with age at about 0.5 dB per decade. This may indicate that older people may benefit from larger sound pressure levels for speech recognition, i.e., greater amplification, when provided with a hearing aid. As far as we know, current amplification strategies do not take this into account. On the other hand, one has to consider that in some pathologies more amplification might be detrimental rather than beneficial (Halpin and Rauch, 2012).
The age dependence of the WRSmax found in our study may be used to improve studies evaluating the outcome of hearing aid use: The WRSmax or an equivalent measure is often used as reference for the measurement of successful hearing aid provision or other acoustic amplification (Halpin and Rauch, 2012; Hoppe et al., 2014; Müller A. et al., 2017; Maier et al., 2018a,b), for investigation of age-related changes in cognition (Kronlachner et al., 2018), and for speech-perception-related studies in general (Müller J. et al., 2017). A consideration of both age and specific audiogram type could potentially decrease the variability of results. Furthermore, the functional relation between audiogram types and speech perception as presented here can be used to link epidemiological studies on hearing loss (Sohn and Jörgenshaus, 2001; von Gablenz et al., 2017, 2020; Chang et al., 2019; Löhler et al., 2019; Cantuaria et al., 2021) with speech recognition.
Comparison of the Two Model Approaches
The need for pre-defined hypotheses may be considered a weakness of the GLM, as all model results inevitably follow the underlying analytical equations. If an effect for certain audiogram types is found, the GLM yields a smooth decline over all life decades. The RFR is able to take varying rates of decline in different life decades into account if variation indeed takes place in the study population. Overall, as shown in Table 4, for most of the WHO groups the RFR yielded smaller MAE for the test groups compared with the MAE yielded by the GLM. However, the differences obtained between MAE in the training and test groups by RFR indicate some degree of overfitting. This was not the case for the GLM.
The impact of audiometric test frequencies on the calculated WRS is different for the two model approaches. The GLM is less suitable to reflect the impact of low and high frequency hearing loss for all WHO groups. In cases with mild hearing loss higher frequencies have a greater impact: Typically, the low frequencies show low variability and fail to explain the variability in the scores. Vice versa, for cases with severe hearing loss the PTSL for high frequencies are already near or at the audiometer limits. Consequently, the GLM explains the variability in the scores by utilising PTSL in the low–frequency range. As a result for all WHO groups, the GLM suggests that there is no effect of the highest and lowest test frequencies (Tables 1, 2). Some other findings, such as the absence of an effect at 750 Hz on the WRSmax in Table 2, can be considered as typical signs of an overdetermined system. The measurement at 750 Hz does not provide any additional information compared with the adjacent frequencies and vice versa. A priori, there is no audiological rationale for removing single test frequencies.
Limitations of the Study
An important limitation of this study is the restriction to a specific language and test. However, with respect to other languages and speech material the comparison of recent studies (Holden et al., 2013; Hoppe et al., 2019) suggests that the test we used is comparable to the English Consonant-Vowel-Nucleus-Consonant (CNC) test (Causey et al., 1984).
Secondly, the outdated but established calibration procedure for the Freiburg monosyllable test at 65 dBSPL (Holube et al., 2019) is roughly comparable to a level of 60 dBA. Consequently, Lmax should be corrected by about 5 dB for a comparison e.g., with CNC results.
The disadvantage of binary decision trees is the high chance of overfitting. The use of a random-forest method decreases this risk. However, a factor of up to 1.7 between the MAEs in the test group as compared with the training group still indicates some degree of overfitting. Even the considerable size of the study population and the clustering of input variables do not entirely prevent this risk. Additionally, there are some intrinsic sources of unexplained variability. Even after thorough data–cleaning as described above, the population may still have included mild cases of aggravation, simulation or dissimulation. There was also a small number of cases with retrocochlear lesions. This number can be estimated as less than 0.5% in our population by comparison with our patient files and the reported incidence (Lin et al., 2005). The unilateral processing of the data without the contralateral status as additional input variable is a potential shortcoming and should be therefore subject to future studies as well.
An RFR model inevitably reflects the characteristics of the clinical population that contributed to the training. The group characteristics differ from those of their peers outside a clinic. Finally, the model reflects the statistical characteristics of a population, and not causal relationships.
Conclusion
A random-forest regression model allowed the estimation of age-related decline of speech recognition in quiet, completely separated from the effect of pure-tone sensitivity loss. Noticeable declines were found across the whole duration of adulthood and for all audiogram types. Model calculations resulted in a decrease of up to 25 percentage points word recognition scores across the whole life span. Depending on the specific hearing loss, the RFR model indicated a maximum decline of up to 10 percentage points in certain life decades. The decline can be attributed to an increased distortion component related to presbyacusis which is not represented by pure-tone audiometry. The careful derivation of working hypotheses from our data has the potential to provide greater insight into the relationships between pure-tone sensitivity loss, specific audiogram types and age.
Data Availability Statement
The raw data supporting the conclusions of this article will be made available by the authors, without undue reservation.
Ethics Statement
The studies involving human participants were reviewed and approved by Ethik-Kommission, Friedrich-Alexander-Universität Erlangen-Nürnberg (FAU). The patients/participants provided their written informed consent to participate in this study.
Author Contributions
UH: conceptualization. UH and TH: formal analysis, writing original draft, methodology, software, validation, and visualization. UH and HI: investigation, project administration, and resources. UH, TH, and HI: writing – review and editing. All authors contributed to the article and approved the submitted version.
Conflict of Interest
TH was employed by Cochlear Deutschland GmbH & Co. KG.
The remaining authors declare that the research was conducted in the absence of any commercial or financial relationships that could be construed as a potential conflict of interest.
Publisher’s Note
All claims expressed in this article are solely those of the authors and do not necessarily represent those of their affiliated organizations, or those of the publisher, the editors and the reviewers. Any product that may be evaluated in this article, or claim that may be made by its manufacturer, is not guaranteed or endorsed by the publisher.
References
Bao, J., and Ohlemiller, K. K. (2010). Age-related loss of spiral ganglion neurons. Hear. Res. 264, 93–97.
Bergman, M., Blumenfeld Cascardo, D., Dash, B., Levitt, H., and Margulies, M. K. (1976). Age-Related decrement in hearing for speech sampling and longitudinal studies. J. Gerontol. 31, 533–538. doi: 10.1093/geronj/31.5.533
Bisgaard, N., Vlaming, M. S., and Dahlquist, M. (2010). Standard audiograms for the IEC 60118-15 measurement procedure. Trends Amplif. 14, 113–120. doi: 10.1177/1084713810379609
Cantuaria, M. L., Pedersen, E. R., Waldorff, F. B., Sørensen, M., and Schmidt, J. H. (2021). Hearing examinations in Southern Denmark (HESD) database: a valuable tool for hearing-related epidemiological research. Int. J. Audiol. 60, 300–311. doi: 10.1080/14992027.2020.1831702
Carhart, R. (1951). Basic principles of speech audiometry. Acta Otolaryngol. 40, 62–71. doi: 10.3109/00016485109138908
Causey, G. D., Hood, L. J., Hermanson, C. L., and Bowling, L. S. (1984). The Maryland CNC Test: normative studies. Audiology 23, 552–568. doi: 10.3109/00206098409081538
Chang, Y. S., Yoon, S. H., Kim, J. R., Baek, S. Y., Cho, Y. S., Hong, S. H., et al. (2019). Standard audiograms for koreans derived through hierarchical clustering using data from the korean national health and nutrition examination survey 2009-2012. Sci. Rep. 9:3675. doi: 10.1038/s41598-019-40300-7
Davis, A., Smith, P., Ferguson, M., Stephens, D., and Gianopoulos, I. (2007). Acceptability, benefit and costs of early screening for hearing disability: a study of potential screening tests and models. Health Technol. Assess. 11, 1–294. doi: 10.3310/hta11420
Divenyi, P. L., and Haupt, K. M. (1997). Audiological correlates of speech understanding deficits inelderly listeners with mild-to-moderate hearing loss. III Factor Representation. Ear Hear. 18, 189–201. doi: 10.1097/00003446-199706000-00002
Dubno, J. R., Lee, F. S., Matthews, L. J., Ahlstrom, J. B., Horwitz, A. R., and Mills, J. H. (2008). Longitudinal changes in speech recognition in older persons. J. Acoust. Soc. Am. 123, 462–475. doi: 10.1121/1.2817362
Dubno, J. R., Lee, F. S., Matthews, L. J., and Mills, J. H. (1997). Age-Related and gender-related changes in monaural speech recognition. J. Speech Lang. Hear. Res. 40, 444–452. doi: 10.1044/jslhr.4002.444
Hahlbrock, K. H. (1957). Sprachaudiometrie – Grundlagen und Praktische Anwendung einer Sprachaudiometrie für das Deutsche Sprachgebiet. Stuttagrt: Thieme.
Halpin, C., and Rauch, S. R. (2012). Improvement in word recognition score with level is associated with hearing aid ownership among patients with hearing loss. Audiol. Neurotol. 17, 139–147. doi: 10.1159/000333777
Holden, L. K., Finley, C. C., Firszt, J. B., Holden, T. A., Brenner, C., Potts, L. G., et al. (2013). Factors affecting open-set word recognition in adults with cochlear implants. Ear Hear. 34, 342–360. doi: 10.1097/AUD.0b013e3182741aa7
Holube, I., Steffens, T., and Winkler, A. (2019). Calibration of the Freiburg monosyllabic speech test. HNO 67, 304–305. doi: 10.1007/s00106-019-0636-4
Hoppe, U., Hast, A., and Hocke, T. (2014). Sprachverstehen mit Hörgeräten in Abhängigkeit vom Tongehör. HNO 62, 443–448.
Hoppe, U., Hocke, T., Hast, A., and Iro, H. (2019). Maximum preimplantation monosyllabic score as predictor of cochlear implant outcome. HNO 67, 62–68. doi: 10.1007/s00106-019-0648-0
Humes, L. E. (2007). The Contributions of audibility and cognitive factors to the benefit provided by amplified speech to older adults. J. Am. Acad. Audiol. 18, 590–603. doi: 10.3766/jaaa.18.7.6
Humes, L. E., and Young, L. A. (2016). Sensory-Cognitive interactions in older adults. Ear Hear. 37, 52s–61s. doi: 10.1097/AUD.0000000000000303
ISO 7029:2017 (2017). Acoustics -Statistical Distribution of Hearing Thresholds Related to Age and Gender.
Johnsson, L. G., and Hawkins, J. E. Jr. (1972). Sensory and neural degeneration with aging, as seen in microdissections of the human inner ear. Ann. Otolrhinolaryngol. 81, 179–193. doi: 10.1177/000348947208100203
Kronlachner, M., Baumann, U., Stover, T., and Weissgerber, T. (2018). Investigation of the quality of hearing aid provision in seniors considering cognitive functions. Laryngorhinootologie 97, 852–859. doi: 10.1055/a-0671-2295
Lin, D., Hegarty, J. L., Fischbein, N. J., and Jackler, R. K. (2005). The prevalence of “incidental” acoustic neuroma. Arch. Otolaryngol. Head Neck Surg. 131, 241–244.
Löhler, J., Walther, L. E., Hansen, F., Kapp, P., Meerpohl, J., Wollenberg, B., et al. (2019). The prevalence of hearing loss and use of hearing aids among adults in Germany: a systematic review. Eur. Arch. Otorhinolaryngol. 276, 945–956. doi: 10.1007/s00405-019-05312-z
Maier, H., Lenarz, T., Dollezal, L. V., and Busch, S. (2018a). Direct acoustic cochlear implants lead to an improved speech perception gap compared to conventional hearing aid. Otol. Neurotol. 39, 1147–1152. doi: 10.1097/MAO.0000000000001954
Maier, H., Baumann, U., Baumgartner, W. D., Beutner, D., Caversaccio, M. D., Keintzel, T., et al. (2018b). Minimal reporting standards for active middle ear hearing implants. Audiol. Neurootol. 23, 105–115. doi: 10.1159/000490878
Marshall, L., and Bacon, S. P. (1981). Prediction of speech discrimination scores from audiometric data. Ear Hear. 2, 148–155. doi: 10.1097/00003446-198107000-00003
Müller, A., Hocke, T., Hoppe, U., and Mir-Salim, P. (2016). The age effect in evaluation of hearing aid benefits by speech audiometry. HNO 64, 143–148. doi: 10.1007/s00106-015-0115-5
Müller, A., Mir-Salim, P., Zellhuber, N., Helbig, R., Bloching, M., Schmidt, T., et al. (2017). Influence of floating-mass transducer coupling efficiency for active middle-ear implants on speech recognition. Otol. Neurotol. 38, 809–814. doi: 10.1097/MAO.0000000000001412
Müller, J., Plontke, S. K., and Rahne, T. (2017). Speech audiometric outcome parameters in clinical trials on hearing improvement. HNO 65, 211–218. doi: 10.1007/s00106-016-0298-4
Olusanya, B. O., Davis, A. C., and Hoffman, H. J. (2019). Hearing loss grades and the International classification of functioning, disability and health. Bull World Health Organ. 97, 725–728. doi: 10.2471/BLT.19.230367
Pedersen, K. E., Rosenhall, U., and Moioerb, M. B. (1991). Longitudinal study of changes in speech perception between 70 and 81 years of age. Audiology 30, 201–211. doi: 10.3109/00206099109072886
Plomp, R. (1978). Auditory handicap of hearing impairment and the limited benefit of hearing aids. J. Acoust. Soc. Am. 63, 533–549. doi: 10.1121/1.381753
Profant, O., Jilek, M., Bures, Z., Vencovsky, V., Kucharova, D., Svobodova, V., et al. (2019). Functional age-related changes within the human auditory system studied by audiometric examination. Front. Aging Neurosci. 11:26. doi: 10.3389/fnagi.2019.00026
Pronk, M., Deeg, D. J. H., Smits, C., van Tilburg, T. G., Kuik, D. J., Festen, J. M., et al. (2011). Prospective effects of hearing status on loneliness and depression in older persons: identification of subgroups. Int. J. Audiol. 50, 887–896. doi: 10.3109/14992027.2011.599871
Schuknecht, H. F. (1964). Further observations on the pathology of presbycusis. Arch. Otolaryngol. 80, 369–382.
Shukla, A., Harper, M., Pedersen, M., Goman, A., Suen, J. J., Price, C., et al. (2020). Hearing Loss, loneliness, and social isolation: a systematic review. Otolaryngol. Head Neck Surg. 5, 622–633. doi: 10.1177/0194599820910377
Sohn, W., and Jörgenshaus, W. (2001). Schwerhörigkeit in deutschland. repräsentative hörscreening-untersuchung bei 2000 Probanden in 11 Allgemeinpraxen. Z. Allg. Med. 77, 143–147.
Technical Committee ISO/TC 43 Acoustics (2017). ISO 7029:2017 Acoustics - Statistical Distribution of Hearing Thresholds Related to Age and Gender. Geneva: International Organization for Standardization.
Tu, Z., Ma, N., and Barker, J. (2021). Optimising hearing aid fittings for speech in noise with a differentiable hearing loss model. Interspeech 2021, 691–695. doi: 10.21437/interspeech.2021-1613
van Beurden, M., Boymans, M., van Geleuken, M., Oetting, D., Kollmeier, B., and Dreschler, W. A. (2021). Uni- and bilateral spectral loudness summation and binaural loudness summation with loudness matching and categorical loudness scaling. Int. J. Audiol. 60, 350–358. doi: 10.1080/14992027.2020.1832263
van Rooij, J. C., Plomp, R., and Orlebeke, J. F. (1989). Auditive and cognitive factors in speech perception by elderly listeners. I: development of test battery. J. Acoust. Soc. Am. 86, 1294–1309. doi: 10.1121/1.398744
von Gablenz, P., Hoffmann, E., and Holube, I. (2017). Prevalence of hearing loss in Northern and Southern Germany. HNO 65, 130–135.
von Gablenz, P., Hoffmann, E., and Holube, I. (2020). Gender-specific hearing loss in German adults aged 18 to 84 years compared to US-American and current European studies. PLoS One 15:e0231632. doi: 10.1371/journal.pone.0231632
WHO (2021). World Report on Hearing, Licence: CC BY-NC-SA 3.0 IGO. Geneva: World Health Organization.
Keywords: hearing loss, speech perception, age-related hearing loss (ARHL), random forest regression, machine learning, maximum word recognition, speech audiometry
Citation: Hoppe U, Hocke T and Iro H (2022) Age-Related Decline of Speech Perception. Front. Aging Neurosci. 14:891202. doi: 10.3389/fnagi.2022.891202
Received: 07 March 2022; Accepted: 17 May 2022;
Published: 22 June 2022.
Edited by:
Samira Anderson, University of Maryland, College Park, United StatesReviewed by:
Annie Moulin, University of Lyon, FranceMaria Boboshko, Pavlov First Saint Petersburg State Medical University, Russia
Copyright © 2022 Hoppe, Hocke and Iro. This is an open-access article distributed under the terms of the Creative Commons Attribution License (CC BY). The use, distribution or reproduction in other forums is permitted, provided the original author(s) and the copyright owner(s) are credited and that the original publication in this journal is cited, in accordance with accepted academic practice. No use, distribution or reproduction is permitted which does not comply with these terms.
*Correspondence: Ulrich Hoppe, dWxyaWNoLmhvcHBlQHVrLWVybGFuZ2VuLmRl