
95% of researchers rate our articles as excellent or good
Learn more about the work of our research integrity team to safeguard the quality of each article we publish.
Find out more
ORIGINAL RESEARCH article
Front. Aging Neurosci., 17 December 2021
Sec. Cellular and Molecular Mechanisms of Brain-aging
Volume 13 - 2021 | https://doi.org/10.3389/fnagi.2021.785727
This article is part of the Research TopicEnvironmental Clues to Brain DiseaseView all 6 articles
 Nawfel Mokrane1,2
 Yassin Snabi1,2
 Thierry Cens1
 Janique Guiramand1
 Pierre Charnet1Anaïs Bertaud1,2Claudine Menard1,2Matthieu Rousset1
 Marie-Céleste de Jesus Ferreira1,2
 Jean-Baptiste Thibaud1Catherine Cohen-Solal1,2
 Michel Vignes1,2*Julien Roussel1,2*
The regulation of the redox status involves the activation of intracellular pathways as Nrf2 which provides hormetic adaptations against oxidative stress in response to environmental stimuli. In the brain, Nrf2 activation upregulates the formation of glutathione (GSH) which is the primary antioxidant system mainly produced by astrocytes. Astrocytes have also been shown to be themselves the target of oxidative stress. However, how changes in the redox status itself could impact the intracellular Ca2+ homeostasis in astrocytes is not known, although this could be of great help to understand the neuronal damage caused by oxidative stress. Indeed, intracellular Ca2+ changes in astrocytes are crucial for their regulatory actions on neuronal networks. We have manipulated GSH concentration in astroglioma cells with selective inhibitors and activators of the enzymes involved in the GSH cycle and analyzed how this could modify Ca2+ homeostasis. IP3-mediated store-operated calcium entry (SOCE), obtained after store depletion elicited by Gq-linked purinergic P2Y receptors activation, are either sensitized or desensitized, following GSH depletion or increase, respectively. The desensitization may involve decreased expression of the proteins STIM2, Orai1, and Orai3 which support SOCE mechanism. The sensitization process revealed by exposing cells to oxidative stress likely involves the increase in the activity of Calcium Release-Activated Channels (CRAC) and/or in their membrane expression. In addition, we observe that GSH depletion drastically impacts P2Y receptor-mediated changes in membrane currents, as evidenced by large increases in Ca2+-dependent K+ currents. We conclude that changes in the redox status of astrocytes could dramatically modify Ca2+ responses to Gq-linked GPCR activation in both directions, by impacting store-dependent Ca2+-channels, and thus modify cellular excitability under purinergic stimulation.
Survival depends on the environment for the supply of oxygen, water and essential nutrients. Nevertheless, living organisms have to adapt continually their metabolic activity to environmental changes in order to keep themselves in homeostatic state. Indeed, environmental stresses such as caloric restriction, oxygen deprivation, exposure to pollutants, reactive oxygenated species (ROS) are sensed by various systems, so-called hormetic mechanisms, adapting cellular metabolic activity and oxygen consumption to specific conditions. These systems include the Nrf2 pathway which regulates redox homeostasis (Raefsky and Mattson, 2017) by promoting long-lasting cell protection against oxidative stress (Satoh et al., 2009; Robledinos-Antón et al., 2019) via the expression of enzymes involved in ROS scavenging. Some naturally occurring antioxidants as sulforaphane are potent inducers of this pathway (Murugaiyah and Mattson, 2015). More specifically, Nrf2 activation results in increased production of reduced glutathione (GSH) which is the prominent cellular antioxidant. GSH is a tripeptide resulting from the condensation of glutamate, cysteine and glycine (Lu, 2013). Its production is catalyzed by two enzymes, i.e., glutamate-cysteine ligase (GCL) and glutathione synthase (GS) which expressions are both upregulated by Nrf2 activation (Suzuki et al., 2013). Although hormetic mechanisms have been identified in the brain especially with regard to Nrf2 activation in astrocytes (Kraft et al., 2004), protective pathways are overwhelmed or inefficient in pathology and also during aging (Schmidlin et al., 2019; Yu and Xiao, 2021) to regulate oxidative stress. More specifically, the prominent role of Nrf2 pathway in oxidative stress handling throughout life is further emphasized by the fact that the inhibition of this pathway by progerin has been incriminated in the premature aging occurring during progeria disease (Kubben et al., 2016). The progressive reduction of Nrf2 activity during aging seems to involve not only changes in its availability but also from epigenetic regulations (Silva-Palacios et al., 2016). Indeed, the proteins involved in its turnover, including Keap 1, are also subjected to aging processes. In the CNS, deficits in GSH are associated with a wide array of pathologies including neurodegenerative diseases (Johnson et al., 2012; Gu et al., 2015; Singh et al., 2019) and neurodevelopmental ones (Bjørklund et al., 2020), as also observed in experimental models including rodent prenatal immune activation (Lanté et al., 2007). Decreased blood levels of GSH were evidenced in schizophrenic patients (Do et al., 2000; Lavoie et al., 2017). In this line, impeding GSH synthesis leads to the occurrence of behavioral and neurophysiological deficits in rodent models. Indeed, invalidating GCL gene results in increased oxidative stress and neuronal death, especially interneurons (Tosic et al., 2006; Kulak et al., 2013; Hardingham and Do, 2016).
In the brain, neuronal redox homeostasis is greatly dependent on astrocytic production of GSH (Dringen et al., 1999), as GSH or its metabolites can be shuttled to neurons by specific transporters. Indeed, the activity of the Nrf2 pathway is stronger in astrocytes than in neurons (Shih et al., 2003; Bolaños, 2016; Baxter and Hardingham, 2016). While astrocytes regulate neuronal ROS production under normal conditions, they can also produce ROS themselves when gaining a reactive phenotype under neuroinflammatory conditions (for review see Chen et al., 2020). In addition, reactive astrocytes seem to acquire specific intracellular Calcium regulation. For instance, Gq-linked metabotropic receptors responses are upregulated in reactive astrocytes as observed in neurodegenerative diseases models. This most likely impacts dramatically astrocytic functions such as gliotransmitter release and neuronal activity (Shigetomi et al., 2019).
These changes in astrocytic activity could be initiated by direct changes in redox balance. In this line, GSH depletion in glial cells, including astrocytes, leads to neuroinflammatory phenotype (Lee et al., 2010). Furthermore, a Ca2+-dependent glutamate release from microglial cells is observed upon hypoxia-mediated redox imbalance likely via the activation of IP3R which could participate in excitotoxic damages during brain insults (Socodato et al., 2018). Therefore, disrupted redox homeostasis in various glial cells could alter intracellular Ca2+ homeostasis and thus result in unregulated Ca2+-dependent release of factors as proinflammatory cytokines or glutamate endangering neuronal cell survival.
In the present work, we have thus evaluated the adaptations of Ca2+ homeostasis induced by changes in redox state. [GSH]i was directly manipulated using either blockers of its synthesis, such as buthionine sulfoximine (BSO), or GSH cycle activators, such as sulforaphane (SFN) that enhances the expression of GSH synthetizing enzymes through the Nrf2 pathway activation. Experiments were carried out C6 astroglioma cells, a cellular model which recapitulates astrocytes features (Galland et al., 2019) and which exhibits Nrf2 pathway activation (Assis et al., 2014).
We found here that in C6 cells GSH depletion exacerbates store-operated calcium entry (SOCE) mechanism triggered by IP3-mediated Ca2+ release. By contrast, increasing GSH results in decreased SOCE. These changes are associated with genomic changes as boosting GSH concentration elicits decreased expression of the proteins involved in SOCE, i.e., the ER protein STIM2 and the membrane proteins Orai1 and Orai3 which form Ca2+ release-activated channels (CRAC).
Rat C6 glioma cells were a gift from Dr. Nathalie Chevallier (INSERM U1198). They were maintained in DMEM supplemented by 10% fetal calf serum in the presence of 100 U/mL penicillin and 100 μg/mL streptomycin.
Changes in cellular content of GSH were measured after monobromobimane (mBBr) labeling as previously described (De Jesus Ferreira et al., 2005). For this, C6 rat glioma cells were seeded in 96-well culture plates. When reaching 80% of confluence, cells were treated with BSO (10 μM) or SFN (10 μM) for 24 h. The culture medium was then replaced by extracellular medium containing 50 μM mBrB. Extracellular medium comprised: 124 mM NaCl, 3.5 mM KCl, 25 mM NaHCO3, 1.25 mM NaH2PO4, 1 mM CaCl2, 2 mM MgSO4, 10 mM D-glucose, and 10 mM HEPES (pH: 7.4). Incubation with mBBr lasted for 30 min then cells were washed with extracellular medium to remove unbound mBBr. Fluorescence was then measured in cellulo with a plate reader (Tecan “Spark” 20M) at 527 nm after excitation at 380 nm. Background fluorescence was obtained from mBBr unlabeled cells. For data processing, background fluorescence was subtracted to all fluorimetric signals which were further normalized to mBBr fluorescence recorded in control cells. An experimental determination was performed eight times per experiment. Data are expressed as percentages of at least three distinct experiments performed on different cell cultures.
C6 rat glioma cells were seeded in 24-well culture plates. When reaching 80% of confluence cells were treated with either BSO (10 μM) or SFN (10 μM) or acivicin (100 μM) and returned to the incubator for 24 h. The oxidative stress was then induced by treating the cells with increasing concentrations of tert-butyl hydroperoxide (tBuOOH) for 24 h. When tested, the intracellular Ca2+ chelator 1,2-Bis(2-aminophenoxy)ethane-N,N,N′,N′-tetraacetic acid tetrakis(acetoxymethyl ester) (BAPTA-AM 1–10 μM) was added 1 h prior to the tBuOOH application. Cell viability was measured by assaying mitochondrial activity using MTT (3-[4,5-dimethylthiazol-2-yl]-2,5-diphenyl-tetrazolium bromide) transformation, as previously described (De Jesus Ferreira et al., 2005). Data are presented as percentages of MTT transformation normalized to basal obtained in cells without any treatment. They are means (±S.E.M.) of at least three individual determinations performed on different cell cultures; each determination being performed in triplicate per experiment.
Intracellular calcium concentration ([Ca2+]i) was measured using the fluorescent indicator fura-2. For this purpose, cells grown on glass coverslips were loaded with fura-2 by a 30 min incubation at 37 °C with 1 μM fura-2-AM and 0.02% Pluronic in the extracellular solution described above. [Ca2+]i was monitored by videomicroscopy. After rinsing, the glass coverslip was transferred to the recording chamber mounted on an inverted microscope (Leica, DMIRB), continuously superfused with extracellular medium. Fura-2 emission was obtained by exciting alternatively at 340 and 380 nm with a rotating filter wheel (Sutter Instruments) and by monitoring emissions (F340 and F380) at 510 nm. Fluorescent signals were collected with a CCD camera (Hamamatsu), digitized, and analyzed with image analysis software (Acquacosmos, Hamamatsu). The ratio of emissions at 510 nm (F340/F380) was recorded in cells every second. Experiments were carried out at room temperature and drug application was performed with a gravity-fed system. Data are expressed as averages (±SEM) of the ratio between the fura-2 fluorescence values of 340/380 nm excitation wavelengths ratios (F340/F380) normalized to the corresponding basal F340/F380 measured prior to any drug application. When required, F340/F380 ratio was calibrated into [Ca2+]i (nM) according the following equation (Grynkiewicz et al., 1985):
With Kd = 224 nM, R = F340/F380, S2f = F380 without Ca2+ and S2b = F380 with saturating Ca2+.
Rmax was obtained by applying the Ca2+ ionophore 4Br-A23187 (5 μM). Rmin was then recorded by substituting the extracellular medium for Ca2+-free extracellular medium with no added Ca2+ and supplemented with EGTA (2 mM).
Graphs presenting time-courses of F340/F380 ratio changes have been obtained by averaging data from a population of cells recorded individually during one single representative experiment. When required, the Areas Under Curve (AUC) of the Ca2+ entries elicited by tBuOOH application or by store depletion (SOCE) were calculated by integrating F340/F380 ratio over 5 min starting at the time of Ca2+ reinstatement in the extracellular medium. In graphs of pooled data, “n” values represent the entire population of cells recorded from at least three independent cultures (N).
Membrane currents were recorded using whole-cell patch-clamp method. Cells grown on glass coverslips were transferred to a recording chamber of an upright microscope, continuously superfused with the extracellular medium. Experiments were performed at room temperature with glass pipettes (4–5 MΩ resistance) filled with the intracellular solution comprising 140 mM KGluconate, 4 mM NaCl, 1 mM MgCl2, 1 mM EGTA, 5 mM HEPES, 2 mM MgATP, 0.6 mM NaGTP, pH = 7.4 (KOH). Cells were held at 0 mV and membrane currents were recorded by applying voltage ramps from −100 to 100 mV every 10 s. Access resistance was monitored by applying a 10 mV voltage step at the end of the voltage ramp. Currents were collected and amplified with an Axoclamp 200B amplifier (Molecular Devices) and digitized (Digidata 1322, Molecular Devices). They were analyzed with John Dempster’s software WCP. Drugs were applied at the desired concentration via a gravity-fed application system. Data are presented as means ± S.E.M. on graphs plotting pooled data.
Total RNA extraction was performed after cell collection using TRI Reagent® (Molecular Research Center, Inc.) according to the manufacturer’s instructions. Final concentration of 1 ng/mL total RNA was reverse-transcribed to first-strand cDNA using oligo-dT primer and SuperScript™ II Reverse Transcriptase (Invitrogen™) as described by the manufacturer. Real-time PCR was then carried out using SensiFAST™ SYBR® No-ROX Kit (Bioline) in LightCycler® 480 Instrument II (Roche Molecular Systems, Inc.). The primers used for the amplification of target cDNAs are shown in Table 1. They were designed with IDTDNA Technologies software. The access numbers for the target genes were obtained from NCBI data bank. All reactions were performed in a 1.5 μL volume using the following PCR program: initial denaturation at 95°C for 2 min, followed by 45 tri-step cycles of amplification: 10 s at 95°C, 10 s at 65°C, and 10 s at 72°C. Negative controls were obtained by running PCR with H2O instead of the template. Specificity was verified by melting curve analyses and agarose gel electrophoresis of the amplicon. Levels of specific transcripts were given by the threshold cycle (Ct) values and the data were normalized for the corresponding β-actin RNA contents.
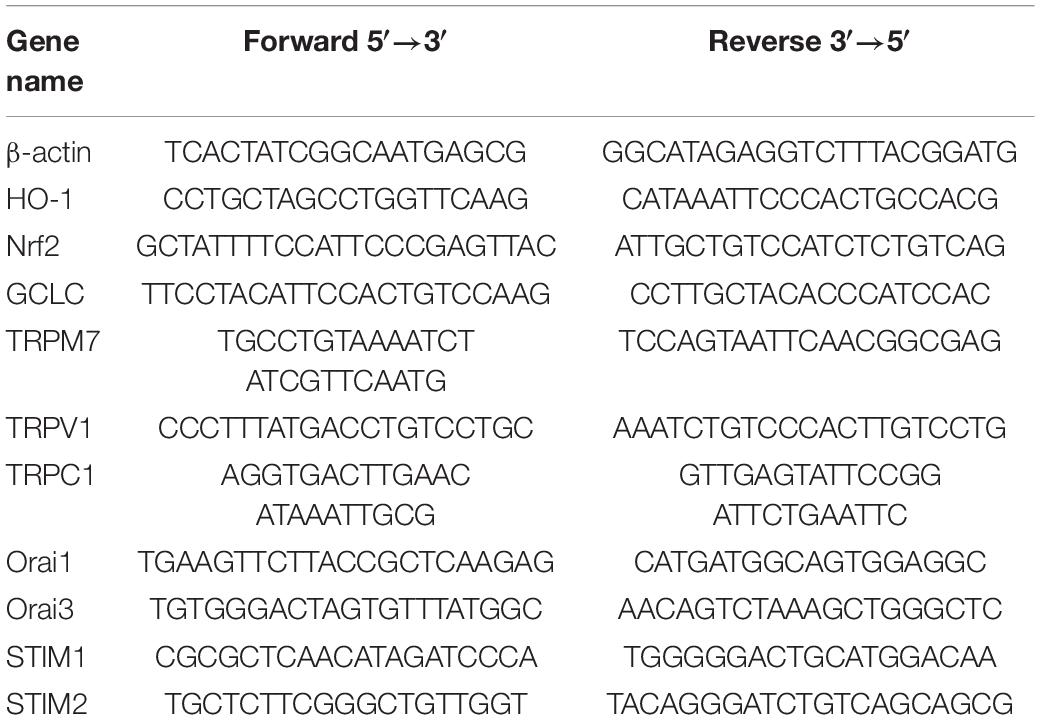
Table 1. Oligonucleotide sequences of the primers used for real-time PCR to assess the expression the genes of interest.
Cells were washed with PBS and lysed using RIPA Lysis Buffer (Boster) containing 1% NP-40, 0.5% sodium deoxycholate and 0.1% sodium dodecyl sulfate (SDS). Samples were then boiled for 5 min in a Laemmli Sample Buffer (BioRad) and loaded on a 12% SDS –polyacrylamide gel (6–8 mg/mL). After electrophoresis, proteins were electro-transferred (100 mV, 1 h) to nitrocellulose membrane using a sandwich blotting system. Blots were first incubated with 5% BSA and 0.1% Tween in Tris-buffered saline (TBS) for 1 h at room temperature, and then with either polyclonal rabbit primary antibody against Orai1 (1:1,000, rabbit Sigma-Aldrich, O8264), STIM2 (1:2,000, rabbit Sigma-Aldrich, S8572) or monoclonal mouse actin (1:100, mouse Sigma-Aldrich, A2066) at 4°C overnight. The appropriate horseradish peroxidase-conjugated secondary antibody IgG was added at a dilution of 1:10,000 for 1 h at RT. The peroxidase was detected with ECL Western Blotting Reagent (Amersham).
Statistical analyses were performed using SigmaStat software (Systat software Inc.). Data were first tested for normality and equality of the variances. In case of one or the other test failure (p < 0.05) then non-parametric methods, mainly ANOVA on rank, were used for comparisons. If both tests passed, then parametric methods were used. Specific tests used for each experiment were described in figure legends. Data obeying normality were represented as mean ± SEM; in other case data were represented as median, deciles and quartiles.
In order to modulate GSH levels, cells were pretreated for 24 h with either buthionine sulfoximine (BSO) or sulforaphane (SFN). The intracellular GSH concentration ([GSH]i) was assayed in cellulo by labeling living cells with monobromobimane (mBBr). In cells exposed to 10 μM BSO, a γ-glutamyl-cysteine ligase (GCL) blocker, mBBr fluorescence was significantly reduced to 51 ± 4% (n = 11) as compared to untreated cells. Treatment with 20 μM BSO did not further reduce GSH content. On the opposite, mBBr fluorescence was increased to 135 ± 6% (n = 7) of control fluorescence in cells treated with 10 μM SFN, a strong activator of Nrf-2 pathway (Figure 1A).

Figure 1. Glutathione content and C6 glioma cell survival under oxidative stress after manipulating GSH metabolism. (A) [GSH]i content in control, BSO- and SFN- pretreated cells. GSH was measured in cellulo with mBBr 24H following treatments. On the graph, data are presented as percentages of mBBr fluorescence intensity normalized to basal mBBr fluorescence measured in control untreated cells. ***p < 0.001 when comparing GSH basal level with either treatment (one-sample t-test). (B) Cell survival of control, BSO-, SFN-, or BAPTA-AM pretreated cells challenged by increasing concentrations of tBuOOH (100, 300, and 500 μM). Cells were pretreated for 24H with 10 μM BSO or 10 μM SFN, or for 1 h with BAPTA-AM (1 or 10 μM) before the exposure to tBuOOH. Cell survival was assayed 24 h later, by measuring MTT transformation. Data are presented as percentages of basal MTT transformation in control untreated cells. *p < 0.05 vs. respective tBuOOH in untreated cells, $p < 0.05 vs. respective control in the absence of tBuOOH (two-way ANOVA followed by Holm-Sidak post-hoc test for multiple comparisons).
We next verified whether [GSH]i modulation effectively altered cell sensitivity toward oxidative stress. For this, the toxicity of tert-butyl hydroperoxide (tBuOOH) was measured on C6 cell pretreated or not with BSO or SFN (Figure 1B). Under control conditions, a 100 μM tBuOOH exposure led to little or no cell damage (93 ± 5% of cell survival, n = 12). By contrast, when applied at 500 μM, a strong cell death was observed (18 ± 1% of cell survival, n = 12). Treatment with 300 μM tBuOOH, resulted in moderate cell death survival (45 ± 5% n = 12 of cell survival). Thus, analyzing changes in cell survival profile obtained after tBuOOH treatments at 100, 300, and 500 μM enabled to measure both sensitization and resistance to oxidative stress.
Neither SFN, nor BSO pretreatment affected cell survival under basal conditions. Cell survival was 101 ± 3% and 102 ± 2% (n = 8) in SFN and BSO pretreated cells, respectively (Figure 1B). Increasing [GSH]i with SFN pretreatment protected cells against peroxide toxicity: upon 500 μM tBuOOH, cell survival was 49 ± 12% (n = 8) in cells treated with SFN, as compared to 18 ± 3% obtained in control cells (Figure 1B). Other agents triggering Nrf2 pathway as dimethyl fumarate and tertio butyl hydroquinone exhibited similar effects as SFN (data not shown). In contrast, decreasing [GSH]i with BSO sensitized cells to peroxide toxicity. Indeed, in the presence of 100 μM tBuOOH, a concentration which did not induce any significant cell death in control cells, cell survival was reduced to 16 ± 2% after BSO pretreatment (Figure 1B).
To establish the putative link between oxidative stress and calcium homeostasis disruption in C6 glioma cells, intracellular Ca2+ variations were buffered using the cell permeant calcium chelator, BAPTA-AM. The treatment with 1–10 μM BAPTA-AM of C6 cells prevented cell death induced by the application of tBuOOH (100–500 μM) (Figure 1B). Cell survival was 94 ± 5% (n = 5) after exposing 10 μM BAPTA-loaded cells to 500 μM tBuOOH. This strengthened the requirement of intracellular calcium increases for the expression of peroxide-mediated toxicity in C6 cells.
We next evaluated how [GSH]i manipulation impacted oxidative stress-mediated [Ca2+]i changes. With this aim, the effect of tBuOOH was first examined on control cells. This peroxide induced a concentration-dependent increase in [Ca2+]i in C6 cells which was linear for the first 10 min after applying it (Figures 2A,B). Cytoplasmic Ca2+ variation may result from influxes from the extracellular medium to cytoplasm or/and from Ca2+ release from internal stores including endoplasmic reticulum (ER). In extracellular Ca2+-depleted medium (Figure 2E) or in the presence of 100 μM lanthanum ions (La3+), a non-selective calcium channel blocker, tBuOOH-induced [Ca2+]i accumulation was completely inhibited (not shown), suggesting the occurrence of Ca2+ entries under oxidative conditions.
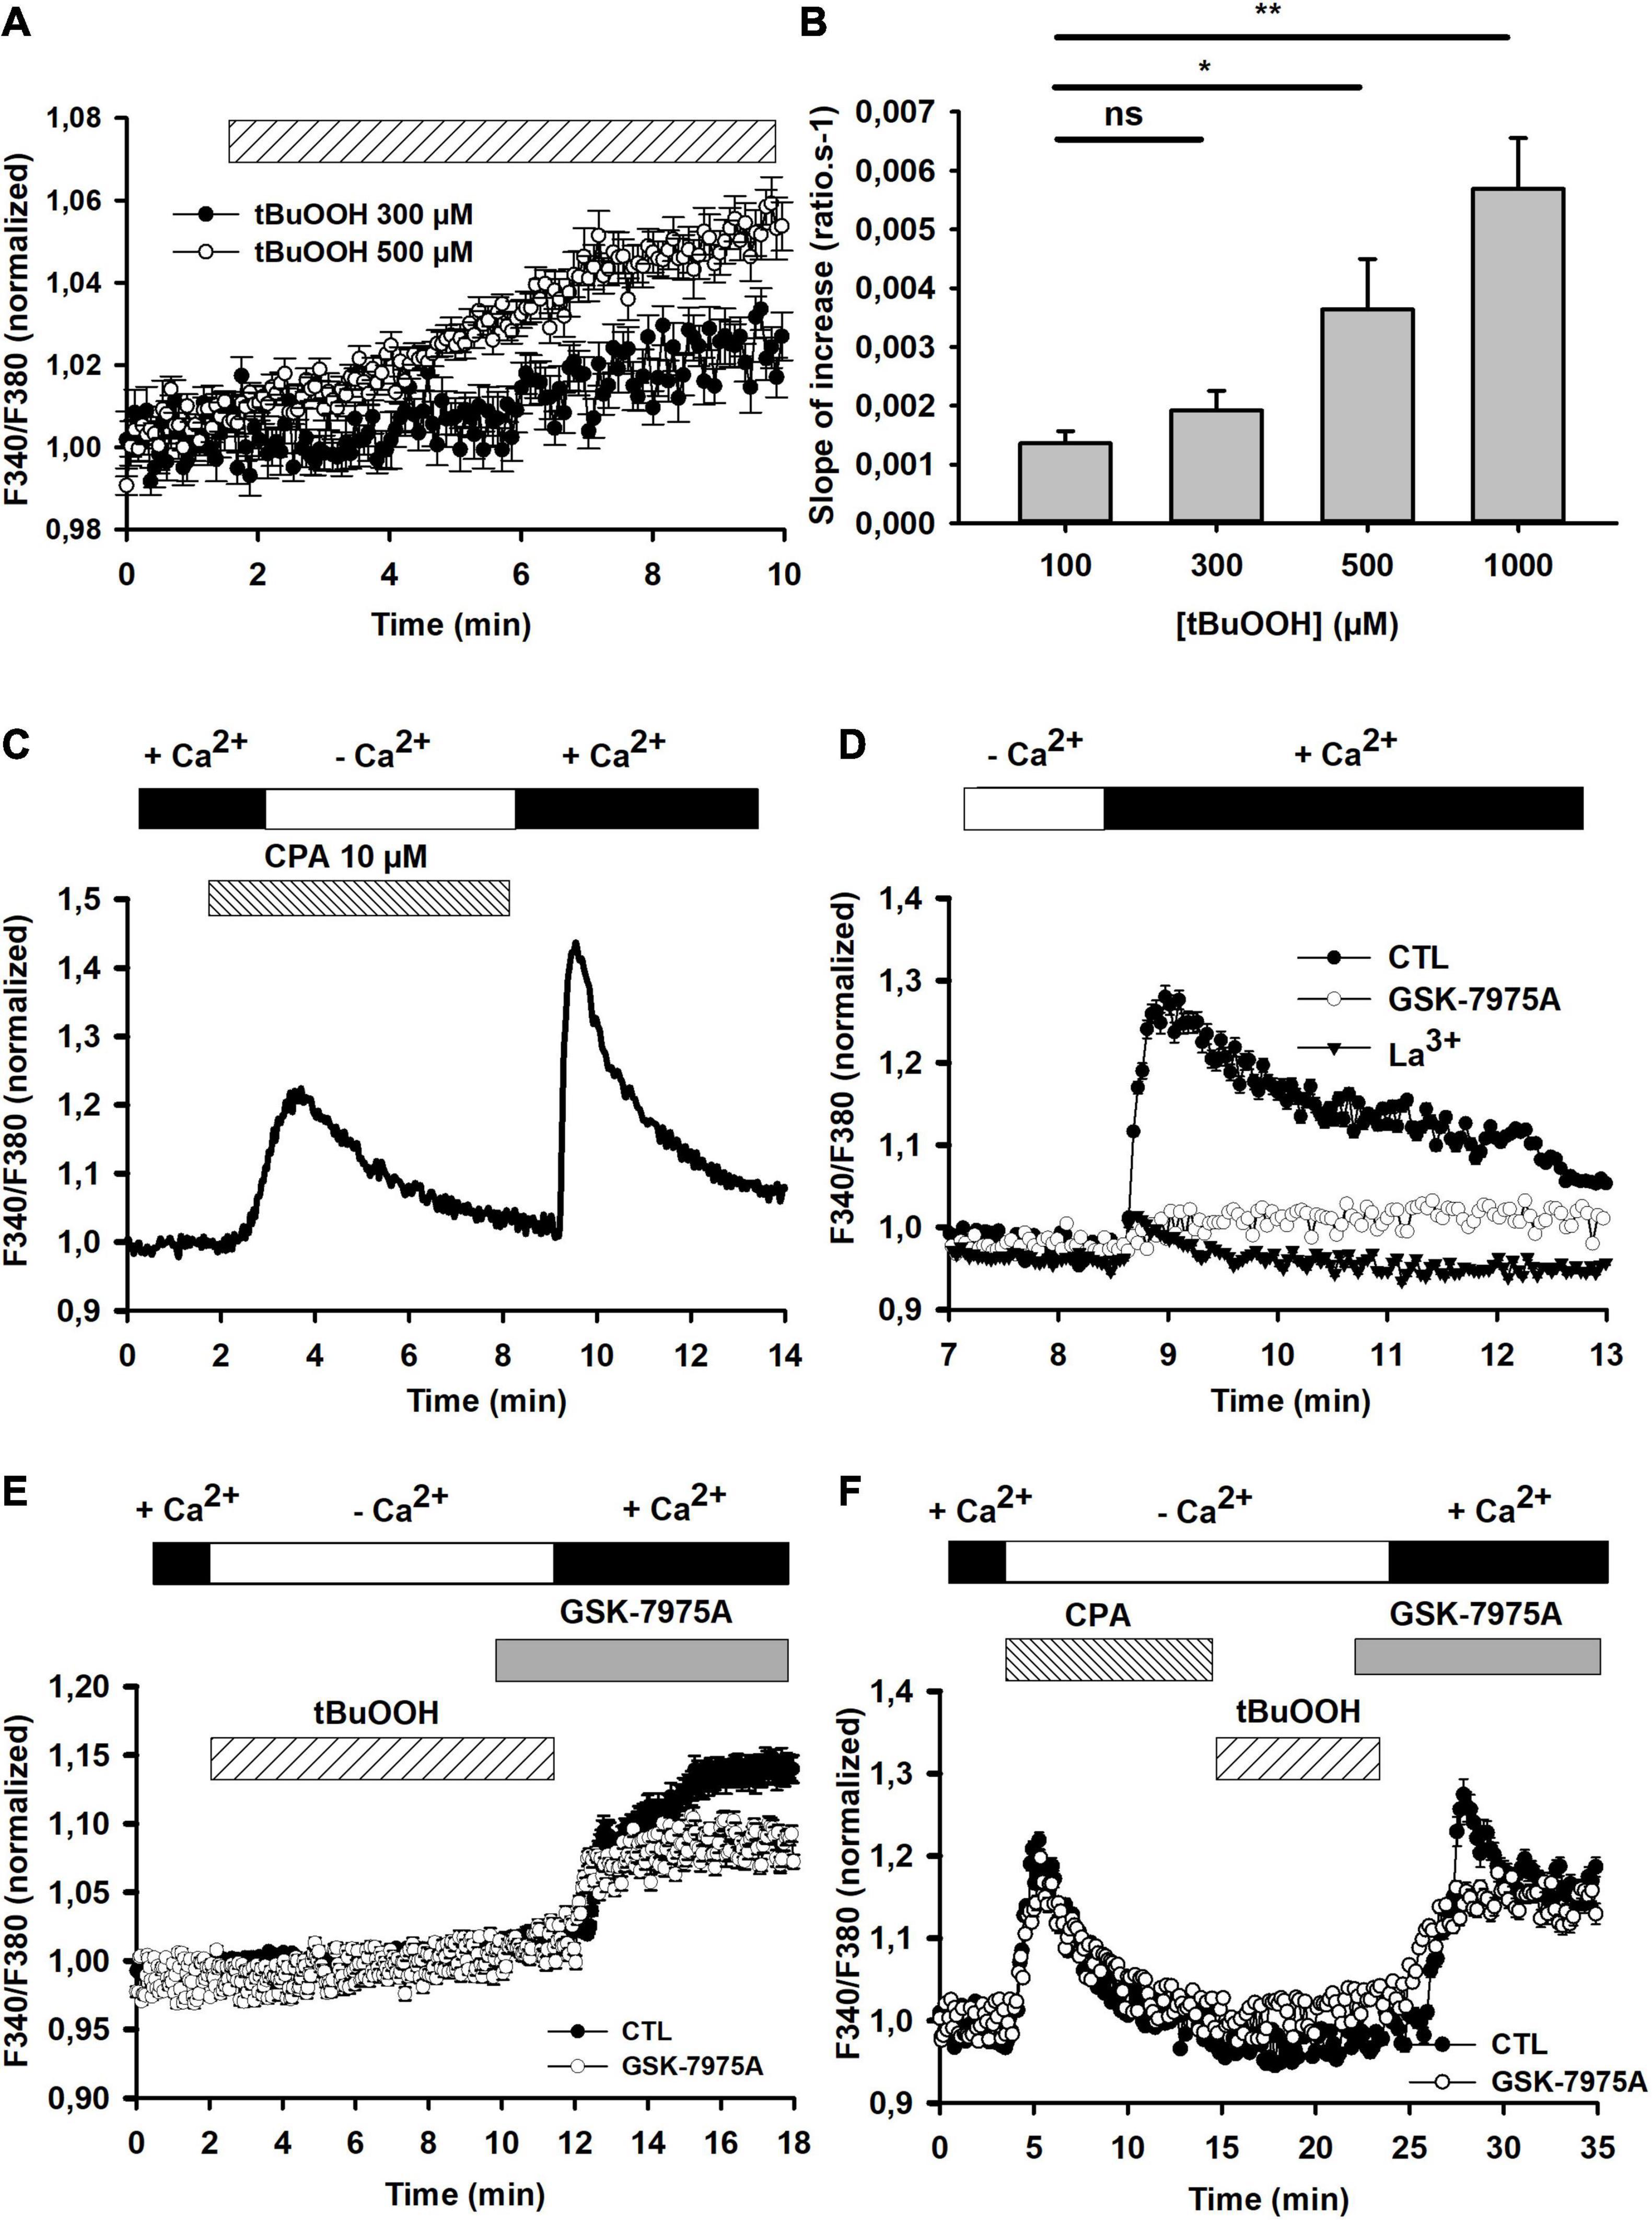
Figure 2. [Ca2+]i changes in the presence of tBuOOH. (A) Pooled data illustrating [Ca2+]i changes induced by 300 and 500 μM tBuOOH (n = 20 and 21 cells, respectively). These curves were fitted with a linear regression. The slope values were calculated using linear regression function on SigmaPlot Software from the onset of F340/F380 increase for 10 min (R2 = 0.9416 for F340/F380 change induced by 500 μM and R2 = 0.6598 for F340/F380 change induced by 300 μM). (B) Concentration-dependent changes of the slope of tBuOOH-induced [Ca2+] increase. Data are expressed as averages of the slopes of F340/F380 ratios time-courses obtained in 47, 97, 100, and 50 cells for the applications of 100, 300, 500, and 1,000 μM, respectively. “ns” or *p < 0.05 or **p < 0.01 when comparing slopes to the slope obtained in the presence of 100 μM tBuOOH (one way ANOVA followed by Holm Sidak t-test). (C) Illustrative recording of store-operated capacitive Ca2+ entry (SOCE) elicited by cyclopiazonic acid (CPA, 10 μM) in C6 glioma cells. Cells were challenged by CPA in Ca2+-free medium (including 2 mM EGTA) for 10 min before [Ca2+]e was restored. (D) Pharmacological characterization of SOCE. Following CPA stimulation in the absence of extracellular Ca2+, CRAC blockers, i.e., GSK-7975A (5 μM) or La3+ (100 μM) were applied 2 min prior to reinstating extracellular calcium concentration at 2 mM to reveal SOCE. (E) Assessment of Ca2+ release from internal stores by tBuOOH exposure. Cells were challenged by tBuOOH (500 μM) in Ca2+-free medium (including 2 mM EGTA) for 10 min before [Ca2+]e was restored. When required, the CRAC blocker was applied 2 min prior to [Ca2+]e reinstatement. (F) As compared to the experiment in panel (E), in this case the tBuOOH exposure was preceded by the application of CPA to empty internal Ca2+ stores. The graphs in E and F plot averaged data obtained from 17 (control) and 29 (+GSK-7975A) individual cells and from 22 (control) and 20 (+GSK-7975A) individual cells, respectively.
The contribution of intracellular calcium store release to the [Ca2+]i increase elicited by tBuOOH and the potential induction of store-operated capacitive calcium entries (SOCE) as a source of Ca2+ influx was further evaluated. First, the occurrence of SOCE was examined in C6 cells thanks to their sensitivity to the selective CRAC blocker, GSK-7975A. SOCE were triggered by depleting Ca2+ from the ER with cyclopiazonic acid (10 μM, CPA), a reversible SERCA (Sarcoplasmic and Endoplasmic Reticulum Ca2+ ATPase) pump blocker, in Ca2+-free medium, and revealed by reinstating extracellular calcium concentration at 2 mM (Figure 2C). As expected, the addition of CPA induced a transient increase in Ca2+ in the absence of extracellular calcium, reflecting the release from ER; then reinstating extracellular calcium at 2 mM induced a large increase in intracellular Ca2+, reflecting the SOCE (Figure 2C). Consistently, this Ca2+ increase was blocked by 5 μM GSK-7975A or by 100 μM La3+ ions (Figure 2D). The AUC for the SOCE plotted in the Figure 2D were 0.67 ± 0.02 in control and 0.21 ± 0.06 in the presence of GK-7975A (n = 30 each). Then, the potential induction of SOCE by tBuOOH was evaluated. For this, tBuOOH was transiently applied in the absence of extracellular Ca2+. Under these conditions, no Ca2+ rise could be evidenced during the application of tBuOOH, but a large Ca2+ increase appeared when extracellular calcium was restored. This increase was partially blocked by GSK-7975A (Figures 2E, 3C). Thus, in C6 cells under control conditions tBuOOH did not induce any measurable intracellular calcium release, but evoked an entry of calcium upon extracellular calcium reinstatement partially sensitive to GSK-7975A. To confirm this entry was not a SOCE, intracellular Ca2+ stores were first depleted by CPA prior to the tBuOOH application. Under these conditions, the Ca2+ entry was still observed and retained its partial sensitivity to GSK-7975A (Figure 2F). The AUC for the Ca2+ entry plotted in the Figure 2F were 1.64 ± 0.34 in control and 1.04 ± 0.30 in the presence of GK-7975A (n = 20 each). The La3+-sensitive Ca2+ entry triggered by tBuOOH is thus largely independent of SOCE mechanism under control conditions.
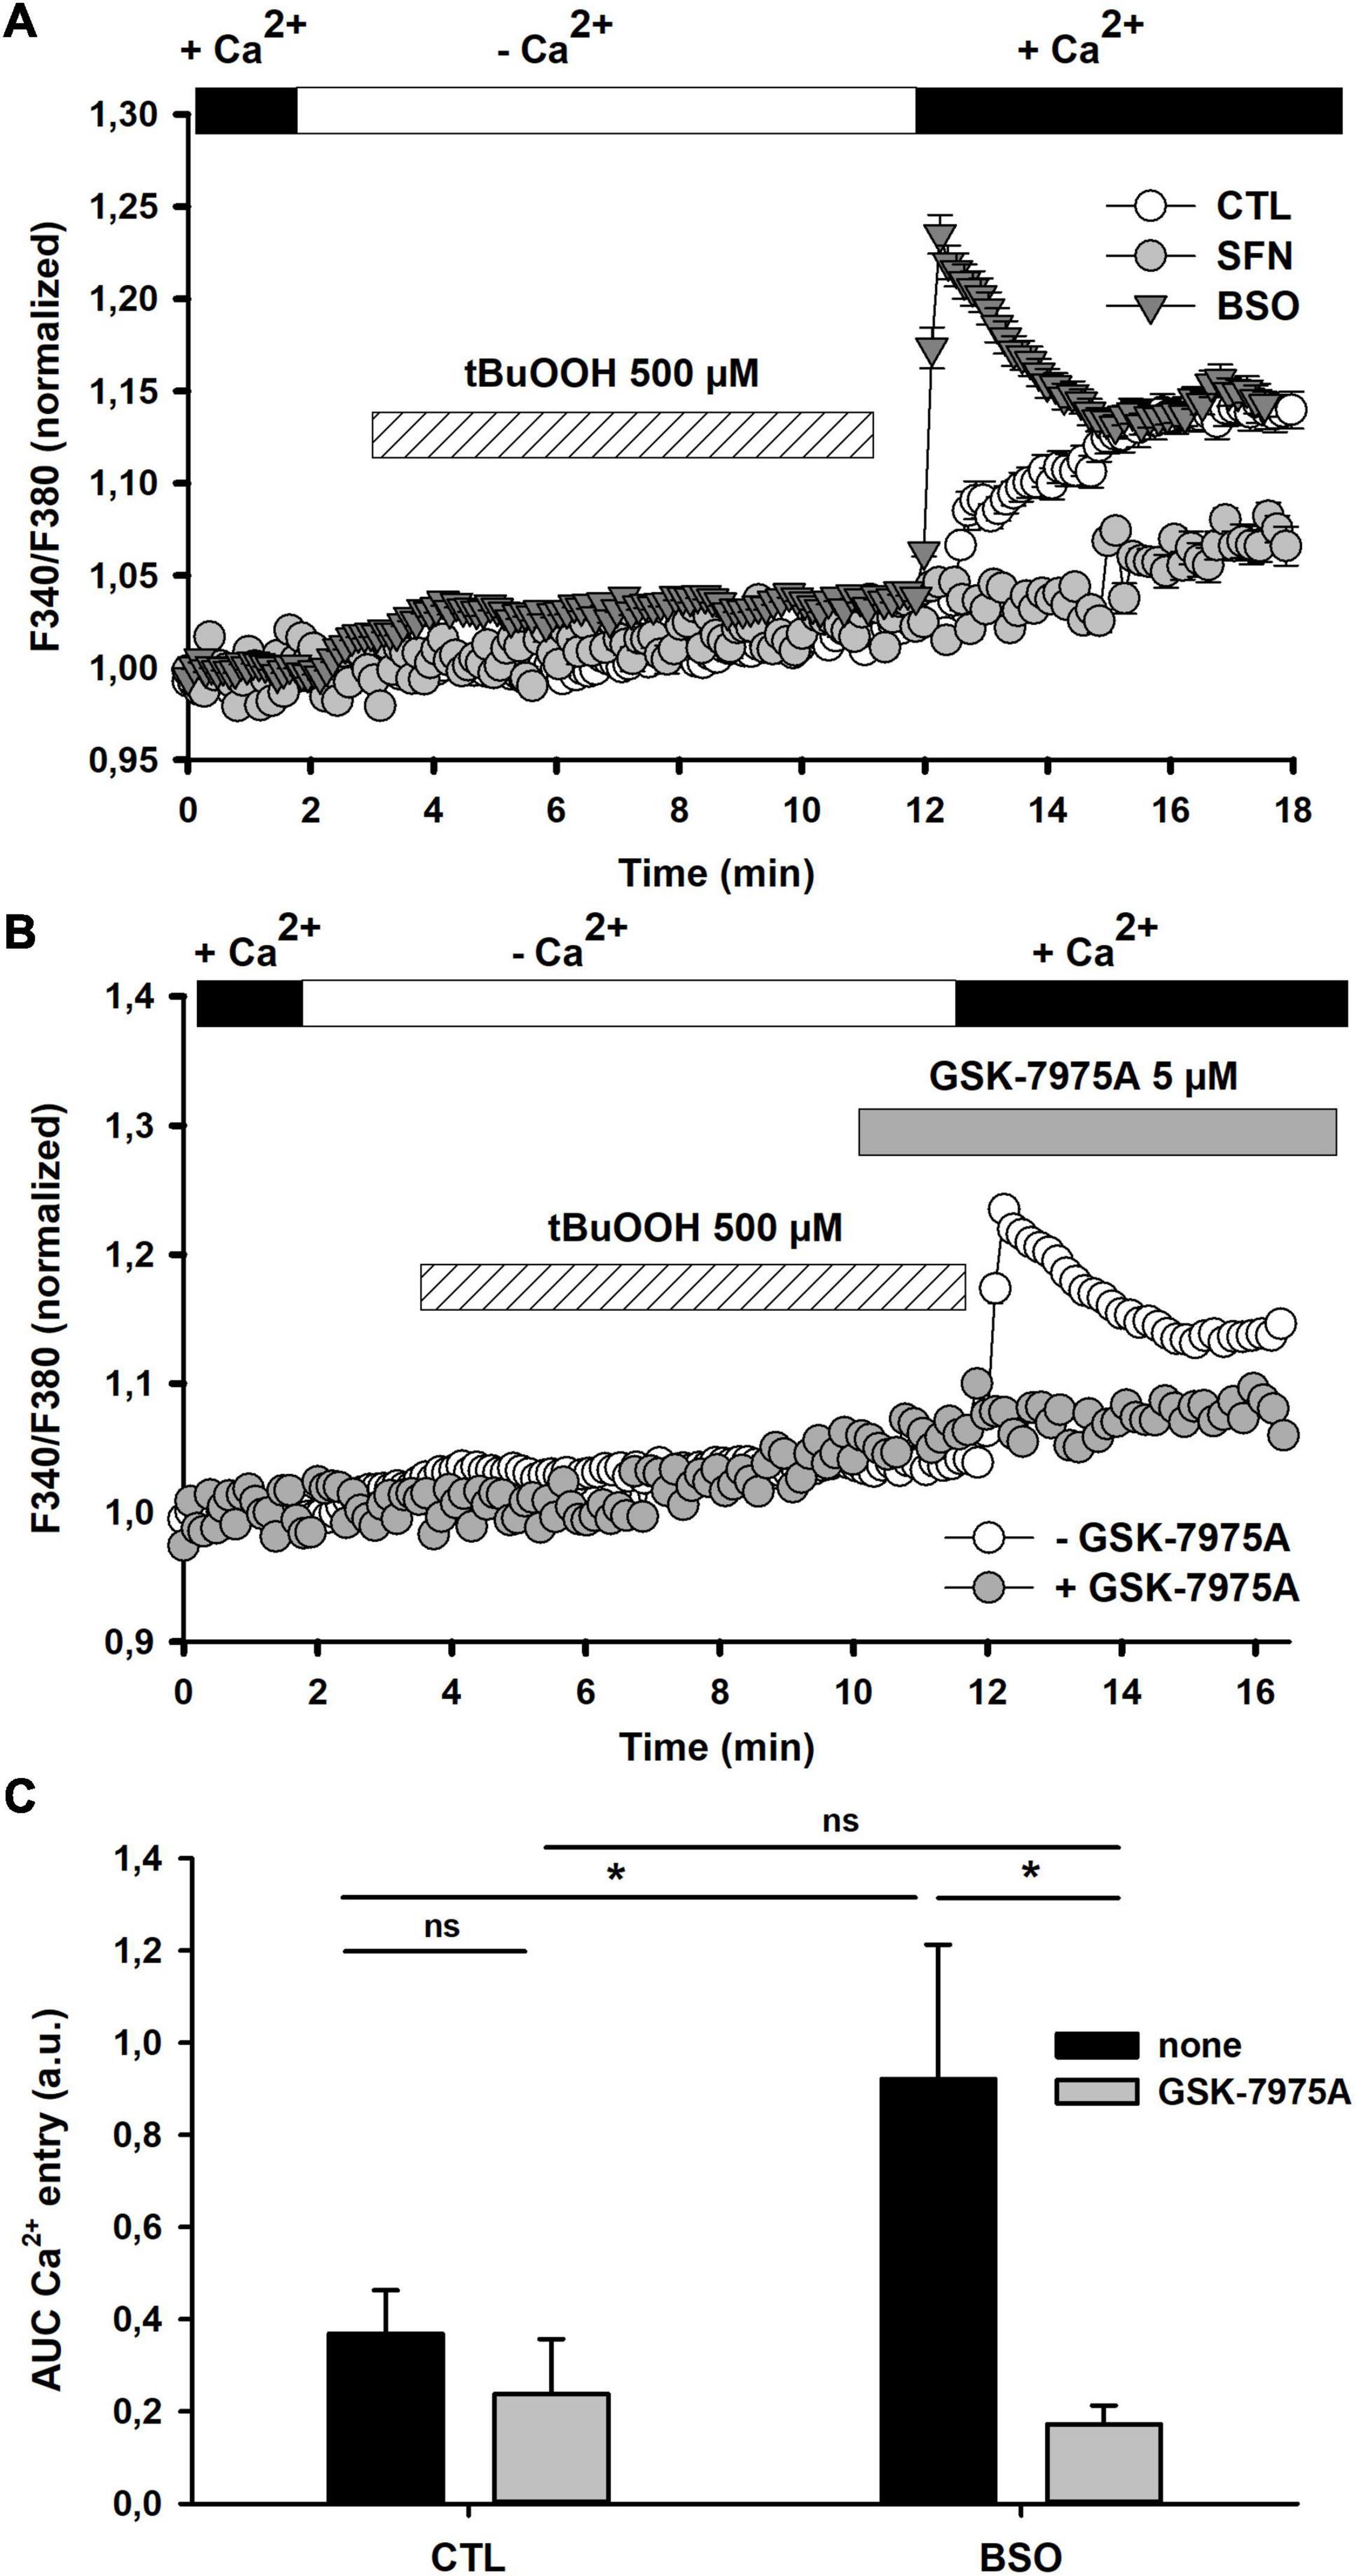
Figure 3. Effect of [GSH]i manipulations on tBuOOH-mediated [Ca2+]i changes. (A) [Ca2+]i changes elicited by tBuOOH (500 μM) in control, SFN- and BSO-pretreated cells. The graph represents an average of the [Ca2+]i changes measured in 28, 17, and 19 individual cells for control, SFN- and BSO-pretreated cells, respectively. (B) Effect of GSK-7975A on the tBuOOH-induced [Ca2+]i increase in BSO-pretreated cells. The graphs have been generated by averaging [Ca2+]i changes measured in BSO-pretreated individual cells recorded in the absence (n = 29) or in the presence of GSK-7975A (n = 29). The CRAC blocker was applied 2 min prior to the [Ca2+]e reinstatement. (C) Recapitulative graphs plotting F340/F380 ratio changes elicited by tBuOOH (500 μM) in control and BSO-pretreated cells and in the presence of GSK-7975A. Data are means ± SEM of AUC measured in 86 cells (untreated control cells), 123 cells (untreated with GSK-7975A), 61 cells (BSO-pretreated), and 66 cells (BSO-pretreated with GSK-7975A). *p < 0.05 vs. respective control in the absence of GSK-7975A (two-way ANOVA followed by Holm-Sidak post-hoc test for multiple comparisons).
We next evaluated how changing GSH content altered [Ca2+]i changes elicited by tBuOOH. First of all, resting [Ca2+]i was measured in control, BSO- and SFN-pretreated cells. It appears that [GSH]i manipulations did not significantly alter basal [Ca2+]i in these three groups of cells: resting [Ca2+]i was 65 ± 2 nM, 66 ± 2 nM, 72 ± 5 nM, respectively (see Table 2). In SFN-pretreated cells, tBuOOH exposure elicited a Ca2+ entry lower than in control cells. By contrast, in GSH-depleted cells with BSO, a significant potentiation of the tBuOOH-evoked [Ca2+]i increase was observed (Figures 3A,C). Moreover this potentiation [Ca2+]i was almost completely inhibited by CRAC blocker (Figures 3B,C). Thus, GSH-depletion apparently sensitized CRAC to induce Ca2+ entry.
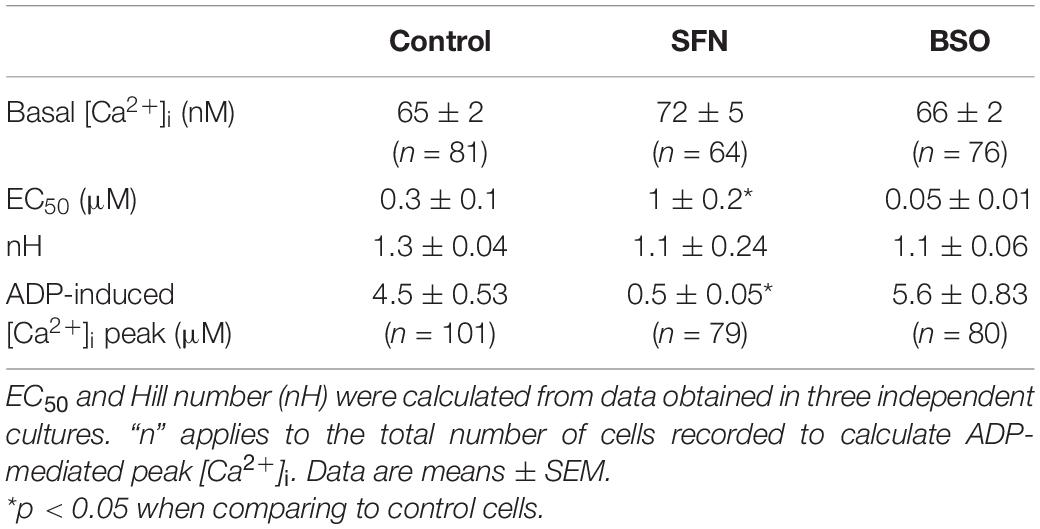
Table 2. Evaluation of SFN- or BSO-pretreatments on basal [Ca2+]i and P2YR response elicited by ADP applications.
The sensitization by GSH depletion of CRAC observed under oxidative stress suggested that SOCE elicited by Ca2+ mobilization from the ER should be modulated by GSH content manipulation (Figure 3). We have thus tested whether the activation of the IP3/Ca2+ mobilization pathway exhibited sensitivity to the GSH concentration. The stimulation of Gq-linked metabotropic P2Y receptors with ADP elicited intracellular mobilization from IP3-sensitive internal calcium stores in C6 cells (Figures 4A,B). Pretreating cells with BSO or SFN significantly impacted IP3-mediated transient Ca2+ increase as shown by the comparisons of ADP concentration-response curves. As compared to control cells, the EC50 of ADP on calcium transient was slightly but non-significantly reduced in BSO-treated cells. By contrast, the EC50 of ADP effect on calcium transient was significantly increased in SFN-treated cells (1 ± 0.2 μM), while Hill number remained unchanged. Moreover, the maximal effect of ADP seemed to be similar in the different conditions (Table 2).
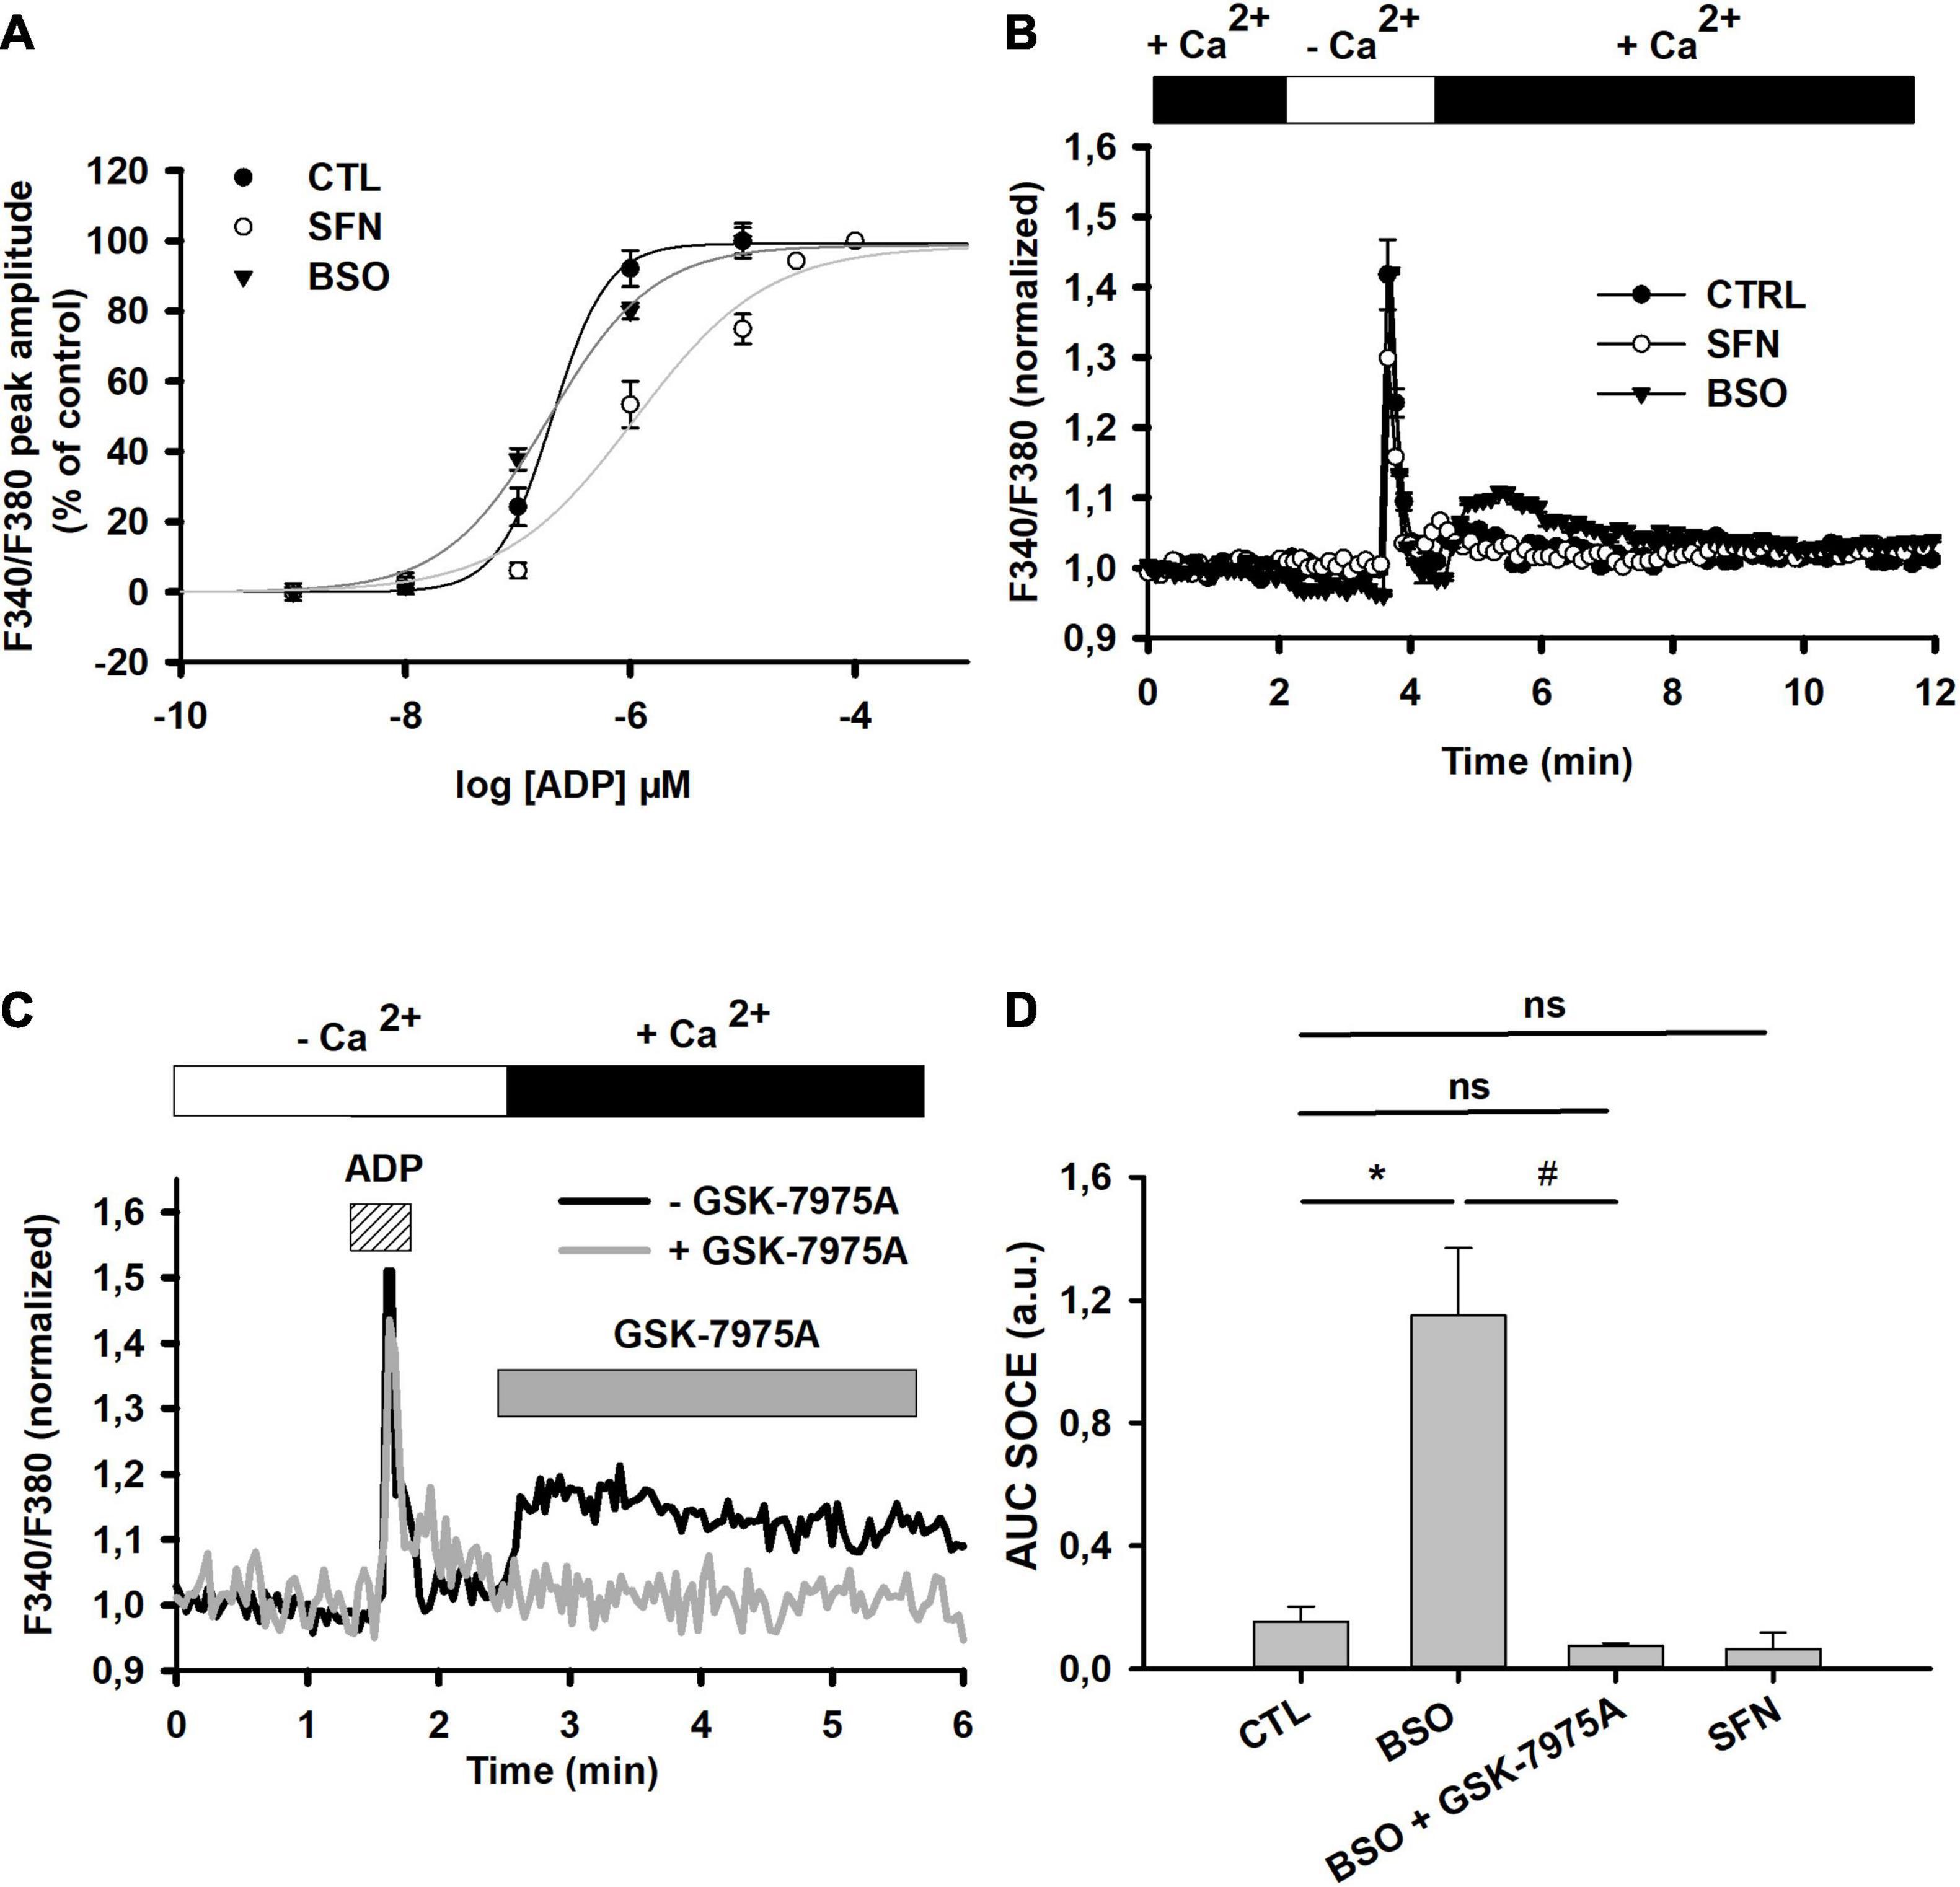
Figure 4. Effect of SFN and BSO treatments on P2Y receptors-mediated SOCE. (A) Concentration-dependent changes of P2Y receptor-mediated [Ca2+]i transient increase in control, SFN- and BSO-pretreated cells. P2Y receptors were stimulated by increasing concentrations of ADP (1, 10, 100 nM and 1, 10 μM) in the absence of extracellular calcium and the peak amplitude was determined. Curves were generated after fitting data with sigmoidal function (Sigmaplot). Such fittings allowed to determine EC50, nH, and Emax in each individual dose response curves, which are reported in Table 2. (B) SOCE triggered by ADP (10 μM) in control, SFN- and BSO-pretreated cells. The graphs were generated by averaging data from 46 (control), 32 (SFN-pretreated), and 35 (BSO-pretreated) individual cells, respectively. (C) Single example depicting the effect of GSK-7975A on ADP-induced SOCE in BSO-pre-treated cells. CRAC blocker was applied at 5 μM 30 s prior to [Ca2+]e reinstatement. (D) Recapitulative graph plotting the AUC of the SOCE elicited by ADP (10 μM) in control, SFN- and BSO-pre-treated cells and in the presence of GSK-7975A (5 μM). AUC were calculated by integrating F340/F380 normalized changes over 5 min after reinstating Ca2+ in the extracellular medium. Data are means ± SEM of AUC measured in 72 cells (N = 3; untreated control cells), 55 cells (N = 3; BSO-pretreated), 30 cells (N = 3; BSO-pretreated with GSK), and 77 cells (N = 3; SFN-pretreated). *p < 0.05 when comparing with control cells and # when comparing with BSO-treated cells without GSK-7975A (two Way ANOVA followed by Holm Sidak post-hoc test for multiple comparisons).
We have then evaluated whether store-operated calcium entry (SOCE) following P2Y receptor activation was altered by [GSH]i manipulations. Following extracellular calcium reinstatement ADP triggered a significant calcium influx in BSO-pretreated cells (Figures 4B,D). This influx was blocked by GSK-7975A (Figures 4C,D). SOCE was barely detected in either control or SFN-treated cells. Thus, in C6 glioma cells [GSH]i depletion greatly potentiated SOCE triggered by IP3-mediated responses.
Since both ADP evoked calcium transients and SOCE could be modified following intracellular GSH content manipulation, we have then examined the impact of BSO or SFN pretreatments on the capacity of cells to accumulate Ca2+ within the ER and on SOCE occurrence using CPA (Figure 2C). The area under the curve (AUC) of both Ca2+ mobilization and Ca2+ entry did not exhibit significant differences whatever the treatment applied (Table 3). Therefore, GSH manipulation neither modified Ca2+ load within the ER nor SOCE elicited by SERCA inhibition. This suggested that GSH metabolism modulation predominantly affected IP3 receptor-mediated SOCE.
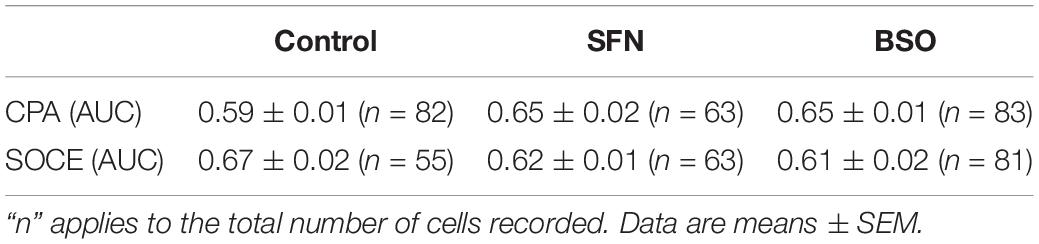
Table 3. Evaluation of SFN- or BSO-pretreatments on basal [Ca2+]i and SOCE parameters, i.e., AUC calculated from Ca2+ increase in the presence CPA and AUC of Ca2+ increase obtained after restoring extracellular Ca2+ concentration to 1 mM.
The effects of GSH content manipulations on C6 glioma cells, were then studied on the expression of STIM and Orai, two interacting proteins responsible for SOCE after ER-Ca2+ store release.
First, mRNAs of NRF2, as well as of Heme Oxigenase 1 (HO-1) and GCL, two enzymes whose expression is known to be under the control of NRF2, were quantified by qRT-PCR (Figure 5A). Significant increases in HO-1, Nrf2, and GCLC (the catalytic subunit of GCL) mRNA expressions were evidenced in SFN treated cells. Treatments with BSO had no effect on NRF2 and CGLC mRNA expression, but slightly increased the expression of HO-1 mRNA.

Figure 5. Variations of gene expression following GSH metabolic manipulations. mRNA expressions of the genes of interest were normalized to the mRNA expression of the β-actin gene obtained in control, BSO- and SFN-treated cells. (A) mRNA expressions of Nrf2, Heme Oxygenase 1 (HO-1), and glutamate cysteine ligase catalytic subunit (GCLC) genes. (B) mRNA expressions of oxidization sensitive TRP channels genes, including TRPV1, TRPC1, and TRPM7. In A and B, *p < 0.05 vs. control cells (one-way ANOVA on repeated measures followed by Dunnett’s post-hoc test). (C) mRNA expressions of SOCE proteins genes, including STIM1, STIM2, Orai1, and Orai3. Specific mRNAs were quantified by qRT-PCR. *p < 0.05 vs. control cells (ANOVA on rank on repeated measures followed by Dunnett’s post-hoc test).
The mRNA expressions of the oxidative stress-sensitive TRP channels were examined. The TRPM2 mRNA was not detectable in these cells (not shown). BSO pretreatment had no effect on the expression of TRPM7, TRPV1, and TRPC1 mRNAs, while SFN pretreatment significantly increased the TRPV1 mRNA expression, and to a lesser extent that of TRPC1 (Figure 5B).
Finally, mRNA expressions of the proteins involved in SOCE, i.e., STIM and Orai, were measured. SFN pretreatment induced a significant decrease in STIM2 mRNAs accompanied by significant increases in Orai1 and Orai3 mRNA expressions. BSO pretreatment significantly diminished STIM2 mRNA expression (Figure 5C).
SOCE protein expressions were further examined by western blot. We observed that SFN treatment led to a significant decrease in both STIM2, Orai1, and Orai3 expressions (Figures 6A,B). The decreased expression of STIM and Orai proteins could explain the diminished SOCE mediated by IP3/Ca2+ mobilization observed in these cells after this treatment.
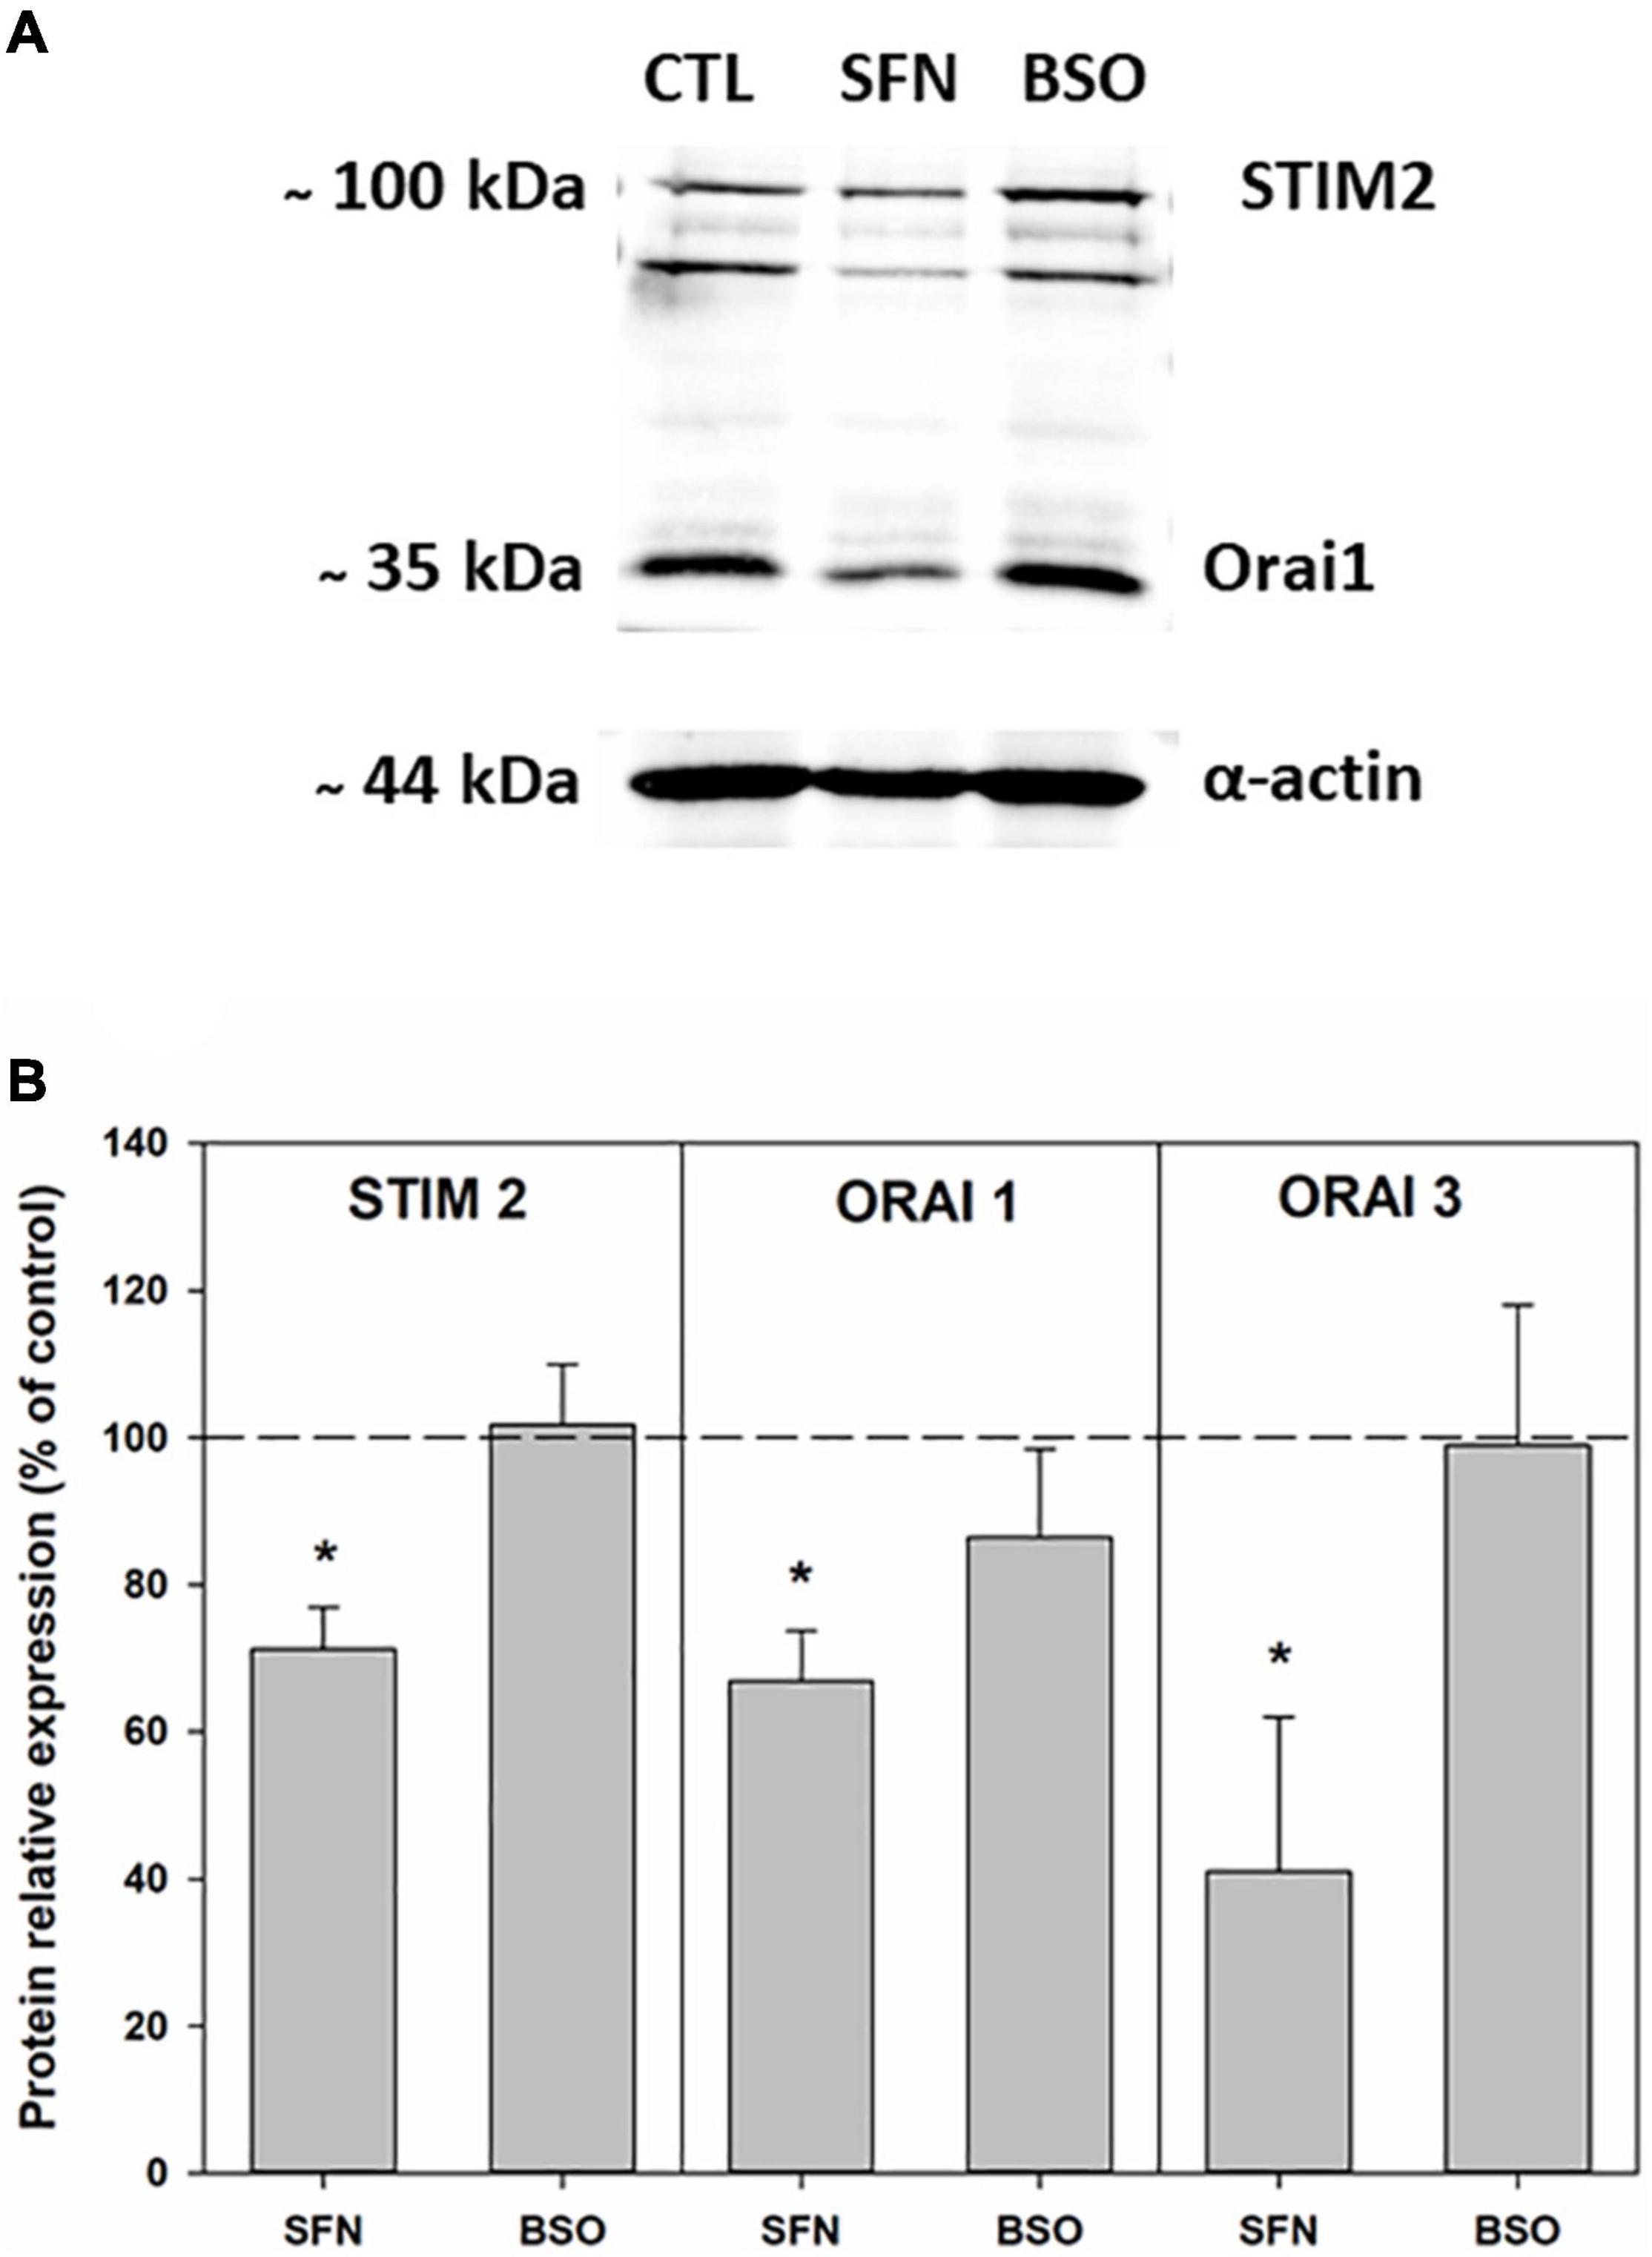
Figure 6. STIM2, Orai1, and Orai3 proteins expressions in control, SFN- and BSO-pretreated cells. (A) Illustrative Western blots depicting STIM2 and Orai1 proteins detection. (B) Pooled data of the expressions of STIM2 proteins (n = 5 for each condition) and of Orai1 proteins (n = 6 for each condition) and of Orai3 proteins (n = 3 for each condition). On the graphs data are expressed as averages of relative expressions obtained by normalizing STIM2 or Orai1 or Orai3 proteins expressions to β-actin expression. *p < 0.05 vs. control cells (one tailed t-test).
To further characterize membrane conductance changes elicited by [GSH]i manipulations on P2Y receptor signaling, electrophysiological recordings were carried out. The application of ADP resulted in the occurrence of a potassium current reversing around −77.0 ± 3.7 mV (n = 4) which exhibited an inward rectification at high voltages and a high sensitivity to 20 mM tetraethyl ammonium (TEA, Figure 7A). In cells pretreated with SFN, the current density measured at + 50 mV was not significantly decreased from 6.61 ± 1.94 pA/pF (n = 4) in control cells to 2.54 ± 0.66 pA/pF (n = 5). Under these conditions, the reversal potential was not significantly different from the one obtained in control cells (−69.6 ± 27.4 mV, n = 5, Figure 7B). By contrast, in cells pretreated with BSO, the ADP-elicited current was dramatically and significantly increased as current density reached 33.2 ± 5.0 pA/pF (n = 3) at +50 mV with shifted reversal potential to −48.0 ± 2.9 mV (n = 3, Figure 7B). These results agreed with the sensitization of the P2Y receptor response as previously observed monitoring [Ca2+] changes (Figures 4A,B). Interestingly in BSO-treated cells, ADP-elicited currents were significantly reduced by 20 mM TEA as well as by 5 μM GSK-7975A. Indeed, in BSO-treated cells the current density at +50 mV was 7.7 ± 4.4 pA/pF (n = 3) and 3.9 ± 1.8 pA/pF (n = 3), in the presence of TEA and GSK-7975A, respectively. Under these conditions, both TEA and GSK shifted the reversal potential from −48.0 ± 2.9 mV (n = 3) to −35.94 ± 0.05 mV (n = 3) and −27.5 ± 1.2 mV (n = 3) respectively (Figure 7C).

Figure 7. Effects of SFN and BSO treatments on P2Y receptors-mediated membrane currents. (A) On the left, single traces of currents recorded after ADP (10 μM) application on control cells either in the absence or in the presence of TEA (20 mM) are shown. Currents were recorded by applying voltage ramps from -100 to 100 mV every 10 s. On the right, recapitulative histograms plot P2Y receptor-mediated current densities measured at +50 mV in these cells (n = 4). *p < 0.05 vs. control cells untreated cells (Student’s t-test). (B) On the left, sample traces of currents recorded after ADP (10 μM) application on control, BSO- and SFN-pretreated cells are shown. On the right, recapitulative histograms plot P2Y receptor-mediated current densities measured at +50 mV in these cells (n = 4, 5, and 3, for control, SFN, and BSO, respectively). *p < 0.05 vs. control cells (ANOVA followed by Dunnett’s post-hoc test). (C) Blockade of ADP-mediated current by TEA (20 mM) and GSK-7975A (5 μM) in BSO-pretreated cells. On the left, traces of currents recorded in BSO-treated cells with TEA (20 mM) or GSK 7579A are shown. On the right, recapitulative histograms plot P2Y receptor-mediated current densities measured at +50 mV in BSO-pretreated cells (n = 3 for each condition). *p < 0.05 vs. BSO-treated cells without any blocker (ANOVA followed by Holm-Sidak post-hoc test).
We show here that modulating cell redox status by manipulating GSH metabolism primarily affects the IP3/Ca2+ pathway in C6 astroglioma cell line (see scheme in Figure 8). Firstly, GSH depletion with BSO greatly sensitizes this pathway as evidenced by the unveiling of SOCE after the stimulation of Gq-linked P2Y receptors. This increase in SOCE most likely results from the sensitization of CRAC as evidenced by the inhibitory action of CRAC selective blocker, i.e., GSK-7975A. CRAC sensitivity to redox status most likely results from the presence of cysteine residues occurring in the structure of Orai proteins which constitute CRAC (Bogeski et al., 2010) but also in STIM proteins structure (Gibhardt et al., 2020). However, under oxidative conditions, a suppression of SOCE is observed because of STIM2 (Gibhardt et al., 2020) or Orai (Bogeski et al., 2010) oxidization. Therefore, enhanced SOCE observed here could result from a rise in CRAC trafficking at the membrane as evidenced by the increased potency of CRAC blocker, although, this treatment does not appear to result from changes in STIM and Orai proteins expression via genomic actions. By contrast, SFN treatment leads to a desensitization of the IP3/Ca2+ entry which could be attributed to genomic actions. Indeed, the fact that SFN treatment does not affect either basal Ca2+ or Ca2+ load in the ER or SOCE mediated by SERCA inhibition further excludes changes in [Ca2+]i handling mediated by SFN. However, previous data raised on rabbit gastric mucosal cells have demonstrated that Ca2+ release from the ER was reduced when GSH content was increased (Wong and Tepperman, 1994). As we observe that STIM2, Orai1, and Orai3 proteins expressions are reduced by this treatment, reduced coupling between STIM2 and Orai more likely explains the reduced Ca2+ entry after P2Y receptors activation than an inhibition of Ca2+ release from the ER. In support of this hypothesis, diminished expression of STIM and Orai proteins has been shown to be at the origin of decreased SOCE and increased resistance to oxidative damage in HT22 cells (Henke et al., 2013). On the opposite, increased SOCE is a hallmark of increased sensitivity to oxidative stress in neuronal cells (Crouzin et al., 2007; Henke et al., 2013) and SOCE inhibition protects neuronal cells from oxidative stress-induced apoptosis (Rao et al., 2013).
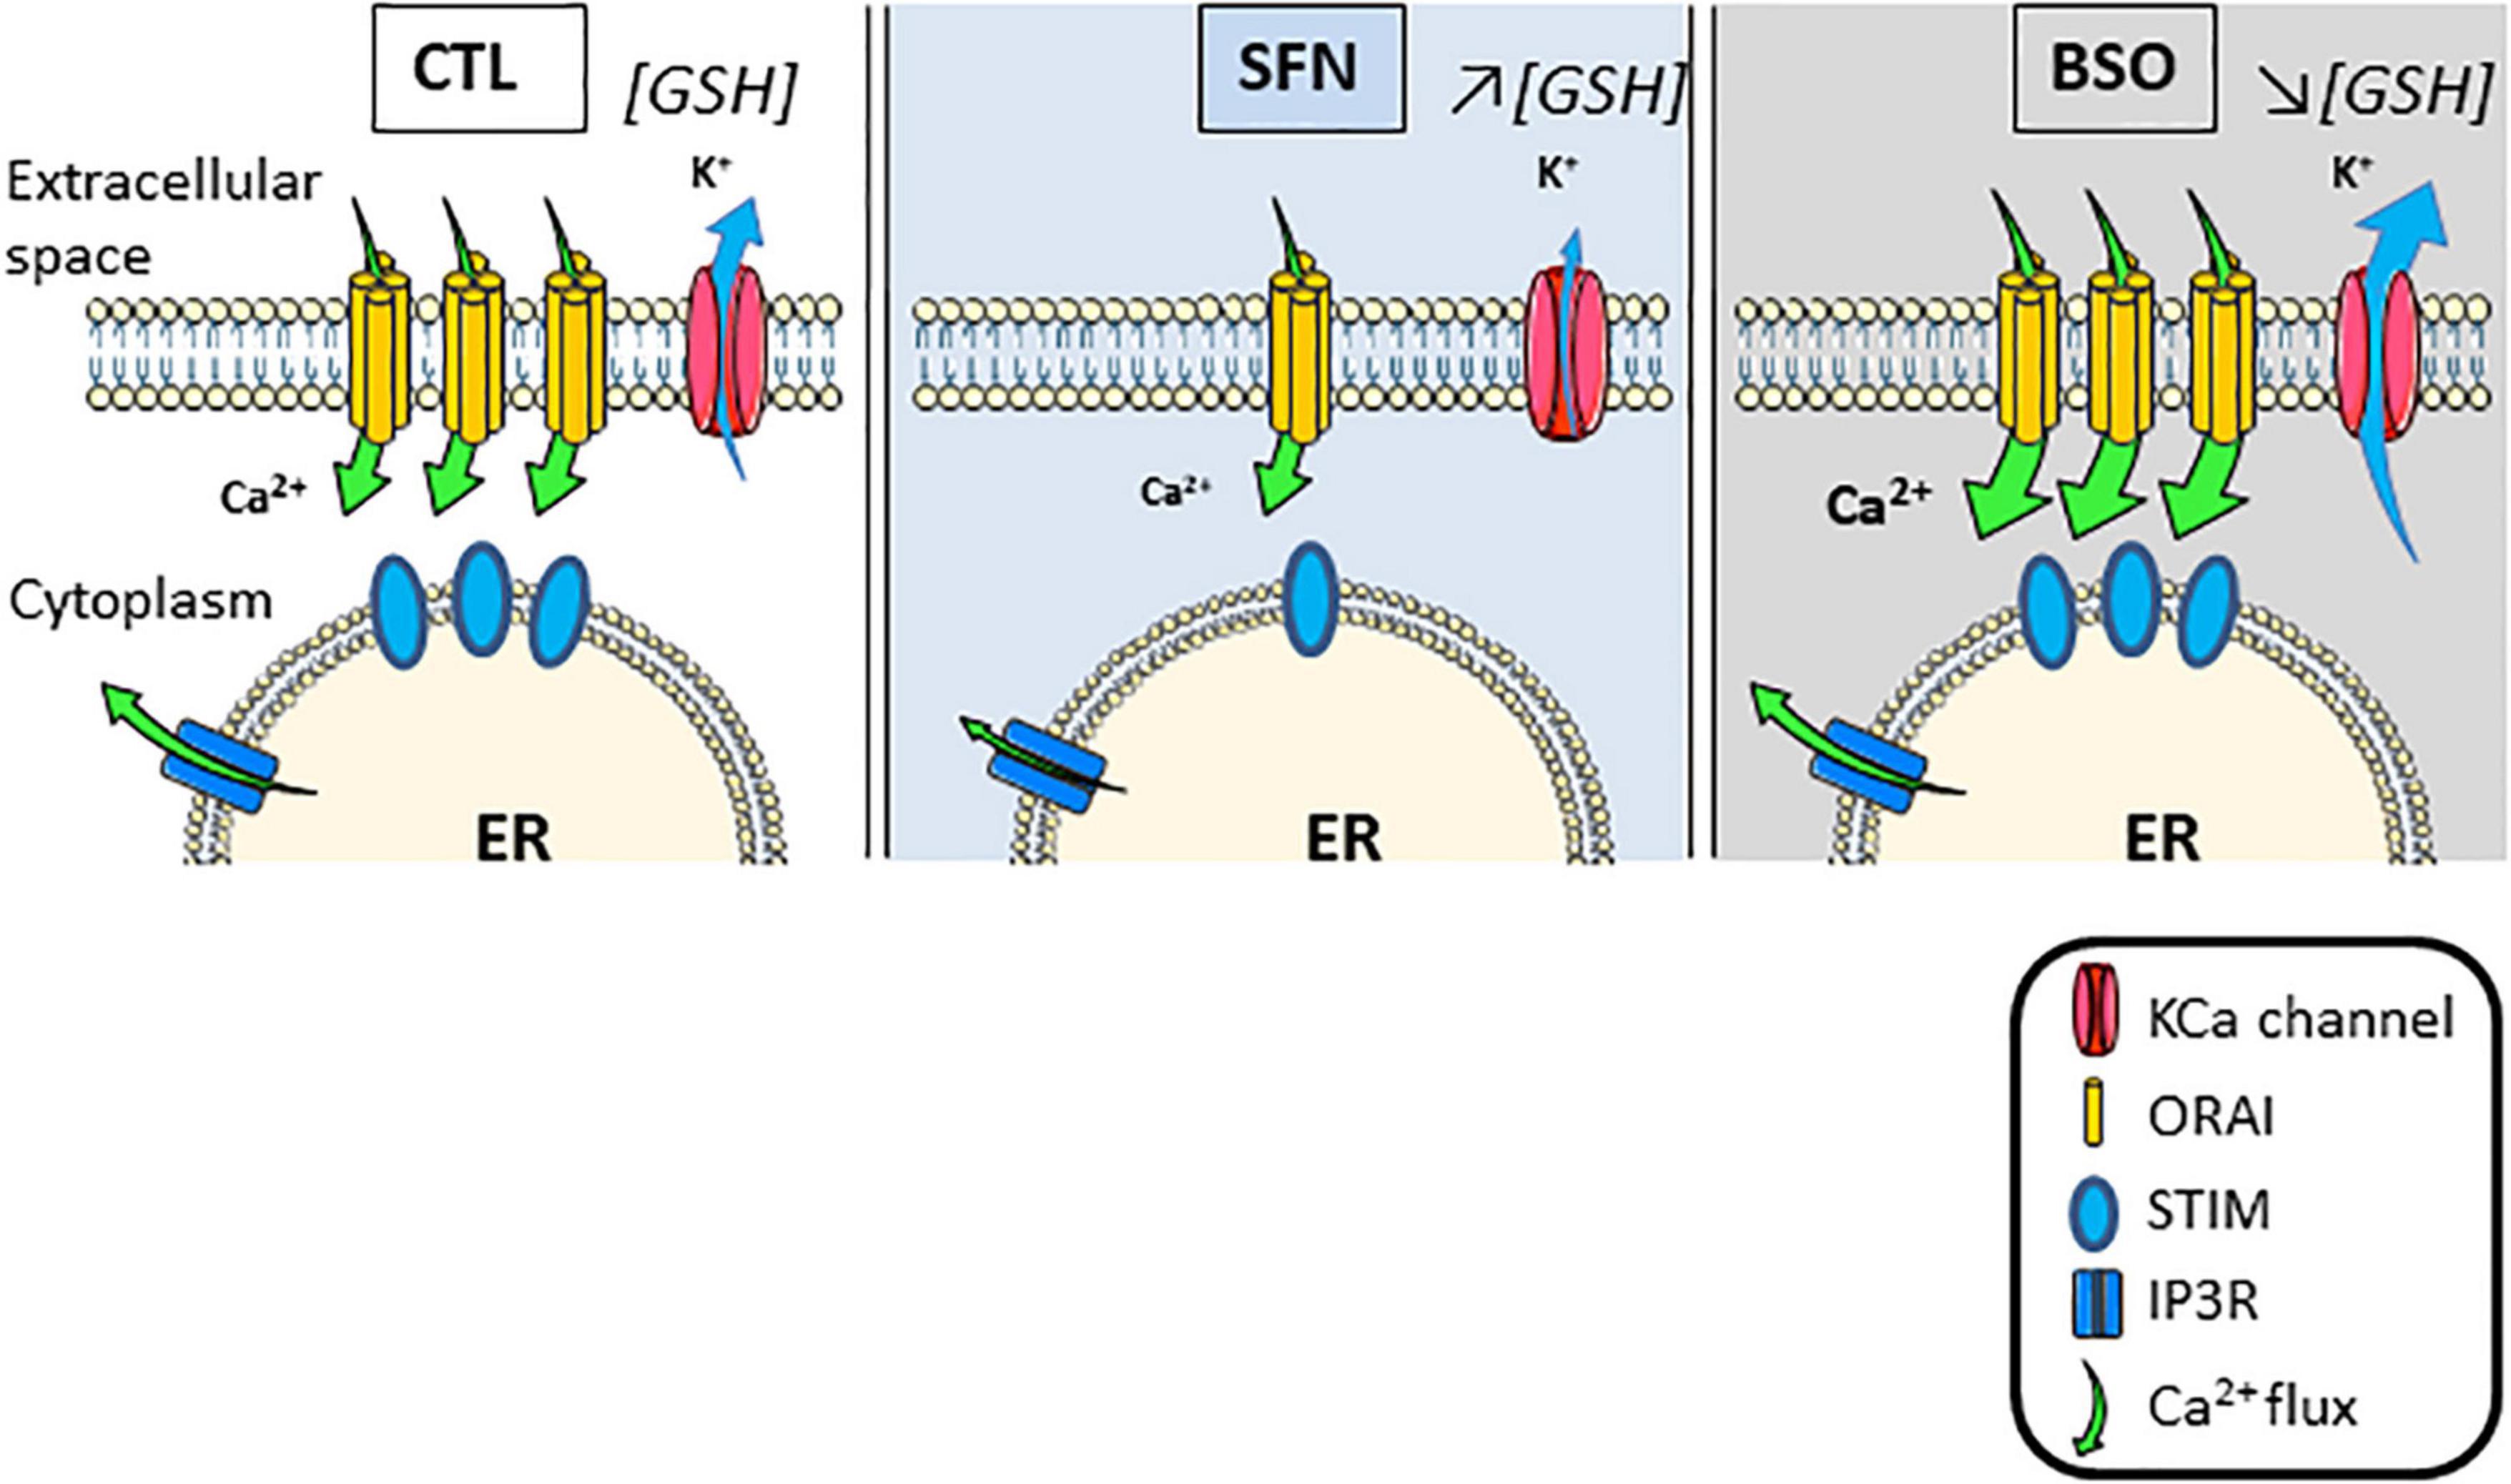
Figure 8. Scheme summarizing the adaptations of store-operated Ca2+ entry triggered by IP3 and initiated by [GSH]i changes.
Surprisingly, SOCE elicited by SERCA blockade with cyclopiazonic acid is rather insensitive to both BSO- and SFN-pretreatment. This could be linked to the fact that SERCA inhibition leads to great amounts of Ca2+ released from the ER which may overwhelm redox-mediated changes of CRAC (Kraft, 2015). Indeed, previous works have shown that STIM2 activation was more likely associated with moderate ER Ca2+ mobilization, while STIM1 could be recruited by strong ER Ca2+ depletion (Thiel et al., 2013). Interestingly, we observe that STIM1 gene protein expression remains constant independently of the treatment, while STIM2 gene and protein expressions are reduced by SFN pretreatment. These data could explain why no changes in SOCE induced by SERCA inhibition could be evidenced, especially in SFN-treated cells. Moreover, this reinforces the fact that GSH depletion modulates only physiological relevant stimuli as P2Y receptors activation and oxidative stress.
We have also tested whether redox-sensitive TRP channels including TRPC1, TRPM7 and TRPV1 gene expression in C6 was changed by [GSH]I manipulations as they can produce cell adaptations to oxidative environment (Sakaguchi and Mori, 2020). We had previously shown that TRPV1 channels supported both cell sensitivity to oxidative stress and glutamate-induced SOCE in cultured neurons (Crouzin et al., 2010). In SFN-treated cells, TRPV1 gene expression was significantly enhanced. However, the direct activation of TRPV1 channels with capsaicin did not elicit any Ca2+ rise in these cells whatever the treatment. In addition, TRPA1 gene was inconsistently detected in C6 cells. The application of TRPA1 agonist JT010 (10 μM) did not elicit any changes in [Ca2+]i.
SFN “anti-aging” effect is known to involve the activation of the Nrf2 pathway and the stimulation of ARE DNA sequences and subsequent expression of antioxidant enzymes. Our data suggest that Nrf2 activation could also modulate SOCE-associated proteins gene expression leading to changes in Orai proteins both sensitive and insensitive to oxidization. Indeed, Orai3 protein, in comparison to Orai1, lacks the homolog of cysteine 195 residue which is reactive to oxidation (Bogeski et al., 2012). In this line, SFN has been demonstrated to activate genomic pathways independently of the Nrf2/ARE pathway leading to cell protection. Indeed, while the activation this pathway may repress the expression of many proteins involved in neuronal degeneration such as BACE (Bahn et al., 2019), SFN may trigger various intracellular pathways independently of Nrf2/ARE, including epigenetic mechanisms (Santín-Márquez et al., 2019), resulting in the reduced expression of proinflammatory proteins (An et al., 2016; Park et al., 2017). Such actions could explain the discrepancy observed here between SFN stimulatory action on mRNA expression and its concomitant repression of protein expression.
Astrocytes undergo complex changes during aging and neurodegenerative diseases. Indeed, in one hand, their activation is involved in neuroinflammation which endanger neurons via cytokines overproduction and on the other hand, atrophy and loss of activity leads to reduced neuronal protection (Rodríguez-Arellano et al., 2016; Verkhratsky, 2019). In this line, normal aging by itself appears to trigger astrocyte activation (Clarke et al., 2018). Studies performed on cultured astrocytes have shown that “old” astrocytes become more sensitive to oxidative stress elicited by tBuOOH and exhibit changes in intracellular calcium homeostasis as purinergic responses are magnified (Lin et al., 2007). These data are in good agreement with the data that we have obtained on BSO-treated cells. Moreover, Lin et al. (2007) had observed that old astrocytes are more prone to exhibit Ca2+ oscillations than young ones under purinergic stimulation. These oscillations may involve a cooperation between KCa potassium channels and CRAC. Astrocytes express KCa channels mediating Ca2+-dependent potassium currents (Verkhratsky and Nedergaard, 2018). These channels may co-localize with CRAC in many cell types (Guéguinou et al., 2014), including many cancer cell types where proliferation has been shown to be supported KCa3.1 channel activity (Klumpp et al., 2017). Moreover, the interaction between KCa3.1 and CRAC regulates [Ca2+]i oscillations in glioblastoma (Catacuzzeno and Franciolini, 2018). We find here that the stimulation of P2Y receptors elicited KCa currents which were magnified by BSO treatment and sensitive to CRAC blocker GSK-7975A. Interestingly, such a dependence of KCa3.1 on CRAC activation has also been evidenced in human mast cells. This mechanism seems to be required for IgE-mediated release of histamine from these cells (Duffy et al., 2015). One may thus speculate, that such an interaction could also play a critical role in the release of cytokines from astrocytes activated under oxidative stress conditions, as evidenced in several glial cell types (Lee et al., 2010). It could also account for dysfunction in Ca2+ homeostasis observed during aging (Lin et al., 2007) and under pathological conditions involving oxidative stress as Huntington’s disease (Jiang et al., 2016) and other models of neurodegenerative diseases (Shigetomi et al., 2019).
Although C6 astroglioma cells recapitulates most of the features of astrocytes and represent a suitable model to evaluate oxidative stress-induced toxicity and resistance, these cells are deriving from tumors and they could thus acquire specific phenotype with regard to oxidative stress handling. Indeed, cancer cells have developed metabolic strategies to prevent detrimental actions of ROS on themselves while they produce ROS in large amounts as oxidative stress required for tissue invasion. In this line, the overactivity of Nrf2 pathway appears to be a hallmark of cancer cells (Sporn and Liby, 2013; Rojo de la Vega et al., 2018). Therefore, compared to native astrocytes, one could expect that C6 cells exhibit increased resistance to oxidative stress. We may thus have underestimated the sensitive threshold to ROS in these cells. Further experiments should be performed on in situ astrocytes to evaluate their sensitivity to ROS with aging.
The original contributions presented in the study are included in the article/supplementary material, further inquiries can be directed to the corresponding author/s.
NM, YS, TC, JG, CC-S, JR, and MV performed the experiments. NM, TC, JG, PC, J-BT, M-CJ, AB, MR, CM, JR, and MV designed the experiments and analyzed the data. All authors contributed to the article and approved the submitted version.
Funding was provided by CNRS and the University of Montpellier.
The authors declare that the research was conducted in the absence of any commercial or financial relationships that could be construed as a potential conflict of interest.
All claims expressed in this article are solely those of the authors and do not necessarily represent those of their affiliated organizations, or those of the publisher, the editors and the reviewers. Any product that may be evaluated in this article, or claim that may be made by its manufacturer, is not guaranteed or endorsed by the publisher.
An, Y. W., Jhang, K. A., Woo, S. Y., Kang, J. L., and Chong, Y. H. (2016). Sulforaphane exerts its anti-inflammatory effect against amyloid-β peptide via STAT-1 dephosphorylation and activation of Nrf2/HO-1 cascade in human THP-1 macrophages. Neurobiol. Aging 38, 1–10. doi: 10.1016/j.neurobiolaging.2015.10.016
Assis, L. C., Straliotto, M. R., Engel, D., Hort, M. A., Dutra, R. C., and de Bem, A. F. (2014). β-Caryophyllene protects the C6 glioma cells against glutamate-induced excitotoxicity through the Nrf2 pathway. Neuroscience 279, 220–231. doi: 10.1016/j.neuroscience.2014.08.043
Bahn, G., Park, J. S., Yun, U. J., Lee, Y. J., Choi, Y., Park, J. S., et al. (2019). NRF2/ARE pathway negatively regulates BACE1 expression and ameliorates cognitive deficits in mouse Alzheimer’s models. Proc. Natl. Acad. Sci. U.S.A. 116, 12516–12523. doi: 10.1073/pnas.1819541116
Baxter, P. S., and Hardingham, G. E. (2016). Adaptive regulation of the brain’s antioxidant defences by neurons and astrocytes. Free Radic. Biol. Med. 100, 147–152. doi: 10.1016/j.freeradbiomed.2016.06.027
Bjørklund, G., Tinkov, A. A., Hosnedlová, B., Kizek, R., Ajsuvakova, O. P., Chirumbolo, S., et al. (2020). The role of glutathione redox imbalance in autism spectrum disorder: a review. Free Radic. Biol. Med. 160, 149–162. doi: 10.1016/j.freeradbiomed.2020.07.017
Bogeski, I., Kilch, T., and Niemeyer, B. A. (2012). ROS and SOCE: recent advances and controversies in the regulation of STIM and Orai. J. Physiol. 590, 4193–4200. doi: 10.1113/jphysiol.2012.230565
Bogeski, I., Kummerow, C., Al-Ansary, D., Schwarz, E. C., Koehler, R., Kozai, D., et al. (2010). Differential redox regulation of ORAI ion channels: a mechanism to tune cellular Calcium signaling. Sci. Signal. 3, 1–10. doi: 10.1126/scisignal.2000672
Bolaños, J. P. (2016). Bioenergetics and redox adaptations of astrocytes to neuronal activity. J. Neurochem. 139, 115–125. doi: 10.1111/jnc.13486
Catacuzzeno, L., and Franciolini, F. (2018). Role of KCa3.1 channels in modulating Ca2+ oscillations during glioblastoma cell migration and invasion. Int. J. Mol. Sci. 19, 1–15. doi: 10.3390/ijms19102970
Chen, Y., Qin, C., Huang, J., Tang, X., Liu, C., Huang, K., et al. (2020). The role of astrocytes in oxidative stress of central nervous system: a mixed blessing. Cell Prolif. 53, 1–13. doi: 10.1111/cpr.12781
Clarke, L. E., Liddelow, S. A., Chakraborty, C., Münch, A. E., Heiman, M., and Barres, B. A. (2018). Normal aging induces A1-like astrocyte reactivity. Proc. Natl. Acad. Sci. U.S.A. 115, E1896–E1905. doi: 10.1073/pnas.1800165115
Crouzin, N., de Jesus Ferreira, M. C., Cohen-Solal, C., Aimar, R. F., Vignes, M., and Guiramand, J. (2007). α-Tocopherol-mediated long-lasting protection against oxidative damage involves an attenuation of calcium entry through TRP-like channels in cultured hippocampal neurons. Free Radic. Biol. Med. 42, 1326–1337. doi: 10.1016/j.freeradbiomed.2007.01.032
Crouzin, N., de Jesus Ferreira, M. C., Cohen-Solal, C., Barbanel, G., Guiramand, J., and Vignes, M. (2010). Neuroprotection induced by vitamin e against oxidative stress in hippocampal neurons: involvement of TRPV1 channels. Mol. Nutr. Food Res. 54, 496–505. doi: 10.1002/mnfr.200900188
De Jesus Ferreira, M. C., Crouzin, N., Barbanel, G., Cohen-Solal, C., Récasens, M., Vignes, M., et al. (2005). A transient treatment of hippocampal neurons with α-tocopherol induces a long-lasting protection against oxidative damage via a genomic action. Free Radic. Biol. Med. 39, 1009–1020. doi: 10.1016/j.freeradbiomed.2005.05.021
Do, K. Q., Trabesinger, A. H., Kirsten-Krüger, M., Lauer, C. J., Dydak, U., Hell, D., et al. (2000). Schizophrenia: glutathione deficit in cerebrospinal fluid and prefrontal cortex in vivo. Eur. J. Neurosci. 12, 3721–3728. doi: 10.1046/j.1460-9568.2000.00229.x
Dringen, R., Kussmaul, L., Gutterer, J. M., Hirrlinger, J., and Hamprecht, B. (1999). The glutathione system of peroxide detoxification is less efficient in neurons than in astroglial cells. J. Neurochem. 72, 2523–2530. doi: 10.1046/j.1471-4159.1999.0722523.x
Duffy, S. M., Ashmole, I., Smallwood, D. T., Leyland, M. L., and Bradding, P. (2015). Orai/CRACM1 and KCa3.1 ion channels interact in the human lung mast cell plasma membrane. Cell Commun. Signal. 13, 1–10. doi: 10.1186/s12964-015-0112-z
Galland, F., Seady, M., Taday, J., Smaili, S. S., Gonçalves, C. A., and Leite, M. C. (2019). Astrocyte culture models: molecular and function characterization of primary culture, immortalized astrocytes and C6 glioma cells. Neurochem. Int. 131:104538. doi: 10.1016/j.neuint.2019.104538
Gibhardt, C. S., Cappello, S., Bhardwaj, R., Schober, R., Kirsch, S. A., Bonilla del Rio, Z., et al. (2020). Oxidative stress-induced STIM2 cysteine modifications suppress store-operated calcium entry. Cell Rep. 33:108292. doi: 10.1016/j.celrep.2020.108292
Grynkiewicz, G., Poenie, M., and Tsien, R. Y. (1985). A new generation of Ca2+ indicators with greatly improved fluorescence properties. J. Biol. Chem. 260, 3440–3450.
Gu, F., Chauhan, V., and Chauhan, A. (2015). Glutathione redox imbalance in brain disorders. Curr. Opin. Clin. Nutr. Metab. Care 18, 89–95. doi: 10.1097/MCO.0000000000000134
Guéguinou, M., ChantÔme, A., Fromont, G., Bougnoux, P., Vandier, C., and Potier-Cartereau, M. (2014). KCa and Ca2+ channels: the complex thought. Biochim. Biophys. Acta Mol. Cell Res. 1843, 2322–2333. doi: 10.1016/j.bbamcr.2014.02.019
Hardingham, G. E., and Do, K. Q. (2016). Linking early-life NMDAR hypofunction and oxidative stress in schizophrenia pathogenesis. Nat. Rev. Neurosci. 17, 125–134. doi: 10.1038/nrn.2015.19
Henke, N., Albrecht, P., Bouchachia, I., Ryazantseva, M., Knoll, K., Lewerenz, J., et al. (2013). The plasma membrane channel ORAI1 mediates detrimental calcium influx caused by endogenous oxidative stress. Cell Death Dis. 4, e470–e479. doi: 10.1038/cddis.2012.216
Jiang, R., Diaz-Castro, B., Looger, L. L., and Khakh, B. S. (2016). Dysfunctional calcium and glutamate signaling in striatal astrocytes from Huntington’s disease model mice. J. Neurosci. 36, 3453–3470. doi: 10.1523/JNEUROSCI.3693-15.2016
Johnson, W. M., Wilson-Delfosse, A. L., and Mieyal, J. J. (2012). Dysregulation of glutathione homeostasis in neurodegenerative diseases. Nutrients 4, 1399–1440. doi: 10.3390/nu4101399
Klumpp, L., Sezgin, E. C., Skardelly, M., Eckert, F., and Huber, S. M. (2017). KCa3.1 channels and glioblastoma: in vitro studies. Curr. Neuropharmacol. 15, 627–635. doi: 10.2174/1570159x15666170808115821
Kraft, A. D., Johnson, D. A., and Johnson, J. A. (2004). Nuclear factor E2-related factor 2-dependent antioxidant response element activation by tert-butylhydroquinone and sulforaphane occurring preferentially in astrocytes conditions neurons against oxidative insult. J. Neurosci. 24, 1101–1112. doi: 10.1523/JNEUROSCI.3817-03.2004
Kraft, R. (2015). STIM and ORAI proteins in the nervous system. Channels 9, 245–252. doi: 10.1080/19336950.2015.1071747
Kubben, N., Zhang, W., Wang, L., Voss, T. C., Yang, J., Qu, J., et al. (2016). Repression of the antioxidant NRF2 pathway in premature aging. Cell 165, 1361–1374. doi: 10.1016/j.cell.2016.05.017
Kulak, A., Steullet, P., Cabungcal, J. H., Werge, T., Ingason, A., Cuenod, M., et al. (2013). Redox dysregulation in the pathophysiology of schizophrenia and bipolar disorder: insights from animal models. Antioxid. Redox Signal. 18, 1428–1443. doi: 10.1089/ars.2012.4858
Lanté, F., Meunier, J., Guiramand, J., Maurice, T., Cavalier, M., de Jesus Ferreira, M. C., et al. (2007). Neurodevelopmental damage after prenatal infection: role of oxidative stress in the fetal brain. Free Radic. Biol. Med. 42, 1231–1245. doi: 10.1016/j.freeradbiomed.2007.01.027
Lavoie, S., Berger, M., Schlögelhofer, M., Schäfer, M. R., Rice, S., Kim, S. W., et al. (2017). Erythrocyte glutathione levels as long-term predictor of transition to psychosis. Transl. Psychiatry 7, 6–10. doi: 10.1038/tp.2017.30
Lee, M., Cho, T., Jantaratnotai, N., Wang, Y. T., McGeer, E., and McGeer, P. L. (2010). Depletion of GSH in glial cells induces neurotoxicity: relevance to aging and degenerative neurological diseases. FASEB J. 24, 2533–2545. doi: 10.1096/fj.09-149997
Lin, D. T., Wu, J., Holstein, D., Upadhyay, G., Rourk, W., Muller, E., et al. (2007). Ca2+ signaling, mitochondria and sensitivity to oxidative stress in aging astrocytes. Neurobiol. Aging 28, 99–111. doi: 10.1016/j.neurobiolaging.2005.11.004
Lu, S. C. (2013). Glutathione synthesis. Biochim. Biophys. Acta Gen. Subj. 1830, 3143–3153. doi: 10.1016/j.bbagen.2012.09.008
Murugaiyah, V., and Mattson, M. P. (2015). Neurohormetic phytochemicals: an evolutionary-bioenergetic perspective. Neurochem. Int. 89, 271–280. doi: 10.1016/j.neuint.2015.03.009
Park, Y. K., Ramalingam, M., Kim, S., Jang, B. C., and Park, J. W. (2017). Sulforaphane inhibits the interferon-γ-induced expression of MIG, IP-10 and I-TAC in INS-1 pancreatic β-cells through the downregulation of IRF-1, STAT-1 and PKB. Int. J. Mol. Med. 40, 907–912. doi: 10.3892/ijmm.2017.3054
Raefsky, S. M., and Mattson, M. P. (2017). Adaptive responses of neuronal mitochondria to bioenergetic challenges: roles in neuroplasticity and disease resistance. Free Radic. Biol. Med. 102, 203–216. doi: 10.1016/j.freeradbiomed.2016.11.045
Rao, W., Zhang, L., Su, N., Wang, K., Hui, H., Wang, L., et al. (2013). Blockade of SOCE protects HT22 cells from hydrogen peroxide-induced apoptosis. Biochem. Biophys. Res. Commun. 441, 351–356. doi: 10.1016/j.bbrc.2013.10.054
Robledinos-Antón, N., Fernández-Ginés, R., Manda, G., and Cuadrado, A. (2019). Activators and inhibitors of NRF2: a review of their potential for clinical development. Oxid. Med. Cell. Longev. 2019:9372182. doi: 10.1155/2019/9372182
Rodríguez-Arellano, J. J., Parpura, V., Zorec, R., and Verkhratsky, A. (2016). Astrocytes in physiological aging and Alzheimer’s disease. Neuroscience 323, 170–182. doi: 10.1016/J.NEUROSCIENCE.2015.01.007
Rojo de la Vega, M., Chapman, E., and Zhang, D. D. (2018). NRF2 and the hallmarks of cancer. Cancer Cell 34, 21–43. doi: 10.1016/j.ccell.2018.03.022
Sakaguchi, R., and Mori, Y. (2020). Transient receptor potential (TRP) channels: biosensors for redox environmental stimuli and cellular status. Free Radic. Biol. Med. 146, 36–44. doi: 10.1016/j.freeradbiomed.2019.10.415
Santín-Márquez, R., Alarcón-Aguilar, A., López-Diazguerrero, N. E., Chondrogianni, N., and Königsberg, M. (2019). Sulforaphane–role in aging and neurodegeneration. Geroscience 41, 655–670. doi: 10.1007/s11357-019-00061-7
Satoh, T., Harada, N., Hosoya, T., Tohyama, K., Yamamoto, M., and Itoh, K. (2009). Keap1/Nrf2 system regulates neuronal survival as revealed through study of keap1 gene-knockout mice. Biochem. Biophys. Res. Commun. 380, 298–302. doi: 10.1016/j.bbrc.2009.01.063
Schmidlin, C. J., Dodson, M. B., Madhavan, L., and Zhang, D. D. (2019). Redox regulation by NRF2 in aging and disease. Free Radic. Biol. Med. 134, 702–707. doi: 10.1016/j.freeradbiomed.2019.01.016
Shigetomi, E., Saito, K., Sano, F., and Koizumi, S. C. (2019). Aberrant calcium signals in reactive astrocytes: a key process in neurological disorders. Int. J. Mol. Sci. 20:996. doi: 10.3390/ijms20040996
Shih, A. Y., Johnson, D. A., Wong, G., Kraft, A. D., Jiang, L., Erb, H., et al. (2003). Coordinate regulation of glutathione biosynthesis and release by Nrf2-expressing glia potently protects neurons from oxidative stress. J. Neurosci. 23, 3394–3406. doi: 10.1523/jneurosci.23-08-03394.2003
Silva-Palacios, A., Zazueta, C., and Königsberg, M. (2016). Nrf2 signaling and redox homeostasis in the aging heart: a potential target to prevent cardiovascular diseases? Ageing Res. Rev. 26, 81–95. doi: 10.1016/j.arr.2015.12.005
Singh, A., Kukreti, R., Saso, L., and Kukreti, S. (2019). Oxidative stress: a key modulator in neurodegenerative diseases. Molecules 24, 1–20. doi: 10.3390/molecules24081583
Socodato, R., Portugal, C. C., Rodrigues, A., Henriques, J., Rodrigues, C., Figueira, C., et al. (2018). Redox tuning of Ca2+ signaling in microglia drives glutamate release during hypoxia. Free Radic. Biol. Med. 118, 137–149. doi: 10.1016/j.freeradbiomed.2018.02.036
Sporn, M. B., and Liby, K. T. (2013). NRF2 the good the bad and the importance of the context. Nat. Rev. Cancer 12, 1–24. doi: 10.1038/nrc3278.NRF2
Suzuki, T., Motohashi, H., and Yamamoto, M. (2013). Toward clinical application of the Keap1-Nrf2 pathway. Trends Pharmacol. Sci. 34, 340–346. doi: 10.1016/j.tips.2013.04.005
Thiel, M., Lis, A., and Penner, R. (2013). STIM2 drives Ca2+ oscillations through store-operated Ca2+ entry caused by mild store depletion. J. Physiol. 591, 1433–1445. doi: 10.1113/jphysiol.2012.245399
Tosic, M., Ott, J., Barral, S., Bovet, P., Deppen, P., Gheorghita, F., et al. (2006). Schizophrenia and oxidative stress: glutamate cysteine ligase modifier as a susceptibility gene. Am. J. Hum. Genet. 79, 586–592. doi: 10.1086/507566
Verkhratsky, A. (2019). Astroglial calcium signaling in aging and Alzheimer’s disease. Cold Spring Harb. Perspect. Biol. 11:a035188. doi: 10.1101/cshperspect.a035188
Verkhratsky, A., and Nedergaard, M. (2018). Physiology of astroglia. Physiol. Rev. 98, 239–389. doi: 10.1152/physrev.00042.2016
Wong, H. M., and Tepperman, B. L. (1994). Reduced glutathione modulates Ca2+-mediated damage to rabbit isolated gastric mucosal cells. Am. J. Physiol. Gastrointest. Liver Physiol. 267, G1–G9. doi: 10.1152/ajpgi.1994.267.1.G1
Keywords: GSH (glutathione), store-operated calcium entry, sulforaphane, BSO (l-buthionine-sulfoximine), STIM and Orai, GSK 7975A, CRAC channel
Citation: Mokrane N, Snabi Y, Cens T, Guiramand J, Charnet P, Bertaud A, Menard C, Rousset M, de Jesus Ferreira M-C, Thibaud J-B, Cohen-Solal C, Vignes M and Roussel J (2021) Manipulations of Glutathione Metabolism Modulate IP3-Mediated Store-Operated Ca2+ Entry on Astroglioma Cell Line. Front. Aging Neurosci. 13:785727. doi: 10.3389/fnagi.2021.785727
Received: 29 September 2021; Accepted: 01 December 2021;
Published: 17 December 2021.
Edited by:
Gustavo Provensi, University of Florence, ItalyReviewed by:
Mónica López-Hidalgo, National Autonomous University of Mexico, MexicoCopyright © 2021 Mokrane, Snabi, Cens, Guiramand, Charnet, Bertaud, Menard, Rousset, de Jesus Ferreira, Thibaud, Cohen-Solal, Vignes and Roussel. This is an open-access article distributed under the terms of the Creative Commons Attribution License (CC BY). The use, distribution or reproduction in other forums is permitted, provided the original author(s) and the copyright owner(s) are credited and that the original publication in this journal is cited, in accordance with accepted academic practice. No use, distribution or reproduction is permitted which does not comply with these terms.
*Correspondence: Michel Vignes, bWljaGVsLnZpZ25lc0B1bW9udHBlbGxpZXIuZnI=; Julien Roussel, anVsaWVuLnJvdXNzZWxAdW1vbnRwZWxsaWVyLmZy
Disclaimer: All claims expressed in this article are solely those of the authors and do not necessarily represent those of their affiliated organizations, or those of the publisher, the editors and the reviewers. Any product that may be evaluated in this article or claim that may be made by its manufacturer is not guaranteed or endorsed by the publisher.
Research integrity at Frontiers
Learn more about the work of our research integrity team to safeguard the quality of each article we publish.