- 1Krembil Centre for Neuroinformatics, Centre for Addiction and Mental Health, Toronto, ON, Canada
- 2Campbell Family Mental Health Research Institute, Centre for Addiction and Mental Health, Toronto, ON, Canada
- 3Department of Psychiatry, University of Toronto, Toronto, ON, Canada
- 4Institute for Medical Science, University of Toronto, Toronto, ON, Canada
Parkinson’s disease causes severe motor and cognitive disabilities that result from the progressive loss of dopamine neurons in the substantia nigra. The rs12456492 variant in the RIT2 gene has been repeatedly associated with increased risk for Parkinson’s disease. From a transcriptomic perspective, a meta-analysis found that RIT2 gene expression is correlated with pH in the human brain. To assess these pH associations in relation to Parkinson’s disease risk, we examined the two datasets that assayed rs12456492, gene expression, and pH in the postmortem human brain. Using the BrainEAC dataset, we replicate the positive correlation between RIT2 gene expression and pH in the human brain (n = 100). Furthermore, we found that the relationship between expression and pH is influenced by rs12456492. When tested across ten brain regions, this interaction is specifically found in the substantia nigra. A similar association was found for the co-localized SYT4 gene. In addition, SYT4 associations are stronger in a combined model with both genes, and the SYT4 interaction appears to be specific to males. In the Genotype-Tissue Expression (GTEx) dataset, the pH associations involving rs12456492 and expression of either SYT4 and RIT2 were not seen. This null finding may be due to the short postmortem intervals of the GTEx tissue samples. In the BrainEAC data, we tested the effect of postmortem interval and only observed the interactions in samples with the longer intervals. These previously unknown associations suggest novel roles for rs12456492, RIT2, and SYT4 in the regulation and response to pH in the substantia nigra.
Introduction
Parkinson’s disease (PD) is a common neurodegenerative disease characterized by the loss of dopamine neurons in the substantia nigra. Individuals with PD show severe motor and cognitive disabilities. The etiology of PD is complex, with multiple genetic (Nalls et al., 2019) and environmental risk factors [reviewed in Bellou et al. (2016)]. A deeper understanding of interactions between these factors may reveal new insights into PD pathophysiology.
Recent genome-wide association studies (GWAS) of sporadic PD found that common genetic variants explain 16–36% of heritable risk (Nalls et al., 2019). Most experimental studies have focused on genes that have been associated with both monogenic and sporadic forms of PD. These include alpha-synuclein (SNCA), leucine-rich repeat kinase 2 (LRRK2), and glucosylceramidase beta (GBA) (Chang et al., 2017). However, over 90 independent risk signals have been identified. These recent GWAS hits are underexplored in the context of PD. For example, the rs12456492 polymorphism was first associated with PD in a 2011 GWAS study (Do et al., 2011). Subsequent studies have replicated this locus on chromosome 18, confirming an association with PD (Nalls et al., 2019). The most common allele, A, with a frequency of 68%, is associated with a lower incidence of PD (odds ratio: 0.906). Conversely, the minor G allele is associated with PD risk. As shown in Figure 1, rs12456492 is located within an intron of the Ras Like Without CAAX 2 (RIT2) gene and is in linkage disequilibrium with polymorphisms in the nearby Synaptotagmin 4 gene (SYT4) (Pankratz et al., 2012). RIT2 binds to dopamine transporters, guanosine triphosphate, and calmodulin (Lee et al., 1996; Navaroli et al., 2011). The SYT4 gene is a member of the synaptotagmin family and regulates synaptic transmission (Dean et al., 2009). In the context of PD, Mendez et al. (2011) demonstrated that somatodendritic dopamine release depends on SYT4. However, the RIT2 and SYT4 genes have not been extensively characterized in relation to PD.

Figure 1. Genomic context of rs12456492 obtained from the homo sapiens genome assembly hg18 and visualized with the UCSC Genome Browser (Kent et al., 2002). The red vertical line marks the position of rs12456492.
In a cross laboratory comparison of expression profiling data from normal human postmortem brains, Mistry and Pavlidis (2010) identified a robust correlation between RIT2 and tissue pH. This meta-analysis included 11 studies that provided 421 cortical transcriptomes. Genome-wide, RIT2 was ranked tenth on the pH up-regulation list of 15,845 genes. The regulation of pH within the brain is crucial for proper physiological functioning. Specifically, impairment in this regulation can alter neuronal state leading to physiopathological conditions [reviewed in Sinning and Hübner (2013)]. Thus, the Mistry and Pavlidis meta-analysis results suggest that RIT2 may be involved in neural pH regulation and response.
Several studies have examined pH-dependent interactions in the context of Parkinson’s disease. For example, in comparison to neutral or physiological pH of 7 or 7.4, α-synuclein aggregation and stability are increased in acidic conditions (pH 4–5) (Pham et al., 2009; Lv et al., 2016). In addition, β-synuclein, an inhibitor of α-synuclein aggregation, is sensitive to pH and forms fibrils in mildly acidic pH (5.8) (Moriarty et al., 2017; Williams et al., 2018). Using quantum chemical methods, Umek et al. (2018) determined that an acidic environment is required to prevent dopamine autoxidation. Kinetic modeling has also revealed that pH interactions with iron and dopamine could lead to oxidative stress (Sun et al., 2018). Caffeine consumption is associated with mild alkalosis (Tajima, 2010) and a decreased risk of PD [reviewed in Costa et al. (2010)]. We also note that RIT2 is differentially co-expressed with interferon-gamma signaling genes in substantia nigra samples from PD cases (Liscovitch and French, 2014). While indirect, interferon-gamma is acid-labile, and its overexpression in mice causes nigrostriatal neurodegeneration (Piasecki, 1999; Chakrabarty et al., 2011). Mitochondria, which internally maintain an alkaline pH, are thought to be dysfunctional in PD [reviewed in Chen et al. (2019)]. Mitochondrial dysfunction can lead to oxidative stress, resulting in lactic and intraneuronal acidosis (Koga et al., 2006; Arias et al., 2008; Balut et al., 2008). Recently, Rango et al. found that carriers of PINK1 mutations, which are associated with early-onset PD, have abnormal pH levels in the visual cortex. Specifically, carriers of homozygous PINK1 mutations had a higher pH at rest when compared to healthy controls and patients without PINK1 mutations. Unlike healthy controls, pH did not increase upon activation in homozygous PINK1 mutation carriers (Rango et al., 2020). PARK7 (DJ-1), another early-onset PD gene, is associated with pH. Specifically, acidic isoforms appear after oxidative stress (Bandopadhyay et al., 2004; Canet-Avilés et al., 2004). Taken together, these findings motivate a deeper characterization of pH, SYT4, and RIT2 in the context of PD.
In this study, we use the BrainEAC data to replicate the correlation between RIT2 expression and pH. In addition, we further test for associations between SYT4 and pH. We characterize interactions involving a co-localized genetic risk variant for PD, pH, RIT2, and SYT4 gene expression. We explore these interactions in two independent postmortem brain datasets and test the impact of PMI and sex. We also perform co-expression searches to associate genes of known function to RIT2 and SYT4. Figure 2 provides an overview of these analyses.
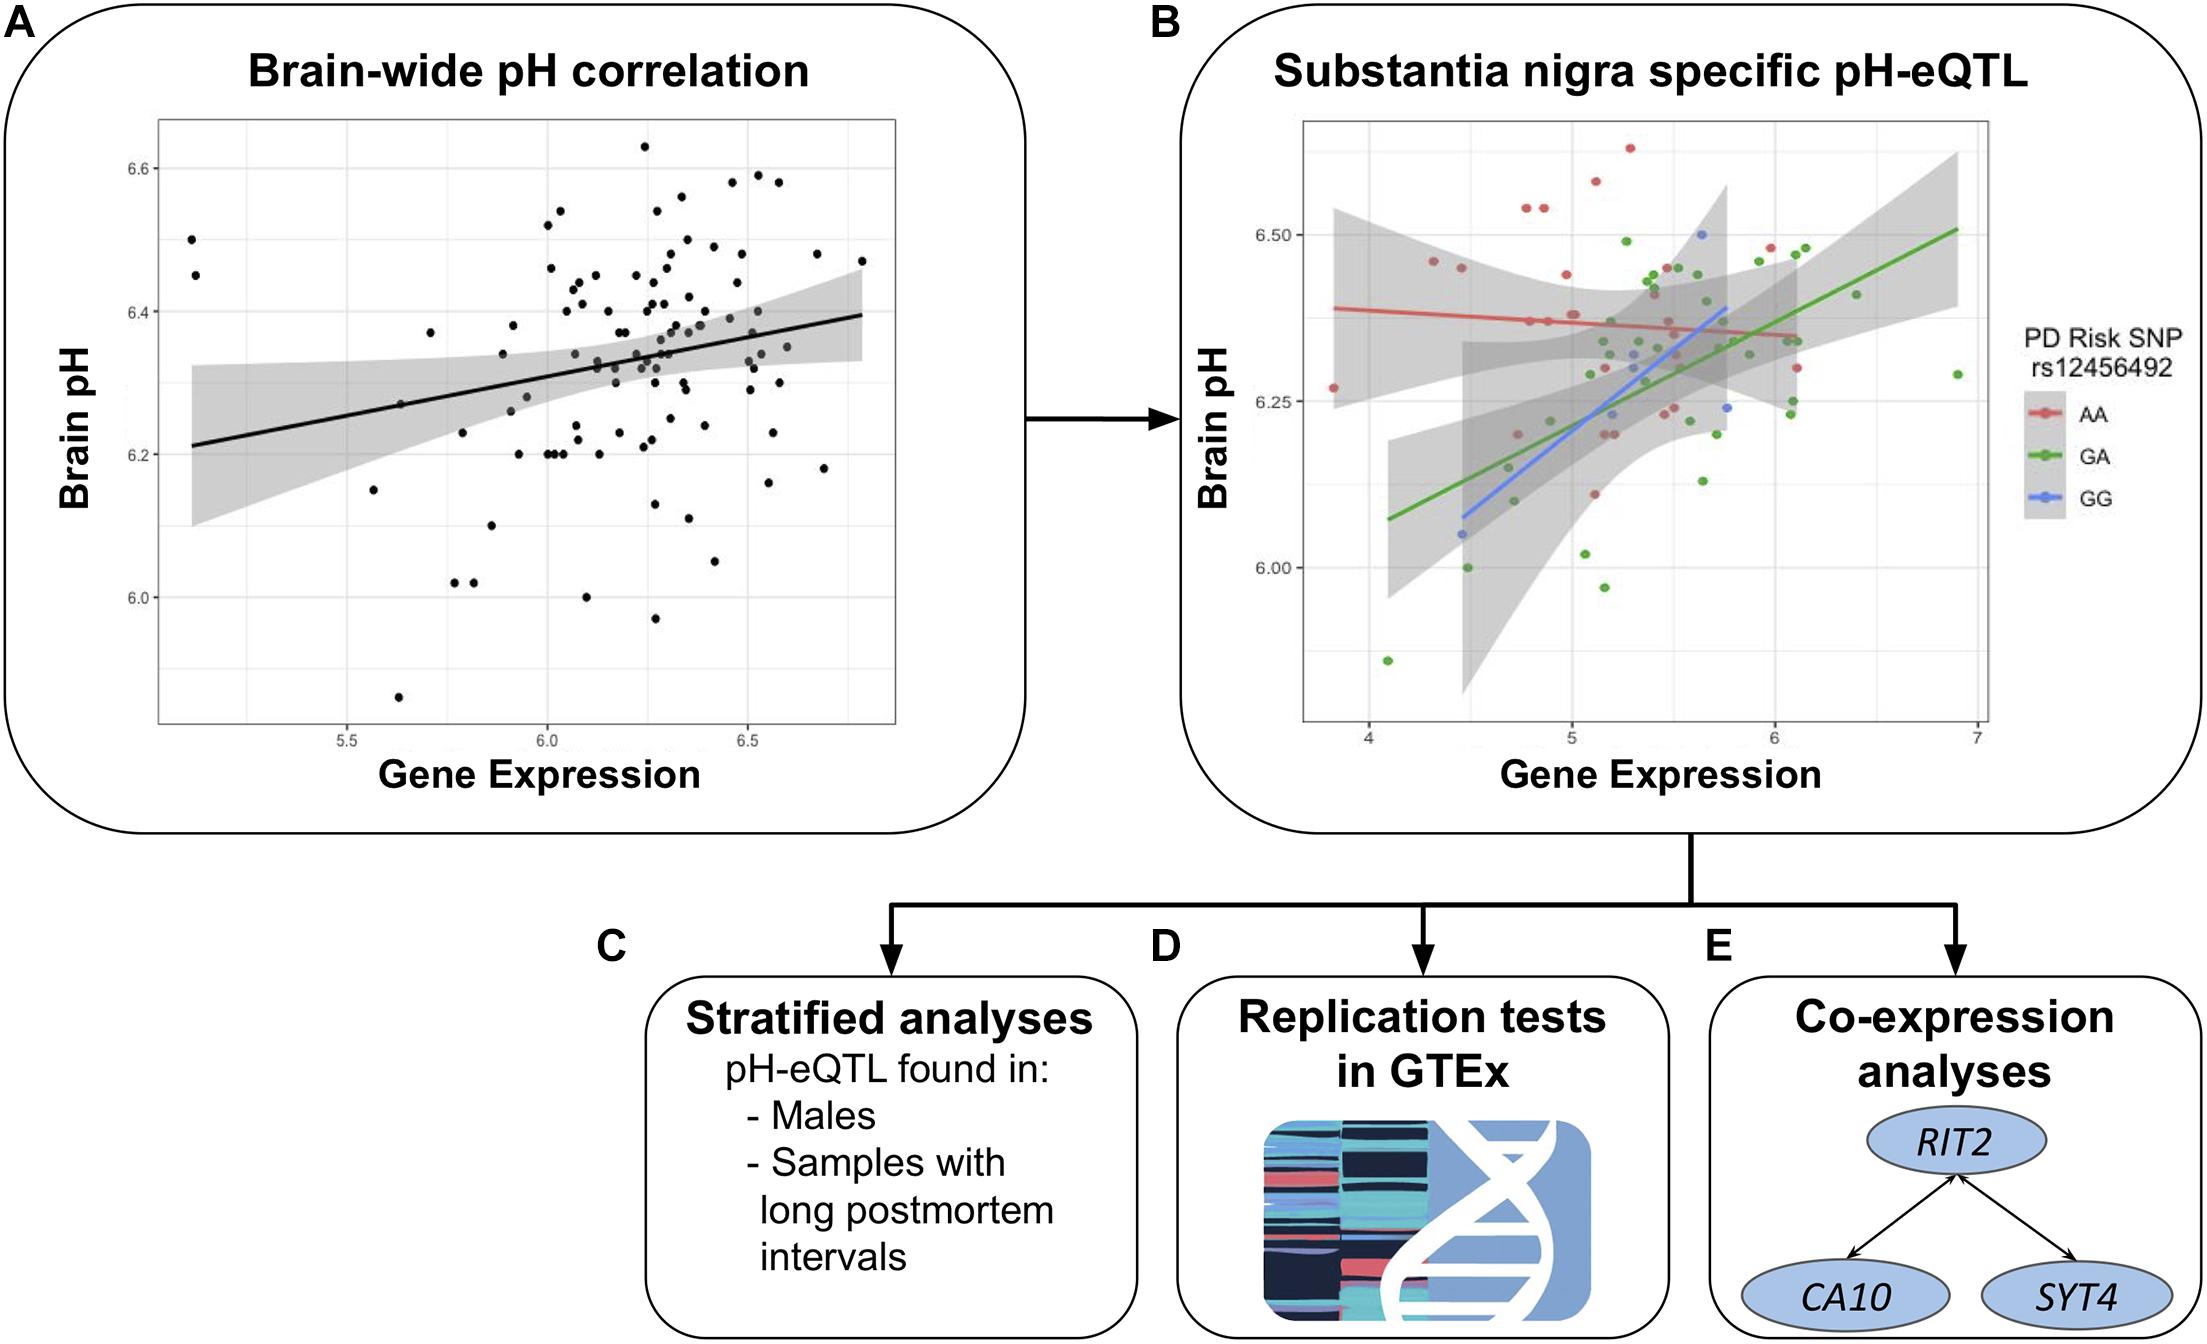
Figure 2. Overview of the study. Focused on RIT2 and SYT4, the relationship between pH and gene expression was tested brain-wide (A). Region-specific tests revealed a pH-eQTL involving the PD risk polymorphism rs12456492 in the substantia nigra (B). When the sample is stratified, this relationship is only observed within males and samples with longer post mortem intervals (C). GTEx was used for replication tests (D). Lastly, we performed a further analysis that identified co-expression between RIT2, SYT4, and CA10 (E).
Materials and Methods
BrainEAC Dataset
Phenotype, genome-wide expression, and genotype information were obtained from The Brain expression quantitative trait loci (eQTL) Almanac (BrainEAC) project. This data from the United Kingdom Brain Expression Consortium was generated to investigate genetic regulation and alternative splicing. The consortium assayed genome-wide expression in ten brain regions using Affymetrix Exon 1.0 ST arrays (Illumina, San Diego, CA, United States) from 134 neuropathologically normal donors (Ramasamy et al., 2014). We extracted genotype data and expression values for the RIT2, SYT4, and CA10 genes from the BrainEAC web-based resource1. Age, sex, postmortem interval (PMI), RNA integrity number (RIN), cause of death, and pH data were obtained from Gene Expression Omnibus (GSE46706) (Edgar et al., 2002). Of the 134 brains, we restricted our analyses to the 100 brains from the Medical Research Council Sudden Death Brain and Tissue Bank in Edinburgh, United Kingdom (Millar et al., 2007) with pH and genotype data. For each brain, pH was measured in the lateral ventricle because it is known to be stable across brain regions (Trabzuni et al., 2012). This study measured pH with a Hanna HI8424 portable pH meter with a glass bodied electrode (Fisher Scientific, Loughborough, United Kingdom) (Trabzuni et al., 2012). All ten regions were not sampled in all the brains, resulting in 73 substantia nigra samples. The median age of death is 55 years (interquartile range: 44–61), with 76.7% composed of males. Demographic, genotype and other information for this sample are shown in Table 1.
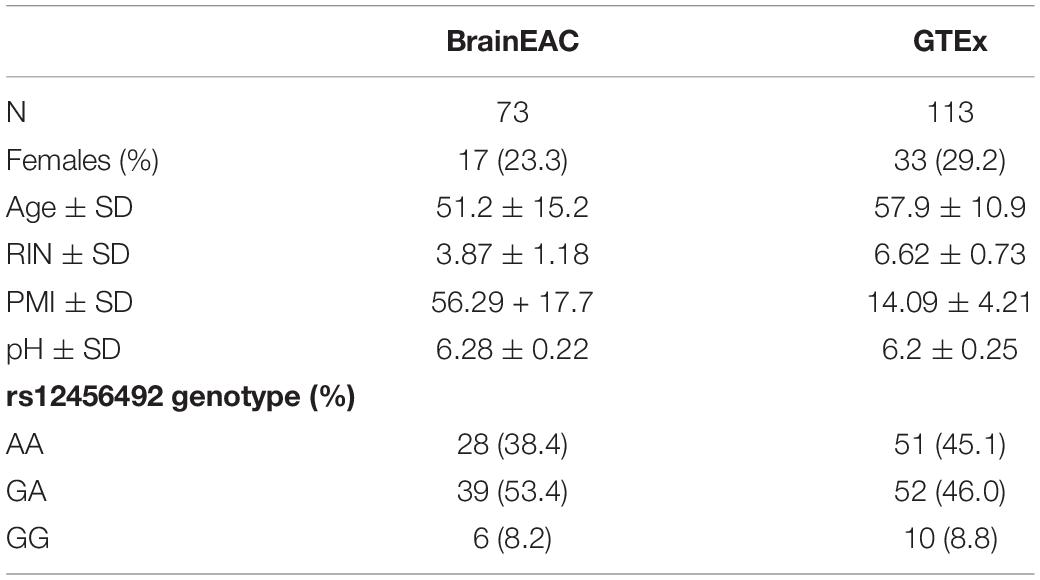
Table 1. Demographic and genotype statistics for the BrainEAC and genotype-tissue expression (GTEx) datasets.
GTEx Dataset
The Genotype-Tissue Expression (GTEx2) project was designed to identify eQTL’s in diverse human tissues (Lonsdale et al., 2013). We extracted version 8 of GTEx data, which included expression data for the substantia nigra and genotype data for PD risk single nucleotide polymorphism (SNP) rs12456492, resulting in a sample size of 113. Tissue samples were collected from non-diseased postmortem brain samples. RNA sequencing expression data was obtained from the GTEx Portal and log normalized (filename: GTEx_Analysis_2017-06-05_v8_RNASeQCv1.1.9_gene_tpm.gct). Genotype information was obtained from whole-exome sequencing by the GTEx consortium (filename: GTEx_Analysis_2017-06-05_v8_WholeExomeSeq_979Indiv_VEP_annot.vcf). Additional information extracted from the GTEx Portal included age, sex, PMI, RIN, and pH (measured in the cerebellum) (filename: GTEx_Analysis_v8_Annotations_SampleAttributesDS.txt). The median age of death is 60 years (interquartile range: 53–66), with 70.8% composed of males. Additional statistics for this dataset are shown in Table 1.
Co-expression Meta-Analysis Tools
Search-Based Exploration of Expression Compendium for Humans (SEEK3) was used to identify top genes co-expressed with RIT2. The top-ranked dataset from the co-expression result, GSE20146, was downloaded to characterize correlations between RIT2, SYT4, and CA10. Normalized expression data for GSE20146 was obtained from the Gemma bioinformatics system4, using the filter option, which resulted in the removal of one outlier (GSM505262) (Lim et al., 2021).
Statistical Analysis
Pearson correlation and ordinary least square linear models were performed in R Core (2013). The R software environment for statistical computing and graphics was also used for plotting5.
Results
Brain-Wide RIT2 and SYT4 Gene Expression Is Correlated With pH
To attempt replication of the association between pH and RIT2 and additionally test SYT4, we examined their relationships. The gene expression of RIT2 and SYT4 was averaged across all ten brain regions assayed in the BrainEAC study (n = 100 brains, sample information provided in Table 1). We observed a broad range of pH values (5.42–6.63, measured in the lateral ventricle). The most common cause of death is ischemic heart disease (n = 60), and cause of death was not associated with brain pH (ANOVA, p = 0.48). Gene expression and brain pH was correlated for RIT2 (r = 0.59, p < 0.0001), and SYT4 (r = 0.58, p < 0.0001). As seen in Figure 3, five brains had abnormally low pH values, with pH values were lower than two standard deviations from the mean (ph < 5.8). To prevent these outliers from skewing our downstream results, we have removed them from all subsequent analyses. After removal of these pH outlier brains, RIT2 remains correlated with pH (r = 0.22, p < 0.04), however, SYT4 was no longer correlated with brain pH (SYT4: r = 0.14, p = 0.17). Thus, in agreement with Mistry and Pavlidis, we also observe a correlation between postmortem brain pH and RIT2 gene expression.
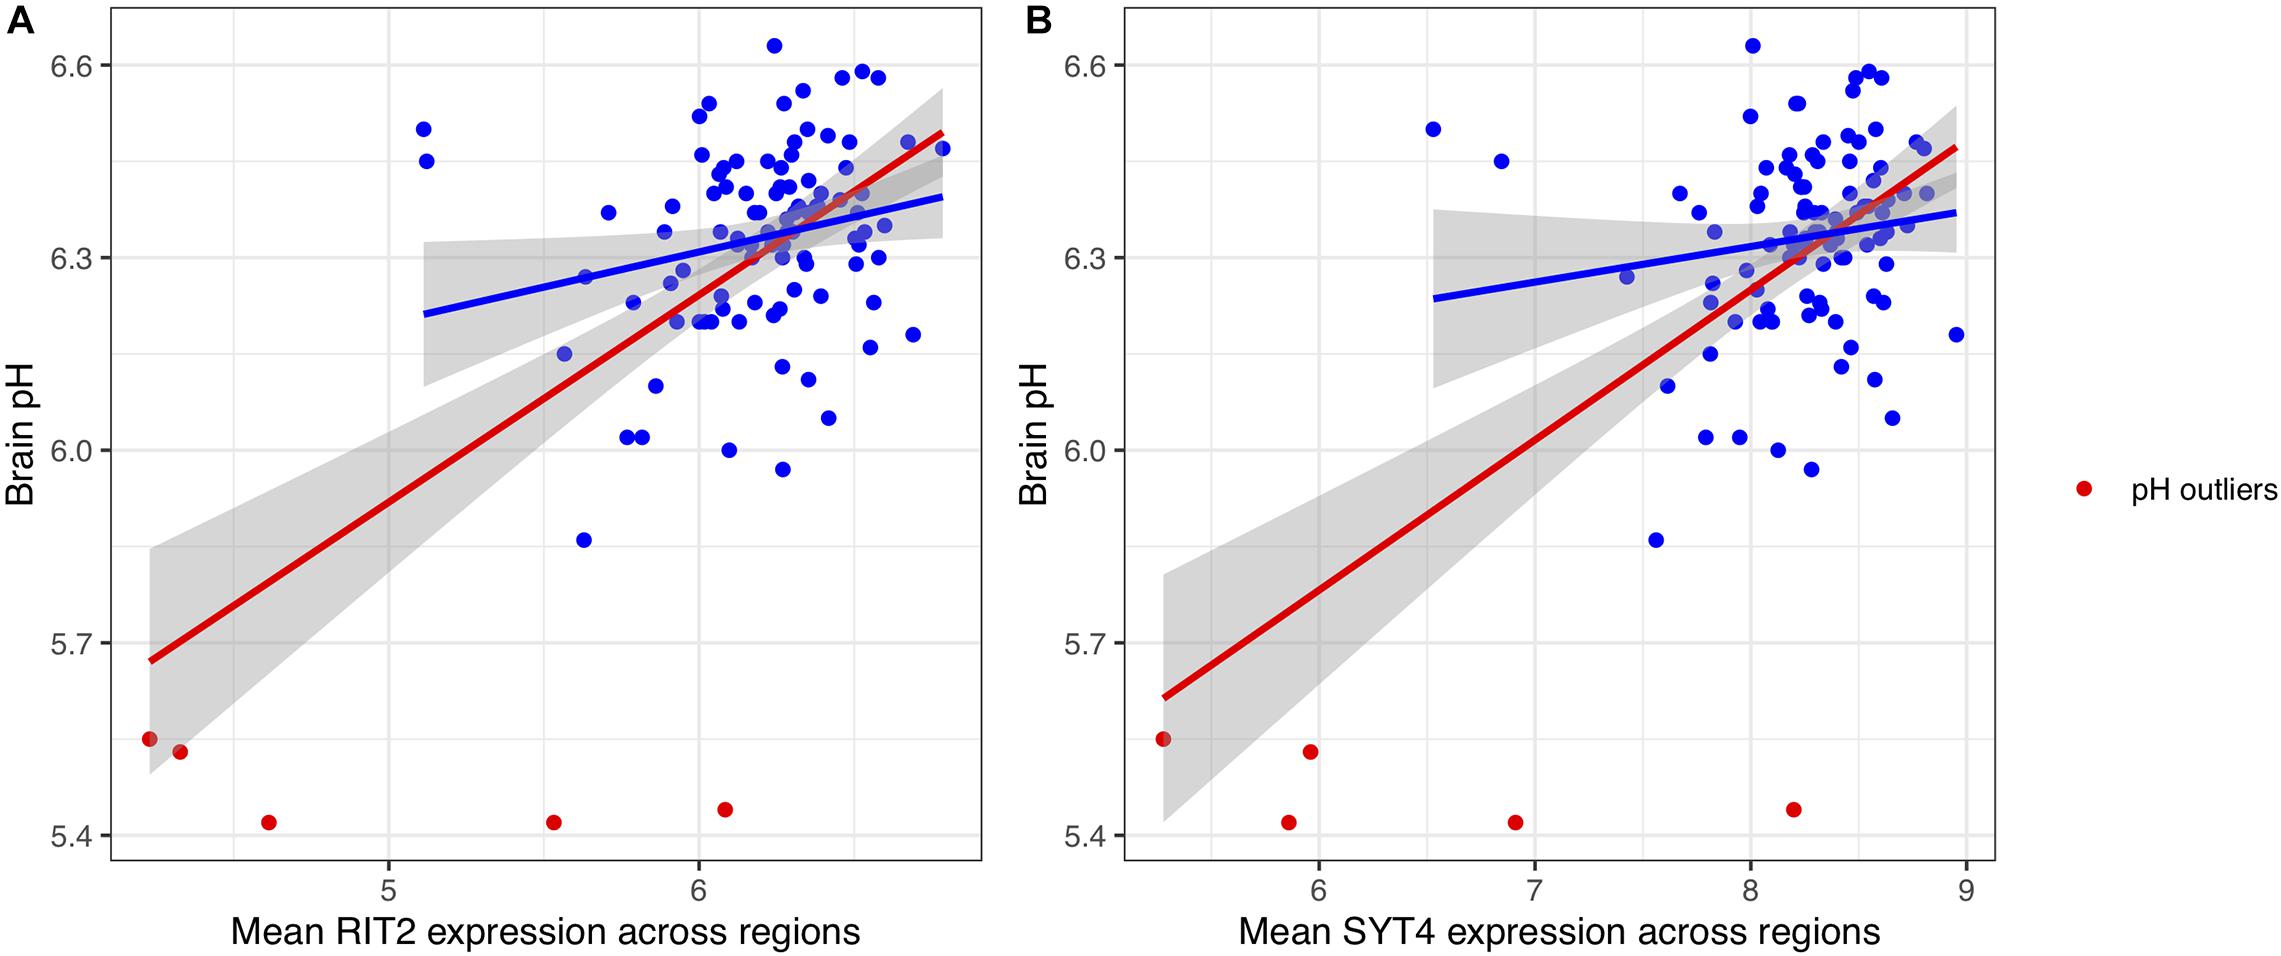
Figure 3. Scatter plots of the relationship between pH with RIT2 (A) and SYT4 (B) gene expression. pH outliers are colored red. Lines representing linear fits with (red) and without outliers (blue) include shaded areas marking the 0.95 confidence intervals.
Although pH was measured at the lateral ventricle, it is known that pH is relatively consistent brain-wide (Trabzuni et al., 2012). However, we tested if the correlation with gene expression varies across the ten brain regions that were transcriptomically profiled. For each individual brain region, RIT2 was most correlated with pH in the thalamus (n = 90, r = 0.29, p = 0.005, pFDR = 0.055) and substantia nigra (n = 70, r = 0.27, p = 0.026, pFDR = 0.13). In contrast, the correlation between SYT4 expression and pH was not statistically significant in any of the 10 regions. SYT4 correlation was high but not significant in the thalamus (r = 0.20, p = 0.057). White matter and regions enriched for white matter (putamen and medulla) had the lowest pH correlations for RIT2 gene expression, whereas the medulla and substantia nigra had the lowest pH correlation for SYT4.
rs12456492 Influences the Association Between RIT2 and SYT4 Expression and pH in the Substantia Nigra
Motivated by the correlations between brain pH, RIT2, and SYT4, we next tested for associations with the co-located PD risk variant. Genotype at rs12456492 by itself was associated with brain pH (B = 0.06, p = 0.043). We next tested if this neighboring PD risk variant influenced the correlations between gene expression and pH. As depicted in Figures 4, 5, an interaction between pH, rs12456492 and either RIT2 or SYT4 expression, was observed in the substantia nigra (RIT2: B = −0.15, p < 0.007, pFDR < 0.07, SYT4: B = −0.16, p < 0.0001, pFDR < 0.001) but none of the other profiled regions. As shown in Table 2, after accounting for the covariates of sex, age, PMI and RIN, these signals remain. Compared to all other terms in the model, the pH-eQTL interaction for either RIT2 or SYT4 expression is the most significant (p < 0.005) (Table 2). Specifically, in the BrainEAC data, individuals carrying the risk allele (AG and GG) had a positive correlation between gene expression and pH, but non-carriers did not. This interaction suggests a weaker coupling between pH, RIT2, and SYT4 expression in the substantia nigra may be protective.
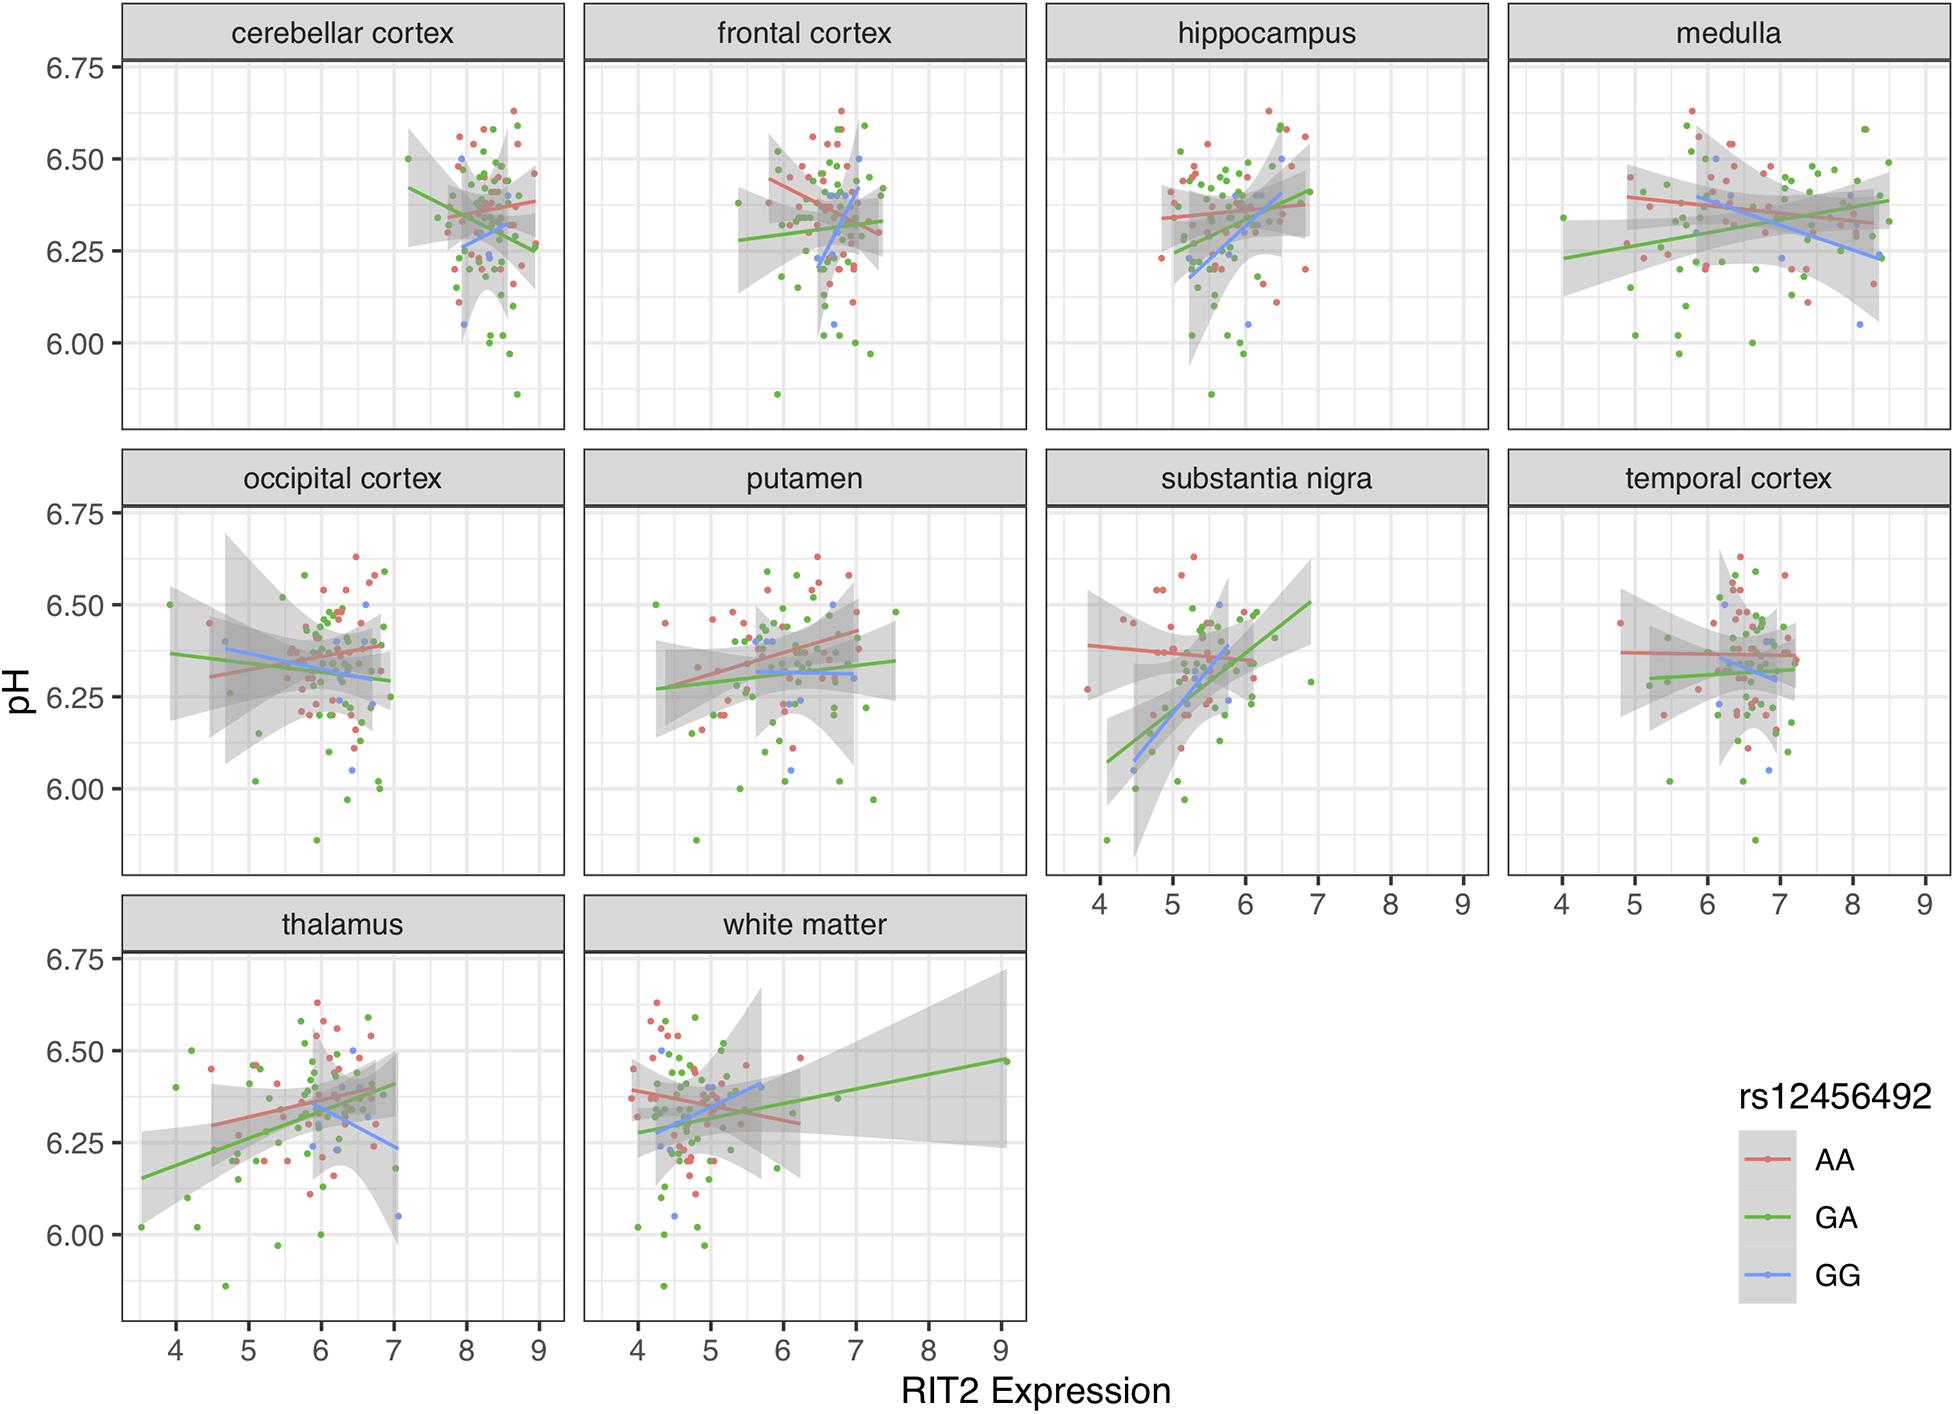
Figure 4. Scatter plot of pH and RIT2 gene expression based on rs12456492 genotype for 10 brain regions. Genotype groups are colored with lines representing linear fits with shaded areas marking the 0.95 confidence intervals.
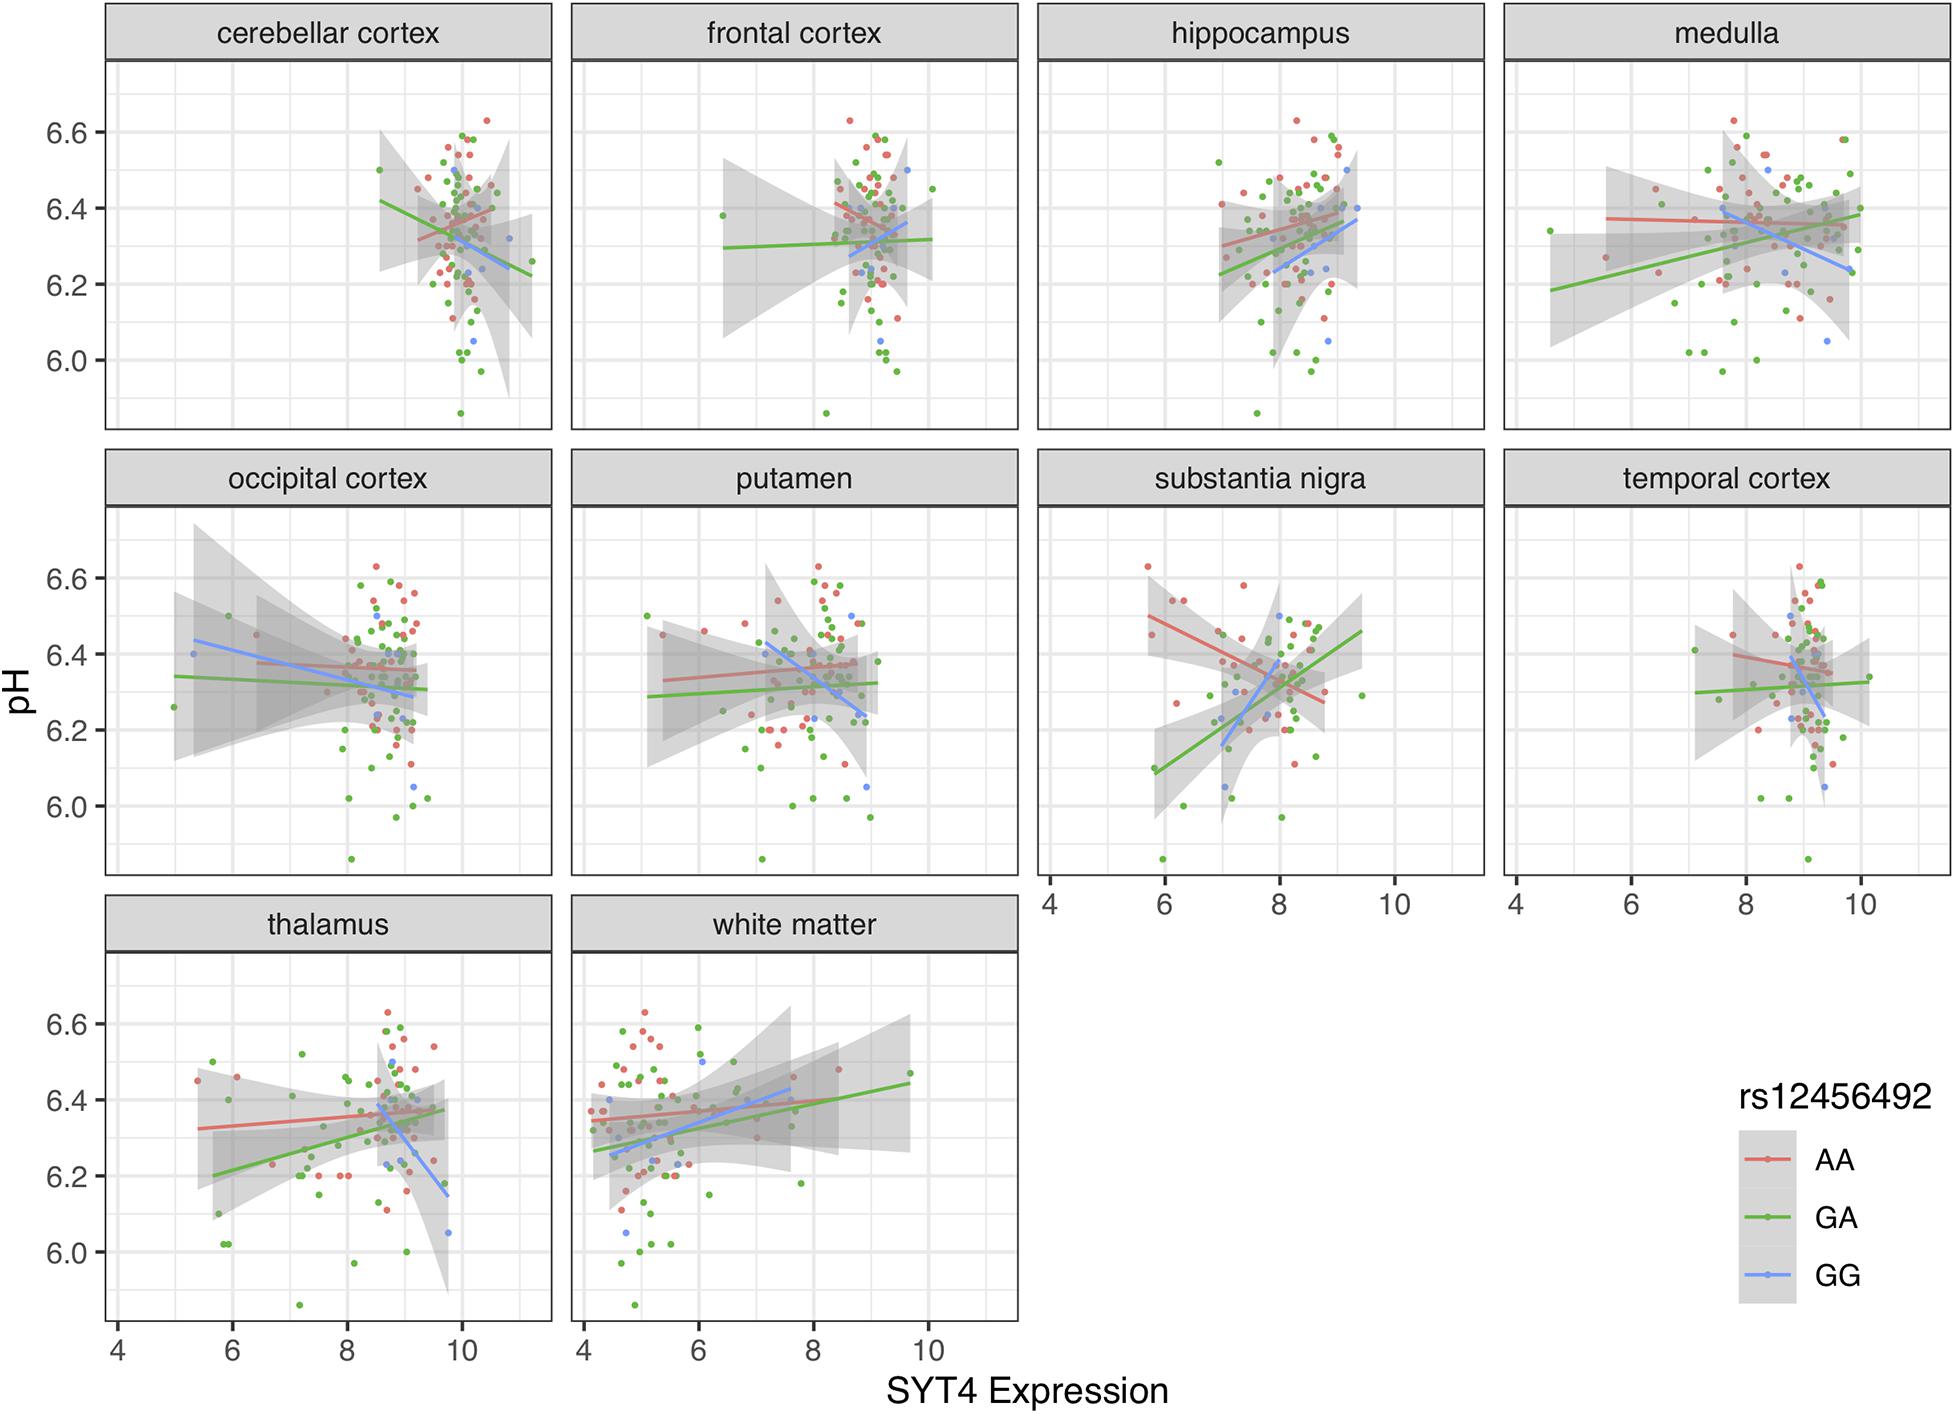
Figure 5. Scatter plot of pH and SYT4 gene expression based on rs12456492 genotype for 10 brain regions. Genotype groups are colored with lines representing linear fits with shaded areas marking the 0.95 confidence intervals.
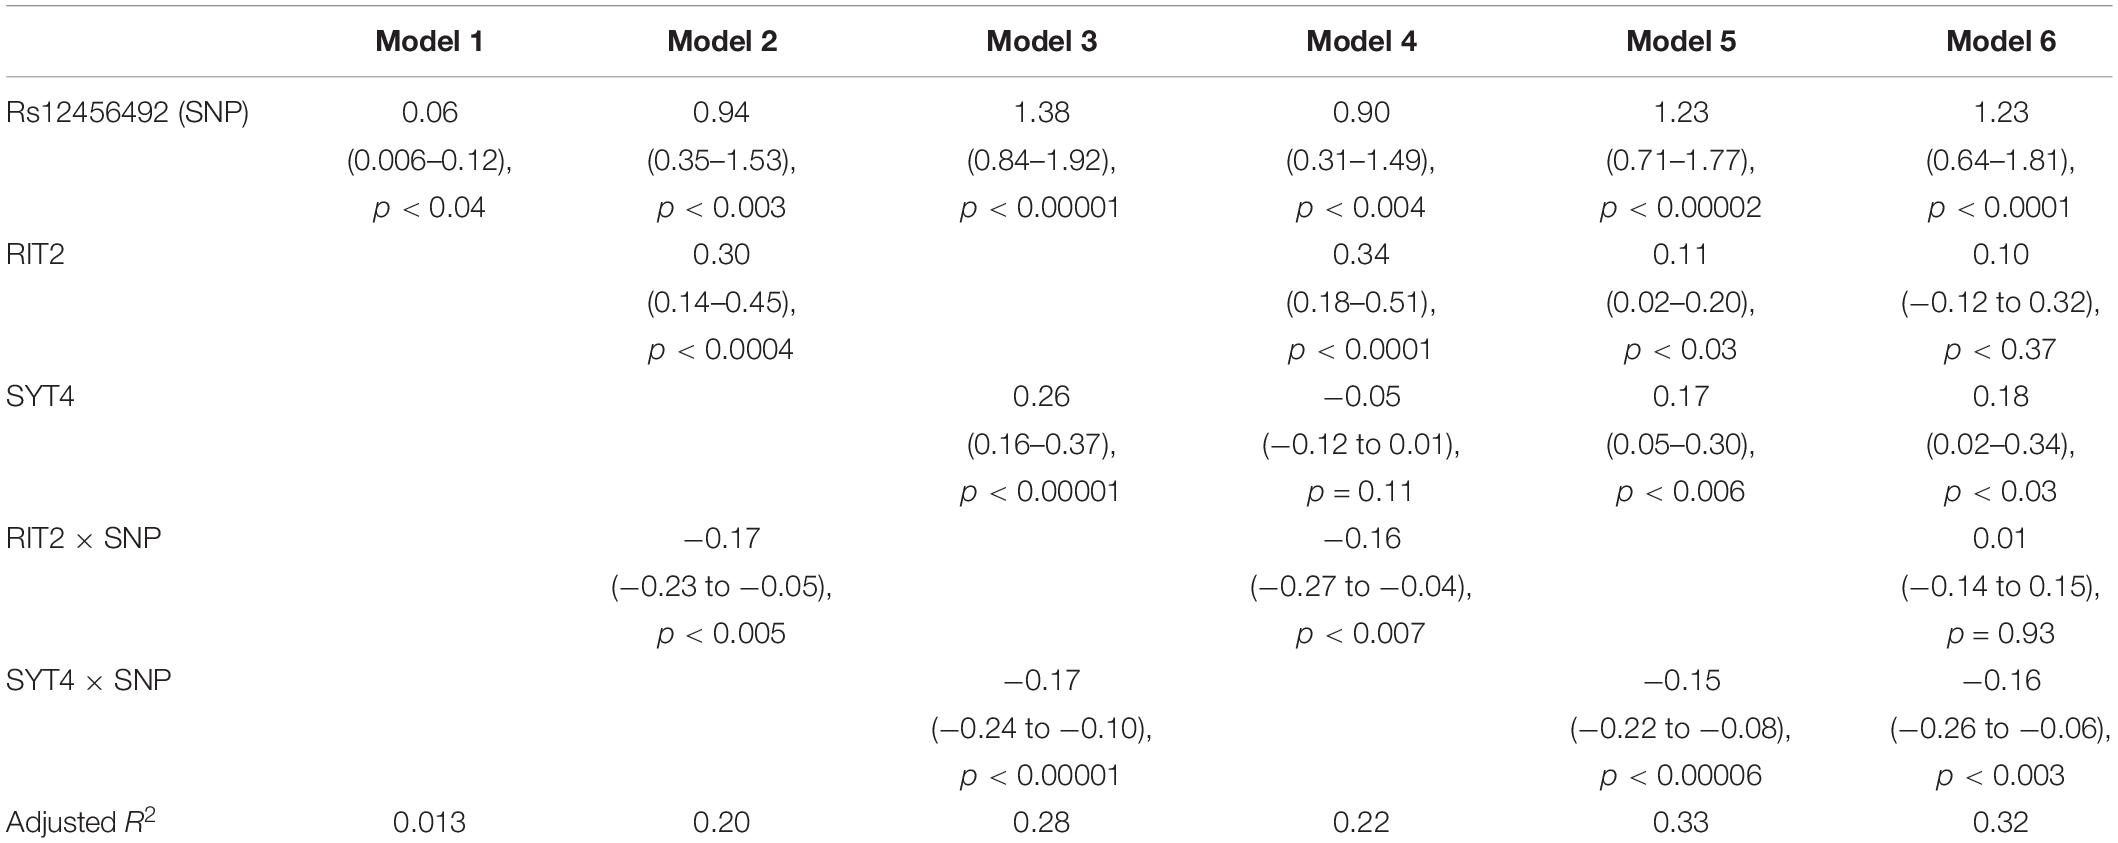
Table 2. Effects of Rs12456492, RIT2, and SYT4 gene expression on brain pH, with sex, age, postmortem interval (PMI) and RNA integrity number (RIN) as covariates.
To investigate the combined influences of RIT2 and SYT4 on pH level, we tested three additional models (Table 2, models 4–6). After including covariates, the addition of SYT4 gene expression resulted in a slightly better fit for the RIT2 interaction model (Model 2 vs 4, R2 from 0.2 to 0.22, p = 0.11). Similarly, the addition of RIT2 expression explained slightly more variance in the SYT4 interaction model (Model 3 vs 5, R2 from 0.28 to 0.33, p = 0.02). Models that have the SYT4 genetic interaction explain more variance than those that include the RIT2 interaction. Furthermore, in a model with all tested terms, the RIT2 genetic interaction term is no longer significant (Model 6).
Sex-Specific Signals
To investigate if sex influenced the pH-eQTL interaction, we tested a three-way interaction between gene expression, genotype, and gender. This added interaction term was not significant for RIT2 [B = 0.21 (−0.05 to 0.48), p = 0.11], but was for SYT4 [B = 0.18 (0.006–0.35), p < 0.042] when added to Models 2 and 3. We additionally stratified our analyses to test for sex-specific effects on Models 2 and 3 (Figure 6). This yielded 54 male samples and a small group of 16 female samples that lack individuals carrying the GG genotype. In both models, pH-eQTL interactions were significant for males (RIT2: B = −0.21, p < 0.0001, Figure 6A; SYT4: B = −0.21, p < 0.003, Figure 6B) but not females (RIT2: B = −0.03, p = 0.88, Figure 6A; SYT4: B = −0.09, p = 0.47, Figure 6B). Overall, the SYT4 pH-eQTL appears to be sex-specific, but this analysis is limited by sample size.
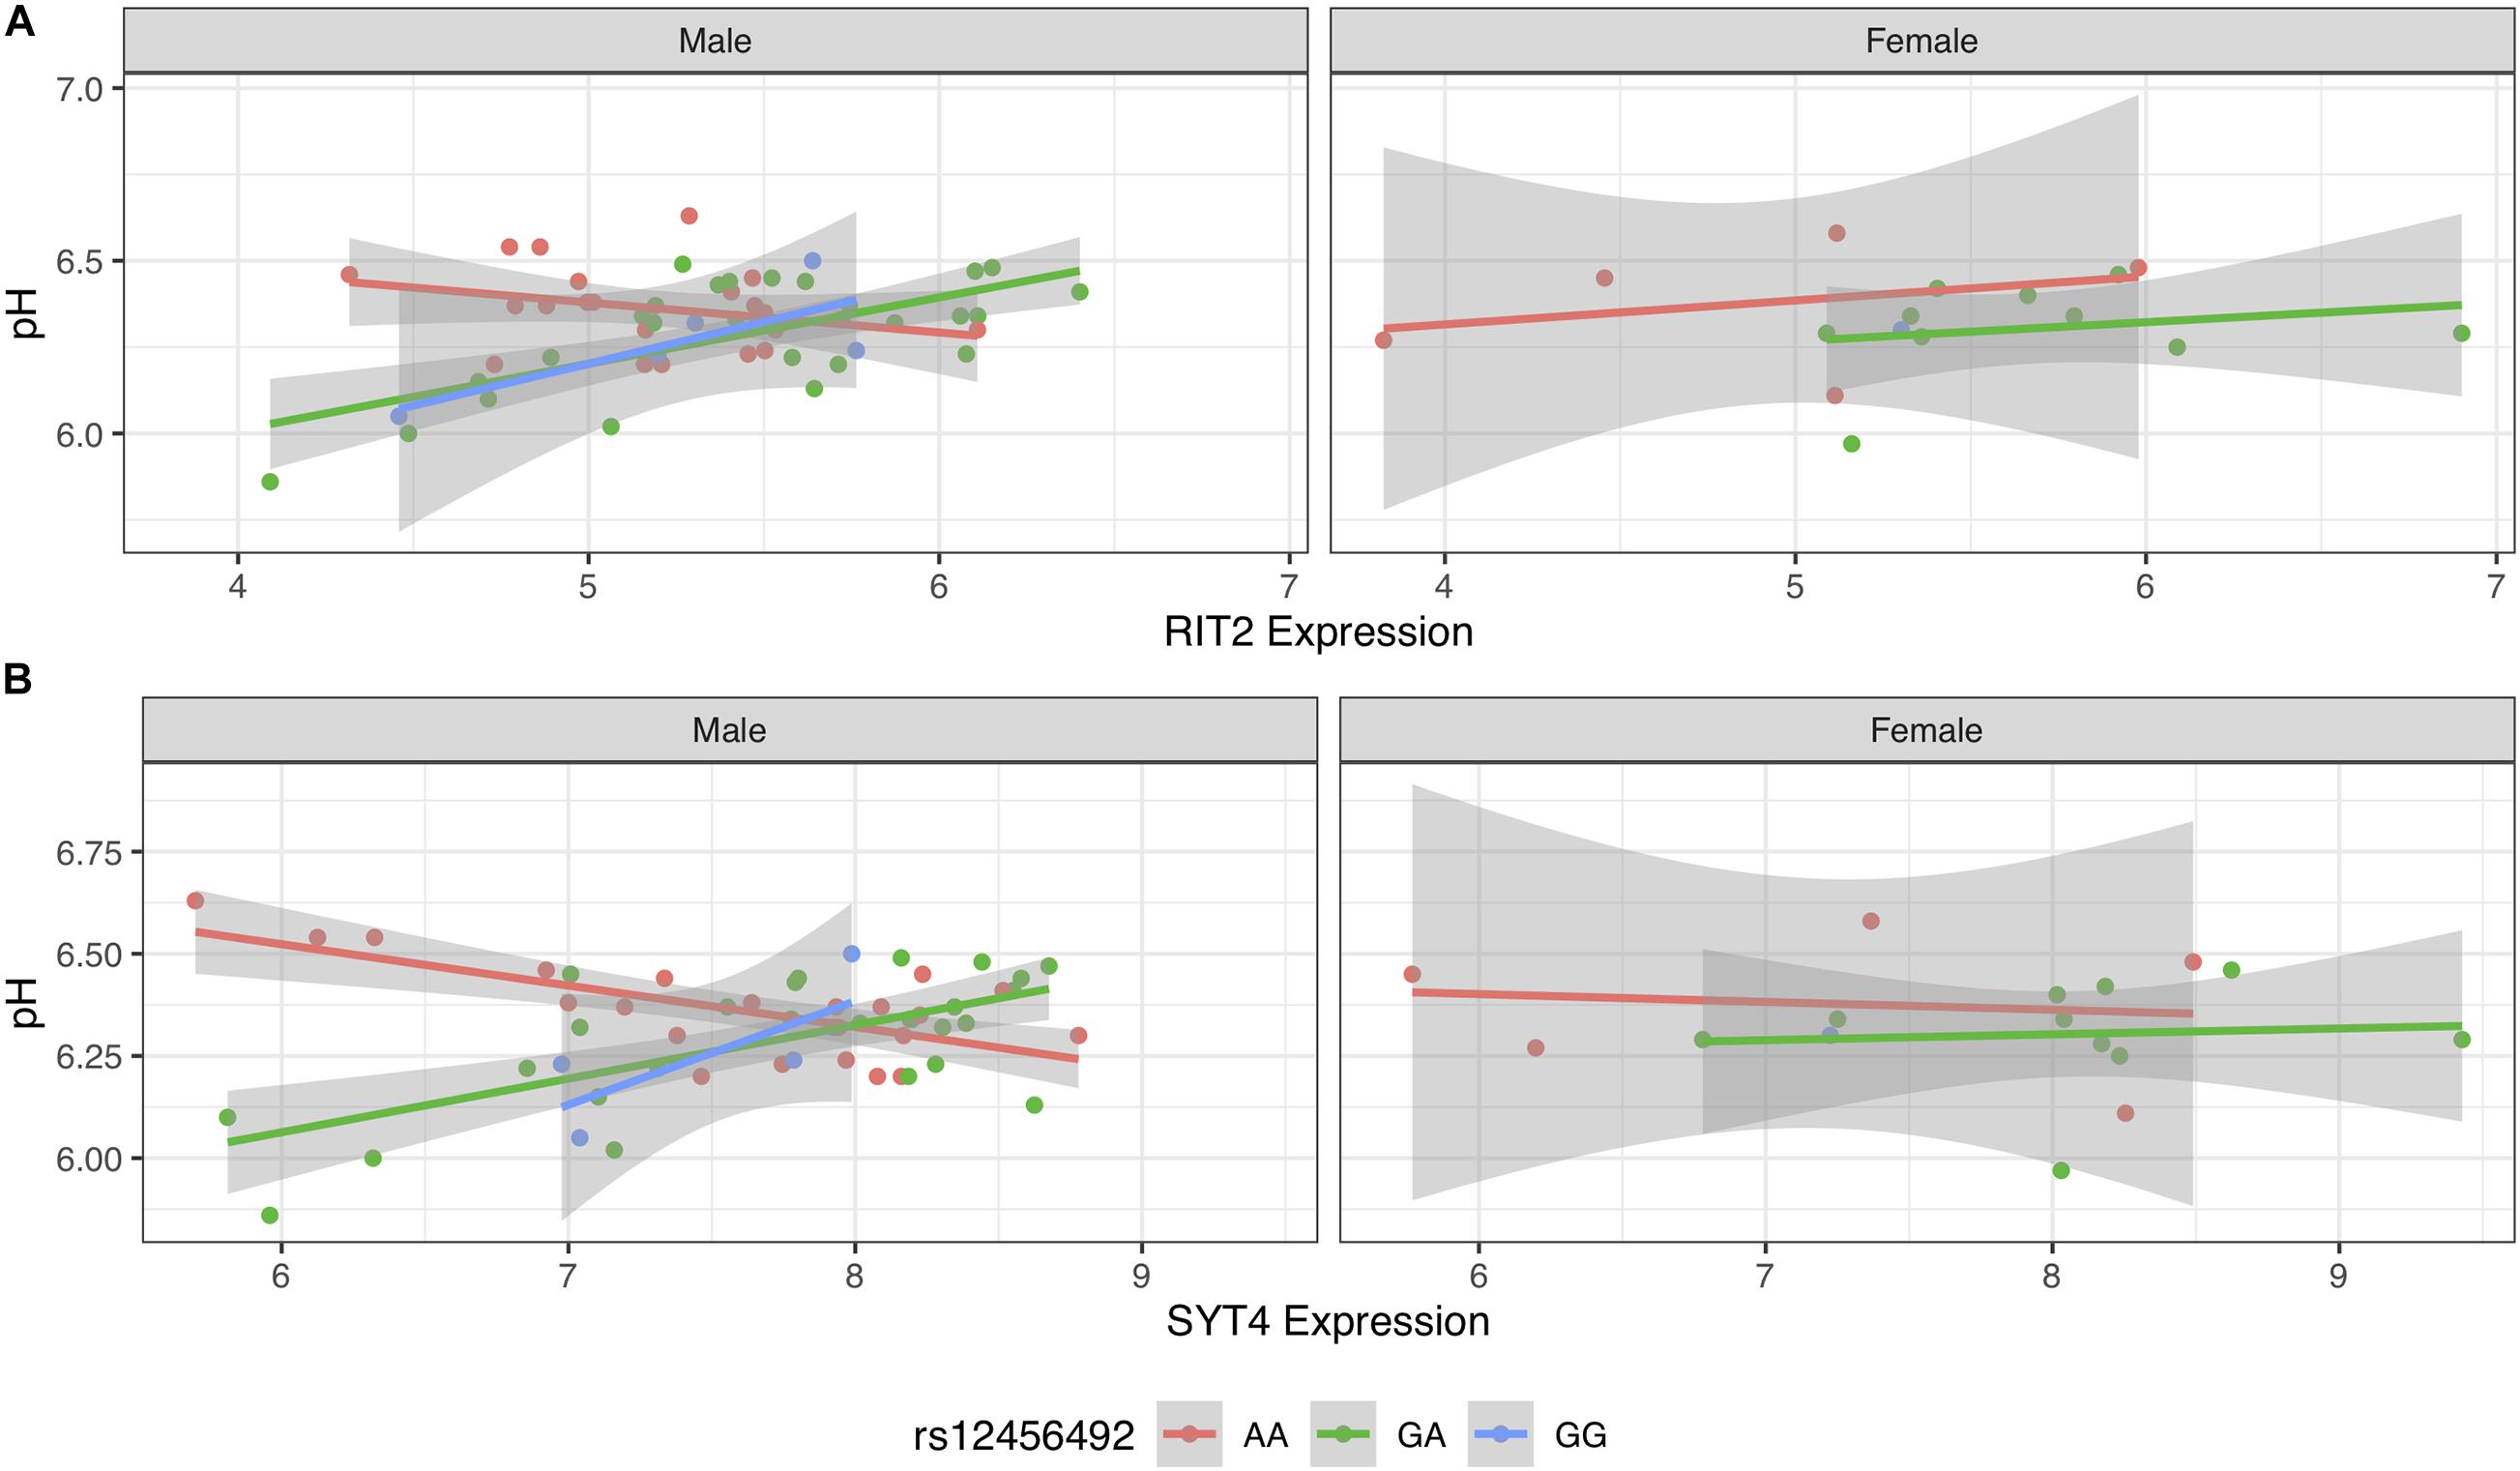
Figure 6. Scatter plot of pH and gene expression grouped by risk SNP genotype and stratified by sex within BrainEAC sample for RIT2 (A) and SYT4 (B). Genotype groups are colored with lines representing linear fits with shaded areas marking the 0.95 confidence intervals.
rs12456492 Is Not Associated With RIT2 and SYT4 Expression and pH Within the Substantia Nigra in the GTEx Dataset
Next, we used the GTEx dataset to test for replication of our findings from the BrainEAC sample. We obtained gene expression data for RIT2 and SYT4 in the substantia nigra region, along with genotype data for the PD risk SNP rs12456492 yielding a sample size of 113. The pH ranged from 5.58 to 6.79, with a mean of 6.20. Similarly, we removed pH outliers from the samples using the same criteria used for the BrainEAC dataset, resulting in 104 samples. Although the location of pH measurement (cerebellum) and method of gene expression profiling (RNA sequencing) varies, we tested the same models in this dataset.
In the substantia nigra, the correlation between gene expression of RIT2 or SYT4 with pH was significant (RIT2: r = 0.27, p < 0.006; SYT4: r = 0.31, p < 0.002). Next, we applied linear models on the GTEx data to first examine the influence of the risk SNP on pH level. The risk SNP by itself was not a significant predictor of pH (p = 0.14). Furthermore interaction between pH, rs12456492 and either RIT2 or STY4 was not observed (RIT2: t-stat = −1.10, p = 0.28, SYT4: t-stat = −0.84, p = 0.40). After accounting for the covariates (sex, age, RIN, and PMI), the gene expression and SNP interactions were still not statistically significant terms in the models. Also, sex-specific signals were not observed in the GTEx substantia nigra samples.
Shorter PMI Values in GTEx
To explain the failed replication in the GTEx dataset, we examined the differences between the two cohorts. We noticed that PMI was longer in BrainEAC when compared to the GTEx samples. For BrainEAC, PMI ranged from 31 to 99 h, whereas GTEx ranged from 4.78 to 23.13 h. Hence there was no overlap between the two datasets, as seen in Figure 7.
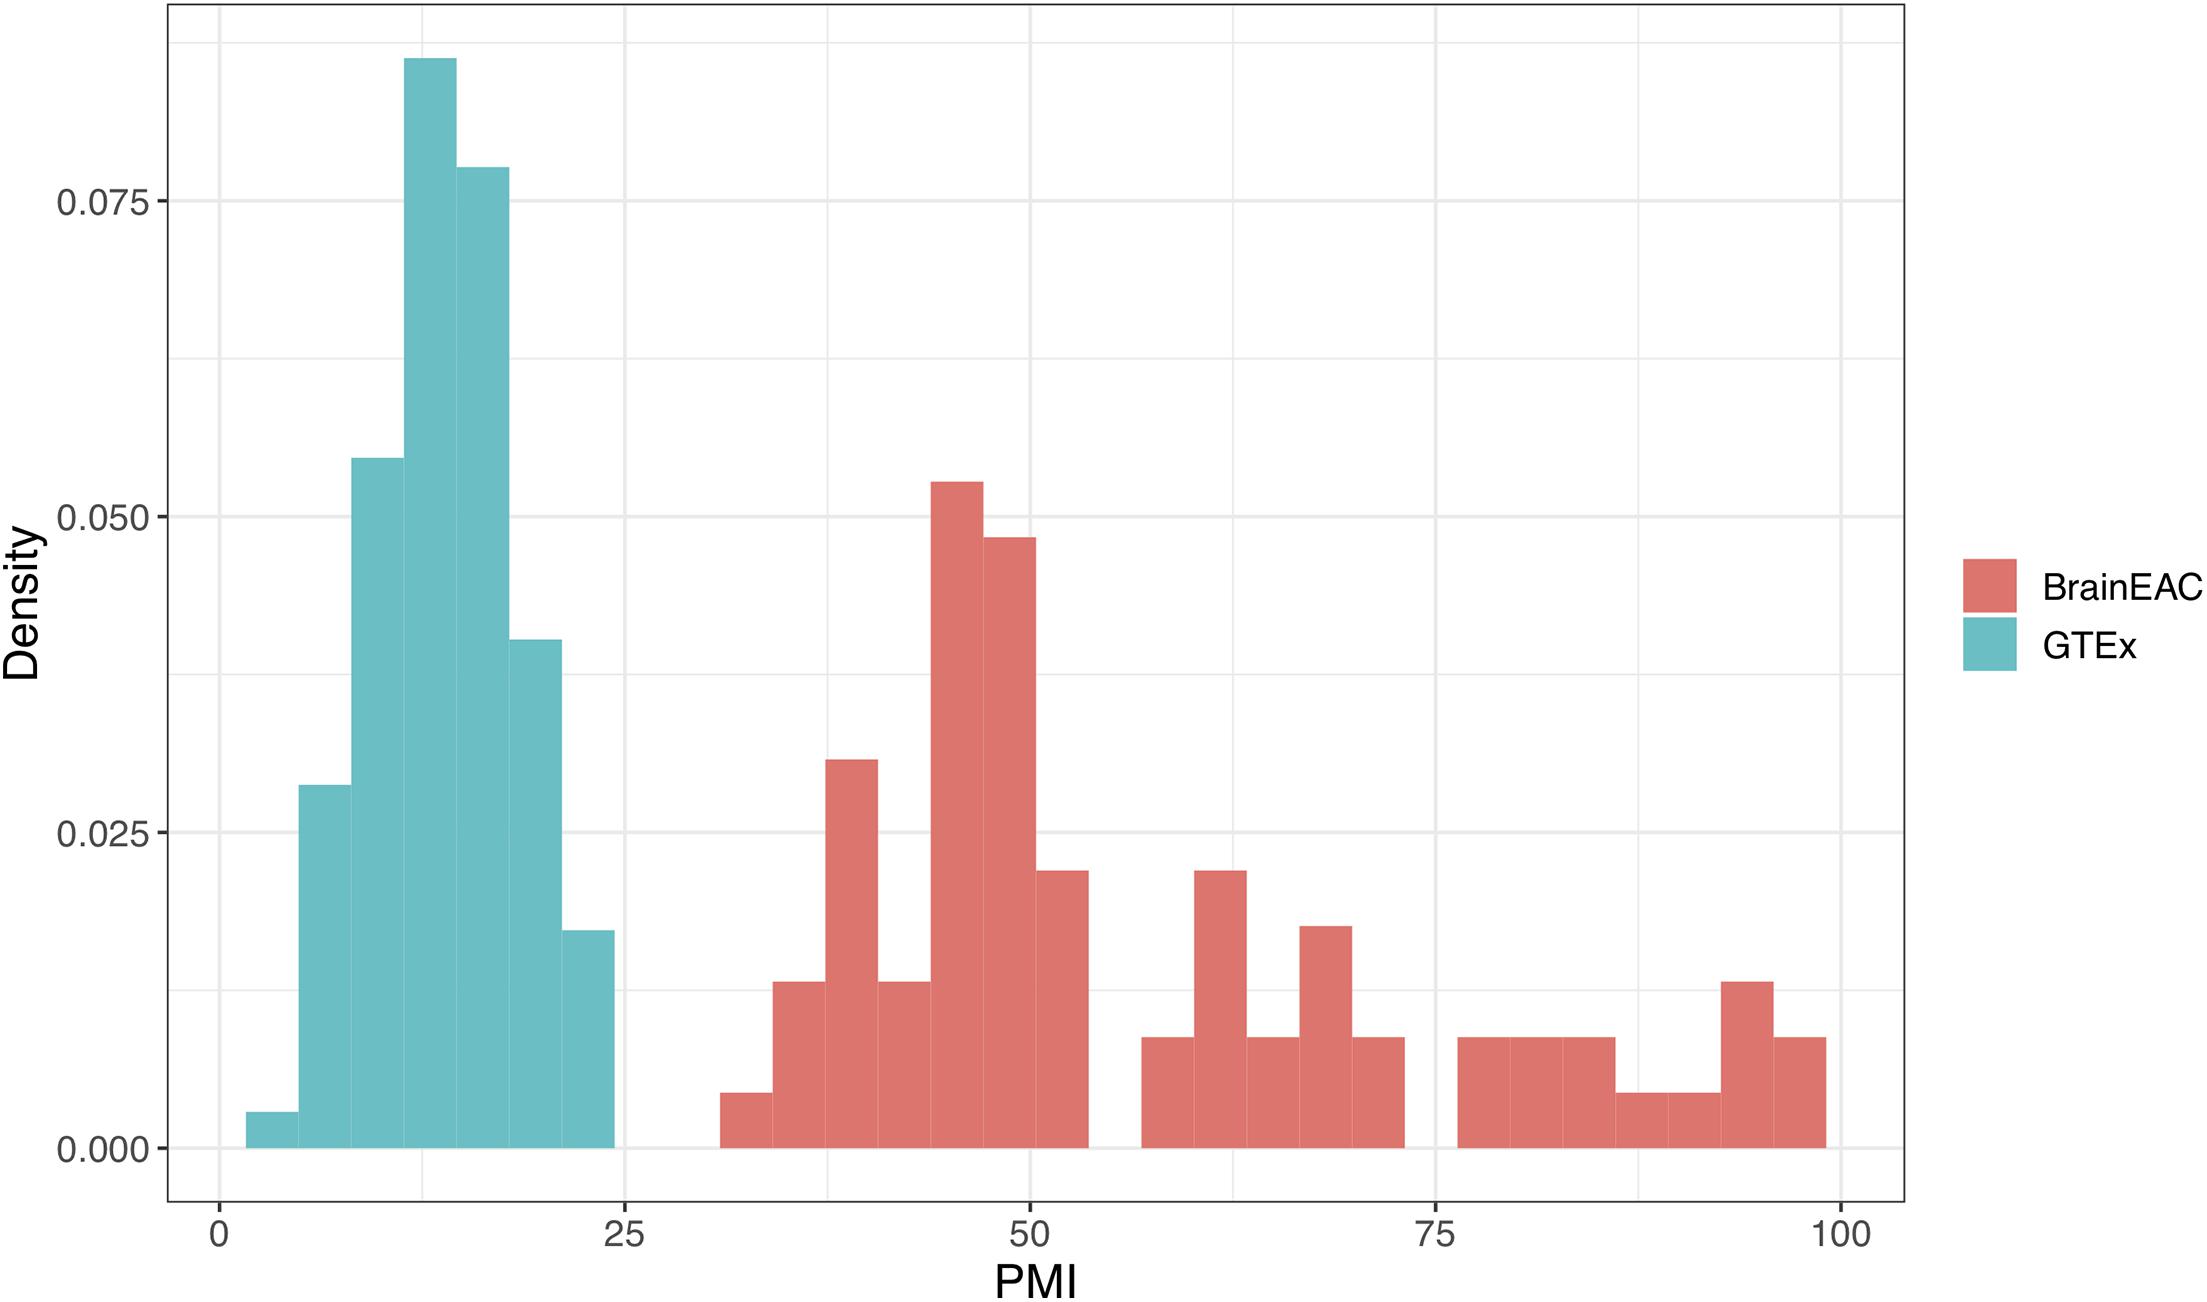
Figure 7. Density plot of postmortem interval (PMI) values in hours. The genotype-tissue expression (GTEx) and BrainEAC samples are colored in blue and red, respectively.
PMI Influences pH-eQTL Strength
To further investigate this difference, we stratified BrainEAC based on PMI. We split the sample based on the median PMI (49 h). Using Models 2 and 3, interactions between gene expression and genotype were not statistically significant in the short PMI group (RIT2: p = 0.15; SYT4: p = 0.24) but were in the long PMI group (p < 0.01 for both genes). The interaction between SNP, gene expression and PMI was not statistically significant for RIT2 [B = −0.005 (−0.012 to 0.003), p = 0.20, Figure 8A], but was for SYT4 [B = −0.004 (−0.008 to −0.0007), p < 0.02, Figure 8B]. In Figure 8, G allele carriers in the short and long PMI groups show a positive correlation between gene expression and pH level. Although the long PMI group lacks GG carriers, a switch from positive to negative correlation is observed when comparing the GA and AA groups. This suggests the PMI difference between the datasets may explain why the pH-eQTL interaction was not observed in the GTEx sample.
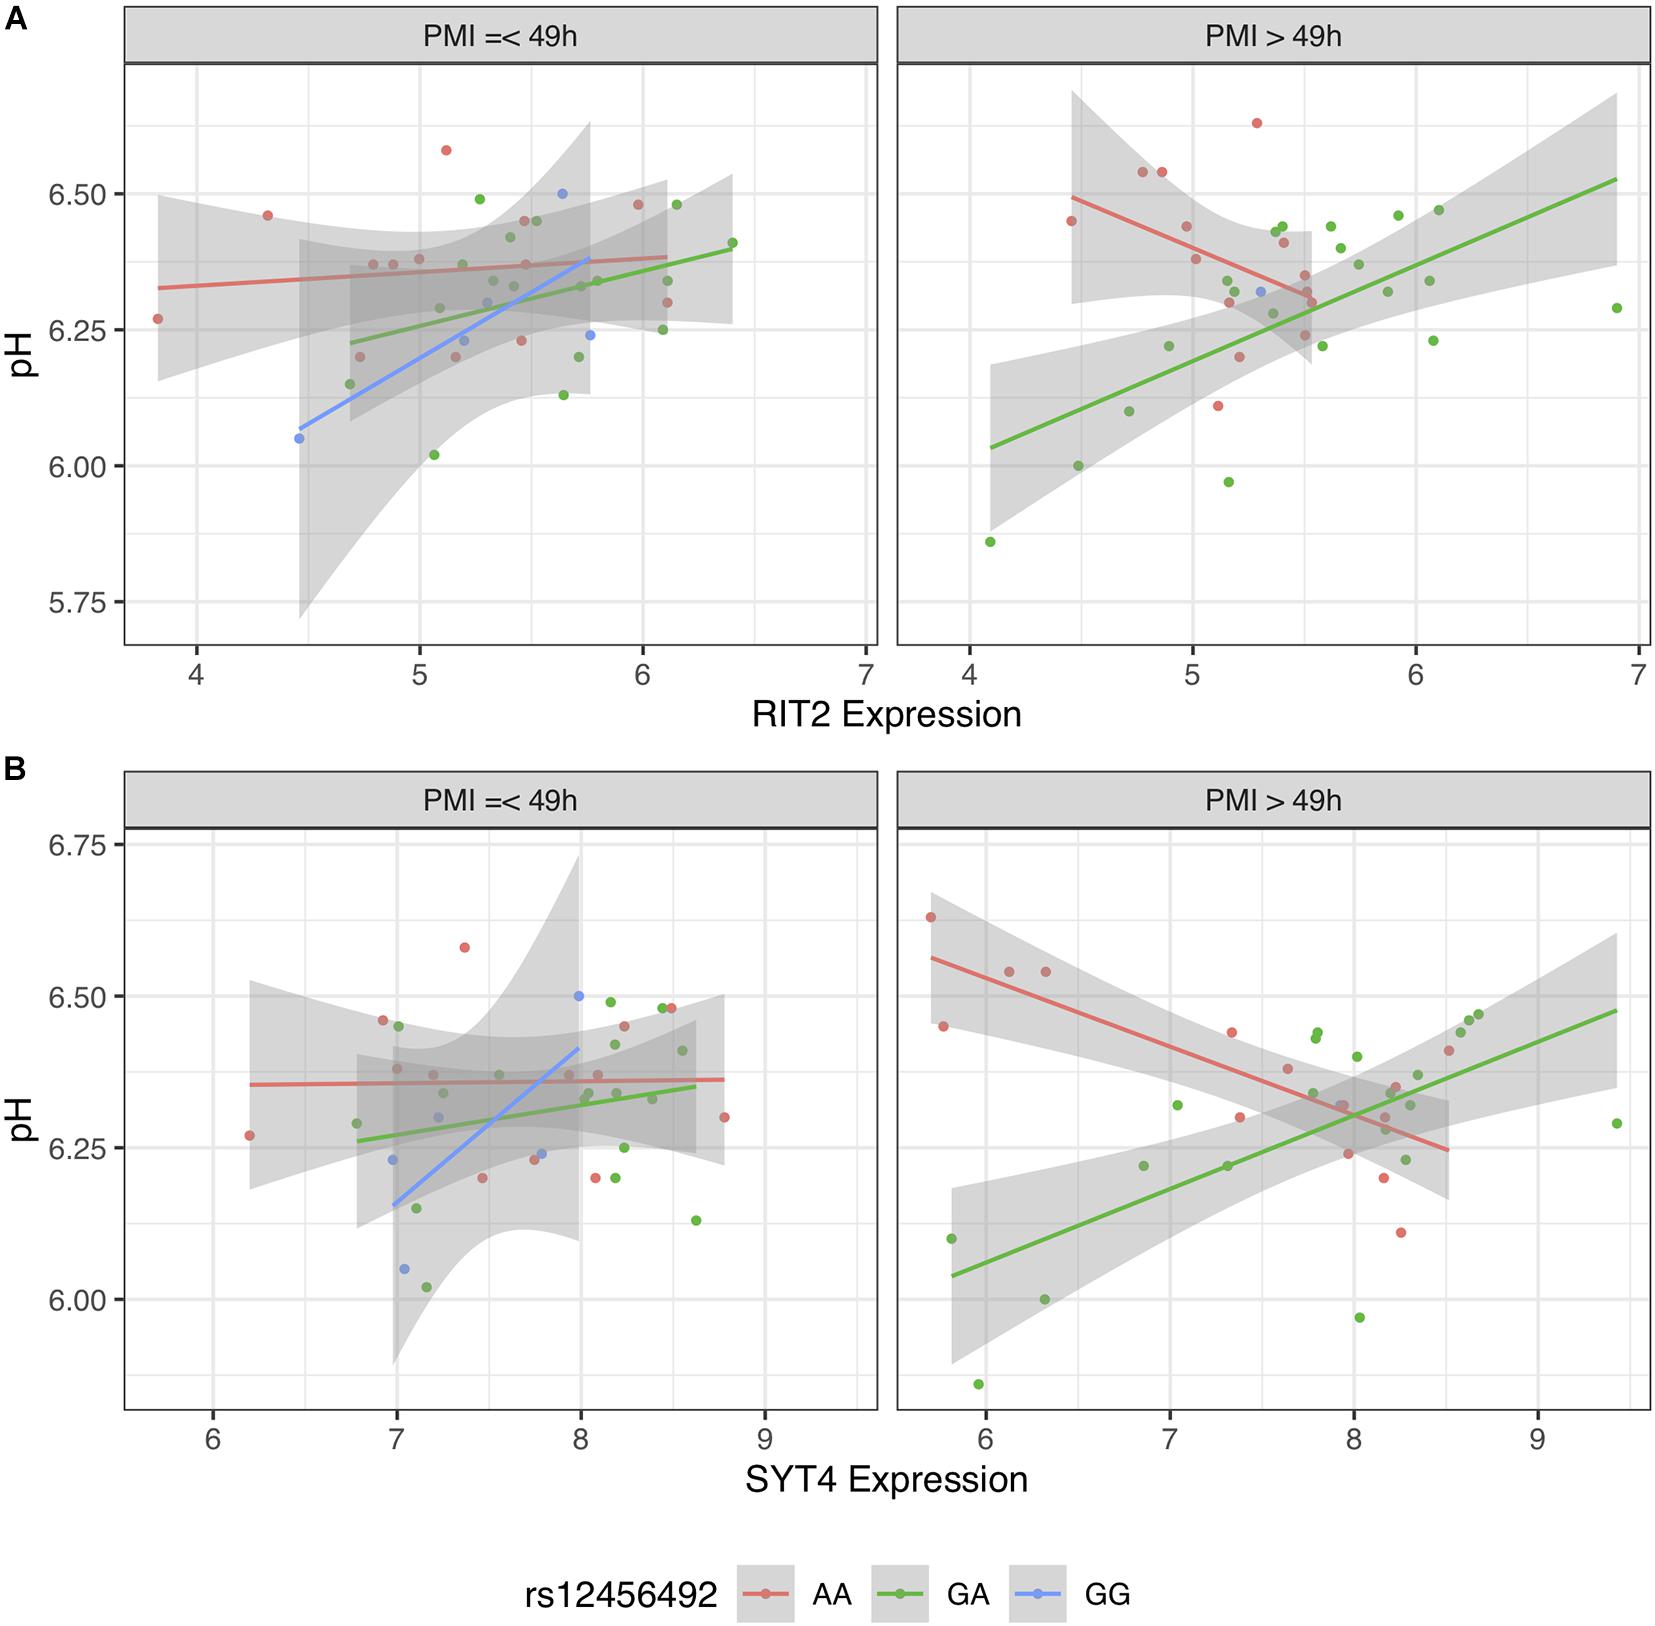
Figure 8. Scatter plot of pH and gene expression grouped by risk single nucleotide polymorphism (SNP) genotype and stratified PMI within BrainEAC sample for RIT2 (A) and SYT4 (B). Genotype groups are colored with lines representing linear fits with shaded areas marking the 0.95 confidence interval.
CA10 Is Co-expressed With SYT4 and RIT2
Using a co-expression search tool, the two genes most co-expressed with RIT2 were carbonic anhydrase 10 (CA10) and SYT4. Of the 97 brain datasets that excluded cancer studies, based on co-expression, the most relevant dataset was a study of Parkinson’s disease [GSE20146, (Zheng et al., 2010)]. In this top dataset that assayed expression in the globus pallidus interna (n = 19), RIT2 expression was correlated with CA10 (r = 0.52, p < 0.03) and SYT4 (r = 0.75, p < 0.0003), but SYT4 was not co-expressed with CA10 (r = 0.43, p = 0.065). Comparison of the correlation coefficients obtained from the PD cases and controls separately did not suggest differential co-expression. We note that CA10 gene expression is not a significant predictor for pH when accounting for the other covariates (sex, age, PMI, and RIN) in either BrainEAC or GTEx substantia nigra samples. Therefore the addition of CA10 does not improve the models in predicting pH.
Discussion
This study replicates the positive correlation between RIT2 gene expression and pH in the human brain. Furthermore, we found that a co-localized PD-associated genetic variant altered this relationship between expression and pH. When tested across ten brain regions, this interaction is specifically found in the substantia nigra, the primary location of PD pathology. A similar association was found for the neighboring SYT4 gene. For non-carriers of the risk allele, the brain-wide positive correlation between gene expression and pH is inverted in the substantia nigra. In a combined model with both genes, the SYT4 relationship is stronger. We attempted to replicate these findings using the GTEx dataset. However, the association between the risk allele and gene expression of either SYT4 and RIT2 with pH was not seen. We observed that the PMI values were longer in the BrainEAC cohort compared to the GTEx cohort. After stratifying the BrainEAC samples by PMI, we only observed the relationship in the longer PMI group. These associations implicate interactions between rs12456492, PMI, RIT2, and SYT4 in regulating pH in the brain.
Known molecular mechanisms that could explain the observed pH-eQTL are lacking. One exception is a recent study of interactions between RIT2 and LRRK2 (Obergasteiger et al., 2021). Using postmortem gene expression data, Obergasteiger et al. observed down-regulation of RIT2 in the substantia nigra of PD cases. In support, they observed reduced RIT2 expression in neuroblastoma cell lines overexpressing LRRK2. Overexpression of RIT2 and a PD-associated LRRK2 mutant in these cells resulted in a higher number of autophagosomes and lysosomes. Both of these cellular components are acidic, suggesting autophagy-related regulation may underlie the pH interactions we observe.
Both SYT4 and CA10 are co-expressed with RIT2. Unlike RIT2 and SYT4, carbonic anhydrases are known to regulate intracellular and extracellular pH (Wingo et al., 2001). However, CA10 is catalytically inactive and forms complexes with synaptic proteins (Sjöblom et al., 1996; Nishimori et al., 2013; Sterky et al., 2017). In agreement, CA10 gene expression was not a predictor for brain pH when added to either the RIT2 or SYT4 models. Recently, Payan-Gomez et al. performed a co-expression network analysis of the human prefrontal cortex. In this analysis that used brain samples from old and young individuals, CA10 was identified as a central gene in the network (Payán-Gómez et al., 2019). A related gene, CA2, was found to be elevated in mitochondria from middle-aged mouse brain samples (Pollard et al., 2016). Furthermore, carbonic anhydrase inhibitors have been found to prevent amyloid beta-induced mitochondrial toxicity (Fossati et al., 2016; Solesio et al., 2018). Further study of interactions between RIT2 and CA10 may reveal pH regulation mechanisms relevant to PD.
When stratified by sex, the pH-eQTL relationship was not observed in females. This was more evident for SYT4 than RIT2. The prevalence of PD is higher in males than females (Marras et al., 2018). Although our analysis was limited by sample size, we postulate that this sex-specific effect may help understand differences in PD incidence.
We suspect that we did not validate our findings in the GTEx dataset because of short PMI values in comparison to the BrainEAC samples. The differences between the datasets are apparent, as there is no overlap between the PMI values. When the BrainEAC cohort is split into short and long PMI groups, the results replicate the cohort differences. Specifically, the pH-eQTL relationship is observed in the samples with long but not short PMI. In agreement, studies of postmortem expression have found gene, and genotype-dependent associations with PMI (Zhu et al., 2017; Scott et al., 2020). Although we performed our analyses on neuropathologically normal brains, we speculate that a longer PMI value represents a neurodegenerative state that may mimic the nigral degeneration observed in the Parkinsonian brain. However, the neurodegenerative state caused by Parkinson’s disease is likely very different from the postmortem environment. Follow-up studies of postmortem samples or cell cultures derived from PD patients are warranted to test our findings in an experimental setting.
This study described a relationship between gene expression and pH that interacted with genetic variation. Our analysis of this pH-eQTL relationship is constrained to the RIT2 locus that is associated with PD risk and is only observed in substantia nigra. Additional interactions with sex and PMI were observed for SYT4 and, to a lesser degree, RIT2. These previously unknown associations suggest pH-associated roles for rs12456492, RIT2, and SYT4 in the Parkinsonian brain.
Data Availability Statement
Scripts and data for reproducing the majority of the analyses are publicly available online at https://github.com/Sejal24/PD_Manuscript_RIT2_SYT4_pH. The GTEx data is available via DBGap6 (Accession: phs000424.v8.p2).
Author Contributions
SP and LF conceptualized the design of the study and were involved in data analysis and writing of the manuscript. SP, LF, and DH contributed to the data acquisition and editing of the manuscript. All authors contributed to the article and approved the submitted version.
Funding
This study was supported by the CAMH Foundation, CAMH Discovery Fund, and a National Science and Engineering Research Council of Canada (NSERC) Discovery Grant to LF.
Conflict of Interest
LF owns shares in and has received consulting fees from Cortexyme Inc., a company that is developing gingipain inhibitors to treat neurodegenerative diseases.
The remaining authors declare that the research was conducted in the absence of any commercial or financial relationships that could be construed as a potential conflict of interest.
Acknowledgments
We thank the GTEx team for adding brain pH to the database. We also thank Suneil Kalia and Lorraine Kalia for their insightful comments and suggestions.
Footnotes
- ^ http://www.braineac.org/
- ^ https://gtexportal.org/
- ^ https://seek.princeton.edu/
- ^ https://gemma.msl.ubc.ca/
- ^ https://www.r-project.org/
- ^ https://www.ncbi.nlm.nih.gov/gap/
References
Arias, R. L., Sung, M.-L. A., Vasylyev, D., Zhang, M.-Y., Albinson, K., Kubek, K., et al. (2008). Amiloride is neuroprotective in an MPTP model of Parkinson’s disease. Neurobiol. Dis. 31, 334–341. doi: 10.1016/j.nbd.2008.05.008
Balut, C., vandeVen, M., Despa, S., Lambrichts, I., Ameloot, M., Steels, P., et al. (2008). Measurement of cytosolic and mitochondrial pH in living cells during reversible metabolic inhibition. Kidney Int. 73, 226–232. doi: 10.1038/sj.ki.5002632
Bandopadhyay, R., Kingsbury, A. E., Cookson, M. R., Reid, A. R., Evans, I. M., Hope, A. D., et al. (2004). The expression of DJ-1 (PARK7) in normal human CNS and idiopathic Parkinson’s disease. Brain 127, 420–430. doi: 10.1093/brain/awh054
Bellou, V., Belbasis, L., Tzoulaki, I., Evangelou, E., and Ioannidis, J. P. A. (2016). Environmental risk factors and Parkinson’s disease: an umbrella review of meta-analyses. Parkinsonism Relat. Disord. 23, 1–9. doi: 10.1016/j.parkreldis.2015.12.008
Canet-Avilés, R. M., Wilson, M. A., Miller, D. W., Ahmad, R., McLendon, C., Bandyopadhyay, S., et al. (2004). The Parkinson’s disease protein DJ-1 is neuroprotective due to cysteine-sulfinic acid-driven mitochondrial localization. Proc. Natl. Acad. Sci. U. S. A. 101, 9103–9108. doi: 10.1073/pnas.0402959101
Chakrabarty, P., Ceballos-Diaz, C., Lin, W.-L., Beccard, A., Jansen-West, K., McFarland, N. R., et al. (2011). Interferon-γ induces progressive nigrostriatal degeneration and basal ganglia calcification. Nat. Neurosci. 14, 694–696. doi: 10.1038/nn.2829
Chang, D., Nalls, M. A., Hallgrímsdóttir, I. B., Hunkapiller, J., van der Brug, M., Cai, F., et al. (2017). A meta-analysis of genome-wide association studies identifies 17 new Parkinson’s disease risk loci. Nat. Genet. 49, 1511–1516. doi: 10.1038/ng.3955
Chen, C., Turnbull, D. M., and Reeve, A. K. (2019). Mitochondrial dysfunction in Parkinson’s disease-cause or consequence? Biology 8:38. doi: 10.3390/biology8020038
Costa, J., Lunet, N., Santos, C., Santos, J., and Vaz-Carneiro, A. (2010). Caffeine exposure and the risk of Parkinson’s disease: a systematic review and meta-analysis of observational studies. J. Alzheimers. Dis. 20(Suppl. 1) S221–S238. doi: 10.3233/JAD-2010-091525
Dean, C., Liu, H., Dunning, F. M., Chang, P. Y., Jackson, M. B., and Chapman, E. R. (2009). Synaptotagmin-IV modulates synaptic function and long-term potentiation by regulating BDNF release. Nat. Neurosci. 12, 767–776. doi: 10.1038/nn.2315
Do, C. B., Tung, J. Y., Dorfman, E., Kiefer, A. K., Drabant, E. M., Francke, U., et al. (2011). Web-based genome-wide association study identifies two novel loci and a substantial genetic component for Parkinson’s disease. PLoS Genet. 7:e1002141. doi: 10.1371/journal.pgen.1002141
Edgar, R., Domrachev, M., and Lash, A. E. (2002). Gene expression omnibus: NCBI gene expression and hybridization array data repository. Nucleic Acids Res. 30, 207–210. doi: 10.1093/nar/30.1.207
Fossati, S., Giannoni, P., Solesio, M. E., Cocklin, S. L., Cabrera, E., Ghiso, J., et al. (2016). The carbonic anhydrase inhibitor methazolamide prevents amyloid beta-induced mitochondrial dysfunction and caspase activation protecting neuronal and glial cells in vitro and in the mouse brain. Neurobiol. Dis. 86, 29–40. doi: 10.1016/j.nbd.2015.11.006
Kent, W. J., Sugnet, C. W., Furey, T. S., Roskin, K. M., Pringle, T. H., Zahler, A. M., et al. (2002). The human genome browser at UCSC. Genome Res. 12, 996–1006. doi: 10.1101/gr.229102
Koga, K., Mori, A., Ohashi, S., Kurihara, N., Kitagawa, H., Ishikawa, M., et al. (2006). 1H MRS identifies lactate rise in the striatum of MPTP-treated C57BL/6 mice. Eur. J. Neurosci. 23, 1077–1081. doi: 10.1111/j.1460-9568.2006.04610.x
Lee, C. H., Della, N. G., Chew, C. E., and Zack, D. J. (1996). Rin, a neuron-specific and calmodulin-binding small G-protein, and Rit define a novel subfamily of ras proteins. J. Neurosci. 16, 6784–6794.
Lim, N., Tesar, S., Belmadani, M., Poirier-Morency, G., Mancarci, B. O., Sicherman, J., et al. (2021). Curation of over 10 000 transcriptomic studies to enable data reuse. Database 2021:baab006. doi: 10.1093/database/baab006
Liscovitch, N., and French, L. (2014). Differential co-expression between α-Synuclein and IFN-γ signaling genes across development and in Parkinson’s disease. PLoS One 9:e115029. doi: 10.1371/journal.pone.0115029
Lonsdale, J., Thomas, J., Salvatore, M., Phillips, R., Lo, E., Shad, S., et al. (2013). The Genotype-Tissue Expression (GTEx) project. Nat. Genet. 45, 580–585. doi: 10.1038/ng.2653
Lv, Z., Krasnoslobodtsev, A. V., Zhang, Y., Ysselstein, D., Rochet, J. C., Blanchard, S. C., et al. (2016). Effect of acidic pH on the stability of α-synuclein dimers. Biopolymers 105, 715–724. doi: 10.1002/bip.22874
Marras, C., Beck, J. C., Bower, J. H., Roberts, E., Ritz, B., Ross, G. W., et al. (2018). Prevalence of Parkinson’s disease across North America. NPJ Parkinsons Dis. 4:21. doi: 10.1038/s41531-018-0058-0
Mendez, J. A., Bourque, M.-J., Fasano, C., Kortleven, C., and Trudeau, L.-E. (2011). Somatodendritic dopamine release requires synaptotagmin 4 and 7 and the participation of voltage-gated calcium channels. J. Biol. Chem. 286, 23928–23937. doi: 10.1074/jbc.M111.218032
Millar, T., Walker, R., Arango, J.-C., Ironside, J. W., Harrison, D. J., MacIntyre, D. J., et al. (2007). Tissue and organ donation for research in forensic pathology: the MRC sudden death brain and tissue bank. J. Pathol. 213, 369–375. doi: 10.1002/path.2247
Mistry, M., and Pavlidis, P. (2010). A cross-laboratory comparison of expression profiling data from normal human postmortem brain. Neuroscience 167, 384–395. doi: 10.1016/j.neuroscience.2010.01.016
Moriarty, G. M., Olson, M. P., Atieh, T. B., Janowska, M. K., Khare, S. D., and Baum, J. (2017). A pH-dependent switch promotes β-synuclein fibril formation via glutamate residues. J. Biol. Chem. 292, 16368–16379. doi: 10.1074/jbc.M117.780528
Nalls, M. A., Blauwendraat, C., Vallerga, C. L., Heilbron, K., Bandres-Ciga, S., Chang, D., et al. (2019). Identification of novel risk loci, causal insights, and heritable risk for Parkinson’s disease: a meta-analysis of genome-wide association studies. Lancet Neurol. 18, 1091–1102. doi: 10.1016/S1474-4422(19)30320-5
Navaroli, D. M., Stevens, Z. H., Uzelac, Z., Gabriel, L., King, M. J., Lifshitz, L. M., et al. (2011). The plasma membrane-associated GTPase Rin interacts with the dopamine transporter and is required for protein kinase C-regulated dopamine transporter trafficking. J. Neurosci. 31, 13758–13770. doi: 10.1523/JNEUROSCI.2649-11.2011
Nishimori, I., Vullo, D., Minakuchi, T., Scozzafava, A., Capasso, C., and Supuran, C. T. (2013). Restoring catalytic activity to the human carbonic anhydrase (CA) related proteins VIII, X and XI affords isoforms with high catalytic efficiency and susceptibility to anion inhibition. Bioorg. Med. Chem. Lett. 23, 256–260. doi: 10.1016/j.bmcl.2012.10.103
Obergasteiger, J., Castonguay, A.-M., Frapporti, G., Lobbestael, E., Baekelandt, V., Hicks, A. A., et al. (2021). RIT2 reduces LRRK2 kinase activity and protects against alpha-synuclein neuropathology. bioRxiv [Preprint]. doi: 10.1101/2020.10.21.348144
Pankratz, N., Beecham, G. W., DeStefano, A. L., Dawson, T. M., Doheny, K. F., Factor, S. A., et al. (2012). Meta-analysis of Parkinson’s disease: identification of a novel locus, RIT2. Ann. Neurol. 71, 370–384. doi: 10.1002/ana.22687
Payán-Gómez, C., Riaño-Moreno, J., Amador-Muñoz, D., and Ramírez-Clavijo, S. (2019). Co-expression network analysis identifies possible hub genes in aging of the human prefrontal cortex. Rev. Cienc. Salud 17, 201–222.
Pham, C. L. L., Leong, S. L., Ali, F. E., Kenche, V. B., Hill, A. F., Gras, S. L., et al. (2009). Dopamine and the dopamine oxidation product 5,6-dihydroxylindole promote distinct on-pathway and off-pathway aggregation of α-synuclein in a pH-dependent manner. J. Mol. Biol. 387, 771–785. doi: 10.1016/j.jmb.2009.02.007
Pollard, A., Shephard, F., Freed, J., Liddell, S., and Chakrabarti, L. (2016). Mitochondrial proteomic profiling reveals increased carbonic anhydrase II in aging and neurodegeneration. Aging 8, 2425–2436. doi: 10.18632/aging.101064
Ramasamy, A., Trabzuni, D., Guelfi, S., Varghese, V., Smith, C., Walker, R., et al. (2014). Genetic variability in the regulation of gene expression in ten regions of the human brain. Nat. Neurosci. 17, 1418–1428. doi: 10.1038/nn.3801
Rango, M., Dossi, G., Squarcina, L., and Bonifati, C. (2020). Brain mitochondrial impairment in early-onset Parkinson’s disease with or without PINK1 mutation. Mov. Disord. 35, 504–507. doi: 10.1002/mds.27946
Scott, L., Finley, S. J., Watson, C., and Javan, G. T. (2020). Life and death: a systematic comparison of antemortem and postmortem gene expression. Gene 731:144349. doi: 10.1016/j.gene.2020.144349
Sinning, A., and Hübner, C. A. (2013). Minireview: pH and synaptic transmission. FEBS Lett. 587, 1923–1928. doi: 10.1016/j.febslet.2013.04.045
Sjöblom, B., Elleby, B., Wallgren, K., Jonsson, B. H., and Lindskog, S. (1996). Two point mutations convert a catalytically inactive carbonic anhydrase-related protein (CARP) to an active enzyme. FEBS Lett. 398, 322–325. doi: 10.1016/s0014-5793(96)01263-x
Solesio, M. E., Peixoto, P. M., Debure, L., Madamba, S. M., de Leon, M. J., Wisniewski, T., et al. (2018). Carbonic anhydrase inhibition selectively prevents amyloid β neurovascular mitochondrial toxicity. Aging Cell 17:e12787. doi: 10.1111/acel.12787
Sterky, F. H., Trotter, J. H., Lee, S.-J., Recktenwald, C. V., Du, X., Zhou, B., et al. (2017). Carbonic anhydrase-related protein CA10 is an evolutionarily conserved pan-neurexin ligand. Proc. Natl. Acad. Sci. U. S. A. 114, E1253–E1262. doi: 10.1073/pnas.1621321114
Sun, Y., Pham, A. N., Hare, D. J., and Waite, T. D. (2018). Kinetic modeling of pH-dependent oxidation of dopamine by iron and its relevance to Parkinson’s disease. Front. Neurosci. 12:859. doi: 10.3389/fnins.2018.00859
Tajima, Y. (2010). Coffee-induced hypokalaemia. Clin. Med. Insights Case Rep. 3, 9–13. doi: 10.4137/ccrep.s4329
Trabzuni, D., Ryten, M., Walker, R., Smith, C., Imran, S., Ramasamy, A., et al. (2012). Quality control parameters on a large dataset of regionally dissected human control brains for whole genome expression studies. J. Neurochem. 120, 473–473. doi: 10.1111/j.1471-4159.2011.07602.x
Umek, N., Geršak, B., Vintar, N., Šoštarič, M., and Mavri, J. (2018). Dopamine autoxidation is controlled by acidic pH. Front. Mol. Neurosci. 11:467. doi: 10.3389/fnmol.2018.00467
Williams, J. K., Yang, X., Atieh, T. B., Olson, M. P., Khare, S. D., and Baum, J. (2018). Multi-pronged interactions underlie inhibition of α-synuclein aggregation by β-synuclein. J. Mol. Biol. 430, 2360–2371. doi: 10.1016/j.jmb.2018.05.024
Wingo, T., Tu, C., Laipis, P. J., and Silverman, D. N. (2001). The catalytic properties of human carbonic anhydrase IX. Biochem. Biophys. Res. Commun. 288, 666–669. doi: 10.1006/bbrc.2001.5824
Zheng, B., Liao, Z., Locascio, J. J., Lesniak, K. A., Roderick, S. S., Watt, M. L., et al. (2010). PGC-1α, a potential therapeutic target for early intervention in Parkinson’s disease. Sci. Transl. Med. 2, 52ra73. doi: 10.1126/scitranslmed.3001059
Keywords: RIT2, pH, rs12456492, substantia nigra (SN), Parkinson’s disease, SYT4, eQTL analysis, gene expression
Citation: Patel S, Howard D and French L (2021) A pH-eQTL Interaction at the RIT2–SYT4 Parkinson’s Disease Risk Locus in the Substantia Nigra. Front. Aging Neurosci. 13:690632. doi: 10.3389/fnagi.2021.690632
Received: 03 April 2021; Accepted: 14 June 2021;
Published: 09 July 2021.
Edited by:
Denis Gris, Université de Sherbrooke, CanadaReviewed by:
Martin Darvas, University of Washington, United StatesRegina Dahlhaus, Danube Private University, Austria
Copyright © 2021 Patel, Howard and French. This is an open-access article distributed under the terms of the Creative Commons Attribution License (CC BY). The use, distribution or reproduction in other forums is permitted, provided the original author(s) and the copyright owner(s) are credited and that the original publication in this journal is cited, in accordance with accepted academic practice. No use, distribution or reproduction is permitted which does not comply with these terms.
*Correspondence: Leon French, leonfrench@gmail.com
 Sejal Patel
 Derek Howard1
 Leon French