 Shraddha Sapkota
 G. Peggy McFall
 Mario Masellis
 Roger A. Dixon
- 1Hurvitz Brain Sciences Research Program, Sunnybrook Research Institute, Sunnybrook Health Sciences Centre, Toronto, ON, Canada
- 2Department of Psychology, University of Alberta, Edmonton, AB, Canada
- 3Neuroscience and Mental Health Institute, University of Alberta, Edmonton, AB, Canada
- 4Department of Medicine (Neurology), University of Toronto, Toronto, ON, Canada
Background: Multiple modalities of Alzheimer’s disease (AD) risk factors may operate through interacting networks to predict differential cognitive trajectories in asymptomatic aging. We test such a network in a series of three analytic steps. First, we test independent associations between three risk scores (functional-health, lifestyle-reserve, and a combined multimodal risk score) and cognitive [executive function (EF)] trajectories. Second, we test whether all three associations are moderated by the most penetrant AD genetic risk [Apolipoprotein E (APOE) ε4+ allele]. Third, we test whether a non-APOE AD genetic risk score further moderates these APOE × multimodal risk score associations.
Methods: We assembled a longitudinal data set (spanning a 40-year band of aging, 53–95 years) with non-demented older adults (baseline n = 602; Mage = 70.63(8.70) years; 66% female) from the Victoria Longitudinal Study (VLS). The measures included for each modifiable risk score were: (1) functional-health [pulse pressure (PP), grip strength, and body mass index], (2) lifestyle-reserve (physical, social, cognitive-integrative, cognitive-novel activities, and education), and (3) the combination of functional-health and lifestyle-reserve risk scores. Two AD genetic risk markers included (1) APOE and (2) a combined AD-genetic risk score (AD-GRS) comprised of three single nucleotide polymorphisms (SNPs; Clusterin[rs11136000], Complement receptor 1[rs6656401], Phosphatidylinositol binding clathrin assembly protein[rs3851179]). The analytics included confirmatory factor analysis (CFA), longitudinal invariance testing, and latent growth curve modeling. Structural path analyses were deployed to test and compare prediction models for EF performance and change.
Results: First, separate analyses showed that higher functional-health risk scores, lifestyle-reserve risk scores, and the combined score, predicted poorer EF performance and steeper decline. Second, APOE and AD-GRS moderated the association between functional-health risk score and the combined risk score, on EF performance and change. Specifically, only older adults in the APOEε4− group showed steeper EF decline with high risk scores on both functional-health and combined risk score. Both associations were further magnified for adults with high AD-GRS.
Conclusion: The present multimodal AD risk network approach incorporated both modifiable and genetic risk scores to predict EF trajectories. The results add an additional degree of precision to risk profile calculations for asymptomatic aging populations.
Introduction
Worldwide projections show expected increases in the prevalence of dementia (Prince et al., 2015; Livingston et al., 2017; Mapstone et al., 2017; Wimo et al., 2017). It is estimated that by delaying the onset of Alzheimer’s disease (AD) by 5 years, prevalence may be reduced by ∼50% (Reitz, 2016). Epidemiological evidence points toward a multifactorial etiology for cognitive changes in aging (Wang et al., 2019). A diverse set of risk and protective factors that co-occur over the lifespan have shown differential and dynamic influence on cognitive trajectories in aging (Anstey et al., 2014; Roberts et al., 2015; Zahodne et al., 2016; Van der Linden and Juillerat Van der Linden, 2018; Gilsanz et al., 2019; Wang et al., 2019). Complex multimodal networks (Badhwar et al., 2020) of non-modifiable (genetic) and modifiable risk factors (i.e., interactions and risk indexes; Dixon and Lachman, 2019) may identify asymptomatic older adults with high risk profiles and provide opportunity to delay accelerated cognitive decline.
Some recent studies have adopted a multimodal risk score approach whereby a composite of AD risk exposure is obtained by summing across risk indicators representing different risk domains (Hooshmand et al., 2018; Andrews et al., 2019; Deckers et al., 2020). There are several advantages to a risk score approach over single risk indicators, including (1) the incorporation of multiple risk factors into a single score (Hall et al., 2003), (2) relatively consistent risk scores across populations (D’Agostino et al., 2001), and (3) the concept of a high or low risk score can easily be explained to the general public (Reitz et al., 2010). Such risk scores have been developed with both modifiable and genetic risk factors. Some previously developed risk scores include the (1) the LIBRA index (Deckers et al., 2017; Vos et al., 2017; Schiepers et al., 2018) using only modifiable risk indicators to predict different cognitive domains (processing speed and memory) in a range of age groups (e.g., midlife versus oldest old), (2) the Cardiovascular Risk Factors, Aging and Dementia Study (CAIDE) Dementia Risk Score (Stephen et al., 2017) included age, gender, obesity, hyperlipidemia, hypertension, physical inactivity, and Apolipoprotein E (APOE) ε4 carrier status as risk indicators to estimate dementia risk (Enache et al., 2016) and cognitive profile of healthy adults (Ecay-Torres et al., 2018), (3) an AD polygenic risk score and AD status to predict clinical diagnosis (e.g., AD, vascular and mixed dementias) (Stocker et al., 2020), (4) the Australian National University-AD Risk Index (ANU-ADRI) is a validated (Anstey et al., 2014) self-report index measure on 15 risk factors (i.e., age, education, depressive symptoms, and physical inactivity) to predict dementia incidence (Anstey et al., 2013), and (5) a summary risk score developed to predict AD in older adults using vascular risk indicators and the APOE ε4+ allelic risk (Reitz et al., 2010). Genetic risk scores (Stocker et al., 2018) in non-demented older adults have been developed with polygenic risk scores (Andrews et al., 2016) and candidate gene single nucleotide polymorphisms (SNPs; Sapkota and Dixon, 2018). For example, in our previous work (Sapkota et al., 2015, 2017; Sapkota and Dixon, 2018), we established an AD-genetic risk score (AD-GRS; Clusterin [CLU; rs11136000] + Complement receptor 1 [CR1; rs6656401] + Phosphatidylinositol binding clathrin assembly protein [PICALM; rs3851179]) and a cognitive aging genetic risk score that influences executive function (EF) performance and change as modified by APOE (rs7412, rs4293580) in non-demented older adults. Notably, high AD-GRS risk magnified the risk associated with increasing cognitive aging genetic risk selectively for APOE ε4+ carriers on EF performance.
In the present study, we extend this work by using longitudinal data to test a multimodal risk network that integrates both modifiable and genetic risk factors to predict differential cognitive trajectories in non-demented aging (Medina et al., 2017). Specifically, we test whether associations between three modifiable risk scores and EF trajectories are moderated by key AD genetic risk scores. We emphasize that we are not predicting AD risk but using the AD risk factors to predict cognitive decline in non-demented aging. We use the term “network” to refer to the combination of modifiable and genetic risk domains represented with multiple indicators within each domain. Our multidomain network is represented and tested as follows. First, a pool of eight modifiable risk factors are clustered into two main modifiable domain risk scores {functional-health [pulse pressure (PP) + grip strength + body mass index (BMI)], lifestyle-reserve [physical activities + social activities, cognitive-integrative information processing + cognitive-novel information processing + education]} and a Modifiable-Composite Risk Score (M-CRS) combining functional-health + lifestyle-reserve risk score. Second, four SNPs (APOE, CLU, CR1, and PICALM) are represented as a key AD genetic risk (APOE) and an AD-GRS (CLU + CR1 + PICALM). Third, within this network, we examine whether the three modifiable domain risk scores predict differential EF performance and decline. Fourth, we test whether each of the three predictions are moderated (1) by a key AD genetic risk factor (stratified into APOE ε4− versus ε4+) and (2) further moderated by an AD-GRS (as stratified into low and high AD-GRS), to predict differential EF performance and decline in non-demented aging (see Figure 1). This study provides several novel contributions toward cognitive aging risk score predictions. First, we incorporate both modifiable risk scores and genetic risk scores, to predict EF trajectories. Second, we use an accelerated longitudinal design to test how risk scores predict EF trajectories across a unique 40-year band of aging in non-demented older adults. Third, we test whether a complex network of multimodal risk scores predicts EF. Specifically, whether genetic risk scores moderate modifiable risk scores to predict EF.
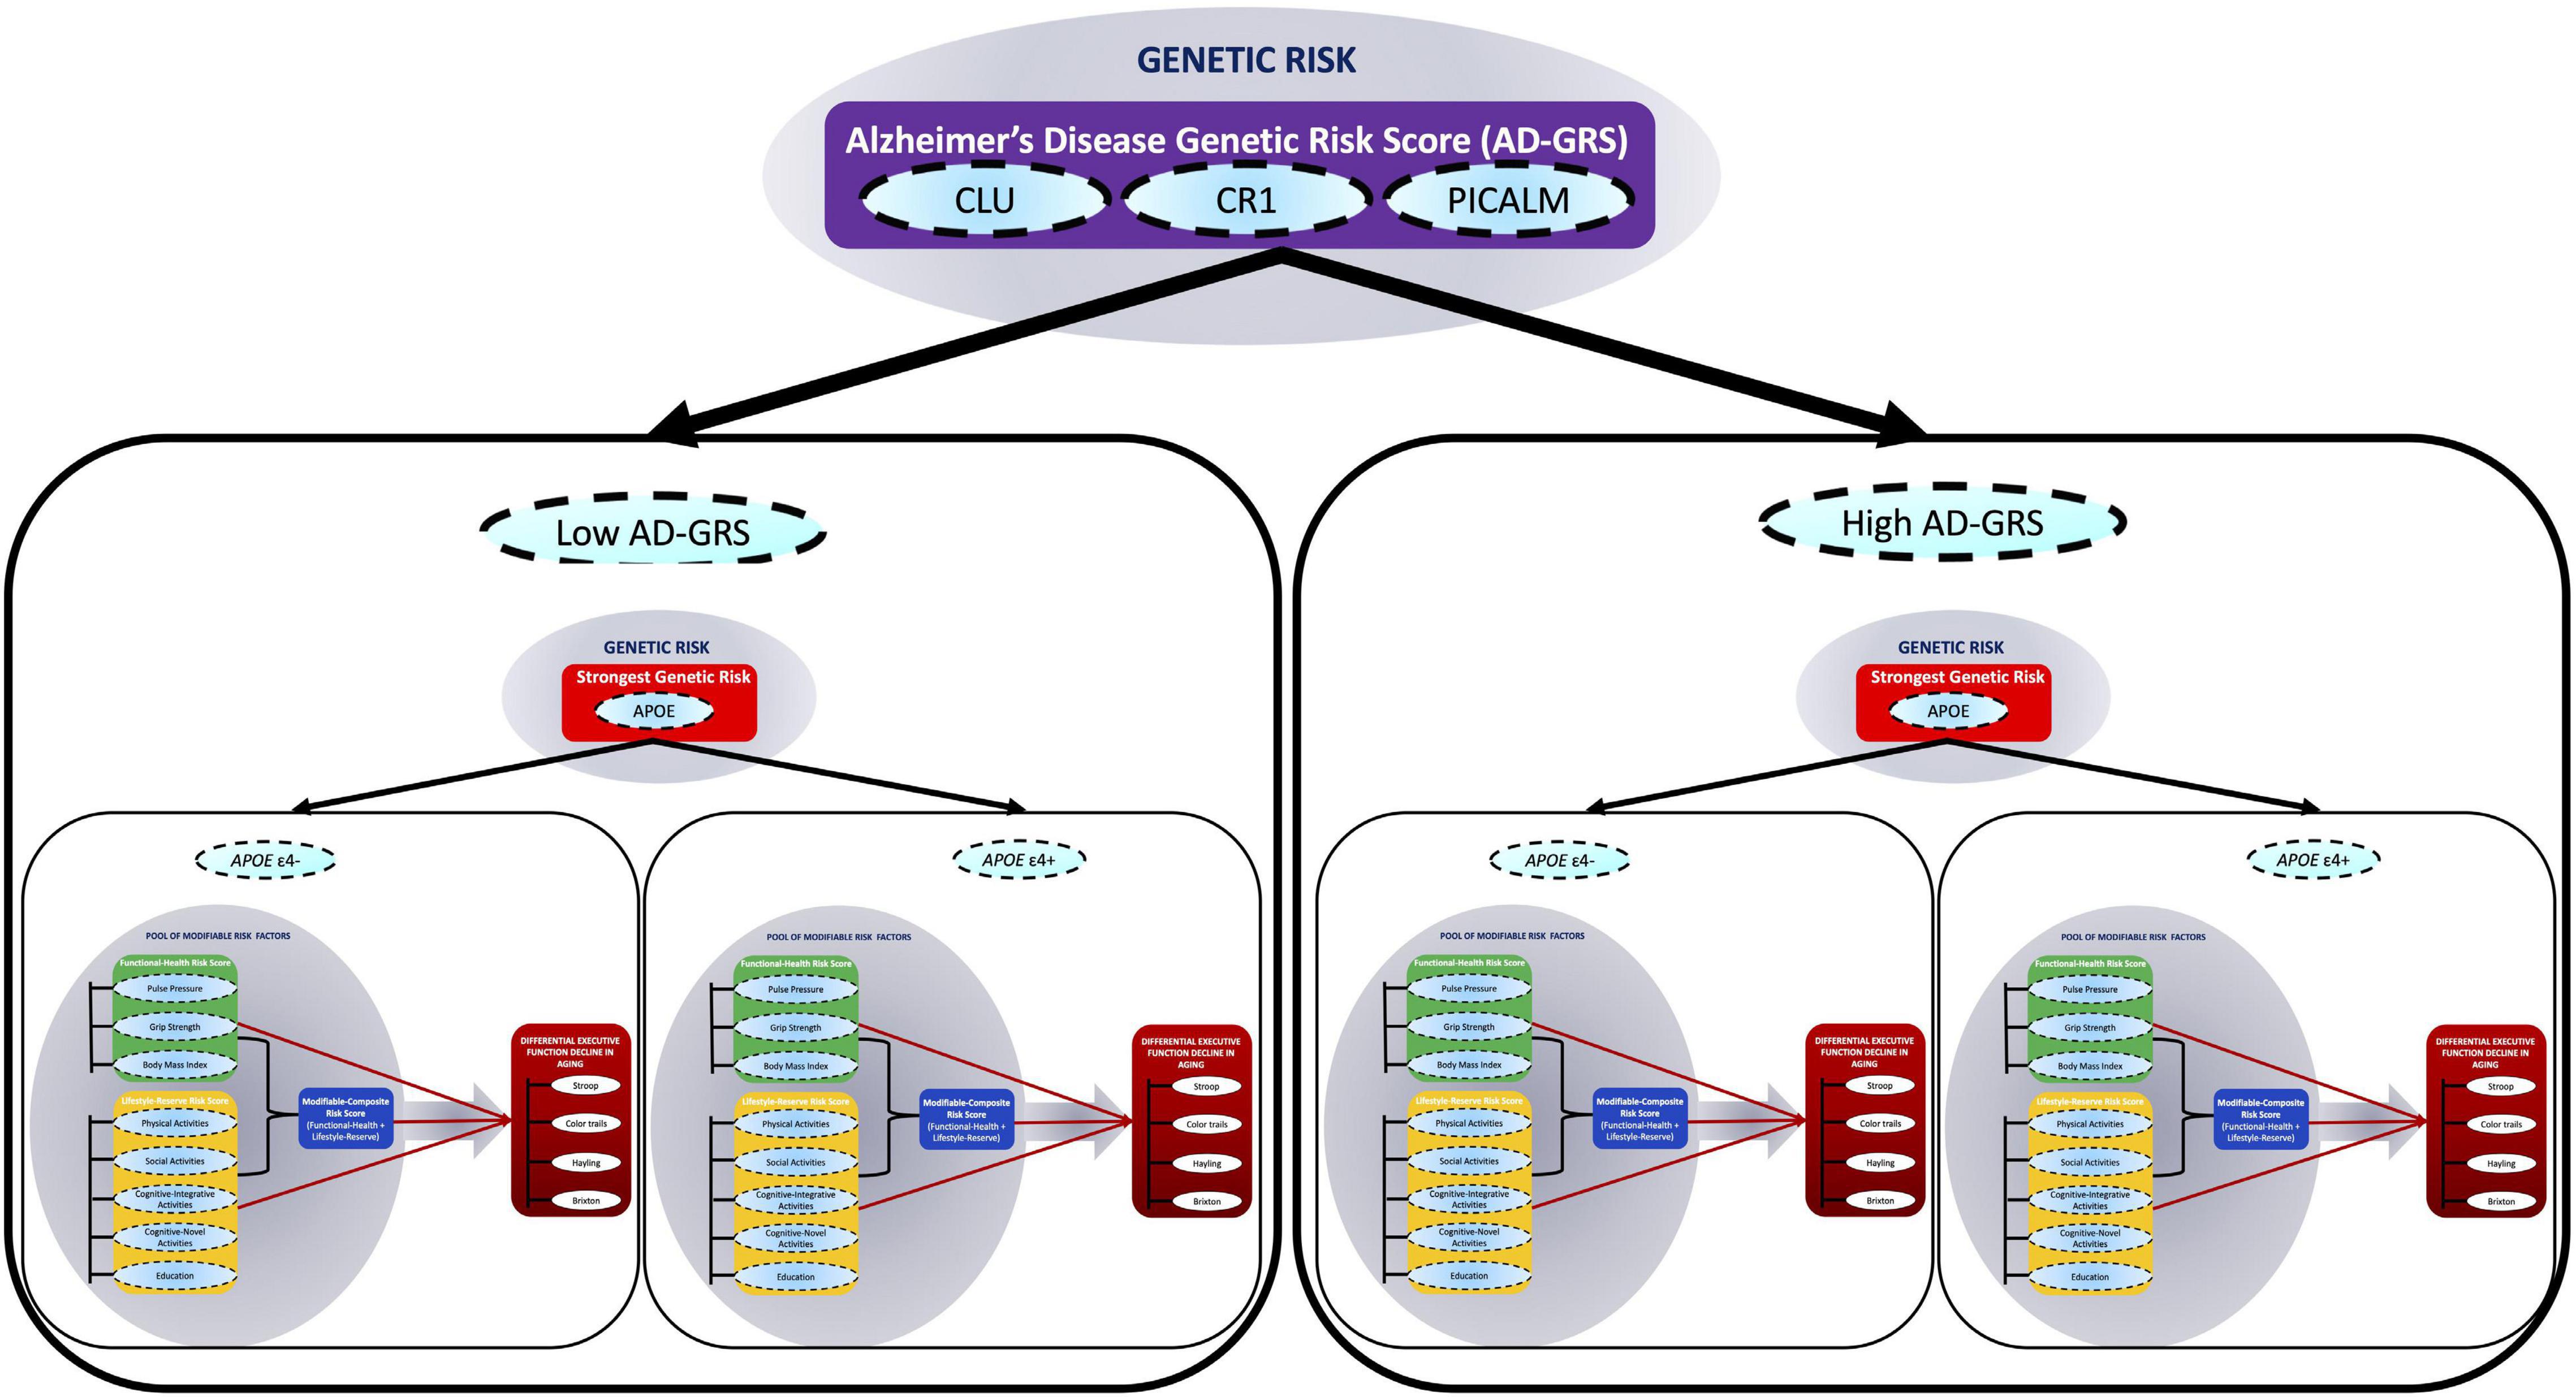
Figure 1. A multimodal risk network predicts executive function (EF) trajectories in non-demented aging. In this network, we include (1) a pool of eight modifiable risk factors [pulse pressure, grip strength, body mass index, physical activities, social activity, cognitive-integrative activity, cognitive-novel activity, and education], (2) four single nucleotide polymorphisms (SNPs) (APOE, CLU, CR1, and PICALM), and (3) four standard cognitive tests (Stroop, Color trails, Hayling, and Brixton). The modifiable risk factors are clustered into two main modifiable domain risk scores (functional-health and lifestyle-reserve) and a Modifiable-Composite Risk Score (M-CRS; functional-health + lifestyle-reserve). Functional-health risk score ranges from 0 to 5, lifestyle-reserve risk score ranges from 0 to 6, and the M-CRS ranges from 0 to 11. The SNPs are represented as a key AD genetic risk (APOE) and an Alzheimer’s disease genetic risk score (AD-GRS; CLU + CR1 + PICALM). The cognitive tests are combined to represent EF in aging. Within this network, first, we examine whether the three modifiable domain risk scores (functional-health, lifestyle-reserve, and a M-CRS) predict differential EF decline in aging. Second, we test whether each of the three predictions are moderated (1) by a key AD genetic risk factor (stratified into APOE ε4– versus ε4+) and (2) further moderated by an AD-GRS (as stratified into low and high AD-GRS), to predict differential EF performance and decline in non-demented aging.
The most prominent and consistently associated genetic risk factor for AD and cognitive decline is the APOE (chromosome 19q13.2) ε4 allele (Liu et al., 2013). APOE ε4 allelic risk is associated with increased risk for sporadic AD and accelerated cognitive decline whereas, the ε2 and ε3 alleles are considered to have protective and neutral effects, respectively (Liu et al., 2013). Non-demented older adults with APOE ε4 risk have higher amyloid pathology, medial temporal lobe atrophy, neuroinflammation, and ε4/ε4 homozygotes show the highest cerebral amyloid angiopathy (Nelson et al., 2013). A recent study using community-dwelling older adults showed that ε4 carriers had faster EF and verbal fluency decline than ε2 carriers and ε3 homozygotes (Reas et al., 2019). Inconsistent findings for APOE genetic risk versus polygenic risk score (PGRS) with APOE have also been reported. For example, a recent study showed that non-demented older adults with high PGRS are associated with cognitive decline but this association was no longer present when APOE genotype was removed (Porter et al., 2018). APOE ε4 allelic risk has also been linked to steeper memory decline in normal aging and cognitive decline in MCI (Albrecht et al., 2015). In addition to APOE, genome wide association studies (GWAS) have linked several other SNPs to increased dementia susceptibility, including: rs11136000 located within an intron of CLU on chromosome 8, rs6656401 at position 207692049 located near CR1 on chromosome 1, and rs3851179 is located 88.5 kb 5′ to PICALM on chromosome 11 (Harold et al., 2009; Lambert et al., 2013). CLU (rs1113600) is primarily involved with cholesterol metabolism, CR1 (rs6656401) with immune response, and PICALM (rs3851179) with endocytosis (Karch and Goate, 2015). Approximately 50% of AD patients are APOE ε4+ carriers (Karch et al., 2014) and only 10–15% of AD risk is attributable to AD-related SNPs commonly identified in GWAS. This suggests that there is a large difference in risk associated with APOE versus SNPs identified in GWAS. For this reason, we chose to separately examine risk associated with APOE and the AD-GRS composed of CLU, CR1, and PICALM. All three SNPs have been associated with accelerated cognitive decline in older adults (Mengel-From et al., 2011; Liu et al., 2018; Zijlstra et al., 2018). These three SNPs (as polygenic risk scores or in network analyses) have been shown to interact with other genetic risk factors to predict cognitive trajectories (Darst et al., 2017; Sapkota and Dixon, 2018; Dixon and Lachman, 2019). To our knowledge, the present study is the first to examine all three SNPs and APOE in a risk score analysis with modifiable risk scores to predict cognitive trajectories in normal aging.
Recent studies have reported a range of modifiable risk factors (Zaninotto et al., 2018; McFall et al., 2019b; Peters et al., 2019) to increased risk of cognitive decline and dementia. Risk factors linked to AD risk in some recent studies include brain-gut-microbiota axis (Kowalski and Mulak, 2019), diabetes (Edwards et al., 2019), diet (Szczechowiak et al., 2019), stress and depression (Ross et al., 2018), traumatic brain injury (Ramos-Cejudo et al., 2018), and smoking (Niu et al., 2018). Key modifiable risk factors examined in the present study were PP (McFall et al., 2016), grip strength, and lifestyle activities, including social activities and cognitive-novel information processing (McFall et al., 2019b). All selected risk factors are AD-related but have also been shown to be associated with non-AD outcomes, such as differential cognitive decline in asymptomatic aging as well as other dementia disorders. A combined modifiable risk score with a greater number of risk indicators may have higher predictive power to detect EF performance and decline. We briefly review the component indicators of each of the risk domains, with emphasis on their prediction of cognitive change in asymptomatic aging as well as associations with dementia.
In the functional-health risk score, we include PP, grip strength, and BMI (McFall et al., 2019b). PP is a reliable proxy of arterial stiffness that shows linear increase across older adulthood and is considered a better predictor of poor vascular health compared to systolic or diastolic blood pressure (Raz et al., 2011; Nation et al., 2013; McFall et al., 2015; Sapkota et al., 2018). Higher PP has been associated with steeper decline in EF trajectories (McFall et al., 2015) and faster decline in global cognition with increasing age (Levine et al., 2019). Higher levels of PP associated with steeper EF decline is moderated by APOE and CLU allelic risk (McFall et al., 2016). Specifically, carriers of low allelic risk for APOE (ε2+) and CLU (T/T) showed less differential EF decline with higher PP levels than APOE (ε4+) and CLU (C/C) risk carriers. Grip strength has been associated with cognitive abilities such as verbal and spatial ability, processing speed, and memory in adults over the age of 65 years (Sternäng et al., 2016). Non-demented older adults with poor grip strength showed declining cognitive performance for EF, episodic memory, semantic memory, and crystallized ability (MacDonald et al., 2011). Inconsistent results have been observed for BMI risk: (1) high BMI was associated with higher dementia risk (Emmerzaal et al., 2015), (2) high mid-life BMI associated with changes in gray matter may translate into memory impairments (Kharabian Masouleh et al., 2016), (3) high BMI was associated with poorer EF and language performance (Schmeidler et al., 2019), and (4) high BMI was associated with less decline in EF, speed and memory domains selectively for females (Bohn et al., 2020).
In the lifestyle-reserve risk score, we include measures of physical activity, social activity, cognitive-integrative information processing, cognitive-novel information processing, and education (McFall et al., 2019b). Involvement in physically challenging activities have been shown to delay AD onset (Vemuri et al., 2012; Chen W.W. et al., 2016; Wang et al., 2019) and regular physical activity has been associated with lower incidence of cognitive impairment (Palta et al., 2019; Tomata et al., 2019). In non-demented aging, higher everyday physical activity has been associated with higher performance on EF (Thibeau et al., 2016), memory (Bherer et al., 2013), and visuospatial functions (Lin et al., 2019). Physical activity in middle life and late life may reduce the risk of neurodegenerative diseases by approximately 35–45% (Hamer and Chida, 2008). A review of longitudinal studies on social activity showed that poor or no social activity is linked to increased dementia risk (Wang et al., 2002) and more late life social activity is connected with reduced risk of incident dementia (Marioni et al., 2015). Overall, greater engagement in social activities throughout life was associated with less cognitive decline in later life (Wang et al., 2012). Cognitive activities involve mentally stimulating, novel, and integrative tasks such as puzzles or playing board games. Greater participation in cognitive activities has been linked to reduced dementia risk (Wang et al., 2012; Yates et al., 2016). We include education as a proxy marker for reserve (McFall et al., 2019b). High education has been associated with greater cognitive reserve and superior cognitive performance in older adults (Zahodne et al., 2011; Anstey et al., 2015; Livingston et al., 2017; Dixon and Lachman, 2019). Older adults with high education levels may also be more engaged in healthier lifestyle activities (i.e., physical activity) (Shaw and Spokane, 2008).
Previous risk score predictions have focused on dementia incidence as the primary outcome (Reitz et al., 2010; Sindi et al., 2015). We build and examine three modifiable risk scores to predict differential EF performance and further test how an AD genetic risk network (represented with APOE and AD-GRS) moderates all three associations in non-demented older adults. EF is among a selected set of cognitive domains (e.g., episodic memory and neurocognitive speed) that are prominently associated with important brain and cognitive changes in normal aging, with implications for emerging impairment and dementia (de Frias et al., 2006; Luszcz, 2011; Turner and Spreng, 2012; McFall et al., 2017; Reuter-Lorenz et al., 2021). EF is typically characterized as having three important components: mental set shifting, updating information, and inhibition of responses (Miyake et al., 2000; Miyake and Friedman, 2012; Schnitzspahn et al., 2013; Friedman and Miyake, 2017). All three EF dimensions have been shown to have important implications in brain and cognitive aging (Raz et al., 1998; Gunning-Dixon and Raz, 2003; Raz and Rodrigue, 2006; de Frias et al., 2009). Decline in EF performance has typically been observed in normal aging (Luszcz, 2011; Sapkota et al., 2015, 2017; Sapkota and Dixon, 2018; Reuter-Lorenz et al., 2021) and at the onset of cognitive impairment (de Frias et al., 2009; McFall et al., 2017) or AD (Bäckman et al., 2005; Grober et al., 2008). We examined two common markers of EF inhibition (Hayling Sentence Completion, and Stroop) and EF shifting (Brixton Spatial Anticipation and Color Trails) using a validated latent EF variable representation. Our EF latent variable represents the broader EF domain and has several important advantages to both single and composite scores. These include: (1) statistically superior and robust estimation of the EF construct by incorporating four standard and widely used EF tests and reducing the number of models tested, (2) measurement errors associated with each indicator are adjusted in the model, (3) longitudinal invariance is established for the EF latent variable across all three waves, and (4) the EF factor is generalizable and replicable when these four standard tests are examined and also with other similar and available tests (Little, 2013; Bohn et al., 2020).
Research Questions
We examine APOE and the AD-GRS to test how genetic risk changes the association of modifiable risk scores on EF trajectories. The present study has three research questions (RQs).
Research Question 1
Do higher risk scores for (1) functional-health, (2) lifestyle-reserve, and (3) M-CRS, predict poorer EF performance and steeper decline? Which risk score has the highest predictive power to detect differences in EF performance and decline?
Research Question 2
Are the associations between the three modifiable risk scores and EF performance and decline moderated by APOE ε4+ risk?
Research Question 3
Is the APOE risk moderation for the association between three modifiable risk scores and EF further moderated by low and high AD-GRS?
Expectations
First, we expect to observe that those with high risk score for functional-health, lifestyle-reserve, and M-CRS would have worse EF performance and steeper decline. The M-CRS will have the highest predictive power to detect EF changes. Second, this association between modifiable risk scores and EF would be moderated by APOE with poorer EF performance and steeper decline in the APOE ε4+ group. Third, the APOE moderation would be further moderated by AD-GRS with the worse EF performance and decline in the high AD-GRS. We further expect that these effects would be most evident with high M-CRS.
Materials and Methods
Participants
We used data from the Victoria Longitudinal Study (VLS), a large scale, longitudinal study examining biomedical, health, genetic, lifestyle, cognitive, and other aspects of aging and dementia. All volunteers in the VLS were recruited as cognitively healthy adults initially between 53 and 85 years. Volunteers were recruited through advertisements and received a small honorarium for their participation. Written informed consent was obtained from all participants. The VLS and all present data collection procedures are in full and certified compliance with prevailing human/institutional research ethics guidelines. All VLS participants are recruited relatively healthy, non-demented, no adverse health histories, especially those that would affect brain and cognition such as stroke or dementia. For the present study, we applied the following exclusionary criteria to the genotyped VLS sample: (1) anti-psychotic medication (n = 4), (2) Mini-Mental State Exam scores less than 24 (n = 1), (3) uncontrolled hypertension (n = 1), (4) insulin-controlled diabetes (n = 4), (5) history of serious head injury (e.g., hospitalized) (n = 8), and (6) APOE ε2/ε4 genotype (n = 30). Accordingly, we assembled an accelerated longitudinal design (spanning age 53–95 years) with 602 non-demented older adults [mean age = 70.63 (8.70) years; % female = 66]. The present sample uses three waves of data on participants differing in baseline age, thus creating a broad distribution of individualized cognitive trajectories (McFall et al., 2019b). In the present sample, a segment of the participants (across all ages) were not available for a third wave. The number of participants for each wave were: (1) Wave 1, n = 602, (2) Wave 2, n = 493, and (3) Wave 3, n = 277 (incomplete testing at time of study: n = 228). The average retention rates from Wave 1 to Wave 2 was 81% and Wave 2 to Wave 3 was 56%. However, taking into account the incomplete testing at the time of study (n = 228) for participants with a third-wave opportunity, the Wave 2 to Wave 3 retention rate was 88%. The average interval was 4.4 years between Wave 1 and Wave 2, and 4.5 years between Wave 2 and Wave 3.
DNA Extraction and Genotyping
Saliva was collected according to standard procedures from Oragene DNA Genotek and stored at room temperature in Oragene® disks until DNA extraction. Specific details on genotyping for CLU (rs11136000), CR1 (rs6656401), PICALM (rs3851179), and APOE (rs7412, rs429358) are available elsewhere (Sapkota et al., 2017; Sapkota and Dixon, 2018). The genotype frequencies did not differ significantly from Hardy-Weinberg (HW) equilibrium for APOE (χ2 = 0.189, p = 0.66) and CLU (χ2 = 0.710, p = 0.40). We note that the CR1 (χ2 = 6.219, p = 0.01) and PICALM (χ2 = 36.955, p = 0.00) genotype frequencies were not in HW equilibrium. Our sample comprises of similar number of homozygotes and heterozygotes for CR1 (GG = 213, G/A = 332, A/A = 85) and PICALM (C/C = 151, C/T = 233, T/T = 245) which resulted in HW disequilibrium. We note that we are not using these two SNPs directly in our analysis but as contributing toward an overall genetic risk score. Deviation from HW equilibrium may be due to smaller sample size (in comparison to genome-wide association studies), population phenomena (i.e., natural selection) (Wishart et al., 2011), purifying selection, inbreeding, or copy number variation (Chen et al., 2017). HW calculations may be under powered or are not always reported in genetic association studies (Wittke-Thompson et al., 2005; Namipashaki et al., 2015). Deviations from HW with SNPs contributing toward an overall genetic risk score has been previously reported (Sapkota and Dixon, 2018). The APOE and AD-GRS groups from our previous work (Sapkota and Dixon, 2018) were used to examine moderation associations using APOE (risk = ε4+) and AD-GRS (CLU [risk = C+] + CR1 [risk = A+] + PICALM [risk = T+]). For AD-GRS calculation, first, we dichotomized CLU (risk: C/C, C/T; no risk: T/T), CR1 (risk: A/A, A/G; no risk: G/G), and PICALM (risk: T/T, T/C; no risk: C/C) into no risk (0) and risk (1) groups. Second, we summed across CLU, CR1, and PICALM to obtain a score for each adult ranging from 0 to 3. Third, we performed a median split for this score and grouped the CLU + CR1 + PICALM allelic risk score by low (0–1 risk allele) and high (2–3 risk allele) genetic risk. APOE was grouped into no risk (ε4-) and risk (ε4+) groups. Participant characteristics by APOE genotype (ε4-/ ε4+) are displayed in Table 1, and as further stratified by low and high AD-GRS are displayed in Table 2.
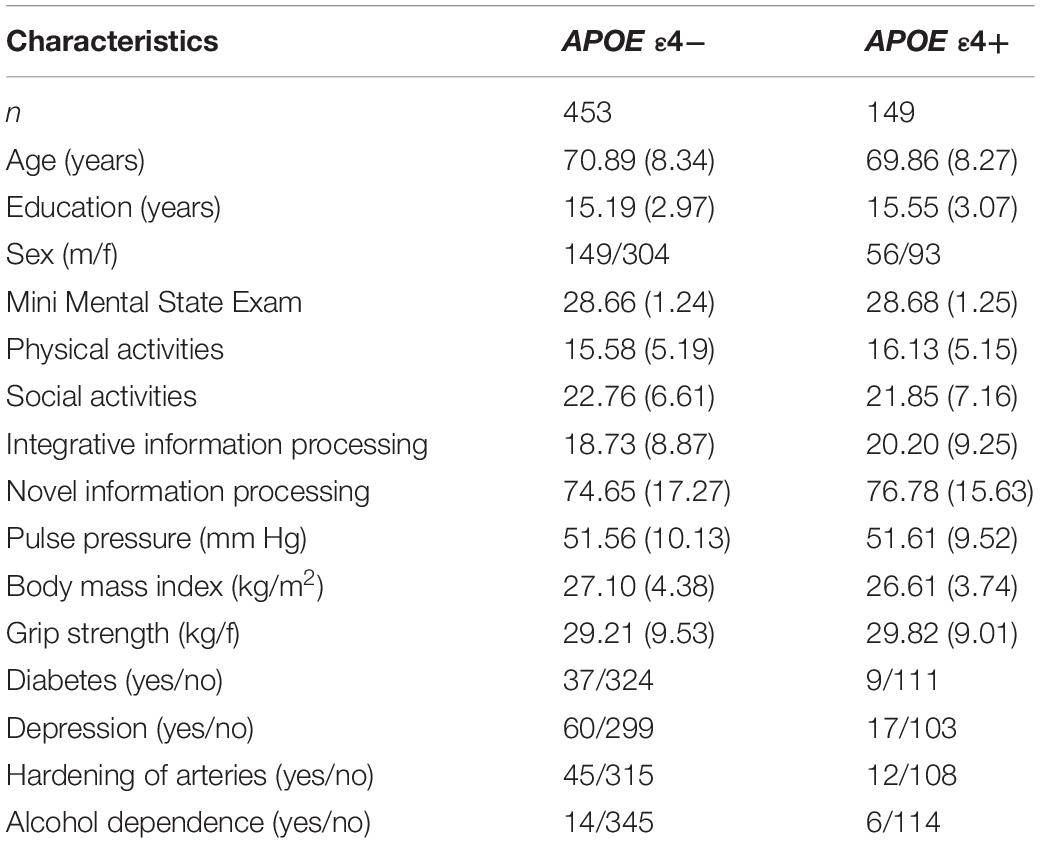
Table 1. Baseline participant characteristics as stratified by Apolipoprotein E (APOE) genotype (ε4-/ε4+).
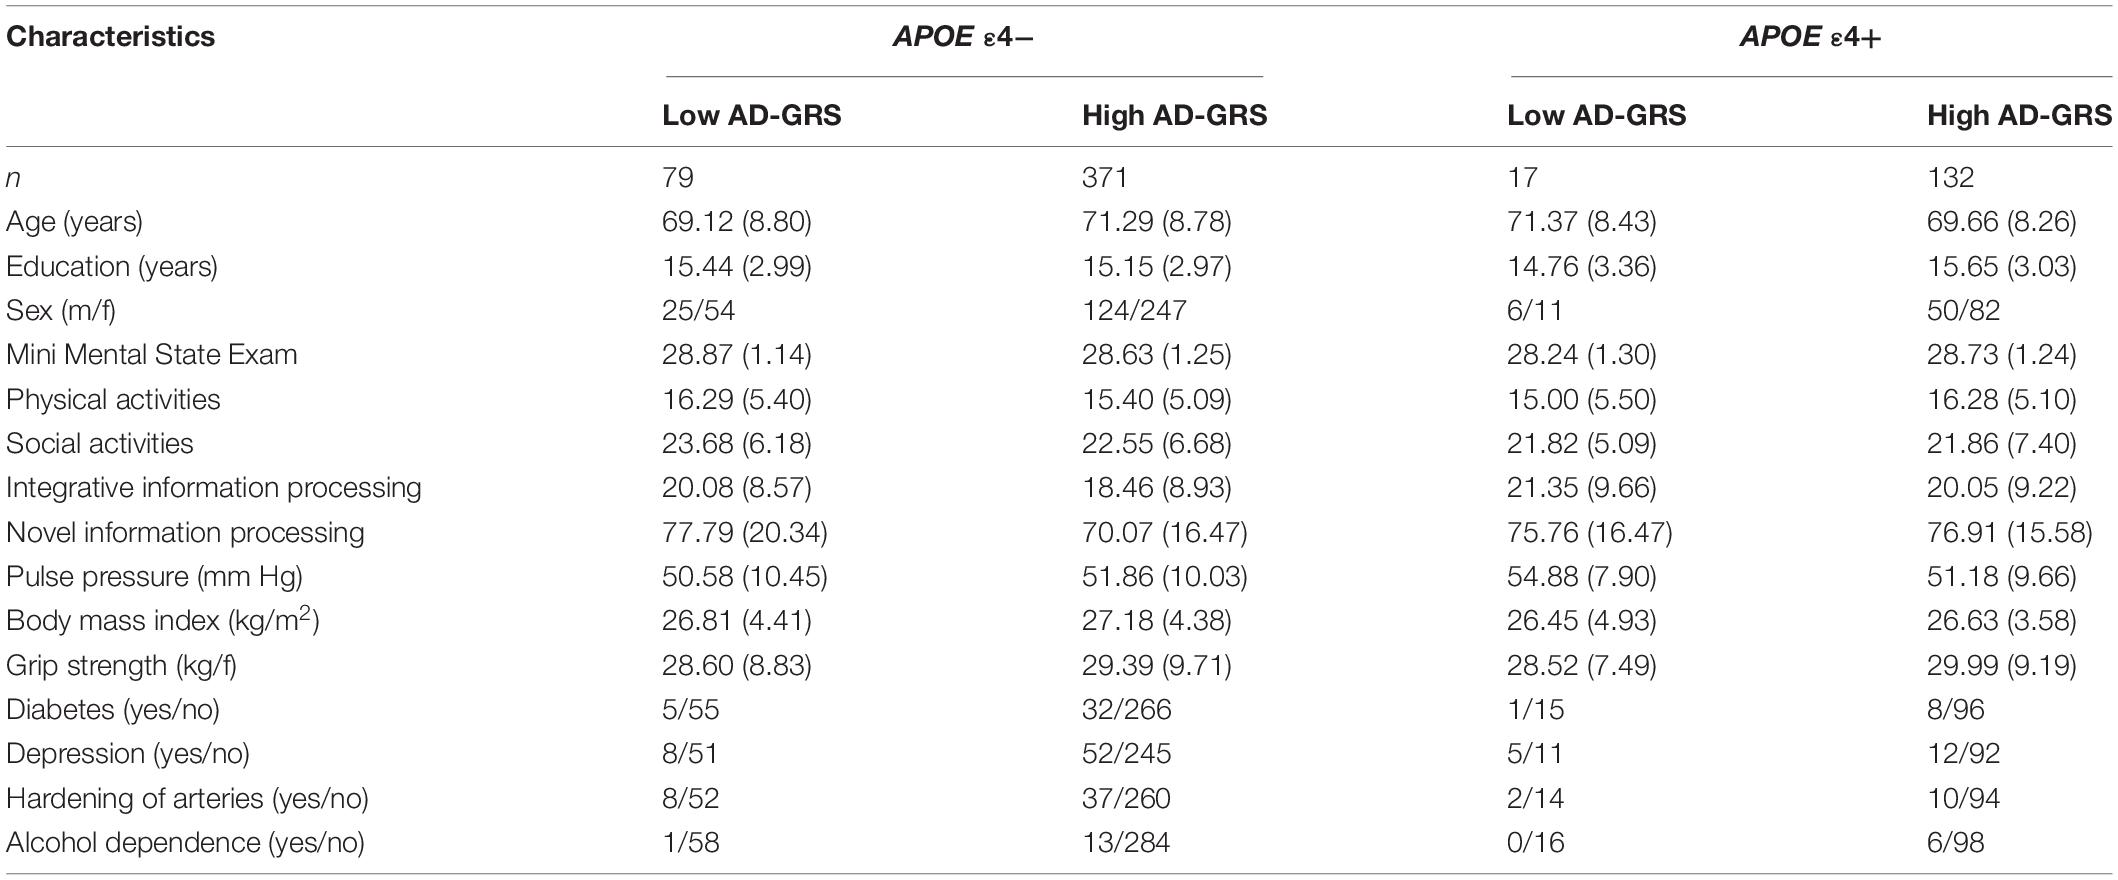
Table 2. Baseline participant characteristics as stratified by Apolipoprotein E (APOE) genotype (ε4-/ε4+) and Alzheimer’s disease genetic risk score (AD-GRS; Clusterin + Complement receptor 1+ Phosphatidylinositol-binding clathrin assembly protein).
Executive Function Measures
Two dimensions of EF (inhibition and shifting) were each measured by two standard and frequently used tests for cognitive, clinical, and neurobiological studies in older adults (de Frias et al., 2006; McFall et al., 2014; Sapkota and Dixon, 2018). Specific details on the procedures followed and scoring for Hayling sentence completion (inhibition) (Burgess and Shallice, 1997), Stroop (inhibition) (Taylor et al., 1997), Brixton spatial anticipation (shifting) (Burgess and Shallice, 1997), and color trails (shifting) (D’elia et al., 1996) are available elsewhere (Bielak et al., 2006; Sapkota et al., 2015).
Modifiable AD Risk Markers
Functional-health markers included baseline (1) PP [calculated with systolic blood pressure minus diastolic blood pressure (mmHg)], (2) grip strength [average hand strength (kg/force)], and (3) BMI [weight/height2 (kg/m2)].
Lifestyle activities were based on the VLS Activity Lifestyle Questionnaire (Small et al., 2012) used to determine the level or frequency of participation in everyday activities. For the present study we selected the following four domains: (1) social activity, such as visiting friends (7 items), (2) physical activity, such as gardening (4 items), (3) cognitive-integrative information processing, such as playing a musical instrument (12 items), and (4) cognitive-novel information processing, such as completing jigsaw puzzles (27 items). The frequency of participation is rated on a 9-point scale (never, less than once a year, about once a year, 2 or 3 times a year, about once a month, 2 or 3 times a month, about once a week, 2 or 3 times a week, daily).
Reserve was estimated by using education (total years) as a proxy (McFall et al., 2019b; Staekenborg et al., 2020).
Statistical Analyses
We used structural equation modeling for all analyses with Mplus Version 7.4. The best fitting model was determined by examining several fit statistics. The chi-square test of model (χ2; p > 0.05) allowed for an overall indication of good model fit. Additional absolute/comparative fit indices were also examined to determine a good model fit to the data (Kline, 2010): the root mean square error of approximation (RMSEA ≤ 0.05), comparative fit index (CFI ≥ 0.95), and the standardized root mean square residual (SRMR ≤ 0.08). All missing values were assumed to be missing at random (attrition) or missing completely at random (item nonresponse) (Little, 2013). We used maximum likelihood (Enders, 2011, 2013) to estimate all EF factor scores due to attrition in Wave 2 (18%) and Wave 3 (26%). Any missing predictor values (0.5–13%) were removed from analysis. Although our study had relatively high retention rates (and thus relatively low drop-out rates) across the three waves of testing [Wave 1 to Wave 2 was 81%, Wave 2 to Wave 3 (after accounting for the incomplete testing at the time of study) was 88%], we followed the current best practices for missing data estimation with attention to accuracy and replicability. Specifically, for our missing at random data in a structural equation modeling framework, we used maximum likelihood estimation. This technique minimizes the risk of drawing incorrect conclusions due to inflated Type 1 and Type 2 error, biased parameter estimates, inflated confidence intervals, and loss of information resulting in reduced statistical power (Enders and Bandalos, 2001; Enders, 2005; Baker, 2019).
Modifiable Risk Score Calculations
Each risk indicator included in the functional-health and lifestyle-reserve risk scores was categorized and ranged from 0 to 2 (2 = greater risk; see Table 3) (Anstey et al., 2014; McFall et al., 2016; Sapkota et al., 2017).
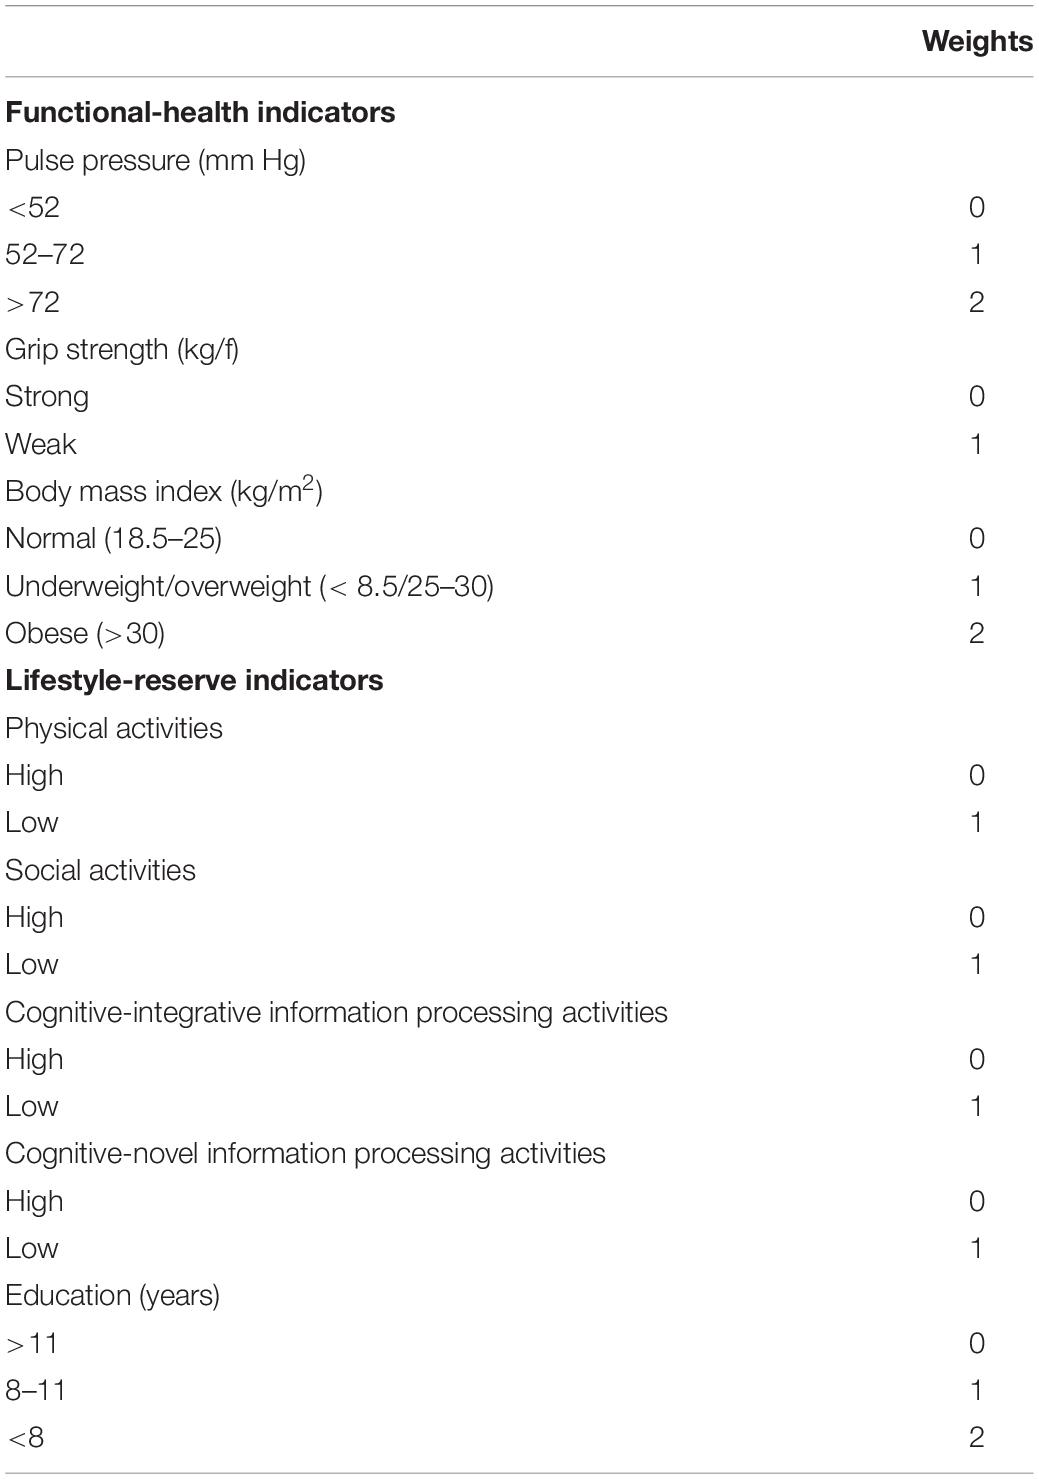
Table 3. Weights assigned to calculate risk scores for functional-health and lifestyle-reserve domains.
Functional-health risk score
Risk associated with three indicators was summed to obtain a total risk score ranging from 0 to 5. Specifically, PP was grouped into low (0) for adults with <52 mm Hg, moderate (1) for adults with PP between 52 and 72 mm Hg, and high (2) for adults with PP greater than 72 mm Hg. Grip strength was grouped into low (0) or high (1) using the mean (see Table 1) as a cut-off as stratified by APOE ε4-/ε4+ groups. BMI was grouped into normal (0) for adults with BMI from 18.5 to 25, underweight/overweight (1) for those with BMI < 18.5 and 25–30, respectively, and obese (2) for adults with BMI > 30.
Lifestyle-reserve risk score
Risk associated with the five indicators was summed to obtain a total risk score ranging from 0 to 6. Specifically, all lifestyle activities were grouped into lower and higher (Sapkota et al., 2017) where the mean (see Table 1) was used as the cut-off as stratified by APOE ε4-/ε4+ groups. Education was grouped into high (0) for adults with education greater than 11 years, moderate (1) for adults with 8–11 years of education, and low (2) for adults with less than 8 years of education.
Modifiable-composite risk score
The functional-health and lifestyle-reserve risk scores were summed to obtain a total risk score ranging from 0 to 11.
Foundational Statistical Analyses
Factor analyses for EF latent variable
We tested and confirmed a previously established one-factor EF latent variable. Specifically, confirmatory factor analysis (CFA) was used to examine loadings of all four manifest variables (Stroop, Hayling, Brixton, and Color trails) on the predicted latent variable. The first model tested all observed variables on one latent EF factor and the second model tested a two-factor shifting and inhibition model.
Longitudinal invariance
We established longitudinal invariance across all three waves for the best EF latent variable. First, we started with configural invariance, which establishes that all four indicators load on to the same factor. Second, metric invariance tests whether the unstandardized factor loadings at Waves 1–3 can be constrained and set to be equal to each other. Third, scalar invariance examines whether the four EF indicator intercepts can be constrained to be equal across all waves. Fourth, equal residuals invariance examines whether the EF factor can explain the same amount of variability across the three waves.
Latent growth model for EF
We determined the best latent growth model for the EF latent variable. We adopted a model building approach and started with a simple (null) model, and added parameters at each step to arrive at a baseline model of change. The null model assumes that there is no change over three waves, followed by the addition of fixed intercepts, random intercepts, fixed slope, random slope, fixed quadratic and random quadratic. First, in the null model, the variances for the intercepts were fixed across adults to 0. Second, in the random intercepts model, individuals were allowed to vary in intercept variance by removing the fixed intercept at 0. Third, a fixed linear slope was added to the baseline model by fixing the slope to 0 across all adults. The fixed linear slope assumed that all participants were changing in performance at the same rate. Fourth, adults were allowed to vary in their slope performance by removing the fixed linear slope constraint, and adding a random intercept and random linear slope model of change. Fifth, a fixed quadratic was added to the random intercept and random linear slope model, where both the intercepts and the slope were allowed to vary across individuals, but the curvilinear change was fixed across all participants. Following the examination of model fit, the χ2 difference statistic was calculated to detect any improvement in fit with the addition of free parameters at each step.
Main Statistical Analyses
Path analyses were conducted to examine associations of three modifiable risk scores on EF as moderated by AD genetic risk scores.
RQ1. EF was regressed on each modifiable risk score (functional-health, lifestyle-reserve, and M-CRS).
RQ2. To test APOE moderation, EF was regressed on all three risk scores as stratified by APOE ε4+ risk.
RQ3. To test subsequent moderation with AD-GRS, EF was regressed on all three risk scores as stratified by APOE ε4+ risk and subsequently stratified by low and high AD-GRS.
Due to sample size limitations with the two genetic moderation models, we did not test for sex differences in the present study. Instead, we included sex as a covariate in all models. Continuous age was used as the metric of change by transforming wave-based longitudinal design to age-based accelerated longitudinal design. We use chronological age (rather than, for example, wave) as the metric of change which takes into account all of the available ages (in years) that constitute the full age band of the study sample (i.e., 55–95 years). This 40-year band of aging fully accommodates each longitudinal trajectory produced by the individual participants, regardless of their starting age. The association between each independent variable and EF change is calculated and interpreted with age as essentially an integrated covariate. Statistically, this approach is better than indirectly using age through standard covariation techniques (Galbraith et al., 2014; McFall et al., 2016). Using age in this manner, we also take into account any EF changes due to age or risk factors directly influenced by age (such as APOE risk). To establish a baseline for our analyses, we centered chronological age at 75 years. Previous cognitive aging research has shown that age-related changes become evident at around 75 years (Small et al., 2011; Dixon et al., 2012), and this is consistent with recommended standards and other VLS research (Dixon et al., 2012; Thibeau et al., 2019; Bohn et al., 2020).
Results
Foundational Results
First, we established that the one-factor parsimonious model of EF provided the best fit to the data (Supplementary Table 1). Second, for longitudinal invariance, we obtained partial scalar longitudinal invariance for EF across all three waves (Supplementary Table 1). EF factor scores were computed and used in all subsequent models (see covariance coverage in Supplementary Table 2). Third, growth model analyses showed that the random intercept and random slope model was the best fit for the one-factor EF latent variable and was used in all subsequent analyses (Supplementary Table 3). To represent longitudinal data, EF factor scores were plotted in individualized trajectories over the 40-year band of aging (see Supplementary Figure 1). Taken together, these results were expected and showed that our one-factor EF construct best represents the overall characteristics of the four EF tests in our non-demented sample.
Research Question Results
Research Question 1
All three modifiable risk scores significantly predicted EF performance and decline. Overall, higher risk scores predicted lower EF performance and steeper decline (see Table 4). This pattern of association applied to: (1) functional-health risk scores (level: β = −0.135, SE = 0.048, p = 0.005; slope: β = −0.007, SE = 0.002, p = 0.003), (2) lifestyle-reserve risk scores (level: β = −0.197, SE = 0.035, p < 0.001; slope: β = −0.009, SE = 0.002, p < 0.001), and (3) M-CRS (level: β = −0.161, SE = 0.031, p < 0.001; slope: β = −0.007, SE = 0.001, p < 0.001). Informally, the lifestyle-reserve risk score had the highest regression coefficient to predict EF performance and decline. Sex was a significant covariate in the analyses for all three modifiable risk scores, with men showing steeper EF decline.
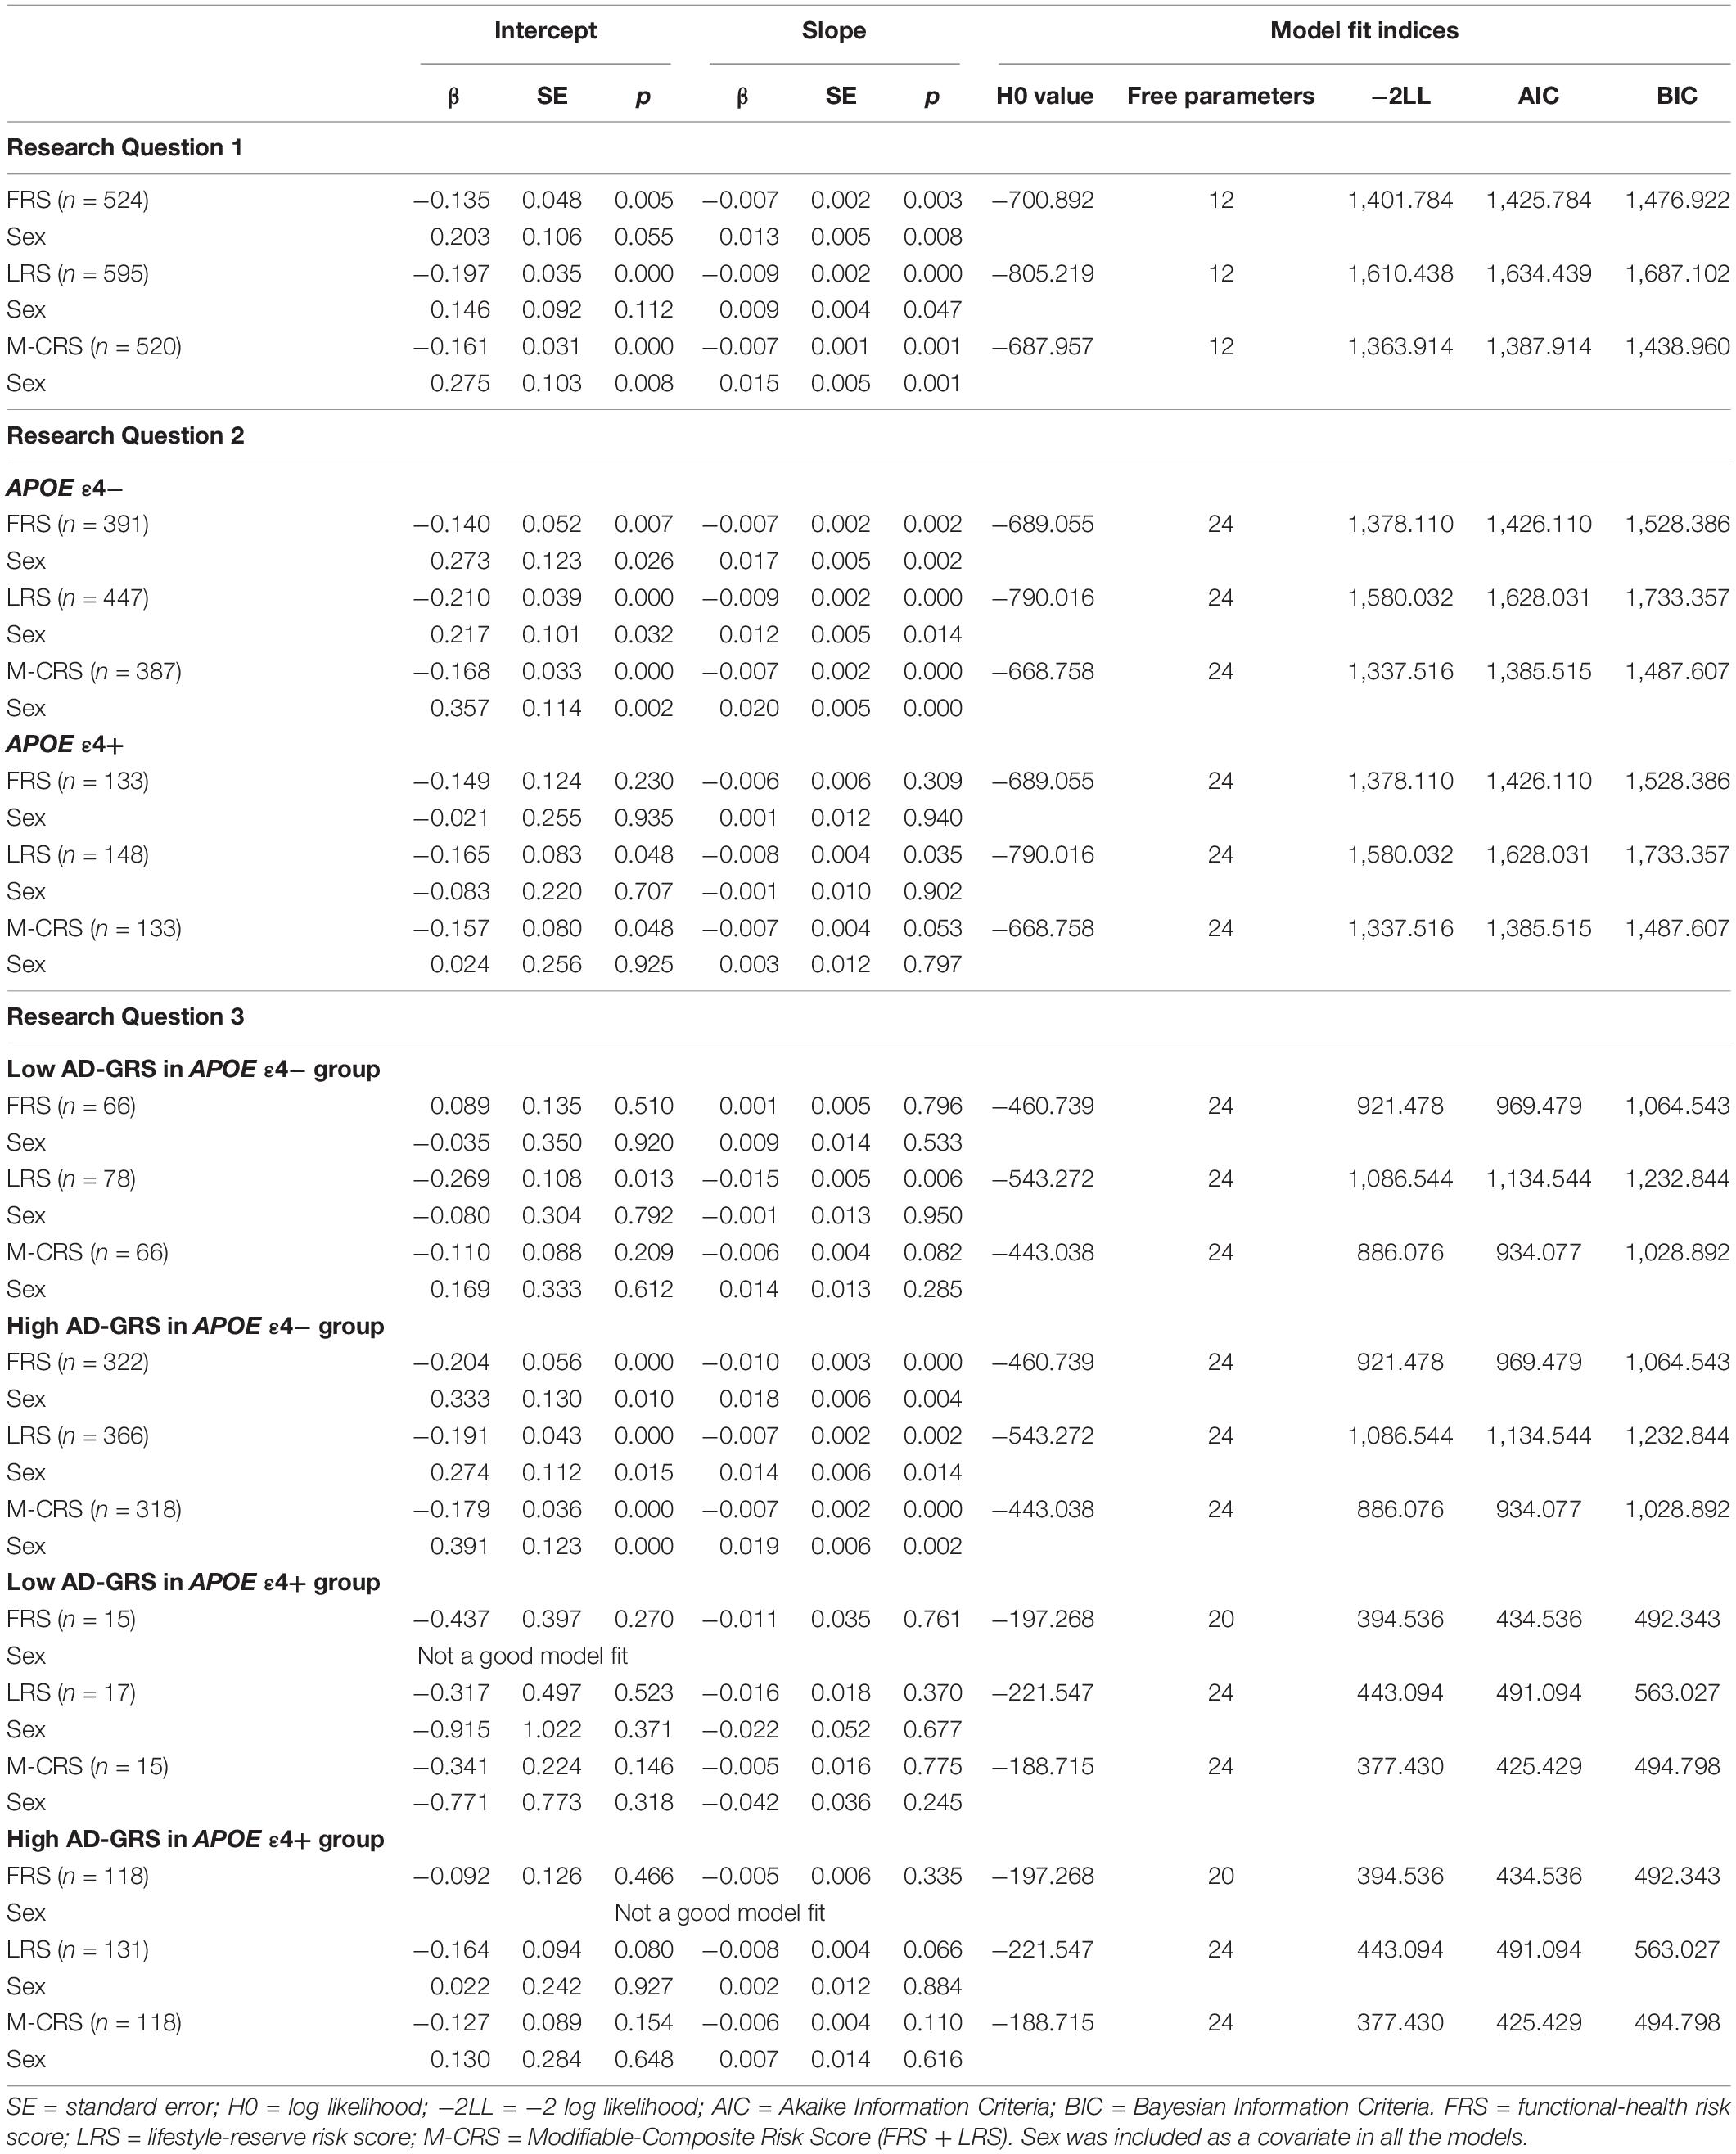
Table 4. Unstandardized regression coefficients and model fit indices by research question for all models.
Research Question 2
The APOE moderation results are presented separately for each modifiable risk score. First, we observed that higher functional-health risk scores predicted poorer EF performance and steeper decline (level: β = −0.140, SE = 0.052, p = 0.007; slope: β = −0.007, SE = 0.002, p = 0.002) selectively for the APOE ε4− group (Table 4). Second, APOE ε4+ risk did not moderate the prediction of lifestyle-reserve risk scores (stronger predictor) on EF performance and change. Third, higher M-CRS predicted steeper EF decline (slope: β = −0.007, SE = 0.033, p < 0.001) selectively for the APOE ε4− group. Sex was a significant covariate in the analyses for both significant moderations in the APOE ε4− group; specifically, men had lower EF performance and steeper decline than women (see Table 4).
Research Question 3
Given the previous results (RQ2), we focus the AD-GRS analyses on the APOE ε4− group. First, higher functional-health risk scores predicted poorer EF performance and steeper decline (level: β = −0.204, SE = 0.056, p < 0.001; slope: β = −0.010, SE = 0.003, p < 0.001) selectively in the high AD-GRS group (Figure 2). Second, AD-GRS did not moderate the prediction of lifestyle-reserve risk scores on EF performance and change. Third, higher M-CRS predicted poorer EF performance and steeper decline (level: β = −0.179, SE = 0.036, p < 0.001; slope: β = −0.007, SE = 0.002, p < 0.001) selectively in the high AD-GRS group. Sex was a significant covariate in the analyses for both moderations in APOE ε4− group for adults with high AD-GRS (see Table 4), where men had lower EF performance and steeper decline. AD-GRS did not moderate the prediction of modifiable risk scores on EF performance and change (Table 4) in the APOE ε4+ group.
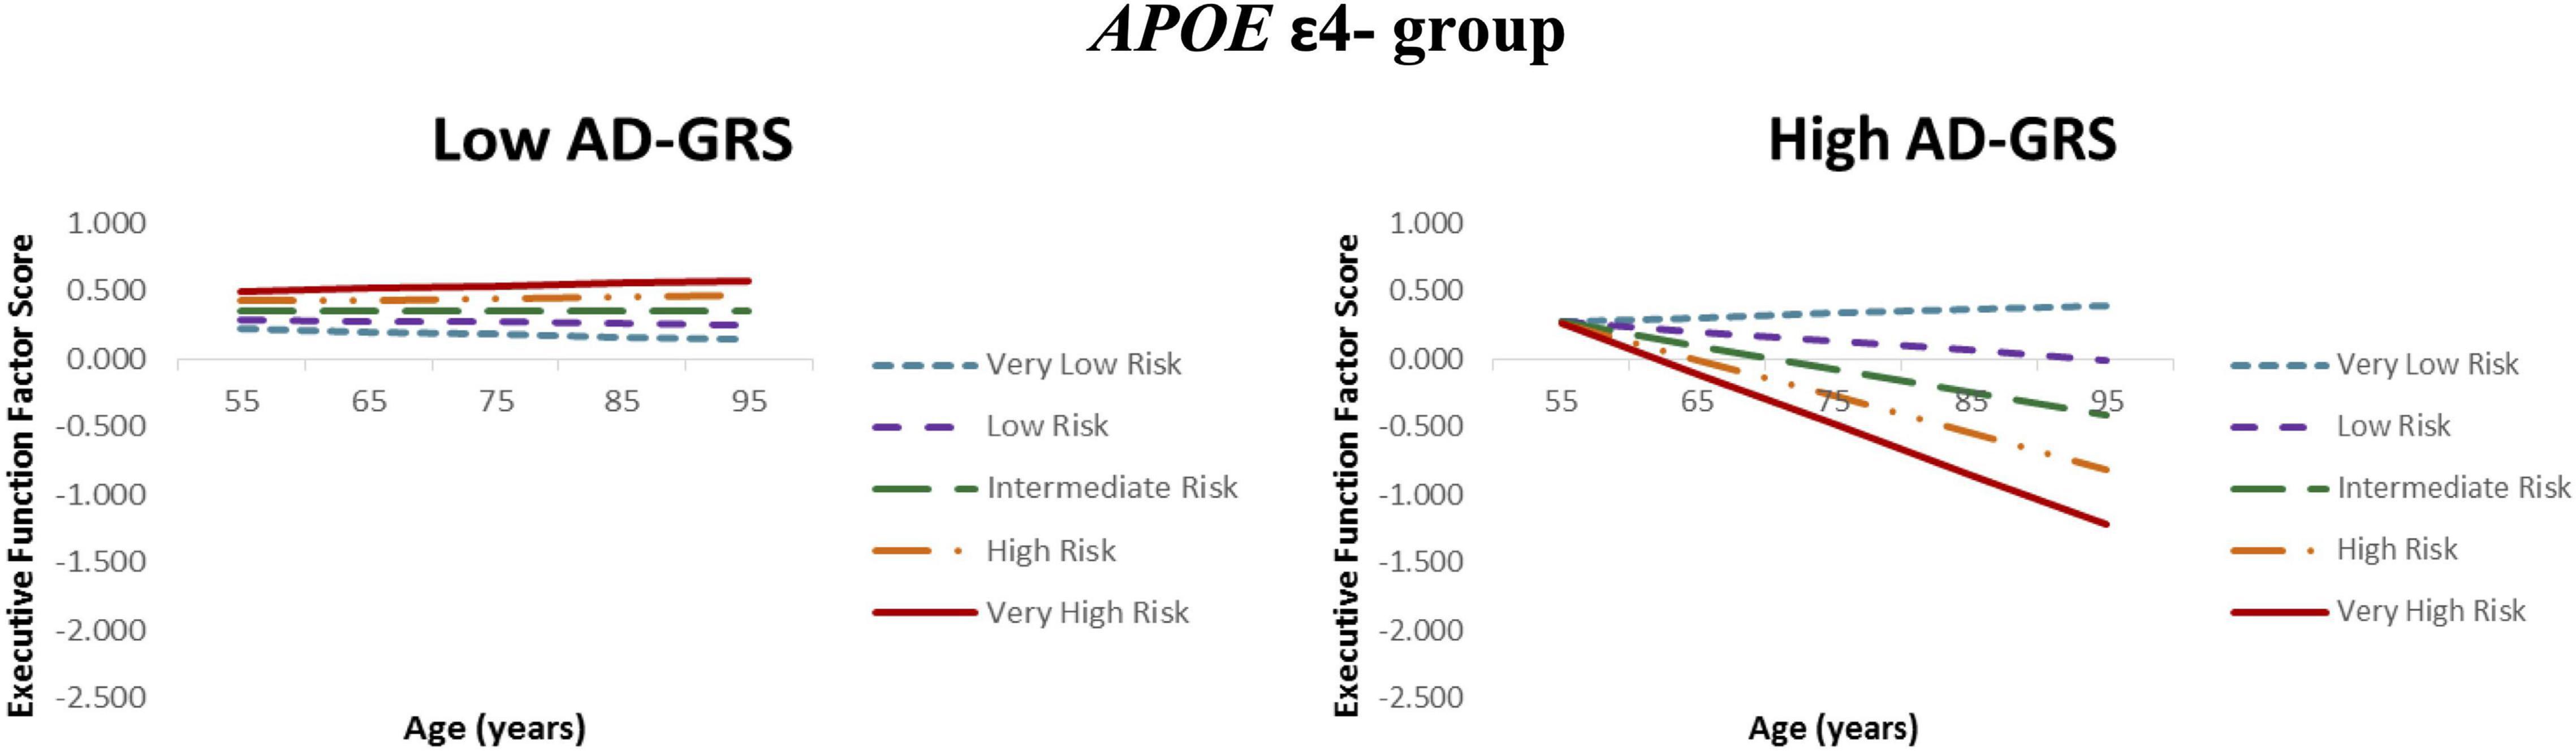
Figure 2. Executive function trajectories for functional-health risk score as moderated by AD genetic risk. APOE ε4 non-carriers with increasing functional-health risk scores had poorer EF performance and steeper 40-year trajectories selectively in the high AD-GRS group. Functional-health risk score is coded from very low risk (dashed blue line) to very high risk (solid red line).
Discussion
We examined a series of interactive associations using modifiable and genetic risk scores to predict EF trajectories in a longitudinal study of non-demented older adults. Our goals were to (1) test and compare two sets of modifiable risk scores (and their combination) to determine relative predictive power for EF trajectories, (2) identify whether the key AD genetic risk factor (APOE) moderates the expected associations between the modifiable risk scores and EF change, and (3) determine whether an AD-GRS influences the moderation between APOE and modifiable risk scores in predicting EF. Overall, the results were consistent with the expectation that in non-demented aging, differential cognitive trajectories were predicted and moderated by a network of AD-related risk factors that include two forms of both modifiable indicators (functional-health and lifestyle-reserve) and AD genetic risk markers [penetrant (APOE) and multi-genetic (AD-GRS)]. Such interactive and network approaches to biomarker predictions of asymptomatic brain and cognitive aging have appeared in several recent reports (Sapkota et al., 2017; Sapkota and Dixon, 2018; Licher et al., 2019; Lourida et al., 2019). The present study extends these reports in that it incorporates, sequentially, functional-health, lifestyle-reserve, and non-modifiable genetic modalities of AD risk.
Past studies have mainly focused on combining a wide range of modifiable risk indicators and genetic risk factors to create an overall risk score (Stephen et al., 2017; Licher et al., 2018) or examined PGRS using a large number of genetic risk variants (Andrews et al., 2019; Bakulski et al., 2020). Specific novelties of the present study include: (1) a broad representation of the functional-health risk domain, with contributions from three markers often used independently in candidate biomarker studies (i.e., PP, grip strength, BMI) (Walters et al., 2016), (2) an overall representation of the lifestyle-reserve domain, with contributions from five markers often examined in dementia and cognitive resilience studies (i.e., physical activity, social activity, novel activity, integrative activity, education), (3) examining the commonly studied genetic risk (APOE) in addition to a genetic risk score (AD-GRS) (Stephen et al., 2017), and (4) testing interactive associations between three modifiable risk scores with two genetic score moderations on EF trajectories.
Although the central finding of this study is that a network of interactions among modifiable and non-modifiable risk biomarkers operate to moderate asymptomatic cognitive trajectories, we now briefly unpack each of the components in the sequence of analyses. For RQ1, higher modifiable risk scores for the two domains (functional-health and lifestyle-reserve) and their combination (M-CRS) predicted poorer EF performance and steeper decline. Consistent with previous studies, we observed that risk indicators in all three risk scores significantly contributed toward poorer cognitive performance and accelerated decline (Hughes et al., 2009; Gunstad et al., 2010; Marioni et al., 2012, 2014; McFall et al., 2014; McDade et al., 2016; Albanese et al., 2017; Viscogliosi et al., 2017; Kivipelto et al., 2018; Kobayashi-Cuya et al., 2018; Bohannon, 2019; Bowman et al., 2019; Clouston et al., 2019; Kim et al., 2019). Although we expected to observe that the M-CRS would have the highest predictive power, we observed that the lifestyle-reserve risk score had the highest predictive power (level: β = −0.197; slope: −0.009) for EF performance and decline. Although the M-CRS provides an overall risk score, our results suggest that such risk scores should be constructed and validated with close attention to the fit and incremental value of each indicator. Including risk indicators in an overall risk score does not necessarily optimize the predictive performance of the composite measure. A precision approach to the building of composite risk scores is recommended, just as it is tested at the level of multi-modal networks. Our novel lifestyle-reserve risk domain with five indicators (physical activities, social activities, cognitive-integrative activities, cognitive-novel activities, education) selectively showed higher predictive power for EF trajectories (1) than the combined multi-component risk score and (2) regardless of the AD genetic risk contribution in non-demented older adults. We note three aspects of novelty in this finding. First, we are not aware of other studies using a combination of similar risk indicators to build a lifestyle-reserve risk score and subsequently predict EF trajectories in non-demented aging. Second, this is the first study to provide a comparison of the predictive power between lifestyle-reserve risk score and a combined-modifiable risk score composite with the lifestyle-reserve risk score showing higher predictive power for EF performance and decline. Third, our findings imply that elevated lifestyle-reserve risk scores are associated with EF decline in non-demented older adults regardless of AD genetic risk contribution. Future research in this area may benefit from compiling multiple relevant risk indicators to build domain-related risk scores and systematically testing each risk domain independently and in interaction with other domains of risk (including genetic risk) to predict differential cognitive trajectories in older adults.
For RQ2, APOE ε4+ risk moderated the association between modifiable risk scores and EF trajectories, whereby adults in the APOE ε4− group had poorer EF performance and steeper decline with higher M-CRS. A previous VLS study reported a similar pattern, whereby APOE moderation for lifestyle activities (integrative and novel information processing activities) was associated with cognitive decline only in APOE ε4 non-carriers (Runge et al., 2014). A recent report (Licher et al., 2019) using older adults from the Rotterdam Study, showed that low modifiable risk may only be associated with lower dementia risk in those with low and intermediate genetic risk. These protective associations were not observed in APOE ε4+ risk carriers. APOE risk carriers may already be at a disadvantage for poorer EF performance and steeper decline (i.e., a floor effect). Therefore, modifiable risk scores may not a play a significant role in cognitive change for APOE ε4+ carriers who are declining regardless of health and lifestyle factors. In addition, adults with less genetic risk such as APOE ε2 homozygotes may be more inclined to participate in higher lifestyle activities leading to added protection from key modifiable risk markers (Ngandu et al., 2015; Peters et al., 2019). Previous studies have also shown that APOE ε2+ carriers have slower EF decline (Reas et al., 2019), better EF and episodic memory performance (Sinclair et al., 2017), and less memory decline in the presence of poor vascular health (represented with PP) selectively for women APOE ε2+ carriers (McFall et al., 2019a). Regarding potential underlying mechanisms, APOE ε2+ carriers may show protective effects by using compensatory mechanisms; specifically, recent study showed that amnestic mild cognitive impairment adults had increased functional connectivity in the entorhinal cortex network for APOE ε2+ carriers (Chen J. et al., 2016). In the present study, APOE did not moderate the association between lifestyle-reserve risk scores and EF suggesting that older adults with high lifestyle risk scores may be at higher risk for EF decline regardless of their genetic risk status. In addition to APOE ε4+ risk stratification, future studies should also consider examining APOE protection as stratified by ε2− versus ε2+.
As expected, we observed that the M-CRS had a higher risk coefficient (β = −0.160) for EF performance than the functional health risk score (β = −0.148) in the APOE ε4− group. Higher risk prediction with the M-CRS suggests that functional-health risk factors alone may not be enough to observe a precise and accurate genetic moderation. Future studies should consider that a limited number of modifiable risk indicators (only functional-health or only lifestyle-reserve) may not provide a complete picture of the dynamic risk processes involved in cognitive changes as moderated by key neurocognitive genotypes. A multimodal network approach accounting for both modifiable and genetic risk may be required to detect accurate changes in cognitive trajectories and this may also vary by cognitive domain.
For RQ3, as expected, AD-GRS further moderated the association between modifiable risk scores and EF trajectories in the APOE ε4− group. Specifically, adults in the high AD-GRS group had poorer EF performance with increasing M-CRS. This suggests that only those with high AD-GRS combination were particularly vulnerable in our risk score network (see Figure 2) and emphasizes the importance of accounting for key AD genetic risk factors in addition to APOE. The M-CRS as moderated by AD genetic risk had higher predictive coefficient (β = −0.179) for EF performance than M-CRS alone (β = −0.168). Our multifactorial network showed that modifiable risk scores are moderated by an AD genetic risk (APOE and AD-GRS) on EF predictions. As part of post-hoc analyses, we observed that APOE ε2+ carriers (versus APOE ε2-) were potentially protected from the deleterious effects of increasing modifiable risk in this group. However, we do note that we had unequal sample sizes in the two groups (n = 62 in the ε2+ group and n = 309 in the ε2− group). The present approach advances previously studied risk scores in several ways. First, we distinguish between three modifiable risk scores and two genetic risk scores to examine a network of risk scores versus previous work focusing on an overall risk score (Anstey et al., 2014) or testing interactions between lifestyle risk and cognitive aging genetic risk score (Sapkota et al., 2017). Second, we test three modifiable risk scores to determine the risk score with the most predictive power. Previous studies have not differentiated between different modifiable risk domains to test domain-specific modifiable risk scores versus an overall risk score (Deckers et al., 2018). Third, we test genetic moderation for all three modifiable risk scores with APOE risk stratification followed by a previously published AD-GRS (Sapkota and Dixon, 2018) to predict EF trajectories in non-demented older adults. Future studies may benefit from applying similar multimodal network approach using modifiable and non-modifiable risk scores to predict cognitive trajectories in older adult populations.
Sex differences in cognitive aging risk profiles have been consistently observed (McDermott et al., 2016; Gurvich et al., 2018; McFall et al., 2019b) and commonly used as a risk indicator in risk scores (Anstey et al., 2014). Although we covaried for sex in all our models, we did not examine for sex differences in the present study due to our sample size limitations. As a significant covariate in our significant models (see Table 4), we observed that men showed steeper EF performance and/or decline than women. Our findings are consistent with recent VLS work where higher BMI was associated with less decline for women (Bohn et al., 2020), and higher number of memory resilience predictors were observed in women (McDermott et al., 2016). Future studies focusing on cognitive aging and dementia modifiable risk scores should consider interactive effects of complex genetic risk scores as stratified by sex to detect distinct differences in asymptomatic aging profiles.
We now mention several strengths and limitations of the present study. A first strength is a relatively large sample of older adults (n = 602) examined at three waves across a 40-year band of aging (age range = 53–95 years old). Our sample size allowed us to detect genetic moderations of modifiable risk scores on EF trajectories. Future studies with larger sample sizes may benefit by expanding our network approach to include additional AD genetic risk factors and modifiable risk domains to test a larger intricate network of risk scores on cognitive trajectories in both older adults and dementia populations. Second, our EF latent variable included four standard cognitive tests. We represent a broad construct domain that reduces measurement error associated with single EF tests. Third, we applied a longitudinal design with age as the metric of change. This approach incorporates chronological age directly into our analyses (Sapkota et al., 2017) and accounts for age-associated variability which is better than using age as a covariate in our statistical model. Fourth, our latent growth modeling approach in Mplus also accounts for missing data by using maximum likelihood estimation to generate factor scores for the dependent variable. Fifth, we extended previous cross-sectional and longitudinal studies (Sapkota et al., 2015, 2017; Sapkota and Dixon, 2018) testing synergistic associations of genetic risk factors alone to include the association of modifiable risk score on EF as moderated by AD genetic risk.
For limitations, first, our M-CRS included risk scores from only two domains (functional-health domain and lifestyle-reserve). Future work should consider including other risk indicators from various domains such as diabetes, stroke, depression, and smoking (Rochoy et al., 2019) among other identified key AD risk factors (Livingston et al., 2017). In addition, studies extending our multimodal network approach should consider an even broader range of AD-related risk factors, including clinical biomarkers (molecular, imaging) of AD diagnosis and progression, as well as related disorders. AD-specific molecular biomarkers are not routinely collected in asymptomatic aging studies and were not available in the current database. Second, we focused on EF trajectories, and future studies should consider including other cognitive domains (i.e., episodic memory) to examine genetic risk moderation between modifiable risk scores and cognitive trajectories. We also note that some of the risk factors in our network may apply to other disease conditions (i.e., diabetes) and may be used to predict cognitive trajectories in diabetes or other neurodegenerative conditions. Third, as we were continuing with the same group of participants from previous study with established AD-GRS (Sapkota and Dixon, 2018), the longitudinal design did not include a third wave for all participants. However, our results were not compromised because we used all data points available for each participant and confirmed that the latent EF variable was measurement invariant [partial scalar invariance level; (Kline, 2010)]. Fourth, although we co-varied for sex in our analyses, future work with larger sample sizes should consider stratifying by sex and then testing for differences in the extent to which complex multifactorial networks predict differential cognitive trajectories in older adults (Tierney et al., 2017). Fifth, we believe that low power did not play a role in our structural equation models with n > 100 (Little, 2013) in both APOE ε4− and ε4+ groups for two main reasons. We observed that for increasing lifestyle-reserve risk scores, both ε4− and ε4+ groups showed significant decline suggesting that power may not be an issue in the lower sample size group. In our previous genetic risk score study using the same sample (Sapkota and Dixon, 2018), we showed that high cognitive aging genetic risk score significantly predicted poorer EF performance and steeper decline in the APOE ε4+ group (lower sample size group). However, we note that future studies should consider using a larger sample size for similar models, a larger range of modifiable risk indicators to build a risk score, and different AD genetic polymorphisms that have been associated with APOE genotype (i.e., TOMM40; Lyall et al., 2014). Sixth, we observed HW deviations for two of our SNPs (CR1 and PICALM) contributing to the overall AD-GRS. We observed reasonable and predictable results with the AD-GRS, which has previously been examined with EF trajectories (Sapkota and Dixon, 2018). Future studies should consider using a larger sample size with a range of neurodegenerative patients to test whether our non-demented sample played an important role in the HW deviations observed for CR1 and PICALM. Seventh, we note that our participants were predominantly White, not of Hispanic origin, and that genotype allelic frequencies may vary in different population groups. Future studies should consider using adults diagnosed with neurodegenerative disorders and participants from other racial backgrounds to establish generalizability. Eighth, all VLS participants are initially screened for clinically diagnosed neurodegenerative conditions prior to enrollment and at each wave of testing. In addition to this screening, we applied additional exclusionary criteria (anti-psychotic medication, Mini-Mental State Exam scores less than 24, uncontrolled hypertension, insulin-controlled diabetes, history of serious head injury, APOE ε2/ε4 genotype) to ensure that all participants were normally aging throughout the longitudinal data collection. However, with no subsequent assessments (after the conclusion of this study), we cannot confirm that some participants would not transition later into preclinical phases. One participant in our sample was reported to have a dementia diagnosis at death and their EF data was not included at wave 3. Future work should consider deploying subsequent assessments and retroactively examining potential differential patterns for those who continued as asymptomatic and those who later developed cognitive impairment or dementia.
In conclusion, a multimodal network of risk factors predicted EF trajectories in non-demented older adults. To our knowledge, this is the first study to detect a genetic moderation (using APOE and AD-GRS) with modifiable risk scores (risk indicators: BMI, PP, grip strength, daily lifestyle activities, and education) on EF performance and change. Our key novel findings include: (1) lifestyle-reserve risk score alone had the highest predictive power for EF decline, (2) APOE moderated the association between M-CRS and EF performance and decline where only adults in the APOE ε4− group were significantly influenced by higher modifiable risk scores, (3) further AD-GRS genetic stratification in APOE ε4− provided a more precise illustration of older adults with the highest risk profile for EF decline. Examining multimodal associations using a network approach (including additive risk scores, moderation, and effect modification) may add an extra layer of precision to single risk score studies to detect older adults with high cognitive decline risk profiles, and also provide important insight for future intervention trials aimed at modifiable risk factors and neurocognitive aging.
Data Availability Statement
The datasets presented in this study can be found in online repositories. The names of the repository/repositories and accession number(s) can be found below: https://sites.ualberta. ca/∼vlslab/index.html. We will make the data available to qualified researchers on a project website.
Ethics Statement
The studies involving human participants were reviewed and approved by the Human Research Ethics Guidelines, University of Alberta. The patients/participants provided their written informed consent to participate in this study.
Author Contributions
SS and RD designed the study and planned the analytic approach. SS performed the statistical analyses and wrote the first draft. All authors contributed to writing, editing, and interpretation.
Funding
This present research was supported by grants from (1) the National Institutes of Health (National Institute on Aging; R01 AG008235) to RD, (2) the Canadian Consortium on Neurodegeneration in Aging (CCNA) with funding from Alberta Innovates and the Canadian Institutes of Health Research to RD, and (3) Canadian Institutes of Health Research operating grant (MOP13129) to MM. MM receives salary support from the Department of Medicine at Sunnybrook Health Sciences Centre and the University of Toronto, as well as the Sunnybrook Research Institute. SS was supported with postdoctoral fellowship from the Alzheimer Society of Canada/CCNA. The funding sources did not have a role in the study design, data collection, statistical analysis, results interpretation, report writing, or submission decisions.
Conflict of Interest
The authors declare that the research was conducted in the absence of any commercial or financial relationships that could be construed as a potential conflict of interest.
Publisher’s Note
All claims expressed in this article are solely those of the authors and do not necessarily represent those of their affiliated organizations, or those of the publisher, the editors and the reviewers. Any product that may be evaluated in this article, or claim that may be made by its manufacturer, is not guaranteed or endorsed by the publisher.
Acknowledgments
We thank the volunteer participants and the VLS staff for their many contributions. More information about the VLS may be found at: http://www.ualberta.ca/∼vlslab/.
Supplementary Material
The Supplementary Material for this article can be found online at: https://www.frontiersin.org/articles/10.3389/fnagi.2021.621023/full#supplementary-material
References
Albanese, E., Launer, L. J., Egger, M., Prince, M. J., Giannakopoulos, P., Wolters, F. J., et al. (2017). Body mass index in midlife and dementia: systematic review and meta-regression analysis of 589,649 men and women followed in longitudinal studies. Alzheimer’s Dement. Diagnosis, Assess. Dis. Monit. 8, 165–178. doi: 10.1016/j.dadm.2017.05.007
Albrecht, M. A., Szoeke, C., Maruff, P., Savage, G., Lautenschlager, N. T., Ellis, K. A., et al. (2015). Longitudinal cognitive decline in the AIBL cohort: the role of APOE ε4 status. Neuropsychologia 75, 411–419. doi: 10.1016/J.NEUROPSYCHOLOGIA.2015.06.008
Andrews, S. J., Das, D., Cherbuin, N., Anstey, K. J., and Easteal, S. (2016). Association of genetic risk factors with cognitive decline: the PATH through life project. Neurobiol. Aging 41, 150–158. doi: 10.1016/j.neurobiolaging.2016.02.016
Andrews, S. J., McFall, G. P., Dixon, R. A., Cherbuin, N., Eramudugolla, R., and Anstey, K. J. (2019). Alzheimer’s environmental and genetic risk scores are differentially associated with general cognitive ability and dementia severity. Alzheimer Dis. Assoc. Disord. 33, 95–103. doi: 10.1097/WAD.0000000000000292
Anstey, K. J., Cherbuin, N., and Herath, P. M. (2013). Development of a new method for assessing global risk of alzheimer’s disease for use in population health approaches to prevention. Prev. Sci. 14, 411–421. doi: 10.1007/s11121-012-0313-2
Anstey, K. J., Cherbuin, N., Herath, P. M., Qiu, C., Kuller, L. H., Lopez, O. L., et al. (2014). A self-report risk index to predict occurrence of dementia in three independent cohorts of older adults: the ANU-ADRI. PLoS One 9:e86141. doi: 10.1371/journal.pone.0086141
Anstey, K. J., Eramudugolla, R., Hosking, D. E., Lautenschlager, N. T., and Dixon, R. A. (2015). Bridging the translation gap: from dementia risk assessment to advice on risk reduction. J. Prev. Alzheimer’s Dis. 2, 189–198. doi: 10.14283/jpad.2015.75
Bäckman, L., Jones, S., Berger, A.-K., Laukka, E. J., and Small, B. J. (2005). Cognitive impairment in preclinical Alzheimer’s disease: a meta-analysis. Neuropsychology 19, 520–531. doi: 10.1037/0894-4105.19.4.520
Badhwar, A., McFall, G. P., Sapkota, S., Black, S. E., Chertkow, H., Duchesne, S., et al. (2020). A multiomics approach to heterogeneity in Alzheimer’s disease: focused review and roadmap. Brain 143, 1315–1331. doi: 10.1093/brain/awz384
Baker, S. G. (2019). Maximum likelihood estimation with missing outcomes: from simplicity to complexity. Stat. Med. 38, 4453–4474. doi: 10.1002/SIM.8319
Bakulski, K. M., Vadari, H. S., Faul, J. D., Heeringa, S. G., Kardia, S. L., Langa, K. M., et al. (2020). A non-APOE Polygenic Score for Alzheimer’s Disease and APOE-ε4 Have Independent Associations with Dementia in the Health and Retirement Study. Cold Spring Harbor, NY: Cold Spring Harbor Laboratory Press.
Bherer, L., Erickson, K. I., and Liu-Ambrose, T. (2013). A review of the effects of physical activity and exercise on cognitive and brain functions in older adults. J. Aging Res. 2013:657508. doi: 10.1155/2013/657508
Bielak, A. A. M., Mansueti, L., Strauss, E., and Dixon, R. A. (2006). Performance on the Hayling and Brixton tests in older adults: norms and correlates. Arch. Clin. Neuropsychol. 21, 141–149. doi: 10.1016/j.acn.2005.08.006
Bohannon, R. W. (2019). Grip strength: an indispensable biomarker for older adults. Clin. Interv. Aging 14, 1681–1691. doi: 10.2147/CIA.S194543
Bohn, L., McFall, G. P., Wiebe, S. A., and Dixon, R. A. (2020). Body mass index predicts cognitive aging trajectories selectively for females: evidence from the victoria longitudinal study. Neuropsychology 34, 388–403. doi: 10.1037/neu0000617
Bowman, K., Thambisetty, M., and Kuchel, G. A. (2019). Obesity and longer term risks of Dementia in 65–74 year olds. Age Ageing 48, 367–373. doi: 10.1093/ageing/afz002
Burgess, P. W., and Shallice, T. (1997). The Hayling and Brixton Tests. Thurston: Thames Valley Test Company.
Chen, B., Cole, J. W., and Grond-Ginsbach, C. (2017). Departure from hardy weinberg equilibrium and genotyping error. Front. Genet. 8:167. doi: 10.3389/fgene.2017.00167
Chen, J., Shu, H., Wang, Z., Liu, D., Shi, Y., Xu, L., et al. (2016). Protective effect of APOE epsilon 2 on intrinsic functional connectivity of the entorhinal cortex is associated with better episodic memory in elderly individuals with risk factors for Alzheimer’s disease. Oncotarget 7, 58789–58801. doi: 10.18632/oncotarget.11289
Chen, W.W., Zhang, X., and Huang, W.-J. (2016). Role of physical exercise in Alzheimer’s disease. Biomed. Rep. 4, 403–407. doi: 10.3892/br.2016.607
Clouston, S. A. P., Smith, D. M., Mukherjee, S., Zhang, Y., Hou, W., Link, B. G., et al. (2019). Education and cognitive decline: an integrative analysis of global longitudinal studies of cognitive aging. J. Gerontol. Ser. B. 75, e151–e160. doi: 10.1093/geronb/gbz053
D’Agostino, R. B., Grundy, S., Sullivan, L. M., and Wilson, P. (2001). Validation of the Framingham coronary heart disease prediction scores: results of a multiple ethnic groups investigation. J. Am. Med. Assoc. 286, 180–187. doi: 10.1001/jama.286.2.180
Darst, B. F., Koscik, R. L., Racine, A. M., Oh, J. M., Krause, R. A., Carlsson, C. M., et al. (2017). Pathway-Specific polygenic risk scores as predictors of Amyloid-β deposition and cognitive function in a sample at increased risk for Alzheimer’s disease. J. Alzheimer’s Dis. 55, 473–484. doi: 10.3233/JAD-160195
de Frias, C. M., Dixon, R. A., and Strauss, E. (2006). Structure of four executive functioning tests in healthy older adults. Neuropsychology 20, 206–214. doi: 10.1037/0894-4105.20.2.206
de Frias, C. M., Dixon, R. A., and Strauss, E. (2009). Characterizing executive functioning in older special populations: from cognitively elite to cognitively impaired. Neuropsychology 23, 778–791. doi: 10.1037/a0016743
Deckers, K., Barbera, M., Köhler, S., Ngandu, T., van Boxtel, M., Rusanen, M., et al. (2020). Long-term dementia risk prediction by the LIBRA score: a 30-year follow-up of the CAIDE study. Int. J. Geriatr. Psychiatry 35, 195–203. doi: 10.1002/gps.5235
Deckers, K., Köhler, S., van Boxtel, M., Verhey, F., Brayne, C., and Fleming, J. (2017). Lack of associations between modifiable risk factors and dementia in the very old: findings from the Cambridge City over-75s cohort study. Aging Ment. Health 22, 1272–1278.
Deckers, K., Köhler, S., van Boxtel, M., Verhey, F., Brayne, C., and Fleming, J. (2018). Lack of associations between modifiable risk factors and dementia in the very old: findings from the Cambridge City over-75s cohort study. Aging Ment. Heal. 22, 1272–1278.
D’elia, L., Satz, P., Uchiyama, C., Uchiyama, C., and White, T. (1996). Color Trails Test Professional Manual. Florida: Psychological Assessment Resources.
Dixon, R. A., and Lachman, M. E. (2019). “Risk and protective factors in cognitive aging: Advances in assessment, prevention, and promotion of alternative pathways,” in The Aging Brain: Functional Adaptation Across Adulthood, ed. G. R. Samanez-Larkin (Washington DC: American Psychological Association), 217–263. doi: 10.1037/0000143-009
Dixon, R. A., Small, B., MacDonald, S., and McArdle, J. (2012). Yes, Memory Declines with Aging—but When, How, and Why?. Available online at: https://psycnet.apa.org/record/2011-30148-013 (accessed May 10, 2020).
Ecay-Torres, M., Estanga, A., Tainta, M., Izagirre, A., Garcia-Sebastian, M., Villanua, J., et al. (2018). Increased CAIDE dementia risk, cognition, CSF biomarkers, and vascular burden in healthy adults. Neurology 91, e217–e226. doi: 10.1212/WNL.0000000000005824
Edwards, G. A., Gamez, N., Escobedo, G., Calderon, O., and Moreno-Gonzalez, I. (2019). Modifiable risk factors for Alzheimer’s disease. Front. Aging Neurosci. 11:146. doi: 10.3389/fnagi.2019.00146
Emmerzaal, T. L., Kiliaan, A. J., and Gustafson, D. R. (2015). 2003-2013: a decade of body mass index, Alzheimer’s disease, and dementia. J. Alzheimers. Dis. 43, 739–755. doi: 10.3233/JAD-141086
Enache, D., Solomon, A., Cavallin, L., Kåreholt, I., Kramberger, M. G., Aarsland, D., et al. (2016). CAIDE Dementia Risk Score and biomarkers of neurodegeneration in memory clinic patients without dementia. Neurobiol. Aging 42, 124–131. doi: 10.1016/j.neurobiolaging.2016.03.007
Enders, C. K. (2011). Analyzing longitudinal data with missing values. Rehabil. Psychol. 56, 267–288. doi: 10.1037/a0025579
Enders, C. K. (2013). Dealing with missing data in developmental research. Child Dev. Perspect. 7, 27–31. doi: 10.1111/cdep.12008
Enders, C. K., and Bandalos, D. L. (2001). The relative performance of full information maximum likelihood estimation for missing data in structural equation models. Struct. Equ. Model. 8, 430–457. doi: 10.1207/S15328007SEM0803_5
Friedman, N. P., and Miyake, A. (2017). Unity and diversity of executive functions: individual differences as a window on cognitive structure. Cortex. 86:186. doi: 10.1016/J.CORTEX.2016.04.023
Galbraith, S., Bowden, J., and Mander, A. (2014). Accelerated longitudinal designs: an overview of modelling, power, costs and handling missing data. Stat. Methods Med. Res. 26, 374–398. doi: 10.1177/0962280214547150
Gilsanz, P., Quesenberry, C. P., Mayeda, E. R., Glymour, M. M., Farias, S. T., and Whitmer, R. A. (2019). Stressors in midlife and risk of dementia: the role of race and education. Alzheimer Dis. Assoc. Disord. 33, 200–205. doi: 10.1097/WAD.0000000000000313
Grober, E., Hall, C. B., Lipton, R. B., Zonderman, A. B., Resnick, S. M., and Kawas, C. (2008). Memory impairment, executive dysfunction, and intellectual decline in preclinical Alzheimer’s disease. J. Int. Neuropsychol. Soc. 14, 266–278. doi: 10.1017/S1355617708080302
Gunning-Dixon, F. M., and Raz, N. (2003). Neuroanatomical correlates of selected executive functions in middle-aged and older adults: a prospective MRI study. Neuropsychologia 41, 1929–1941. doi: 10.1016/S0028-3932(03)00129-5
Gunstad, J., Lhotsky, A., Wendell, C. R., Ferrucci, L., and Zonderman, A. B. (2010). Longitudinal examination of obesity and cognitive function: results from the baltimore longitudinal study of aging. Neuroepidemiology 34, 222–229. doi: 10.1159/000297742
Gurvich, C., Hoy, K., Thomas, N., and Kulkarni, J. (2018). Sex differences and the influence of sex hormones on cognition through adulthood and the aging process. Brain Sci. 8:163. doi: 10.3390/brainsci8090163
Hall, L. M. L., Jung, R. T., and Leese, G. P. (2003). Controlled trial of effect of documented cardiovascular risk scores on prescribing. Br. Med. J. 326, 251–252. doi: 10.1136/bmj.326.7383.251
Hamer, M., and Chida, Y. (2008). Physical activity and risk of neurodegenerative disease: a systematic review of prospective evidence. Psychol. Med. 39, 3–11. doi: 10.1017/S0033291708003681
Harold, D., Abraham, R., Hollingworth, P., Sims, R., Gerrish, A., Hamshere, M. L., et al. (2009). Genome-wide association study identifies variants at CLU and PICALM associated with Alzheimer’s disease. Nat. Genet. 41, 1088–1093. doi: 10.1038/ng.440
Hooshmand, B., Polvikoski, T., Kivipelto, M., Tanskanen, M., Myllykangas, L., Mäkelä, M., et al. (2018). CAIDE Dementia Risk Score, Alzheimer and cerebrovascular pathology: a population-based autopsy study. J. Intern. Med. 283, 597–603. doi: 10.1111/joim.12736
Hughes, T. F., Borenstein, A. R., Schofield, E., Wu, Y., and Larson, E. B. (2009). Association between late-life body mass index and dementia The Kame Project. Neurology 72, 1741–1746. doi: 10.1212/WNL.0b013e3181a60a58
Karch, C. M., Cruchaga, C., and Goate, A. M. (2014). Alzheimer’s disease genetics: from the bench to the clinic. Neuron 83, 11–26. doi: 10.1016/j.neuron.2014.05.041
Karch, C. M., and Goate, A. M. (2015). Alzheimer’s disease risk genes and mechanisms of disease pathogenesis. Biol. Psychiatry 77, 43–51. doi: 10.1016/j.biopsych.2014.05.006
Kharabian Masouleh, S., Arélin, K., Horstmann, A., Lampe, L., Kipping, J. A., Luck, T., et al. (2016). Higher body mass index in older adults is associated with lower gray matter volume: implications for memory performance. Neurobiol. Aging 40, 1–10. doi: 10.1016/j.neurobiolaging.2015.12.020
Kim, K. H., Park, S. K., Lee, D. R., and Lee, J. (2019). The relationship between handgrip strength and cognitive function in elderly Koreans over 8 years: a prospective population-based study using Korean longitudinal study of ageing. Korean J. Fam. Med. 40, 9–15. doi: 10.4082/kjfm.17.0074
Kivipelto, M., Mangialasche, F., and Ngandu, T. (2018). Lifestyle interventions to prevent cognitive impairment, dementia and Alzheimer disease. Nat. Rev. Neurol. 14, 653–666. doi: 10.1038/s41582-018-0070-3
Kline, R. B. (2010). Principles and Practice of Structural Equation Modeling. New York, NY: Guilford Press.
Kobayashi-Cuya, K. E., Sakurai, R., Suzuki, H., Ogawa, S., Takebayashi, T., and Fujiwara, Y. (2018). Observational evidence of the association between handgrip strength, hand dexterity, and cognitive performance in community-dwelling older adults: a systematic review. J. Epidemiol. 28, 373–381. doi: 10.2188/jea.JE20170041
Kowalski, K., and Mulak, A. (2019). Brain-gut-microbiota axis in Alzheimer’s disease. J. Neurogastroenterol. Motil. 25, 48–60. doi: 10.5056/jnm18087
Lambert, J. C., Ibrahim-Verbaas, C. A., Harold, D., Naj, A. C., Sims, R., Bellenguez, C., et al. (2013). Meta-analysis of 74,046 individuals identifies 11 new susceptibility loci for Alzheimer’s disease. Nat. Genet. 45, 1452–1458. doi: 10.1038/ng.2802
Levine, D. A., Galecki, A. T., Langa, K. M., Unverzagt, F. W., Kabeto, M. U., Giordani, B., et al. (2019). Blood pressure and cognitive decline over 8 years in middle-aged and older black and white americans Epidemiology/Population science. Hypertension 73, 310–318. doi: 10.1161/HYPERTENSIONAHA.118.12062
Licher, S., Ahmad, S., Karamujić-Čomić, H., Voortman, T., Leening, M. J. G., Ikram, M. A., et al. (2019). Genetic predisposition, modifiable-risk-factor profile and long-term dementia risk in the general population. Nat. Med. 25, 1364–1369. doi: 10.1038/s41591-019-0547-7
Licher, S., Yilmaz, P., Leening, M. J. G., Wolters, F. J., Vernooij, M. W., Stephan, B. C. M., et al. (2018). External validation of four dementia prediction models for use in the general community-dwelling population: a comparative analysis from the Rotterdam Study. Eur. J. Epidemiol. 33, 645–655. doi: 10.1007/s10654-018-0403-y
Lin, S., Yang, Y., Qi, Q., Wei, L., Jing, N., Jie, Z., et al. (2019). The beneficial effect of physical exercise on cognitive function in a non-dementia aging Chinese Population. Front. Aging Neurosci. 11:238. doi: 10.3389/fnagi.2019.00238
Liu, C.-C., Liu, C.-C., Kanekiyo, T., Xu, H., and Bu, G. (2013). Apolipoprotein E and Alzheimer disease: risk, mechanisms and therapy. Nat. Rev. Neurol. 9, 106–118. doi: 10.1038/nrneurol.2012.263
Liu, Z., Dai, X., Zhang, J., Li, X., Chen, Y., Ma, C., et al. (2018). The interactive effects of age and PICALM rs541458 polymorphism on cognitive performance, brain structure, and function in non-demented elderly. Mol. Neurobiol. 55, 1271–1283. doi: 10.1007/s12035-016-0358-5
Livingston, G., Sommerlad, A., Orgeta, V., Costafreda, S. G., Huntley, J., Ames, D., et al. (2017). Dementia prevention, intervention, and care. Lancet (London, England) 390, 2673–2734. doi: 10.1016/S0140-6736(17)31363-6
Lourida, I., Hannon, E., and Littlejohns, T. (2019). Association of Lifestyle and Genetic Risk with Incidence of Dementia. jamanetwork.com. Available online at: https://jamanetwork.com/journals/jama/article-abstract/2738355 (accessed September 4, 2020).
Luszcz, M. (2011). “Executive function and cognitive aging,” in Handbook of the Psychology of Aging, eds K. Schaie and S. Willis (Amsterdam: Elsevier, Inc), 59–72. doi: 10.1016/b978-0-12-380882-0.00004-8
Lyall, D. M., Harris, S. E., Bastin, M. E., Muñoz Maniega, S., Murray, C., Lutz, M. W., et al. (2014). Alzheimer’s disease susceptibility genes APOE and TOMM40, and brain white matter integrity in the Lothian Birth Cohort 1936. Neurobiol. Aging 35, 1513.e25–1513.e33. doi: 10.1016/j.neurobiolaging.2014.01.006
MacDonald, S. W. S., DeCarlo, C. A., and Dixon, R. A. (2011). Linking biological and cognitive aging: toward improving characterizations of developmental time. J. Gerontol. B. Psychol. Sci. Soc. Sci. 66(Suppl. 1), i59–i70. doi: 10.1093/geronb/gbr039
Mapstone, M., Lin, F., Nalls, M. A., Cheema, A. K., Singleton, A. B., Fiandaca, M. S., et al. (2017). What success can teach us about failure: the plasma metabolome of older adults with superior memory and lessons for Alzheimer’s disease. Neurobiol. Aging 51, 148–155. doi: 10.1016/J.NEUROBIOLAGING.2016.11.007
Marioni, R. E., Proust-Lima, C., Amieva, H., Brayne, C., Matthews, F. E., Dartigues, J. F., et al. (2014). Cognitive lifestyle jointly predicts longitudinal cognitive decline and mortality risk. Eur. J. Epidemiol. 29, 211–219. doi: 10.1007/s10654-014-9881-8
Marioni, R. E., Proust-Lima, C., Amieva, H., Brayne, C., Matthews, F. E., Dartigues, J.-F., et al. (2015). Social activity, cognitive decline and dementia risk: a 20-year prospective cohort study. BMC Public Health 15:1089. doi: 10.1186/s12889-015-2426-6
Marioni, R. E., Valenzuela, M. J., van den Hout, A., Brayne, C., and Matthews, F. E. (2012). Active cognitive lifestyle is associated with positive cognitive health transitions and compression of morbidity from age sixty-five. PLoS One 7:e050940. doi: 10.1371/journal.pone.0050940
McDade, E., Sun, Z., Lee, C. W., Snitz, B., Hughes, T., Chang, C. C. H., et al. (2016). The association between pulse pressure change and cognition in late life: age and where you start matters. Alzheimer’s Dement. Diagnosis, Assess. Dis. Monit. 4, 56–66. doi: 10.1016/j.dadm.2016.03.008
McDermott, K. L., McFall, G. P., Andrews, S. J., Anstey, K. J., and Dixon, R. A. (2016). Memory resilience to Alzheimer’s genetic risk: sex effects in predictor profiles. J. Gerontol. Ser. B Psychol. Sci. Soc. Sci. 42:gbw161. doi: 10.1093/geronb/gbw161
McFall, G., Wiebe, S. A., Vergote, D., Jhamandas, J., Westaway, D., and Dixon, R. A. (2014). IDE (rs6583817) polymorphism and pulse pressure are independently and interactively associated with level and change in executive function in older adults. Psychol. Aging 29, 418–430. doi: 10.1037/a0034656
McFall, G. P., Bäckman, L., and Dixon, R. A. (2019a). Nuances in Alzheimer’s genetic risk reveal differential predictions of non-demented memory aging trajectories: selective patterns by APOE genotype and sex. Curr. Alzheimer Res. 16, 302–315. doi: 10.2174/1567205016666190315094452
McFall, G. P., McDermott, K. L., and Dixon, R. A. (2019b). Modifiable risk factors discriminate memory trajectories in non-demented aging: precision factors and targets for promoting healthier brain aging and preventing dementia. J. Alzheimer’s Dis. 70, S101–S118. doi: 10.3233/JAD-180571
McFall, G. P., Sapkota, S., McDermott, K. L., and Dixon, R. A. (2016). Risk-reducing Apolipoprotein E and Clusterin genotypes protect against the consequences of poor vascular health on executive function performance and change in nondemented older adults. Neurobiol. Aging 42, 91–100. doi: 10.1016/j.neurobiolaging.2016.02.032
McFall, G. P., Sapkota, S., Thibeau, S., and Dixon, R. A. (2017). “Executive function in normal aging and neurodegenerative diseases: trajectories and modifiers,” in Executive Function: Development Across the Life Span, eds S. A. Wiebe and J. Karbach (Oxford, UK: Taylor & Francis), 296.
McFall, G. P., Wiebe, S. A., Vergote, D., Westaway, D., Jhamandas, J., Bäckman, L., et al. (2015). ApoE and pulse pressure interactively influence level and change in the aging of episodic memory: protective effects among ε2 carriers. Neuropsychology 29, 388–401. doi: 10.1037/neu0000150
Medina, M., Khachaturian, Z. S., Rossor, M., Avila, J., and Cedazo-Minguez, A. (2017). Toward common mechanisms for risk factors in Alzheimer’s syndrome. Alzheimer’s Dement. Transl. Res. Clin. Interv. 3, 571–578. doi: 10.1016/J.TRCI.2017.08.009
Mengel-From, J., Christensen, K., McGue, M., and Christiansen, L. (2011). Genetic variations in the CLU and PICALM genes are associated with cognitive function in the oldest old. Neurobiol. Aging 32, 554.e7–554.e11. doi: 10.1016/j.neurobiolaging.2010.07.016
Miyake, A., and Friedman, N. P. (2012). The nature and organization of individual differences in executive functions: four general conclusions. Curr. Dir. Psychol. Sci. 21:8. doi: 10.1177/0963721411429458
Miyake, A., Friedman, N. P., Emerson, M. J., Witzki, A. H., Howerter, A., and Wager, T. D. (2000). The unity and diversity of executive functions and their contributions to complex “Frontal Lobe” tasks: a latent variable analysis. Cogn. Psychol. 41, 49–100. doi: 10.1006/cogp.1999.0734
Namipashaki, A., Razaghi-Moghadam, Z., and Ansari-Pour, N. (2015). The essentiality of reporting Hardy-Weinberg equilibrium calculations in population-based genetic association studies. Cell J. 17, 187–192. doi: 10.22074/cellj.2016.3711
Nation, D. A., Edland, S. D., Bondi, M. W., Salmon, D. P., Delano-Wood, L., Peskind, E. R., et al. (2013). Pulse pressure is associated with Alzheimer biomarkers in cognitively normal older adults. Neurology 81, 2024–2027. doi: 10.1212/01.wnl.0000436935.47657.78
Nelson, P. T., Pious, N. M., Jicha, G. A., Wilcock, D. M., Fardo, D. W., Estus, S., et al. (2013). APOE-ε2 and APOE ε4 correlate with increased amyloid accumulation in cerebral vasculature. J. Neuropathol. Exp. Neurol. 72, 708–715. doi: 10.1097/NEN.0b013e31829a25b9
Ngandu, T., Lehtisalo, J., Solomon, A., Levälahti, E., Ahtiluoto, S., Antikainen, R., et al. (2015). A 2 year multidomain intervention of diet, exercise, cognitive training, and vascular risk monitoring versus control to prevent cognitive decline in at-risk elderly people (FINGER): a randomised controlled trial. Lancet 385, 2255–2263. doi: 10.1016/S0140-6736(15)60461-5
Niu, H., Qu, Y., Li, Z., Wang, R., Li, L., Li, M., et al. (2018). Smoking and risk for Alzheimer disease. J. Nerv. Ment. Dis. 206, 680–685. doi: 10.1097/NMD.0000000000000859
Palta, P., Sharrett, A. R., Deal, J. A., Evenson, K. R., Gabriel, K. P., Folsom, A. R., et al. (2019). Leisure-time physical activity sustained since midlife and preservation of cognitive function: the atherosclerosis risk in communities study. Alzheimer’s Dement 15, 273–281. doi: 10.1016/j.jalz.2018.08.008
Peters, R., Booth, A., Rockwood, K., Peters, J., D’Este, C., and Anstey, K. J. (2019). Combining modifiable risk factors and risk of dementia: a systematic review and meta-analysis. BMJ Open 9, 1–22. doi: 10.1136/bmjopen-2018-022846
Porter, T., Burnham, S. C., Milicic, L., Savage, G., Maruff, P., Lim, Y. Y., et al. (2018). Utility of an Alzheimer’s disease risk-weighted polygenic risk score for predicting rates of cognitive decline in preclinical Alzheimer’s disease: a prospective longitudinal study. J. Alzheimer’s Dis. 66, 1193–1211. doi: 10.3233/JAD-180713
Prince, M. J., Wu, F., Guo, Y., Gutierrez Robledo, L. M., O’Donnell, M., Sullivan, R., et al. (2015). The burden of disease in older people and implications for health policy and practice. Lancet 385, 549–562. doi: 10.1016/S0140-6736(14)61347-7
Ramos-Cejudo, J., Wisniewski, T., Marmar, C., Zetterberg, H., Blennow, K., de Leon, M. J., et al. (2018). Traumatic brain injury and Alzheimer’s disease: the cerebrovascular link. EBioMedicine 28, 21–30. doi: 10.1016/j.ebiom.2018.01.021
Raz, N., Dahle, C. L., Rodrigue, K. M., Kennedy, K. M., and Land, S. (2011). Effects of age, genes, and pulse pressure on executive functions in healthy adults. Neurobiol. Aging 32, 1124–1137. doi: 10.1016/j.neurobiolaging.2009.05.015
Raz, N., Gunning-Dixon, F. M., Head, D., Dupuis, J., and Acker, J. (1998). Neuroanatomical correlates of cognitive aging: evidence from structural magnetic resonance imaging. Neuropsychology 12, 95–114. doi: 10.1037//0894-4105.12.1.95
Raz, N., and Rodrigue, K. M. (2006). Differential aging of the brain: patterns, cognitive correlates and modifiers. Neurosci. Biobehav. Rev. 30:730. doi: 10.1016/J.NEUBIOREV.2006.07.001
Reas, E. T., Laughlin, G. A., Bergstrom, J., Kritz-Silverstein, D., Barrett-Connor, E., and McEvoy, L. K. (2019). Effects of APOE on cognitive aging in community-dwelling older adults. Neuropsychology 33, 406–416. doi: 10.1037/neu0000501
Reitz, C. (2016). Toward precision medicine in Alzheimer’s disease. Ann. Transl. Med. 4:107. doi: 10.21037/atm.2016.03.05
Reitz, C., Tang, M.-X., Schupf, N., Manly, J. J., Mayeux, R., and Luchsinger, J. A. (2010). A summary risk score for the prediction of alzheimer disease in elderly persons. Arch. Neurol. 67, 835–841. doi: 10.1001/archneurol.2010.136
Reuter-Lorenz, P. A., Festini, S. B., and Jantz, T. K. (2021). “Executive functions and neurocognitive aging,” in Handbook of the Psychology of Aging, 9th Edn, eds K. Schaie and S. Willis (Amserdam: Elsevier), 67–82. doi: 10.1016/b978-0-12-816094-7.00019-2
Roberts, R. O., Cha, R. H., Mielke, M. M., Geda, Y. E., Boeve, B. F., MacHulda, M. M., et al. (2015). Risk and protective factors for cognitive impairment in persons aged 85 years and older. Neurology 84, 1854–1861. doi: 10.1212/WNL.0000000000001537
Rochoy, M., Bordet, R., Gautier, S., and Chazard, E. (2019). Factors associated with the onset of Alzheimer’s disease: data mining in the French nationwide discharge summary database between 2008 and 2014. PLoS One 14:e0220174. doi: 10.1371/journal.pone.0220174
Ross, J. A., Gliebus, G., and Van Bockstaele, E. J. (2018). Stress induced neural reorganization: a conceptual framework linking depression and Alzheimer’s disease. Prog. Neuro-Psychopharmacol. Biol. Psychiatry 85, 136–151. doi: 10.1016/j.pnpbp.2017.08.004
Runge, S. K., Small, B. J., McFall, G. P., and Dixon, R. A. (2014). APOE moderates the association between lifestyle activities and cognitive performance: evidence of genetic plasticity in aging. J. Int. Neuropsychol. Soc. 20, 478–486. doi: 10.1017/S1355617714000356
Sapkota, S., Bäckman, L., and Dixon, R. A. (2017). Executive function performance and change in aging is predicted by apolipoprotein E, intensified by catechol-O-methyltransferase and brain-derived neurotrophic factor, and moderated by age and lifestyle. Neurobiol. Aging 52, 81–89. doi: 10.1016/j.neurobiolaging.2016.12.022
Sapkota, S., and Dixon, R. A. (2018). A network of genetic effects on non-demented cognitive aging: alzheimer’s genetic risk (CLU + CR1 + PICALM) intensifies cognitive aging genetic risk (COMT + BDNF) selectively for APOE ϵ 4 carriers. J. Alzheimer’s Dis. 62, 887–900. doi: 10.3233/JAD-170909
Sapkota, S., Huan, T., Tran, T., Zheng, J., Camicioli, R., Li, L., et al. (2018). Alzheimer’s biomarkers from multiple modalities selectively discriminate clinical status: relative importance of salivary metabolomics panels, genetic, lifestyle, cognitive, functional health and demographic risk markers. Front. Aging Neurosci. 10:296. doi: 10.3389/fnagi.2018.00296
Sapkota, S., Vergote, D., Westaway, D., Jhamandas, J., and Dixon, R. A. (2015). Synergistic associations of catechol-O-methyltransferase and brain-derived neurotrophic factor with executive function in agingare selective and modified by apolipoprotein E. Neurobiol. Aging 36, 249–256. doi: 10.1016/j.neurobiolaging.2014.06.020
Schiepers, O. J. G., Köhler, S., Deckers, K., Irving, K., O’Donnell, C. A., van den Akker, M., et al. (2018). Lifestyle for Brain Health (LIBRA): a new model for dementia prevention. Int. J. Geriatr. Psychiatry 33, 167–175. doi: 10.1002/gps.4700
Schmeidler, J., Mastrogiacomo, C. N., Beeri, M. S., Rosendorff, C., and Silverman, J. M. (2019). Distinct age-related associations for body mass index and cognition in cognitively healthy very old veterans. Int. Psychogeriatrics 31, 895–899. doi: 10.1017/S1041610218001412
Schnitzspahn, K. M., Stahl, C., Zeintl, M., Kaller, C. P., and Kliegel, M. (2013). The role of shifting, updating, and inhibition in prospective memory performance in young and older adults. Dev. Psychol. 49, 1544–1553. doi: 10.1037/A0030579
Shaw, B. A., and Spokane, L. S. (2008). Examining the association between education level and physical activity changes during early old age. J. Aging Health 20, 767–787. doi: 10.1177/0898264308321081
Sinclair, L. I., Pleydell-Pearce, C. W., and Day, I. N. M. (2017). Possible positive effect of the APOE ε2 allele on cognition in early to mid-adult life. Neurobiol. Learn. Mem. 146, 37–46. doi: 10.1016/j.nlm.2017.10.008
Sindi, S., Calov, E., Fokkens, J., Ngandu, T., Soininen, H., Tuomilehto, J., et al. (2015). The CAIDE dementia risk score app: the development of an evidence-based mobile application to predict the risk of dementia. Alzheimer’s Dement. Diagnosis, Assess. Dis. Monit. 1, 328–333. doi: 10.1016/j.dadm.2015.06.005
Small, B. J., Dixon, R. A., and McArdle, J. J. (2011). Tracking cognition-health changes from 55 to 95 years of age. J. Gerontol. B. Psychol. Sci. Soc. Sci. 66(Suppl. 1), i153–i161. doi: 10.1093/geronb/gbq093
Small, B. J., Dixon, R. A., McArdle, J. J., and Grimm, K. J. (2012). Do changes in lifestyle engagement moderate cognitive decline in normal aging? Evidence from the Victoria Longitudinal Study. Neuropsychology 26, 144–155. doi: 10.1037/a0026579
Staekenborg, S. S., Kelly, N., Schuur, J., Koster, P., Scherder, E., Tielkes, C. E. M., et al. (2020). Education as proxy for cognitive reserve in a large elderly memory clinic: ‘Window of Benefit.’. J. Alzheimer’s Dis. 76, 671–679. doi: 10.3233/jad-191332
Stephen, R., Liu, Y., Ngandu, T., Rinne, J. O., Kemppainen, N., Parkkola, R., et al. (2017). Associations of CAIDE dementia risk score with MRI, PIB-PET measures, and cognition. J. Alzheimer’s Dis. 59, 695–705. doi: 10.3233/JAD-170092
Sternäng, O., Reynolds, C. A., Finkel, D., Ernsth-Bravell, M., Pedersen, N. L., and Dahl Aslan, A. K. (2016). Grip strength and cognitive abilities: associations in old age. J. Gerontol. B Psychol. Sci. Soc. Sci. 71, 841–848. doi: 10.1093/geronb/gbv017
Stocker, H., Möllers, T., Perna, L., and Brenner, H. (2018). The genetic risk of Alzheimer’s disease beyond APOE ε4: systematic review of Alzheimer’s genetic risk scores. Transl. Psychiatry 8:166. doi: 10.1038/s41398-018-0221-8
Stocker, H., Perna, L., Weigl, K., Möllers, T., Schöttker, B., Thomsen, H., et al. (2020). Prediction of clinical diagnosis of Alzheimer’s disease, vascular, mixed, and all-cause dementia by a polygenic risk score and APOE status in a community-based cohort prospectively followed over 17 years. Mol. Psychiatry 1–11. doi: 10.1038/s41380-020-0764-y
Szczechowiak, K., Diniz, B. S., and Leszek, J. (2019). Diet and Alzheimer’s dementia – Nutritional approach to modulate inflammation. Pharmacol. Biochem. Behav. 184:172743. doi: 10.1016/j.pbb.2019.172743
Taylor, S. F., Kornblum, S., Lauber, E. J., Minoshima, S., and Koeppe, R. A. (1997). Isolation of specific interference processing in the stroop task: pet activation studies. Neuroimage 6, 81–92. doi: 10.1006/nimg.1997.0285
Thibeau, S., McDermott, K., McFall, G. P., Rockwood, K., and Dixon, R. A. (2019). Frailty effects on non-demented cognitive trajectories are moderated by sex and Alzheimer’s genetic risk. Alzheimer’s Res. Ther. 11:55. doi: 10.1186/s13195-019-0509-9
Thibeau, S., McFall, G. P., Wiebe, S. A., Anstey, K. J., and Dixon, R. A. (2016). Genetic factors moderate everyday physical activity effects on executive functions in aging: evidence from the Victoria Longitudinal Study. Neuropsychology 30, 6–17. doi: 10.1037/neu0000217
Tierney, M. C., Curtis, A. F., Chertkow, H., and Rylett, R. J. (2017). Integrating sex and gender into neurodegeneration research: a six-component strategy. Alzheimer’s Dement. Transl. Res. Clin. Interv. 3, 660–667. doi: 10.1016/j.trci.2017.10.006
Tomata, Y., Zhang, S., Sugawara, Y., and Tsuji, I. (2019). Impact of time spent walking on incident dementia in elderly Japanese. Int. J. Geriatr. Psychiatry 34, 204–209. doi: 10.1002/gps.5011
Turner, G. R., and Spreng, R. N. (2012). Executive functions and neurocognitive aging: dissociable patterns of brain activity. Neurobiol. Aging 33, 826.e1–826.e13 doi: 10.1016/J.NEUROBIOLAGING.2011.06.005
Van der Linden, M., and Juillerat Van der Linden, A.-C. (2018). A life-course and multifactorial approach to Alzheimer’s disease: implications for research, clinical assessment and intervention practices. Dementia 17, 880–895. doi: 10.1177/1471301216657270
Vemuri, P., Lesnick, T. G., Przybelski, S. A., Knopman, D. S., Roberts, R. O., Lowe, V. J., et al. (2012). Effect of lifestyle activities on alzheimer disease biomarkers and cognition. Ann. Neurol. 72, 730–738. doi: 10.1002/ana.23665
Viscogliosi, G., di Bernardo, M. G., Ettorre, E., and Chiriac, I. M. (2017). Handgrip strength predicts longitudinal changes in clock drawing test performance. An observational study in a sample of older non-demented adults. J. Nutr. Heal. Aging 21, 593–596. doi: 10.1007/s12603-016-0816-9
Vos, S. J. B., van Boxtel, M. P. J., Schiepers, O. J. G., Deckers, K., de Vugt, M., Carrière, I., et al. (2017). Modifiable risk factors for prevention of dementia in midlife, late life and the oldest-old: validation of the LIBRA index. J. Alzheimer’s Dis. 58, 537–547. doi: 10.3233/JAD-161208
Walters, K., Hardoon, S., Petersen, I., Iliffe, S., Omar, R. Z., Nazareth, I., et al. (2016). Predicting dementia risk in primary care: development and validation of the Dementia Risk Score using routinely collected data. BMC Med. 14:6. doi: 10.1186/s12916-016-0549-y
Wang, H.-X., Karp, A., Winblad, B., and Fratiglioni, L. (2002). American Journal of EPIDEMIOLOGY Late-Life Engagement in Social and Leisure Activities Is Associated with a Decreased Risk of Dementia: A Longitudinal Study from the Kungsholmen Project. Available online at: https://academic.oup.com/aje/article-abstract/155/12/1081/123155 (accessed May 10, 2020).
Wang, H. X., Xu, W., and Pei, J. J. (2012). Leisure activities, cognition and dementia. Biochim. Biophys. Acta - Mol. Basis Dis. 1822, 482–491. doi: 10.1016/j.bbadis.2011.09.002
Wang, Y., Du, Y., Li, J., and Qiu, C. (2019). Lifespan intellectual factors, genetic susceptibility, and cognitive phenotypes in aging: implications for interventions. Front. Aging Neurosci. 11:129. doi: 10.3389/fnagi.2019.00129
Wimo, A., Guerchet, M., Ali, G.-C., Wu, Y.-T., Prina, A. M., Winblad, B., et al. (2017). The worldwide costs of dementia 2015 and comparisons with 2010. Alzheimer’s Dement. 13, 1–7. doi: 10.1016/j.jalz.2016.07.150
Wishart, H. A., Roth, R. M., Saykin, A. J., Rhodes, C. H., Tsongalis, G. J., Pattin, K. A., et al. (2011). COMT Val158met genotype and individual differences in executive function in healthy adults. J. Int. Neuropsychol. Soc. 17, 174–180. doi: 10.1017/S1355617710001402
Wittke-Thompson, J. K., Pluzhnikov, A., and Cox, N. J. (2005). Rational inferences about departures from Hardy-Weinberg equilibrium. Am. J. Hum. Genet. 76, 967–986. doi: 10.1086/430507
Yates, L. A., Ziser, S., Spector, A., and Orrell, M. (2016). Cognitive leisure activities and future risk of cognitive impairment and dementia: systematic review and meta-analysis. Int. Psychogeriatrics 28, 1791–1806. doi: 10.1017/S1041610216001137
Zahodne, L. B., Glymour, M. M., Sparks, C., Bontempo, D., Dixon, R. A., MacDonald, S. W. S., et al. (2011). Education does not slow cognitive decline with aging: 12-year evidence from the victoria longitudinal study. J. Int. Neuropsychol. Soc. 17, 1039–1046. doi: 10.1017/S1355617711001044
Zahodne, L. B., Schupf, N., Brickman, A. M., Mayeux, R., Wall, M. M., Stern, Y., et al. (2016). Dementia risk and protective factors differ in the context of memory trajectory groups. J. Alzheimer’s Dis. 52, 1013–1020. doi: 10.3233/JAD-151114
Zaninotto, P., David Batty, G., Allerhand, M., and Deary, I. J. (2018). Cognitive function trajectories and their determinants in older people: 8 years of follow-up in the English Longitudinal Study of Ageing. J. Epidemiol. Commun. Heal. 72, 685–694. doi: 10.1136/jech-2017-210116
Keywords: modifiable risk factors, genetic risk scores, normal aging, cognitive trajectories, Alzheimer’s disease, Victoria Longitudinal Study
Citation: Sapkota S, McFall GP, Masellis M and Dixon RA (2021) A Multimodal Risk Network Predicts Executive Function Trajectories in Non-demented Aging. Front. Aging Neurosci. 13:621023. doi: 10.3389/fnagi.2021.621023
Received: 24 October 2020; Accepted: 24 August 2021;
Published: 16 September 2021.
Edited by:
Christian Neri, Institut National de la Santé et de la Recherche Médicale (INSERM), FranceReviewed by:
Michael Malek-Ahmadi, Banner Alzheimer’s Institute, United StatesSamantha Burnham, Commonwealth Scientific and Industrial Research Organisation (CSIRO), Australia
Copyright © 2021 Sapkota, McFall, Masellis and Dixon. This is an open-access article distributed under the terms of the Creative Commons Attribution License (CC BY). The use, distribution or reproduction in other forums is permitted, provided the original author(s) and the copyright owner(s) are credited and that the original publication in this journal is cited, in accordance with accepted academic practice. No use, distribution or reproduction is permitted which does not comply with these terms.
*Correspondence: Roger A. Dixon, rdixon@ualberta.ca