
95% of researchers rate our articles as excellent or good
Learn more about the work of our research integrity team to safeguard the quality of each article we publish.
Find out more
ORIGINAL RESEARCH article
Front. Aging Neurosci. , 05 June 2020
Sec. Alzheimer's Disease and Related Dementias
Volume 12 - 2020 | https://doi.org/10.3389/fnagi.2020.00139
 Elizabeth E. Moore1
 Dandan Liu2Kimberly R. Pechman1Lealani Mae Y. Acosta1Susan P. Bell1,3L. Taylor Davis1,4
 Kaj Blennow5,6
 Henrik Zetterberg5,6,7,8
 Bennett A. Landman4,9,10
 Matthew S. Schrag1Timothy J. Hohman1,11Katherine A. Gifford1
 Angela L. Jefferson1,3*
Introduction: While Alzheimer’s disease (AD) is divided into severity stages, mild cognitive impairment (MCI) remains a solitary construct despite clinical and prognostic heterogeneity. This study aimed to characterize differences in genetic, cerebrospinal fluid (CSF), neuroimaging, and neuropsychological markers across clinician-derived MCI stages.
Methods: Vanderbilt Memory & Aging Project participants with MCI were categorized into 3 severity subtypes at screening based on neuropsychological assessment, functional assessment, and Clinical Dementia Rating interview, including mild (n = 18, 75 ± 8 years), moderate (n = 89 72 ± 7 years), and severe subtypes (n = 18, 78 ± 8 years). At enrollment, participants underwent neuropsychological testing, 3T brain magnetic resonance imaging (MRI), and optional fasting lumbar puncture to obtain CSF. Neuropsychological testing and MRI were repeated at 18-months, 3-years, and 5-years with a mean follow-up time of 3.3 years. Ordinary least square regressions examined cross-sectional associations between MCI severity and apolipoprotein E (APOE)-ε4 status, CSF biomarkers of amyloid beta (Aβ), phosphorylated tau, total tau, and synaptic dysfunction (neurogranin), baseline neuroimaging biomarkers, and baseline neuropsychological performance. Longitudinal associations between baseline MCI severity and neuroimaging and neuropsychological trajectory were assessed using linear mixed effects models with random intercepts and slopes and a follow-up time interaction. Analyses adjusted for baseline age, sex, race/ethnicity, education, and intracranial volume for MRI models.
Results: Stages differed at baseline on APOE-ε4 status (early < middle = late; p-values < 0.03) and CSF Aβ (early > middle = late), phosphorylated and total tau (early = middle < late; p-values < 0.05), and neurogranin concentrations (early = middle < late; p-values < 0.05). MCI stage related to greater longitudinal cognitive decline, hippocampal atrophy, and inferior lateral ventricle dilation (early < late; p-values < 0.03).
Discussion: Clinician staging of MCI severity yielded longitudinal cognitive trajectory and structural neuroimaging differences in regions susceptible to AD neuropathology and neurodegeneration. As expected, participants with more severe MCI symptoms at study entry had greater cognitive decline and gray matter atrophy over time. Differences are likely attributable to baseline differences in amyloidosis, tau, and synaptic dysfunction. MCI staging may provide insight into underlying pathology, prognosis, and therapeutic targets.
Clinicians often categorize Alzheimer’s disease (AD) into severity stages to account for heterogeneity in clinical presentation and progression. However, mild cognitive impairment (MCI), the prodromal phase of AD, remains a singular construct despite many individuals reverting to normal or remaining stable (Ganguli et al., 2004) while others convert to dementia (Ritchie et al., 2001). Prior work has investigated the heterogeneity underlying different stages of MCI (Wu et al., 2012; Lee et al., 2014; Ye et al., 2014; Edmonds et al., 2019), primarily defined as early or late stage based on the Clinical Dementia Rating (CDR) (Morris, 1993), Mini-Mental State Exam (Folstein et al., 1975), and Weschler Memory Scale-Revised Logical Memory Delayed Recall scores (Aisen et al., 2010). Participants with late MCI have greater cerebral amyloid-β (Aβ42) deposition (Wu et al., 2012; Edmonds et al., 2019), greater cortical thinning (Ye et al., 2014), and reduced brain connectivity (Lee et al., 2014) compared to early MCI. Additionally, cerebrospinal fluid (CSF) and neuroimaging biomarker profiles change across impairment stages. For example, positron emission tomography (PET) data suggest Aβ42 accumulation plateaus early in AD development (Jack et al., 2013), whereas tau accumulation continues to rise as clinical symptoms worsen (Mattsson et al., 2017). Thus, there is a need to better understand the biomarker, imaging, and clinical characteristics of each MCI stage to determine how clinical staging may provide insight into different underlying disease processes, pathological changes, and prognosis. Further, recent evidence suggests other pathologies, such as synaptic dysfunction (measured by CSF neurogranin, Thorsell et al., 2010) or axonal injury [measured by CSF neurofilament light (NFL) (Zetterberg et al., 2016)], contribute to the development and progression of MCI (Kester et al., 2015; Kern et al., 2018), but it is unknown if these pathologies differ across stages of clinical impairment.
This study examined whether clinician-driven MCI staging (early, middle, late) corresponded to differences in apolipoprotein-E (APOE) ε4 status, CSF biomarkers, longitudinal neuroimaging outcomes, or longitudinal neuropsychological trajectory. In contrast to prior research examining MCI subtypes, we combined baseline comprehensive neuropsychological performance with participant and informant clinical interview information from the CDR and Functional Activities Questionnaire (FAQ) (Pfeffer et al., 1982) to subtype participants. To examine differences in pathology across the MCI spectrum, we used 3-category staging (early, middle, late), rather than a binary approach, as recent work suggests dichotomous staging of MCI based on memory impairment alone may be insufficient to accurately categorize participants according to neuropathological differences (Edmonds et al., 2019). We hypothesized the stages would exhibit APOE-ε4, CSF biomarker, longitudinal neuroimaging, and longitudinal neuropsychological differences across the clinical spectrum of MCI severity. Given prior work suggesting CSF Aβ42 levels (Bilgel et al., 2018) and APOE-ε4 status (Vemuri et al., 2010) may exert adverse effects prior to neurodegeneration, we also hypothesized early and middle MCI would relate to CSF Aβ42 concentrations and APOE-ε4 status, while late MCI participants closer to the clinical threshold for dementia would have more phosphorylated tau-related injury, including neurodegeneration. Finally, we hypothesized late MCI participants would show greater neuropsychological decline given their more severe baseline phenotype.
The Vanderbilt Memory & Aging Project (Jefferson et al., 2016) is a longitudinal observational study investigating vascular health and brain aging, enriched with older adults with MCI (Albert et al., 2011). Cohort inclusion criteria required participants be at least 60 years of age, speak English, have adequate auditory and visual acuity for testing, and have a reliable study partner. At eligibility, participants underwent a comprehensive assessment including a medical history review, a CDR interview with the participant and informant (Morris, 1993), an FAQ (Pfeffer et al., 1982), and a comprehensive neuropsychological protocol. Participants were excluded for a cognitive diagnosis other than normal cognition (NC), early MCI (Aisen et al., 2010), or MCI (Albert et al., 2011), MRI contraindication, history of neurological disease (e.g., stroke), heart failure, major psychiatric illness, head injury with loss of consciousness > 5 min, or a systemic or terminal illness affecting follow-up participation. The baseline cohort consists of 335 participants, including 132 participants with MCI. Clinicians further categorized MCI participants into three severity subtypes using the CDR, FAQ, and neuropsychological profile. See Table 1 for the clinical staging criteria details. Briefly, early MCI was defined as a CDR global score of 0 or 0.5, having difficulty performing 3 or fewer independent activities of daily living but continuing to complete all activities independently, and neuropsychological impairment in one domain (e.g., memory) or mild impairment in two domains (e.g., memory and executive function). If the latter neuropsychological profile was present (i.e., impairment in more than one domain), the CDR global score had to be 0 and no reported difficulty performing independent activities of daily living (i.e., FAQ = 0). Middle MCI was defined as a CDR global score of 0.5, having difficulty performing 7 or fewer independent activities of daily living but continuing to complete all activities independently, and neuropsychological impairment in memory with possible modest impairment in a second cognitive domain. Late MCI was defined as a CDR global score of 0.5, having difficulty performing at least four independent activities of daily living, requiring at most modest assistance for one or more activities (FAQ score of 2 or 3), and neuropsychological impairment in memory and in a second domain. Neuropsychological impairment in any domain was defined as standard scores falling outside 1.5 standard deviations of age-adjusted normative means (Aisen et al., 2010).
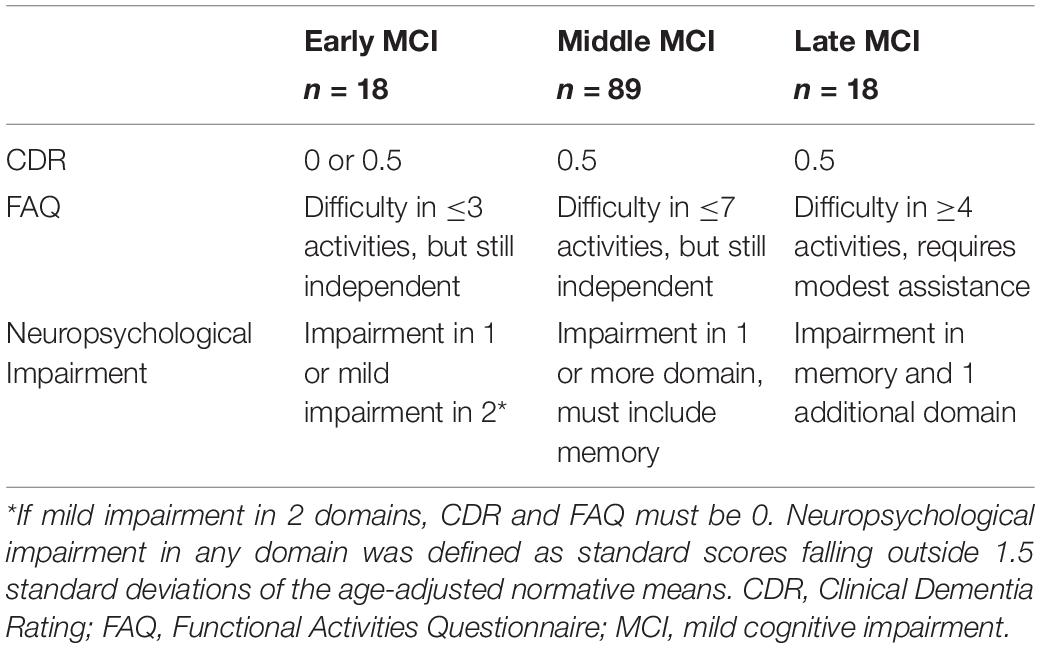
Table 1. Clinician MCI staging criteria.
At enrollment, participants completed a comprehensive examination including (but not limited to) fasting blood draw, physical examination, clinical interview, multi-modal brain MRI, neuropsychological assessment, and optional lumbar puncture. Since the purpose of this study was to assess differences across stages of MCI, participants were excluded from the current study for a diagnosis other than MCI. Participants were also excluded for not having complete datasets. See Supplementary Figure 1 for details. Serial neuropsychological assessment and brain MRI were performed at 18-month, 3-year, and 5-year follow up (for which data collection is ongoing). The protocol was approved by the Vanderbilt University Medical Center Institutional Review Board. Written informed consent was obtained prior to data collection.
A subset of participants completed an optional morning fasting lumbar puncture at enrollment (n = 55, Supplementary Figure 1). CSF was collected with polypropylene syringes using a Sprotte 25-gauge spinal catheter. Samples were immediately centrifuged, aliquoted into 0.5 mL polypropylene tubes, and stored at −80°C. Samples were analyzed in single batch, and commercially available enzyme-linked immunosorbent assays (Fujirebio, Ghent, Belgium) were used to measure CSF concentrations of Aβ42 [INNOTEST® β-AMYLOID(1–42)], phosphorylated tau [p-tau, INNOTEST® PHOSPHO-TAU(181P)], total tau (t-tau, INNOTEST® hTAU), neurogranin (Kvartsberg et al., 2015), and NFL (Uman Diagnostics). Board certified laboratory technicians processed samples blinded to clinical information (Palmqvist et al., 2014). Intra-assay coefficients of variation were < 10% (Kvartsberg et al., 2015).
At baseline and each follow-up visit, all participants completed a common neuropsychological protocol assessing language, attention, information processing speed, executive functioning, visuospatial skills, and episodic memory as summarized in Table 2 (Kresge et al., 2018). Measures were carefully selected to preclude floor or ceiling effects and the protocol is distinct from the protocol at eligibility.
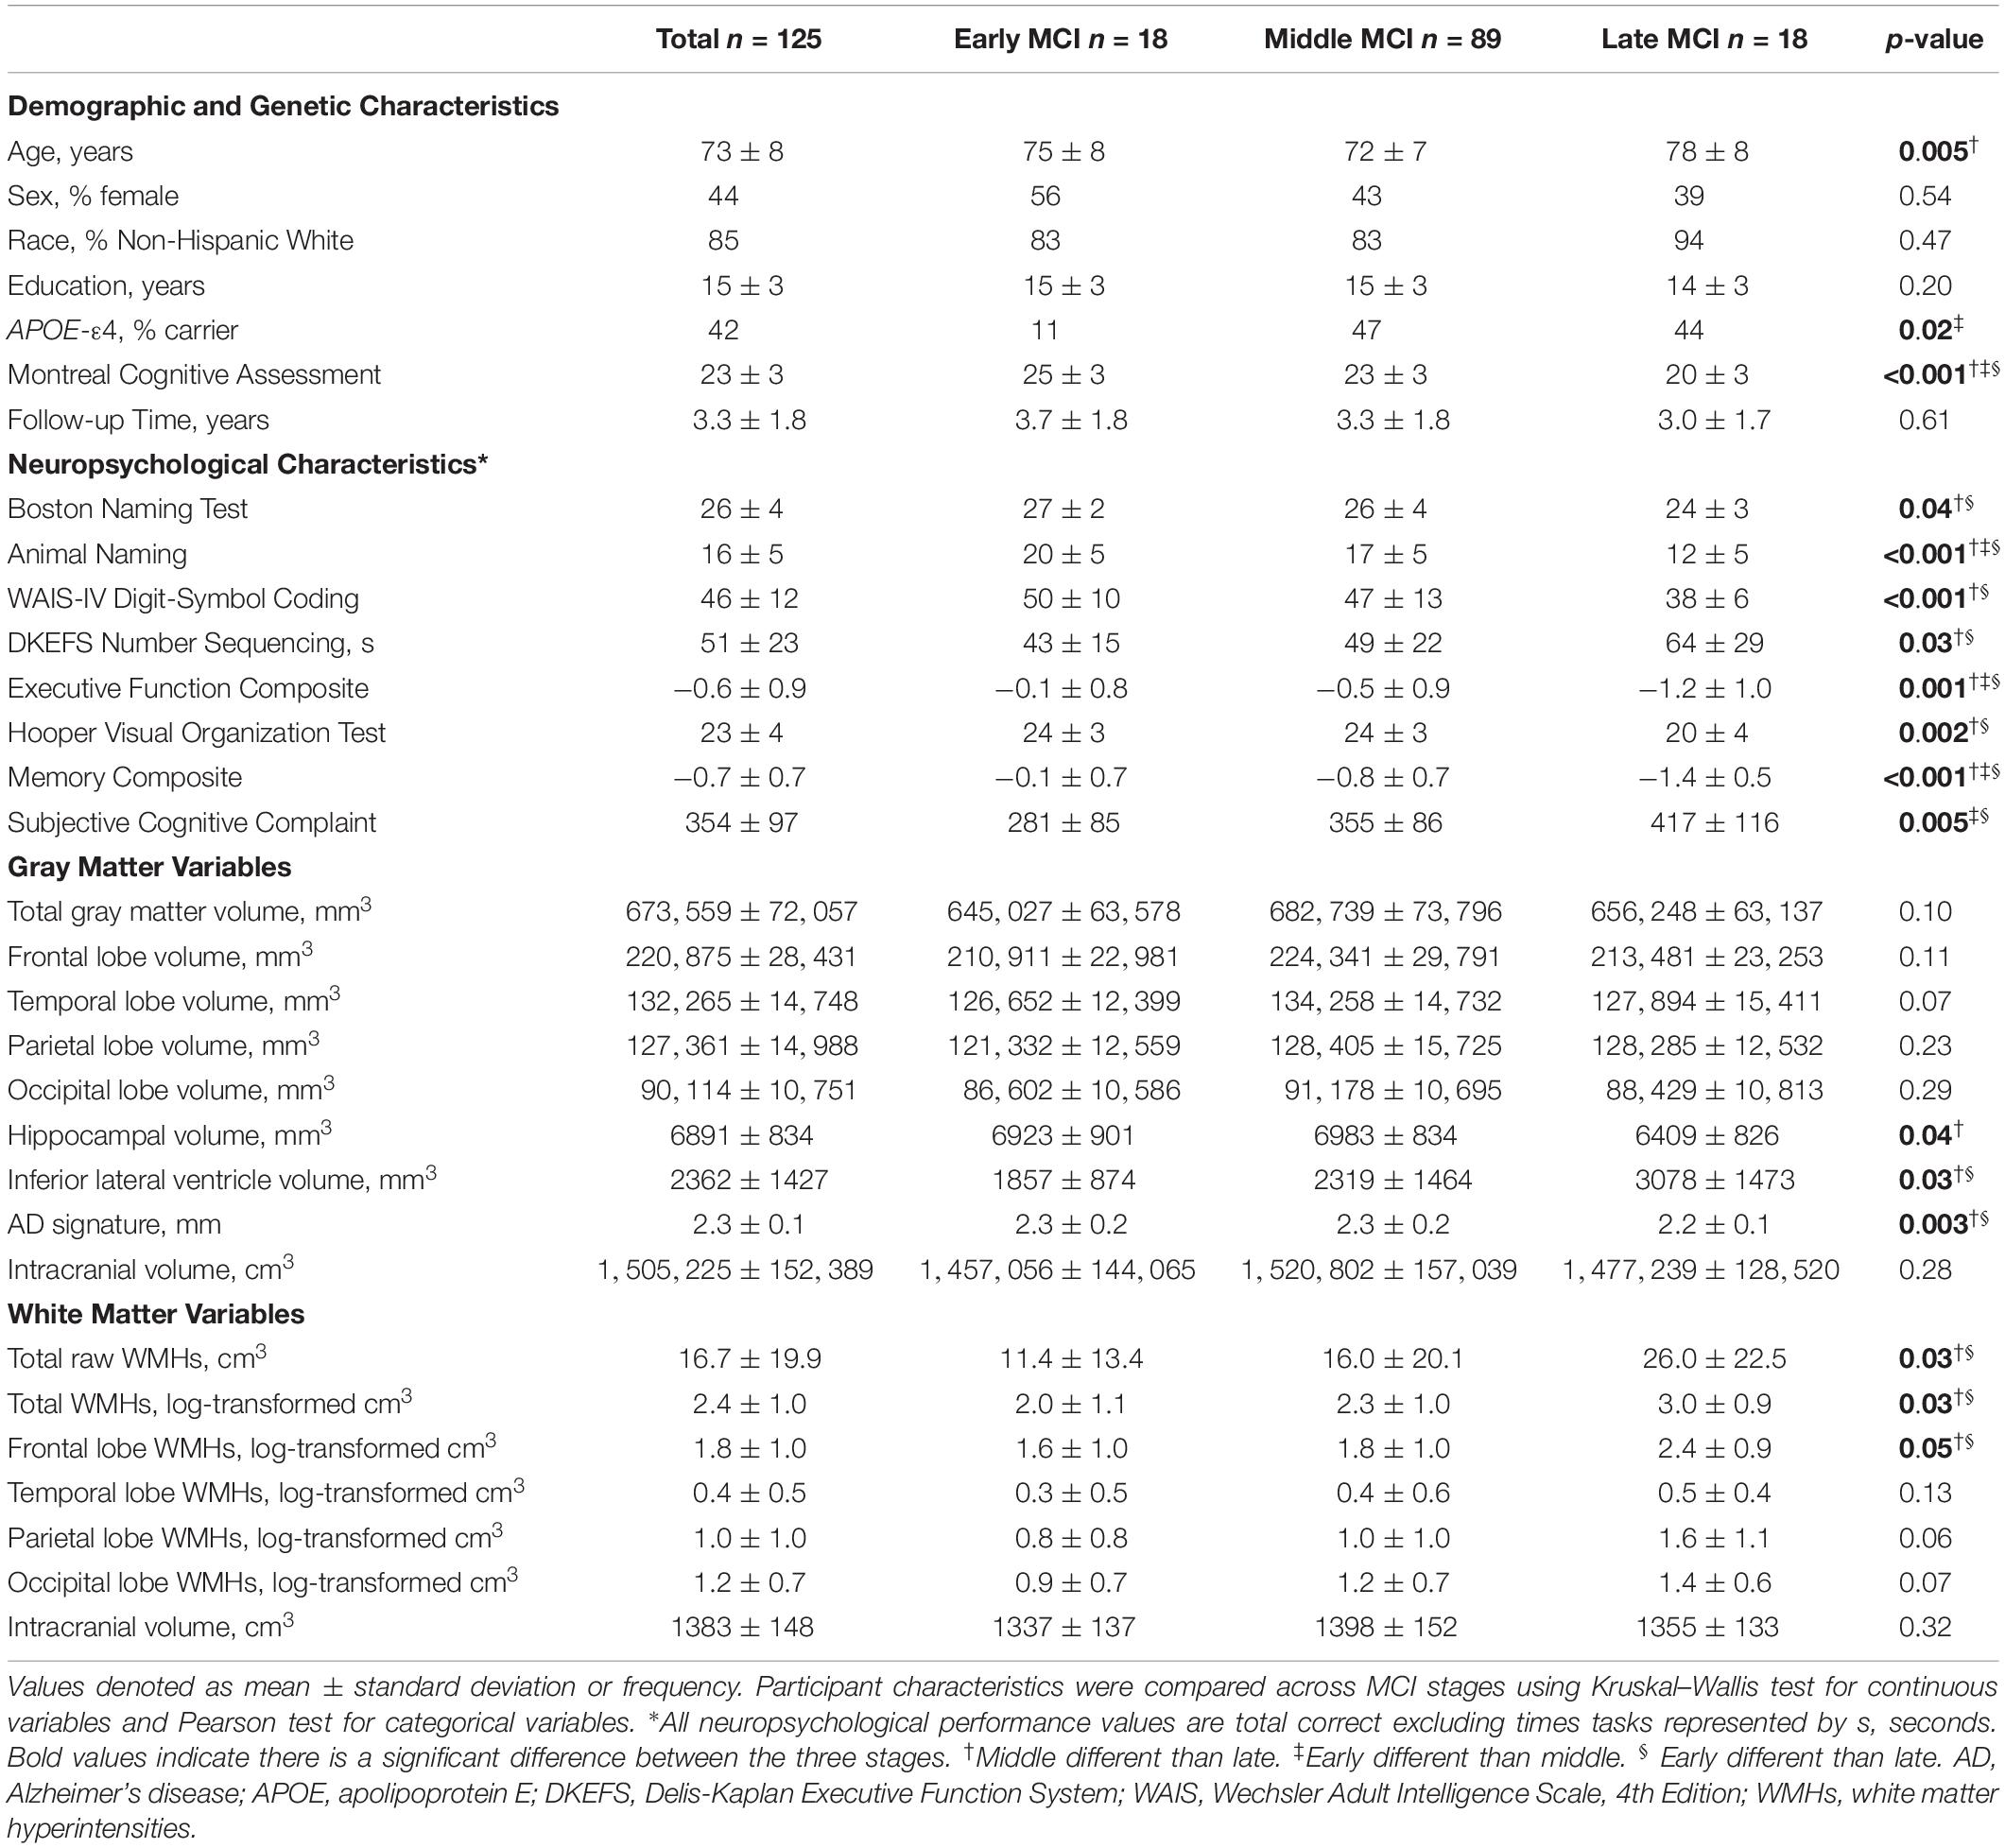
Table 2. Participant demographic, genetic, neuropsychological, and neuroimaging characteristics in the whole sample.
Participants were scanned at the Vanderbilt University Institute of Imaging Science on a 3T Philips Achieva system (Best, Netherlands) using an 8-channel SENSE reception coil array at baseline, 18-month, and 3-year follow-up. A 32-channel coil was used for part of 3-year and all of 5-year data collection.
T1-weighted images (repetition time = 8.9 ms, echo time = 4.6 ms, spatial resolution = 1 mm × 1 mm ×1 mm) were post-processed with a Multi-Atlas Segmentation pipeline (Asman and Landman, 2013). As previously published (Jefferson et al., 2016), T1-weighted images were registered to Montreal Neurological Institute (MNI) space, appropriate atlases were registered to T1-weighted images, and labels were statistically fused. Total intracranial volume and gray matter volume in 7 regions of interests (ROIs), including total, frontal lobe, temporal lobe, parietal lobe, occipital lobe, hippocampal, and inferior lateral ventricle volumes, was calculated.
To evaluate gray matter changes associated with AD pathology (Schwarz et al., 2016), an AD signature variable was calculated. T1-weighted images were post-processed using FreeSurfer1 (Fischl and Dale, 2000). T1-weighted images were registered to MNI space, intensity corrected, and skull stripped. Subcortical structures, cortical structures, and white matter were segmented, and white and gray matter surfaces were constructed for each hemisphere. These surfaces were used to calculate cortical thickness and inflated for visualization. Surfaces were manually inspected and corrected for registration, topological, and segmentation defects. After manual correction, images were reprocessed to update the transformation template and segmentation information. The AD signature was calculated by summing bilateral cortical thickness measurements from regions shown to distinguish individuals with clinical AD from normal cognition, including the entorhinal cortex, temporal lobe, parietal lobe, fusiform gyrus, and precuneus (Schwarz et al., 2016).
FLAIR images (repetition time = 11000 ms, echo time = 121 ms, spatial resolution = 0.45 mm × 0.45 mm × 4 mm) were post-processed using the Lesion Segmentation Toolbox for Statistical Parametric Mapping (SPM8) (Schmidt et al., 2012). As previously published (Osborn et al., 2018), each T1-weighted image voxel was defined as gray matter, white matter, or CSF using the SPM8 tissue probability map. FLAIR images were bias-corrected, registered to T1-weighted images, and manual corrections were made. FLAIR images were segmented into 5 regions of interest (ROIs), including total, frontal, temporal, parietal, and occipital lobe white matter hyperintensity (WMH) volume using an MNI305 lobe atlas (Toro et al., 2009). Intracranial volume was calculated based on a summation of participant-specific gray matter, white matter, and CSF.
APOE-ε4 status was defined as carrier (ε2/ε4, ε3/ε4, ε4/ε4) or non-carrier (ε2/ε2, ε2/ε3, ε3/ε3). To assess clinician bias in the classification of MCI severity stages, latent class analysis (LCA) assessed if underlying classes could be statistically determined using the same CDR, FAQ, and neuropsychological testing information at eligibility that defined the clinical MCI stages. The concordance between clinician-derived MCI and LCA-defined stages was tested with Cohen’s kappa.
Prior to cross-sectional analyses, WMHs (cm3) were log-transformed due to skewed distribution. In cross-sectional models, logistic regression related clinician-derived MCI severity stages (early, middle, late) to APOE-ε4 status. Linear regressions with ordinary least-square estimates related MCI stages to CSF biomarkers, baseline neuroimaging variables, and baseline neuropsychological performance (one test per model). Models adjusted for age, sex, race/ethnicity, education, and intracranial volume for gray matter volume (except the AD signature) and WMH models. In longitudinal models, linear mixed effects regressions with random intercepts and slopes and a follow-up time interaction related baseline MCI severity stage to neuroimaging and neuropsychological trajectory (one test per model). Models adjusted for baseline age, sex, race/ethnicity, education, follow-up time, and baseline intracranial volume for neuroimaging outcomes (except the AD signature). To determine if APOE-ε4 frequency differences accounted for results, models were repeated adjusting for APOE-ε4 status.
Sensitivity analyses were performed excluding participants with predictor or outcome variables > 4 standard deviations from the group mean, yielding similar results (data not shown). Significance was set a priori at p < 0.05. The LCA was conducted using Mplus Version 7.32. Remaining analyses were conducted using R 3.5.33.
Among all participants (n = 125, 73 ± 8 years, range 61–92 years), 18 were classified as early MCI, 89 as middle MCI, and 18 as late MCI by clinical staging criteria. Follow-up time ranged 1.4–5.4 years with a mean of 3.3 years. See Table 2 for characteristics for the entire sample and stratified by MCI severity stage. See Supplementary Table 1 for characteristics for the subset with CSF data.
The LCA was fit to yield three classes, consistent with the clinician-derived MCI stages. Formal concordance testing between the two classification schemes yielded a Cohen’s κ = 0.32, suggesting fair concordance between the clinician-derived staging and statistically derived classifications (Landis and Koch, 1977).
APOE-ε4 status differed by MCI stages, such that APOE-ε4 carriers were more common among participants with middle (β = 6.04, p = 0.02) and late (β = 7.38, p = 0.03) compared to early MCI. There was no APOE-ε4 status difference between middle and late MCI (β = 1.22, p = 0.73).
Between-group comparisons yielded cross-sectional differences in Aβ42 (early > middle = late; p-values < 0.02), p-tau (early = middle < late; p-values < 0.02), t-tau (early = middle < late; p-values < 0.005), and neurogranin (early = middle < late; p-values < 0.05), such that more advanced stages had greater CSF evidence of pathology. There were no group differences in NFL (p-values > 0.11). See Supplementary Table 2 and Figure 1. When adjusting for APOE-ε4 status, cross-sectional differences in CSF p-tau, t-tau, and neurogranin concentrations were similar. However, group differences emerged for CSF Aβ42 (middle > late; p = 0.05) (Supplementary Table 3).
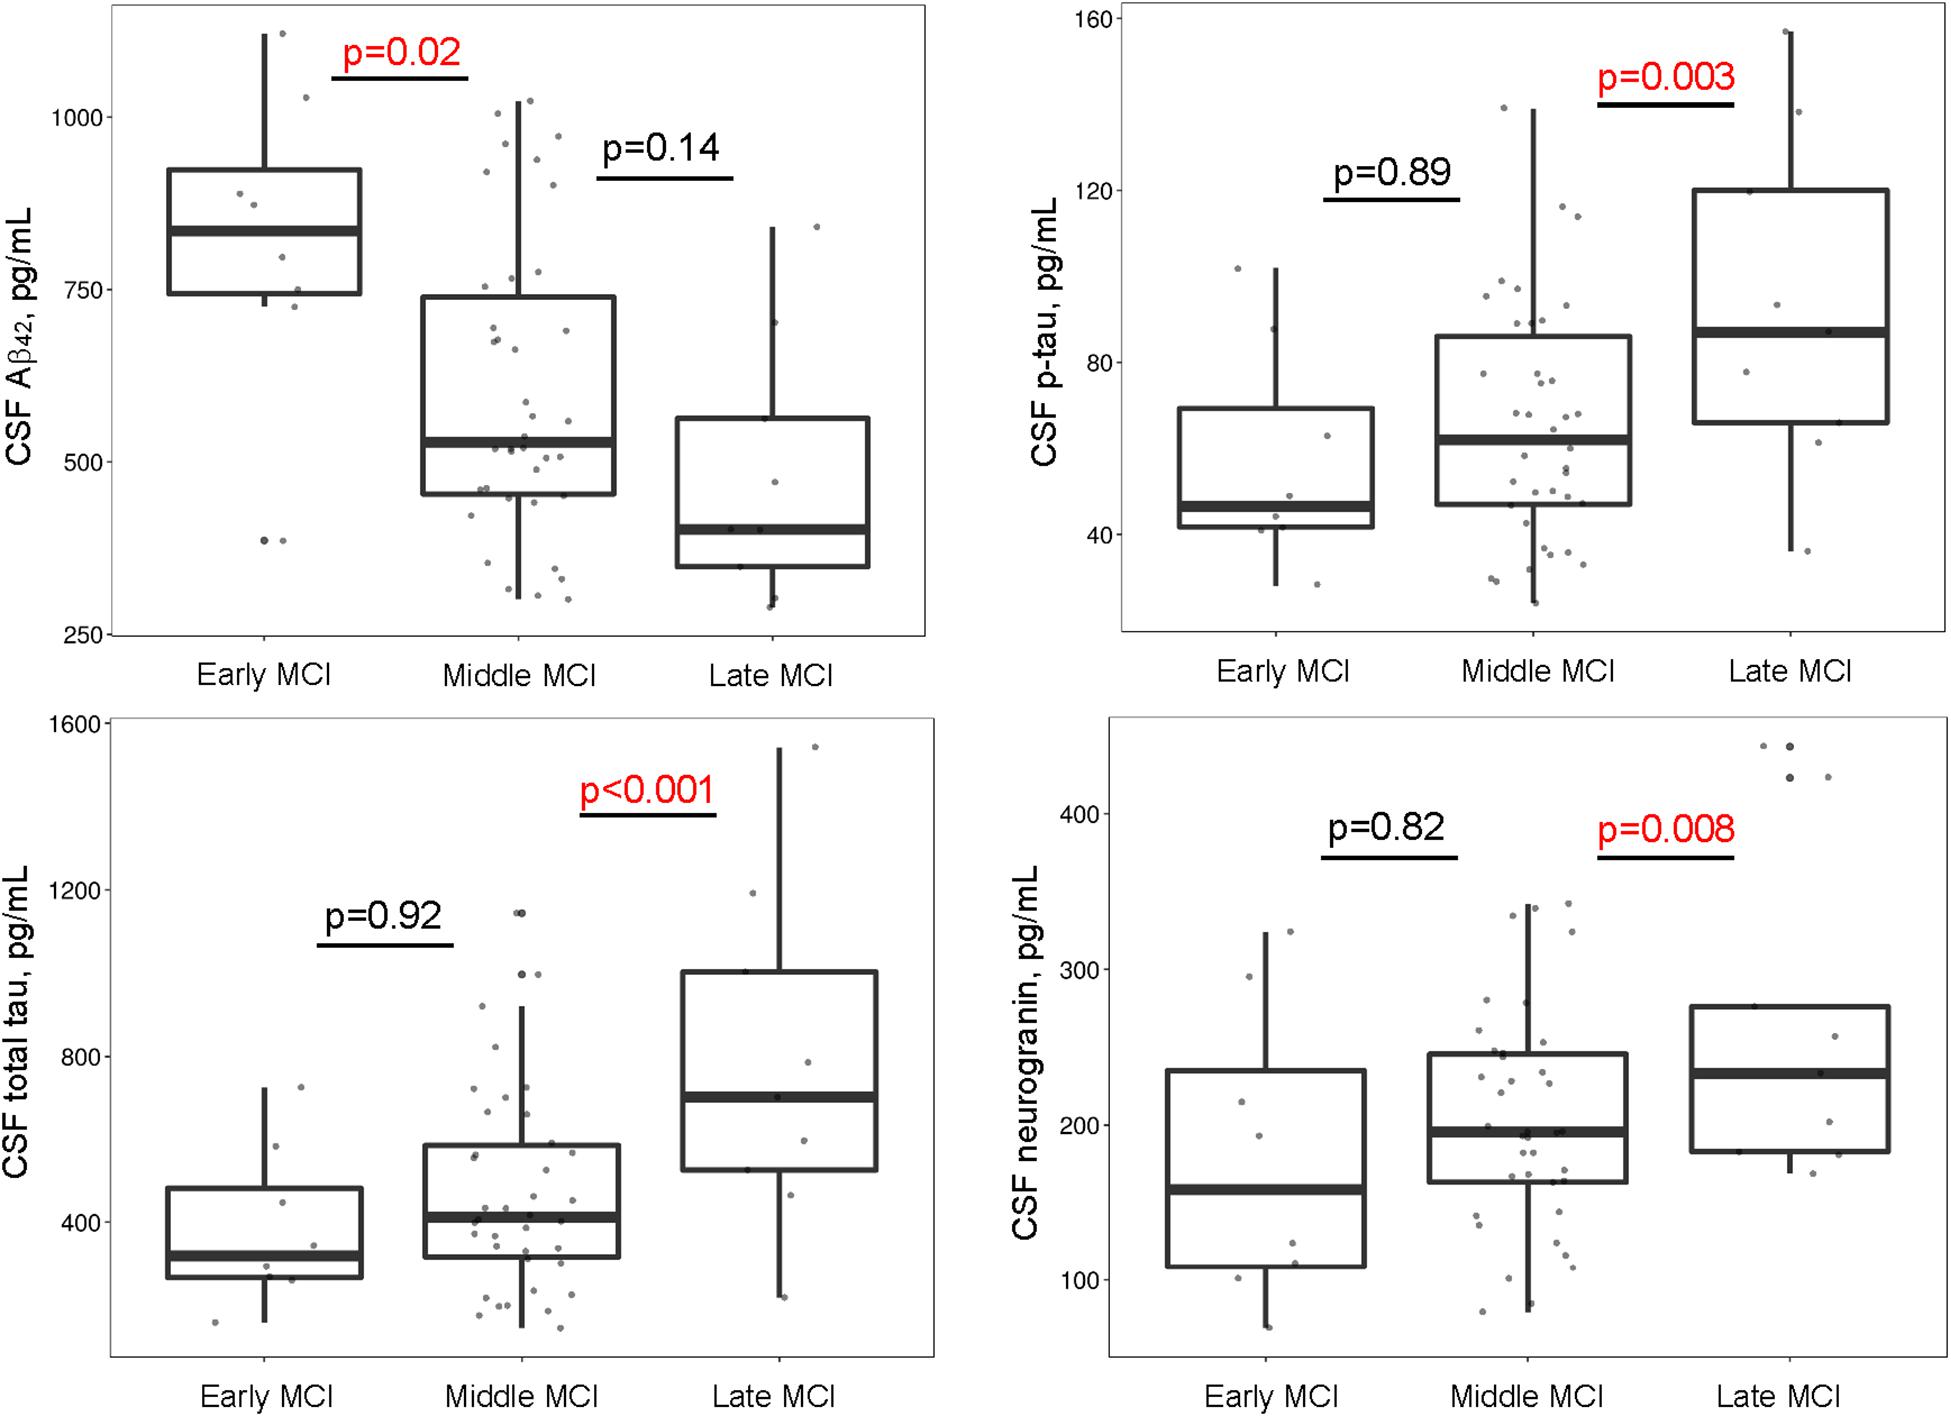
Figure 1. MCI stages differ by CSF biomarkers. Early and middle stages differ on Aβ42, such that participants with middle MCI have lower CSF Aβ42 concentrations compared to participants with early MCI. Middle and late stages differ on p-tau, total tau, and neurogranin such that participants with late MCI have greater concentrations of CSF p-tau, total tau, and neurogranin compared to participants with middle MCI. Aβ, amyloid-β; CSF, cerebrospinal fluid; MCI, mild cognitive impairment; p-tau, hyperphosphorylated tau.
Group differences emerged cross-sectionally for hippocampal volume (early > late; p = 0.05), inferior lateral ventricle volume (early < late; p = 0.05), and the AD signature (early > late; p = 0.03), with greater evidence of atrophy among more advanced stages. However, for parietal lobe volume, participants with late MCI counterintuitively had higher volumes than participants with early (p = 0.02) or middle MCI (p = 0.03). In longitudinal models, MCI stage related to rate of total gray matter (early < late; p = 0.008), parietal lobe (early = middle < late; p-values < 0.03), temporal lobe (early < late; p = 0.01), and hippocampal atrophy (early = middle < late; p-values < 0.04), and inferior lateral ventricle (temporal horn) dilation (early = middle < late; p-values < 0.002). See Figure 2 and Table 3 for details. When adjusting for APOE-ε4 status, AD signature cross-sectional differences persisted and all longitudinal models were similar (Supplementary Table 4).
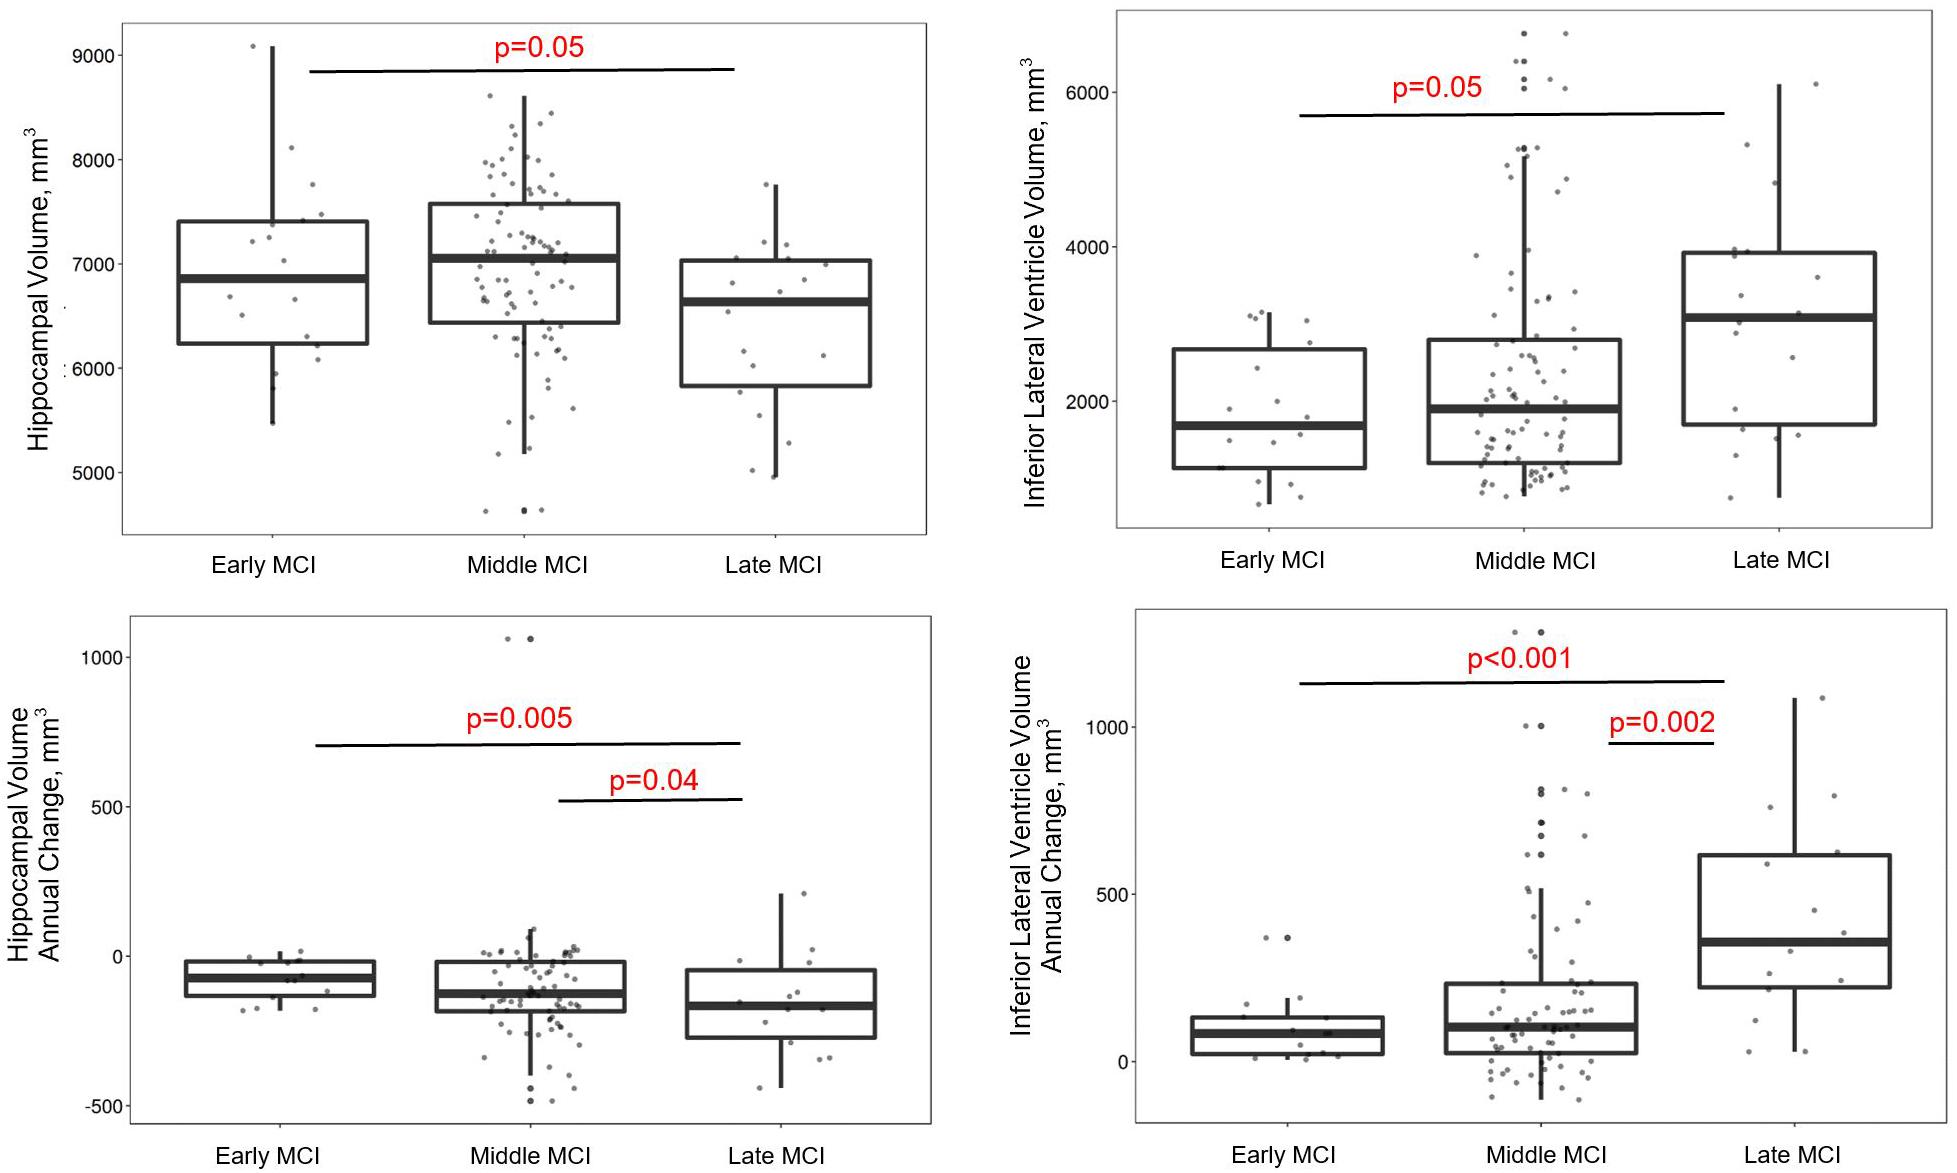
Figure 2. MCI stages differ by gray matter volume in regions susceptible to AD. Early and late stages differ on baseline hippocampal and inferior lateral ventricle volumes, such that late MCI participants have lower hippocampal and higher inferior lateral ventricle volumes than early MCI participants. Late MCI participants also have faster hippocampal atrophy and inferior lateral ventricle dilation compared early and middle MCI participants.
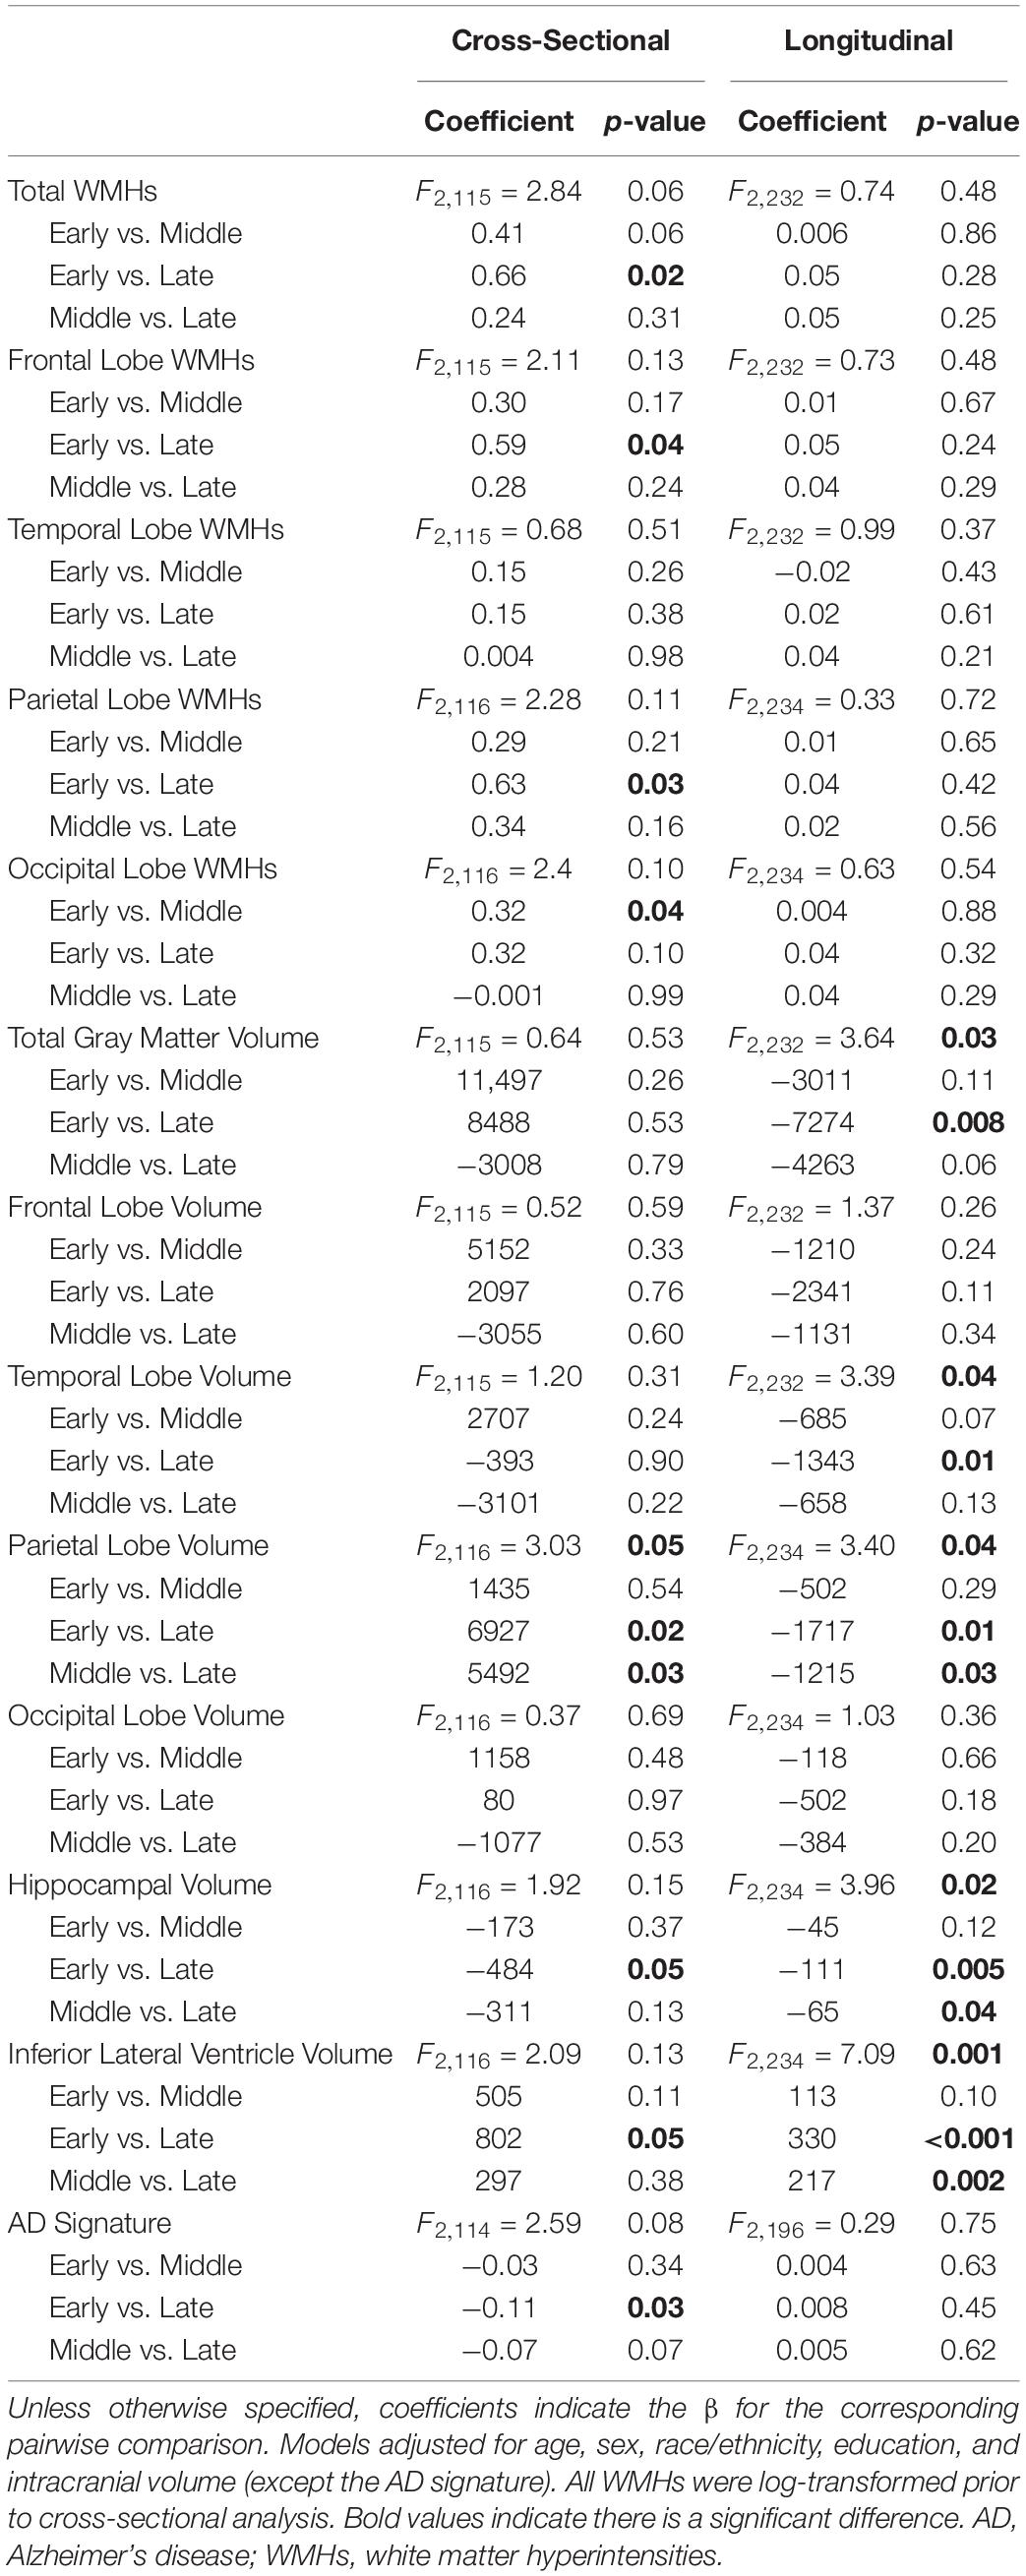
Table 3. MCI stage group differences in cross-sectional and longitudinal neuroimaging outcomes.
MCI stages cross-sectionally differed in the expected direction for total (early < late; p = 0.02), frontal lobe (early < late; p = 0.04), parietal lobe (early < late; p = 0.03), and occipital lobe WMH volume (early < middle; p = 0.04), such that more advanced stages have greater WMH volume. In longitudinal models, MCI stage was unrelated to progression of total or regional WMHs. See Table 3 for details. When adjusting for APOE-ε4 status, cross-sectional differences remained in total and occipital lobe WMHs and all longitudinal models were similar (Supplementary Table 4).
As expected, between-group comparisons yielded cross-sectional neuropsychological performance differences in all cognitive domains assessed, such that more advanced stages had worse neuropsychological performance. Specifically, differences emerged for the Boston Naming Test (early > late; p = 0.03), Animal Naming (early > middle > late; p-values < 0.004), Digit-Symbol Coding (early = middle > late; p-values < 0.02), Delis Kaplan Executive Function System (DKEFS) Number Sequencing (early < late; p = 0.01), Executive Function Composite (early > middle > late; p-values < 0.02), Hooper Visual Organization Test (early = middle > late; p-values < 0.001), and Episodic Memory Composite (early > middle > late; p-values < 0.001). See Supplementary Table 5 for details.
More importantly, between-group comparisons yielded differences in longitudinal trajectory in the expected direction, such that more advanced stages had greater neuropsychological decline for Boston Naming Test (early = middle < late; p-values < 0.008), Animal Naming (early < middle; p-value = 0.04), Digit-Symbol Coding (early < late; p-value = 0.01), DKEFS Number Sequencing (early = middle < late; p-values < 0.004), Executive Function Composite (early < late; p = 0.01), and Hooper Visual Organization Test (early = middle < late; p-values < 0.003). See Supplementary Table 5 for details. When adjusting for APOE-ε4 status, results were similar (Supplementary Table 6).
This study found clinician-derived MCI severity stages yielded differences in APOE-ε4 status, CSF biomarkers, neuroimaging outcomes, and neuropsychological trajectory. Specifically, participants with more significant MCI symptoms at study entry had an increased prevalence of the APOE-ε4 allele along with greater CSF biomarker evidence of AD pathology (Aβ42 and p-tau) and neurodegeneration (t-tau and neurogranin). Late MCI participants also had degeneration of white and gray matter specifically in regions vulnerable to AD and neurodegeneration, as well as faster hippocampal atrophy and inferior lateral ventricle dilation, both signs of AD-type neurodegeneration. Finally, participants with more significant MCI symptoms at study entry had a steeper decline in language, information processing speed, and executive function compared to early MCI participants. Together, these results suggest clinical sub-staging of MCI may provide insight into molecular and structural brain changes and offer valuable prognostic information. Furthermore, the clinician stages were comparable to statistically derived stages suggesting minimal clinician bias and consistency in establishing the categories.
The current findings contribute to an emerging literature examining the heterogeneity of pathology underlying different stages of MCI (see Figure 3 for a theoretical model incorporating the findings reported here). Middle MCI participants had greater cerebral Aβ42 burden and APOE-ε4 allele frequency compared to early MCI. However, no differences emerged for these variables when comparing middle and late MCI, indicating these pathologies may be less relevant to clinical status in later stages. Aβ42 and APOE-ε4 may exert their influence early, prior to the onset of neurodegeneration, consistent with work showing Aβ42 deposition plateaus between late MCI and AD development (Jack et al., 2013) and Aβ42 status more closely associates with cognitive decline in earlier disease states (Landau et al., 2012). It is possible Aβ42 deposition in temporal and frontal regions (Grothe et al., 2017) damages neuronal myelin sheaths (Moore et al., 2018) and disrupts functional connectivity (Yi et al., 2015), leading to cognitive decline prior to the neuroimaging gray matter alterations observed in more severe stages of impairment (Mattsson et al., 2015). Additionally, APOE-ε4 may exacerbate early Aβ42 deposition (Risacher et al., 2013) via increased aggregation (Liu et al., 2017) or decreased clearance (Castellano et al., 2011), further modifying network connectivity (Wang et al., 2017) and contributing to a phenotype of middle MCI. When accounting for APOE-ε4 status, differences between early and middle MCI stages in CSF Aβ42 concentrations were attenuated, suggesting the effect of APOE-ε4 may be through initial amyloid accumulation.
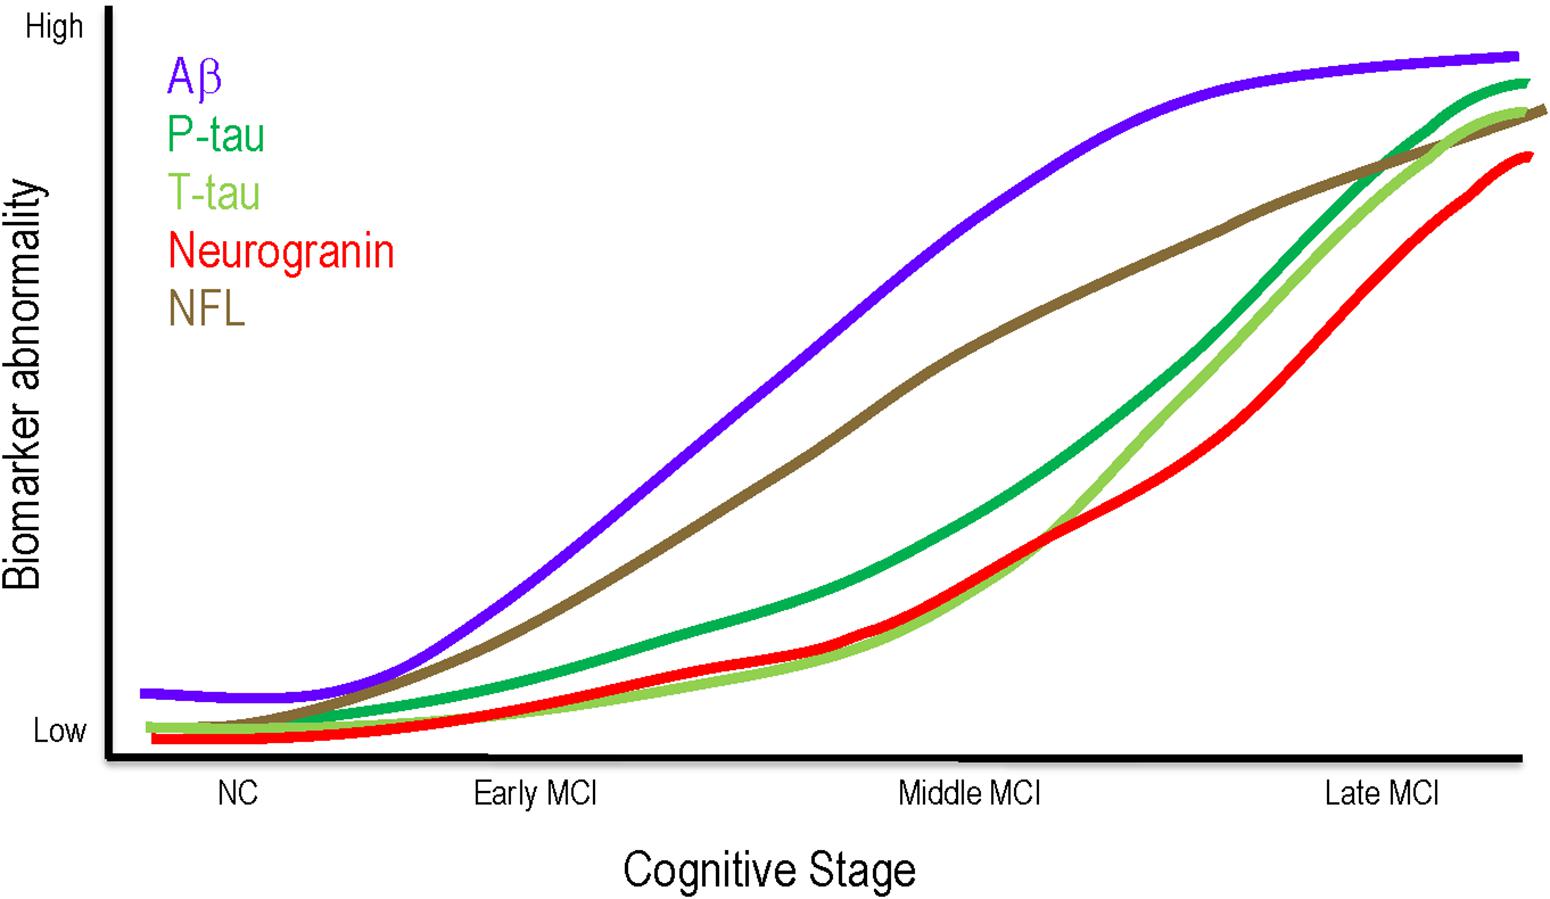
Figure 3. Theoretical model of biomarker changes throughout MCI. Aβ may be most relevant to clinical status in early and middle MCI, plateauing in later stages. Phosphorylated tau, neurodegeneration, and synaptic dysfunction may not exert clinical effects until late MCI. NFL elevations are consistent across all MCI stages. Aβ, amyloid beta; MCI, mild cognitive impairment; NC, normal cognition; NFL, neurofilament light; P-tau, phosphorylated tau; T-tau, total tau.
As clinical impairment worsens, however, other pathologies, such as phosphorylation of tau, synaptic dysfunction, and neurodegeneration may relate more closely associate with clinical stage. Our results show CSF concentrations of p-tau, neurogranin, and t-tau do not differ between early and middle MCI, but late MCI participants have greater concentrations compared to both early and middle MCI participants. Additionally, late MCI participants have greater cross-sectional and longitudinal atrophy in regions susceptible to AD neurodegeneration, including greater hippocampal atrophy, temporal lobe atrophy, and inferior lateral ventricle dilation over time. It is plausible that as Aβ42 burden increases in early and middle MCI and possibly worsens tau pathology (Jacobs et al., 2018) and related neurodegeneration, the association between MCI stage and Aβ42 burden becomes masked by the robust effects of tau and neurodegeneration on clinical impairment (Brier et al., 2016). As tau deposits in the hippocampus (Braak and Braak, 1991) and induces synaptic dysfunction (Tai et al., 2012), axonal transport deficits (Rodriguez-Martin et al., 2013) and hypometabolism (Wu et al., 2012; Portelius et al., 2015) result in cell death. Thus, greater baseline levels of pathology in late MCI may lead to increased atrophy and steeper cognitive decline over time as observed here. While the results that individuals with late MCI have more tau phosphorylation, synaptic dysfunction, neurodegeneration, and steeper cognitive decline are not surprising, they further validate clinical staging as a valuable metric to detect underlying pathological and prognostic differences.
Contrary to expectation, late MCI participants had greater parietal lobe volume than early and middle MCI participants. It is possible that this increase in volume is due to increased neuroplasticity and activation (Pariente et al., 2005) in regions not yet affected by AD pathology, in response to dysfunctional networks elsewhere (Jacobs et al., 2014). Alternatively, since late MCI participants have lower frontal lobe, temporal lobe, occipital lobe, and hippocampal volumes compared to those with middle MCI, it is possible that if these individuals also had smaller parietal lobes, they would have more severe cognitive consequences warranting a diagnosis of dementia, rather than MCI. Additional studies are needed to further explore this counterintuitive finding.
Notably, MCI stages did not differ on CSF NFL concentrations. While NFL is a marker of axonal injury, CSF NFL concentrations rise due to a variety of pathologies, including demyelination (Malmestrom et al., 2003), amyloid (Mattsson et al., 2019), and tau (Mattsson et al., 2019). Thus, different etiologies may contribute to axonal injury across the MCI spectrum, contributing to the consistent rise in CSF NFL observed here.
Collectively, findings presented here provide evidence that thorough clinical assessment and staging of patients with MCI can provide insight into underlying pathology prior to ordering more expensive and less readily available diagnostic tests and imaging. Specifically, a 3-staging system, validated by unbiased statistical classification, may be more sensitive to changes in underlying Aβ42, tau, and concomitant pathologies not detected by dichotomous approaches, allowing clinicians to better predict relevant disease processes underlying cognitive impairment. Clinical staging could lead to more directed diagnostic work-ups and treatment decisions as targeted therapies become available. Given the heterogeneity in MCI conversion to AD (Ritchie et al., 2001; Ganguli et al., 2004), accurate staging will allow clinicians to better provide prognostic information, as cognitive decline and cerebral atrophy occur more rapidly in late compared to early or middle stages of MCI. The ability to predict underlying pathology and progression based on clinical assessment alone could allow for more efficient use of time, money, and clinical resources in the evaluation and of cognitive impairment.
The current study has several strengths, including a clinically well characterized cohort of MCI participants categorized based on comprehensive neuropsychological assessment, CDR, and FAQ. Additionally, the use of a 3-stage paradigm allows for greater investigation into the heterogeneity across the spectrum of MCI, beyond binary group differences between early and late MCI. Comparison to statistically derived stages suggests minimal bias in establishing the clinician staging categories. Finally, the study employed excellent methods for quantifying CSF biomarkers of AD, neurodegeneration, and synaptic dysfunction, gray matter volumes, and WMHs. Core laboratories using quality control procedures analyzed all CSF and MRI measurements in batch, and technicians were blinded to participant clinical details. Despite these strengths, the study is limited by cross-sectional associations with CSF biomarkers and relatively small samples sizes in the early and late MCI stages. Only 44% of participants had CSF data available. While this study has a relatively short follow-up time (3.3 years on average), we would expect longitudinal effects to become more pronounced as follow-up time increases. The majority of the white and gray matter findings would not survive correction for multiple comparisons, raising the possibility of false positive findings. Additionally, the staging protocol, though comprehensive, requires extensive time and an informant is essential for the FAQ and CDR, potentially limiting application in clinical settings. Future work should include longitudinally assessing biomarkers within each MCI stage, examining differences in PET imaging across the MCI spectrum, and determining if an abbreviated version of the staging protocol offers similar value. Importantly, MCI stages differed by age, suggesting results may be partly due to age-related changes. Though models were adjusted for age, replication in larger samples are needed to better delineate age and disease related effects across the MCI spectrum. Finally, the cohort was predominantly non-Hispanic White with participants 61–92 years of age, limiting generalizability to other races, ethnicities, and age groups.
The current study demonstrates novel associations between clinician-derived MCI severity stages and APOE-ε4 status, CSF biomarkers of AD pathology and neurodegeneration, cerebral atrophy in regions vulnerable in AD, and cognitive decline. Results support an AD pathogenesis model in which APOE-ε4 and Aβ42 relate to clinical status in early stages of impairment, whereas phosphorylation of tau, synaptic dysfunction, and neurodegeneration drive more severe impairment, possibly leading to quicker clinical decline. More precise clinical staging of cognitive impairment may provide insights into underlying molecular and structural brain changes, informing diagnostic work-up, treatment, prognosis, and clinical trial recruitment and enrollment strategies.
The datasets for this manuscript are not publicly available because of participant consent restrictions. Requests to access the datasets should be directed to AJ, YW5nZWxhLmplZmZlcnNvbkB2dW1jLm9yZw==.
The studies involving human participants were reviewed and approved by Vanderbilt University Medical Center Institutional Review Board. The patients/participants provided their written informed consent to participate in this study.
EM, KG, and AJ were responsible for conceptualization of the study, acquisition of the data, analysis and interpretation of the data, and drafting the manuscript. MS, KB, HZ, and TH were responsible for analysis and interpretation of the data and drafting the manuscript. KP, LD, and BL were responsible for acquisition of the data and analysis and interpretation of the data. LA and SB were responsible for acquisition of the data. DL was responsible for analysis and interpretation of the data.
This research was supported by Alzheimer’s Association (IIRG-08-88733 [AJ]), the National Institutes of Health (R01-AG034962 [AJ], R01-AG056534 [AJ], R01-NS100980 [AJ], K24-AG046373 [AJ], Paul B. Beeson Career Development Award in Aging K23-AG030962 [AJ], Paul B. Beeson Career Development Award in Aging K23-AG045966 [KG], Paul B. Beeson Career Development Award in Aging K23-AG048347 [SB], K01-AG049164 [TH], K12-HD043483 [KG, SB, TH], F30-AG064847 [EM], T32-GM007347 [EM], UL1-TR000445, and S10-OD023680), the Vanderbilt Memory & Alzheimer’s Center, the Swedish Alzheimer Foundation (Grant Number AF-553101 [KB]), the Torsten Söderberg Foundation at the Royal Swedish Academy of Sciences (KB), the Knut and Alice Wallenberg Foundation (HZ), the Swedish Research Council (Project Numbers 14002 [KB] and 2018-02532), the European Research Council (Project Number 681712), the Swedish Brain Foundation (Project Numbers FO2015-0021 [KB] and FO2015-0050), LUA/ALF project, Västra Götalandsregionen (VGR), Sweden (Project Numbers ALFGBG-139671 [KB] and ALFGBG-720931), Stiftelsen för Gamla Tjänarinnor, Sweden (Grant Number 2015-00182 [KB]).
KB has served as a consultant or at advisory boards for Alector, Biogen, CogRx, Lilly, MagQu, Novartis, and Roche Diagnostics, and is a co-founder of Brain Biomarker Solutions in Gothenburg AB, a GU Venture-based platform company at the University of Gothenburg, all unrelated to the work presented in this paper.
The remaining authors declare that the research was conducted in the absence of any commercial or financial relationships that could be construed as a potential conflict of interest.
The authors would like to thank the dedicated Vanderbilt Memory & Aging Project participants, their loved ones, and the devoted staff and trainees who contributed to recruitment, screening, enrollment, and follow-up of this cohort. The authors would also like to thank the dedicated and skilled laboratory technicians at the Clinical Neurochemistry Laboratory at Sahlgrenska University Hospital, Sweden, who performed all the CSF analyses.
The Supplementary Material for this article can be found online at: https://www.frontiersin.org/articles/10.3389/fnagi.2020.00139/full#supplementary-material
Aisen, P. S., Petersen, R. C., Donohue, M. C., Gamst, A., Raman, R., Thomas, R. G., et al. (2010). Clinical Core of the Alzheimer’s Disease neuroimaging initiative: progress and plans. Alzheimers Dementia 6, 239–246. doi: 10.1016/j.jalz.2015.05.005
Albert, M. S., Dekosky, S. T., Dickson, D., Dubois, B., Feldman, H. H., Fox, N. C., et al. (2011). The diagnosis of mild cognitive impairment due to Alzheimer’s disease: recommendations from the national institute on aging-Alzheimer’s association workgroups on diagnostic guidelines for Alzheimer’s disease. Alzheimers Dementia 7, 270–279. doi: 10.1016/j.jalz.2011.03.008
Asman, A. J., and Landman, B. A. (2013). Non-local statistical label fusion for multi-atlas segmentation. Med. Image Anal. 17, 194–208. doi: 10.1016/j.media.2012.10.002
Bilgel, M., An, Y., Helphrey, J., Elkins, W., Gomez, G., Wong, D. F., et al. (2018). Effects of amyloid pathology and neurodegeneration on cognitive change in cognitively normal adults. Brain 141, 2475–2485. doi: 10.1093/brain/awy150
Braak, H., and Braak, E. (1991). Neuropathological stageing of Alzheimer-related changes. Acta Neuropathol. 82, 239–259. doi: 10.1007/BF00308809
Brier, M. R., Gordon, B., Friedrichsen, K., Mccarthy, J., Stern, A., Christensen, J., et al. (2016). Tau and Abeta imaging, CSF measures, and cognition in Alzheimer’s disease. Sci. Transl. Med. 8:338ra366. doi: 10.1126/scitranslmed.aaf2362
Castellano, J. M., Kim, J., Stewart, F. R., Jiang, H., Demattos, R. B., Patterson, B. W., et al. (2011). Human apoE isoforms differentially regulate brain amyloid-beta peptide clearance. Sci. Transl. Med. 3:89ra57. doi: 10.1126/scitranslmed.3002156
Edmonds, E. C., Mcdonald, C. R., Marshall, A., Thomas, K. R., Eppig, J., Weigand, A. J., et al. (2019). Early versus late MCI: Improved MCI staging using a neuropsychological approach. Alzheimers Dementia 15, 699–708. doi: 10.1016/j.jalz.2018.12.009
Fischl, B., and Dale, A. M. (2000). Measuring the thickness of the human cerebral cortex from magnetic resonance images. Proc. Natl. Acad. Sci. U.S.A. 97, 11050–11055. doi: 10.1073/pnas.200033797
Folstein, M. F., Folstein, S. E., and Mchugh, P. R. (1975). Mini-mental state. A practical method for grading the cognitive state of patients for the clinician. J. Psych. Res. 12, 189–198. doi: 10.1016/0022-3956(75)90026-6
Ganguli, M., Dodge, H. H., Shen, C., and Dekosky, S. T. (2004). Mild cognitive impairment, amnestic type: an epidemiologic study. Neurology 63, 115–121. doi: 10.1212/01.wnl.0000132523.27540.81
Grothe, M. J., Barthel, H., Sepulcre, J., Dyrba, M., Sabri, O., and Teipel, S. J. (2017). In vivo staging of regional amyloid deposition. Neurology 89, 2031–2038. doi: 10.1016/j.neurobiolaging.2020.03.011
Jack, C. R. Jr., Wiste, H. J., Lesnick, T. G., Weigand, S. D., Knopman, D. S., Vemuri, P., et al. (2013). Brain beta-amyloid load approaches a plateau. Neurology 80, 890–896. doi: 10.1212/WNL.0b013e3182840bbe
Jacobs, H. I., Clerx, L., Gronenschild, E. H., Aalten, P., and Verhey, F. R. (2014). White matter hyperintensities are positively associated with cortical thickness in Alzheimer’s disease. J. Alzheimers Dis. 39, 409–422. doi: 10.3233/JAD-131232
Jacobs, H. I. L., Hedden, T., Schultz, A. P., Sepulcre, J., Perea, R. D., Amariglio, R. E., et al. (2018). Structural tract alterations predict downstream tau accumulation in amyloid-positive older individuals. Nat. Neurosci. 21, 424–431. doi: 10.1038/s41593-018-0070-z
Jefferson, A. L., Gifford, K. A., Acosta, L. M., Bell, S. P., Donahue, M. J., Taylor Davis, L., et al. (2016). The vanderbilt memory & aging project: study design and baseline cohort overview. J. Alzheimers Dis. 52, 539–559.
Kern, S., Syrjanen, J. A., Blennow, K., Zetterberg, H., Skoog, I., Waern, M., et al. (2018). Association of cerebrospinal fluid neurofilament light protein with risk of mild cognitive impairment among individuals without cognitive impairment. JAMA Neurol. 76, 187–193. doi: 10.1001/jamaneurol.2018.3459
Kester, M. I., Teunissen, C. E., Crimmins, D. L., Herries, E. M., Ladenson, J. H., Scheltens, P., et al. (2015). Neurogranin as a cerebrospinal fluid biomarker for synaptic loss in symptomatic Alzheimer disease. JAMA Neurol. 72, 1275–1280. doi: 10.1001/jamaneurol.2015.1867
Kresge, H. A., Khan, O. A., Wegener, M. A., Liu, D., Terry, J. G., Nair, S., et al. (2018). Subclinical compromise in cardiac strain relates to lower cognitive performances in older adults. J. Am. Heart Assoc. 7:e007562. doi: 10.1161/JAHA.117.007562
Kvartsberg, H., Duits, F. H., Ingelsson, M., Andreasen, N., Ohrfelt, A., Andersson, K., et al. (2015). Cerebrospinal fluid levels of the synaptic protein neurogranin correlates with cognitive decline in prodromal Alzheimer’s disease. Alzheimers Dementia 11, 1180–1190. doi: 10.1016/j.jalz.2014.10.009
Landau, S. M., Mintun, M. A., Joshi, A. D., Koeppe, R. A., Petersen, R. C., Aisen, P. S., et al. (2012). Amyloid deposition, hypometabolism, and longitudinal cognitive decline. Ann. Neurol. 72, 578–586. doi: 10.1002/ana.23650
Landis, J. R., and Koch, G. G. (1977). The measurement of observer agreement for categorical data. Biometrics 33, 159–174.
Lee, S. H., Seo, J., Lee, J. M., and Park, H. (2014). Differences in early and late mild cognitive impairment tractography using a diffusion tensor MRI. Neuroreport 25, 1393–1398. doi: 10.1097/WNR.0000000000000279
Liu, C. C., Zhao, N., Fu, Y., Wang, N., Linares, C., Tsai, C. W., et al. (2017). ApoE4 accelerates early seeding of amyloid pathology. Neuron 96, 1024–1032. doi: 10.1016/j.neuron.2017.11.013
Malmestrom, C., Haghighi, S., Rosengren, L., Andersen, O., and Lycke, J. (2003). Neurofilament light protein and glial fibrillary acidic protein as biological markers in MS. Neurology 61, 1720–1725. doi: 10.1212/wnl.63.3.599
Mattsson, N., Cullen, N. C., Andreasson, U., Zetterberg, H., and Blennow, K. (2019). Association between longitudinal plasma neurofilament light and neurodegeneration in patients with Alzheimer disease. JAMA Neurol. 76, 791–799. doi: 10.1001/jamaneurol.2019.0765
Mattsson, N., Insel, P. S., Aisen, P. S., Jagust, W., Mackin, S., and Weiner, M. (2015). Brain structure and function as mediators of the effects of amyloid on memory. Neurology 84, 1136–1144. doi: 10.1212/WNL.0000000000001375
Mattsson, N., Scholl, M., Strandberg, O., Smith, R., Palmqvist, S., Insel, P. S., et al. (2017). (18)F-AV-1451 and CSF T-tau and P-tau as biomarkers in Alzheimer’s disease. EMBO Mol. Med. 9, 1212–1223. doi: 10.15252/emmm.201707809
Moore, E. E., Hohman, T. J., Badami, F. S., Pechman, K. R., Osborn, K. E., Acosta, L. M. Y., et al. (2018). Neurofilament relates to white matter microstructure in older adults. Neurobiol. Aging 70, 233–241. doi: 10.1016/j.neurobiolaging.2018.06.023
Morris, J. C. (1993). The clinical dementia rating (CDR): current version and scoring rules. Neurology 43, 2412–2414. doi: 10.1212/wnl.43.11.2412-a
Osborn, K. E., Liu, D., Samuels, L. R., Moore, E. E., Cambronero, F. E., Acosta, L. M. Y., et al. (2018). Cerebrospinal fluid beta-amyloid42 and neurofilament light relate to white matter hyperintensities. Neurobiol. Aging 68, 18–25. doi: 10.1016/j.neurobiolaging.2018.03.028
Palmqvist, S., Zetterberg, H., Blennow, K., Vestberg, S., Andreasson, U., Brooks, D. J., et al. (2014). Accuracy of brain amyloid detection in clinical practice using cerebrospinal fluid beta-amyloid 42: A cross-validation study against amyloid positron emission tomography. JAMA Neurol. 71, 1282–1289. doi: 10.1001/jamaneurol.2014.1358
Pariente, J., Cole, S., Henson, R., Clare, L., Kennedy, A., Rossor, M., et al. (2005). Alzheimer’s patients engage an alternative network during a memory task. Ann. Neurol. 58, 870–879. doi: 10.1002/ana.20653
Pfeffer, R. I., Kurosaki, T. T., Harrah, C. H. Jr., Chance, J. M., and Filos, S. (1982). Measurement of functional activities in older adults in the community. J. Gerontol. 37, 323–329. doi: 10.1093/geronj/37.3.323
Portelius, E., Zetterberg, H., Skillback, T., Tornqvist, U., Andreasson, U., Trojanowski, J. Q., et al. (2015). Cerebrospinal fluid neurogranin: relation to cognition and neurodegeneration in Alzheimer’s disease. Brain 138, 3373–3385. doi: 10.1093/brain/awv267
Risacher, S. L., Kim, S., Shen, L., Nho, K., Foroud, T., Green, R. C., et al. (2013). The role of apolipoprotein E (APOE) genotype in early mild cognitive impairment (E-MCI). Front. Aging Neurosci. 5:11. doi: 10.3389/fnagi.2013.00011
Ritchie, K., Artero, S., and Touchon, J. (2001). Classification criteria for mild cognitive impairment: a population-based validation study. Neurology 56, 37–42. doi: 10.1212/wnl.56.1.37
Rodriguez-Martin, T., Cuchillo-Ibanez, I., Noble, W., Nyenya, F., Anderton, B. H., and Hanger, D. P. (2013). Tau phosphorylation affects its axonal transport and degradation. Neurobiol. Aging 34, 2146–2157. doi: 10.1016/j.neurobiolaging.2013.03.015
Schmidt, P., Gaser, C., Arsic, M., Buck, D., Forschler, A., Berthele, A., et al. (2012). An automated tool for detection of FLAIR-hyperintense white-matter lesions in multiple sclerosis. Neuroimage 59, 3774–3783. doi: 10.1016/j.neuroimage.2011.11.032
Schwarz, C. G., Gunter, J. L., Wiste, H. J., Przybelski, S. A., Weigand, S. D., Ward, C. P., et al. (2016). A large-scale comparison of cortical thickness and volume methods for measuring Alzheimer’s disease severity. Neuroimage Clin. 11, 802–812. doi: 10.1016/j.nicl.2016.05.017
Tai, H. C., Serrano-Pozo, A., Hashimoto, T., Frosch, M. P., Spires-Jones, T. L., and Hyman, B. T. (2012). The synaptic accumulation of hyperphosphorylated tau oligomers in Alzheimer disease is associated with dysfunction of the ubiquitin-proteasome system. Am. J. Pathol. 181, 1426–1435. doi: 10.1016/j.ajpath.2012.06.033
Thorsell, A., Bjerke, M., Gobom, J., Brunhage, E., Vanmechelen, E., Andreasen, N., et al. (2010). Neurogranin in cerebrospinal fluid as a marker of synaptic degeneration in Alzheimer’s disease. Brain Res. 1362, 13–22. doi: 10.1016/j.brainres.2010.09.073
Toro, R., Chupin, M., Garnero, L., Leonard, G., Perron, M., Pike, B., et al. (2009). Brain volumes and Val66Met polymorphism of the BDNF gene: local or global effects? Brain Struct. Funct. 213, 501–509. doi: 10.1007/s00429-009-0203-y
Vemuri, P., Wiste, H. J., Weigand, S. D., Knopman, D. S., Shaw, L. M., Trojanowski, J. Q., et al. (2010). Effect of apolipoprotein E on biomarkers of amyloid load and neuronal pathology in Alzheimer disease. Ann. Neurol. 67, 308–316. doi: 10.1002/ana.21953
Wang, Z., Dai, Z., Shu, H., Liao, X., Yue, C., Liu, D., et al. (2017). APOE genotype effects on intrinsic brain network connectivity in patients with amnestic mild cognitive impairment. Sci. Rep. 7:397. doi: 10.1038/s41598-017-00432-0
Wu, L., Rowley, J., Mohades, S., Leuzy, A., Dauar, M. T., Shin, M., et al. (2012). Dissociation between brain amyloid deposition and metabolism in early mild cognitive impairment. PLoS One 7:e47905. doi: 10.1371/journal.pone.0047905
Ye, B. S., Seo, S. W., Yang, J. J., Kim, H. J., Kim, Y. J., Yoon, C. W., et al. (2014). Comparison of cortical thickness in patients with early-stage versus late-stage amnestic mild cognitive impairment. Eur. J. Neurol. 21, 86–92. doi: 10.1111/ene.12251
Yi, D., Choe, Y. M., Byun, M. S., Sohn, B. K., Seo, E. H., Han, J., et al. (2015). Differences in functional brain connectivity alterations associated with cerebral amyloid deposition in amnestic mild cognitive impairment. Front. Aging Neurosci. 7:15. doi: 10.3389/fnagi.2015.00015
Keywords: mild cognitive impairment, clinical staging, cerebrospinal fluid, apolipoprotein E, brain MRI
Citation: Moore EE, Liu D, Pechman KR, Acosta LMY, Bell SP, Davis LT, Blennow K, Zetterberg H, Landman BA, Schrag MS, Hohman TJ, Gifford KA and Jefferson AL (2020) Mild Cognitive Impairment Staging Yields Genetic Susceptibility, Biomarker, and Neuroimaging Differences. Front. Aging Neurosci. 12:139. doi: 10.3389/fnagi.2020.00139
Received: 25 October 2019; Accepted: 27 April 2020;
Published: 05 June 2020.
Edited by:
Changiz Geula, Northwestern University, United StatesReviewed by:
Stephen D. Ginsberg, Nathan Kline Institute for Psychiatric Research, United StatesCopyright © 2020 Moore, Liu, Pechman, Acosta, Bell, Davis, Blennow, Zetterberg, Landman, Schrag, Hohman, Gifford and Jefferson. This is an open-access article distributed under the terms of the Creative Commons Attribution License (CC BY). The use, distribution or reproduction in other forums is permitted, provided the original author(s) and the copyright owner(s) are credited and that the original publication in this journal is cited, in accordance with accepted academic practice. No use, distribution or reproduction is permitted which does not comply with these terms.
*Correspondence: Angela L. Jefferson, YW5nZWxhLmplZmZlcnNvbkB2dW1jLm9yZw==
Disclaimer: All claims expressed in this article are solely those of the authors and do not necessarily represent those of their affiliated organizations, or those of the publisher, the editors and the reviewers. Any product that may be evaluated in this article or claim that may be made by its manufacturer is not guaranteed or endorsed by the publisher.
Research integrity at Frontiers
Learn more about the work of our research integrity team to safeguard the quality of each article we publish.