- School of Engineering, RMIT University, Bundoora, VIC, Australia
Critical manufacturing systems consist of many different components working together. Each component is important to the operation and performance of the whole system. It is crucial to have a sound maintenance plan to ensure continuous production output. The strategy of current research is to focus on the failure mode modelling of the manufacturing system and divide it according to failure mode in production blocks. The preventive replacement intervals are determined using mean time to failure values of components, with group replacements of components within the production blocks to prevent unexpected functional breakdown failures. With the implementation of Industry 4.0 infrastructure, the mean time to failure values of components are constantly updated. The multi-mode mathematical model developed in this paper is able to adjust the preventive replacement schedule dynamically to suit changing system conditions. The results indicate that preventive replacement of components can achieve consistent minimum system reliability of 90% while minimizing system costs due to maintenance and downtime. Novelty of the approach lies in developing a holistic preventive maintenance schedule using failure mode and effects analysis for a complete system. The approach not only improves maintainability and reliability, lowers the cost of maintenance, but also keeps continuity of production.
1 Introduction
Complex engineering systems consist of many different components working together. Each of the components is important to the operation and performance of the whole system. Examples of complex engineering systems include aircraft, power generation plants, medical equipment and production lines. When one of the components in a complex system is removed from service due to maintenance, it may cause the failure of operation of the whole or part of the system. As a result, operators of complex systems try to adopt a minimum risk approach to system reliability at all stages of the system’s lifecycle (Khalaf et al., 2013).
Scheduled maintenance that is carried out on time, periodically, and with a schedule when the system is functioning is referred to as preventive maintenance (PM). Failure of a component in a complex system is costly due to losses in system downtime and the cost of component replacement and urgent repair. Such costs can have a huge impact on the business, thus the need to change the maintenance approach to PM. A good preventive maintenance scheme can help in cutting down the costs incurred in the repair and replacement of components and improving service life of complex systems (Kobbacy & Murthy, 2008).
PM has attracted many researchers who employ a series of approaches to find an optimum PM schedule. However, many results were far from ideal (Cullum et al., 2018). Several factors determine the design of maintenance schedule, including the maintenance manager’s decision, recommendations from manufacturers, and long-term experience (Khalaf et al., 2015). Expected life of components changes due to system aging, wear and tear (Soh et al., 2012). Conceptually, it is necessary to maintain, at all times, accurate system condition information to determine the best component replacement time.
This paper explores the use of failure modes to design PM schedule as a maintenance service strategy for complex engineering systems. A system can be modelled as components, subsystems and parts such that failure on different parts of the system can be determined from expected life of components. Not all failures will cause stoppage of production. By analyzing failure modes that only cause partial system failures, production can be sustained during PM. This holistic approach can be applied to any form of complex systems and at every step of the process, starting from conceptualization to technological upgrades. In the latest Industry 4.0 environment, acquisition of maintenance related data in the sensor-rich system can significantly enhance accuracy of expected life information. Using the failure mode model and corresponding data on component reliability, the PM regime so developed can not only improve system reliability as well as minimise cost of replacement and repairs, but also keeps continuity of system outputs.
This paper is organized as follows. Section 2 provides a focused review of literature relevant to this research. Section 3 is devoted to the description of system reliability. Section 4 focuses on the development of the proposed Preventive Maintenance Scheduling Optimization. To illustrate the proposed FMEA block replacement strategy, a case study is introduced in Section 5. The Propagation of Failure of the production system is investigated in Section 6. Section 7 illustrates the implementation of the proposed approach. In addition to results are discussed. Finally, the last section discusses the conclusions derived from this study.
2 Literature Review
The primary objective for preventive maintenance is to maintain continuity of production outputs. To examine what methodologies can be used in maintenance scheduling and how they are used, this literature review will focus on two areas: (a) preventive maintenance driven by policies, (b) preventive maintenance with focus on ways to fail.
2.1 Preventive Maintenance Policies
Optimization of maintenance can be defined as a method of determining a maintenance plan that is highly effective and efficient, creates a balance between direct maintenance costs and the consequences of missed maintenance activities (Shafiee and Sørensen, 2019). Many researches on preventive maintenance scheduling aimed for minimising the overall costs of the system. According to Pham and Wang (1996), for complex systems such as submarines, aircraft, aerospace systems and manufacturing systems, failure during operation could be costly and disastrous. In the complex systems, Kamel et al. (2020) recommended that a preventive maintenance model be appropriate for improving the effective age and optimizing machines’ cost.
In multi-component maintenance models, optimum maintenance policies are proposed for sets of interdependent components (Gustavsson et al., 2014). Continuous operating systems like production lines are characterized by economic dependence (Das et al., 2007). In economic dependence, the cost of a single shutdown for the multi-component system is often much higher than the cost of replacing the components. Thus, by implementing appropriate maintenance policies, significant savings can be achieved. Proper maintenance scheduling reduces the maintenance cost. However, not all component failures lead to complete system stoppage. The system may still operate in a reduced capacity in some failure situations (Wang, 2011). Hence, scheduled preventive maintenance should plan according to the operation and requirements of systems under failure mode risks.
2.1.1 Scheduling for Continuity
Multiple studies have been conducted to review the various policies of maintaining multi component systems. However, the studies showed that maintenance is usually performed when production is stopped since it is difficult to stop the system when it is in operation. For example, as part of the continuous operation model, Adhikary et al. (2016) presented a method for optimizing maintenance scheduling. It can be applied to a single component in their study with satisfactory results. However, plant shutdown is required for all replacement activities for continuous operating series systems. Moreover, Adhikary et al. (2013) proposed a schedule for preventive maintenance of coal-fired plants. In continuous power generation system, no serial subsystem can be off working at any given time, so a preventative maintenance procedure should be carried out during a corrective maintenance of a failed serial subsystem within the maintenance class. In multi-component systems, Liu et al. (2017) developed a policy for inspection and replacement. To minimize long-run costs, the study aimed to determine the inspection intervals for each component. A component inspection, however, requires that the entire system is shut down. Another study to minimize overall costs, Dahia et al. (2018) designed a preventive maintenance policy to optimize system availability and reduce failure frequencies. This approach determined the number of maintenance reviews and the intervals between reviews of individual components. The authors of this study considered multi-component systems in series, however, in this case, any subsystem that stops causes the entire system to shut down, resulting in massive production losses. By using the analysis of condition monitoring data, Xiao et al. (2020) developed a framework for prognostics and replacement that was used to optimize the replacement decision for a small multi-component system. The system consists of independent and identical critical components. In this system, components cannot be repaired and replacement has to be done as necessary. However, replacement can cause the whole system to be unavailable. For a simple series production line, Wang et al. (2020) proposed two preventive maintenance strategies. According to the first, the machine should be operated at a cost rate under long-term conditions. Another approach based on the production line’s maintenance strategy for single-piece machines. The case study, however, only selected two pieces of processing equipment, and if any of single device fails, the entire system will fail.
For multi-asset system, Petchrompo et al. (2020) developed an approach to model inter-asset performance dependence to solve the problem of maintaining a multi-asset K-out-of-N system. They took into account the possibility of losing production in a partially working system. A prior preference articulation mode was used in their study. Although this study focused on multi asset system rather than multi component system however did not focus on detail consideration of failure mode of each components in the assets. In a multi-component system for example series and parallel, a clear configuration relationship exists among its components. Therefore, each component has a distinct impact on the output of the system. Thus, intervention strategies for maintaining systems with multiple assets are unsuitable for systems with multiple components (Petchrompo and Parlikad, 2019).
2.1.2 Scheduling for Group Maintenance
The group or block replacement models, as well as the opportunistic maintenance models, are standard planning methodologies for multi-component production systems. An opportunity for maintenance is created when components are maintained based on an existing maintenance opportunity for example unexpected system breakdown. For example, Laggoune et al. (2009) addressed multiple components with high production losses and economic dependence through preventive, corrective, and opportunistic maintenance. In the authors’ study, however, the failure of one component will lead to the overall failure of a system comprised of components connected in series. For multiple component redundant systems, Vu et al. (2020) developed an opportunity maintenance approach. It can be used in the maintenance decision-making process to take into consideration a variety of different types of maintenance opportunities. The uses and benefits of the proposed models were illustrated using only six components. However, the authors considered that the system is shut down when a critical component needs to be maintained. Using opportunistic predictive maintenance, Dinh et al. (2022) proposed a multi-level approach for multi-component systems considering structural and economic dependencies. A component failure or preventive maintenance action can cause the system to shut down, as all of the components are connected in hierarchical series.
Group of components is replaced at regular intervals under the block maintenance plan. Time and cost factors are used to determine the interval (Tam et al., 2006). The total cost of all of the maintenance tasks that must be completed at the same time is less than the total of all of the individual tasks that must be completed separately (Huang & Okogbaa, 1996). By taking economic dependencies between multi-component systems into account in order to minimize the expected maintenance cost, Do Van et al. (2013) developed a dynamic grouping maintenance strategy. With a simple example of a five-component system in which each component is to be replaced after a fixed interval, the proposed approaches can be applied to preventive maintenance optimization. The system will, however, be completely shut down during preventive or corrective maintenance activities. For a multi-machine system with multiple components, Mishra et al. (2021) developed a method for integrating production scheduling and group maintenance planning. In this approach to preventive maintenance, the goal is to identify the number of components that can be maintained simultaneously, reducing the total expected maintenance cost. However, since the machine’s components are arranged in a series, a system may stop during scheduled preventive maintenance.
2.1.3 Observation of Preventive Maintenance Scheduling Approaches
Different scheduling approaches have been reported in the literature. These approaches were applied with specific system performance targets. Most approaches were stochastic in nature and did not take into consideration the underlying causes when the system failed. The effect of failures, e.g. severity of the machine faults was regarded as trivial and could be resolved with “normal” maintenance schemes. This assumption was not always applicable when sophisticated engineering systems are involved.
2.2 Failure Analysis
Failure mode and effects analysis (FMEA) is an important method to understand the processes of system failure in detail and identify where and how a system might fail. Emphasising on failure prevention may help minimize the risk of harm to system components as well as the staff working with the system. In addition, possible failure processes and preventively correcting the failure processes rather than wait and react after occurrence of adverse failure events could be evaluated. The method of FMEA has been used in many researches in conjunction with other aspects of sustaining system continuity and operations. This section examines some of the key research topics related to FMEA.
2.2.1 FMEA in Maintenance
Literature review shows that there exists a limited quantity of studies that utilizes the method relating to preventive maintenance. According to Rungsa and Tangjitsitcharoen (2014), FMEA was utilized in the design of a computerized preventive maintenance management system for CNC machines. The availability, quality, and performance rates all rose dramatically after improvement and adoption, leading to a rise in overall equipment effectiveness (OEE). Vilarinho et al. (2017) examined failure mode and effects analysis of a manufacturing plant and developed a heuristic procedure to adjust the actions to be taken in a Computerised Maintenance Management System (CMMS). The study showed that high frequency PM interventions can increase maintenance costs and unnecessary waste of resources. However, one component of production equipment was only considered for replacement. Another approach focusing on failure mode-based preventive maintenance scheduling was proposed by Duan et al. (2018) for a complicated mechanical device. The intention related to the reduction and prevention of the impending failures via optimal preventive scheduling. In their case, the complex mechanical devices are composed of several functional subsystems, each of which contains a number of components. However, system function will be lost if a functional failure mode occurs. Cicek et al. (2010) suggested a risk-assessment technique based on a reliability model for fuel oil system, applying FMEA for preventive maintenance planning evaluation. Yeh and Sun (2011) suggested a method for predicting preventative maintenance time-points using FMEA.
Moreover, using the FMEA method, Puthillath and Sasikumar (2012) focused on selecting appropriate maintenance strategies that assist to decrease downtime and improve performance. In another study by Guo et al. (2016) enhanced the optimization of the preventive maintenance interval through the minimization of the expected long-term cost of operation on the basis of fault MTTF data of aircraft indicators. The major failure modes of two applications of the indicator from two suppliers were identified by the use of the information from the FMEA reports. Based on the FMEA failure analysis method, Piechowski et al. (2018) concentrated on reinforcing the planning and scheduling processes of proactive and preventing activities while employing the FMEA technique to analyse failure. Failure is examined from different viewpoints, considering the impact on production, the effect on operators, and threats to the environment and process safety.
Other recent studies have considered the FMEA method to identify failure types and recommending preventative maintenance of some components of the machine in order to ensure components can operate properly and minimize impact (Islam et al., 2020). Rahmania et al. (2020) performed the failure mode effect analysis (FMEA) approach to reduce potential failure. Resources can then be directed to preventative maintenance of components with more critical multiple failures. The classification technique of the primary centrifugal pump sub-components within RSG-GAS reactor was given by Sudadiyo et al. (2020) utilizing FMEA to allocate the maintenance level criterion. An analysis of failure-mode effects based on real-world operational data is proposed by Palei et al. (2020) as a preventive maintenance strategy. In their study, a cluster of some critical failure components was replaced by reliability centered maintenance at the earliest mean time to failure in their study. Ramere and Laseinde (2021) discussed a method used in the automobile manufacturing industry to prevent unplanned downtime incidents. They used FMEA to predict conditions of each components in the assembly line thereby formulating maintenance schedules that reduced unexpected downtime. When the equipment component or part fails, the equipment stops working. Using a FMEA analysis, Paprocka (2019), developed a tool for maintenance planning and production scheduling. The job shop scheduling problem is addressed using the proposed approach in order to evaluate the accuracy of the prediction methods. According to the study, the model involved only one machine with matching components. This model, however, has a drawback in that a maintenance of one component could lead to the failure of the entire machine and, therefore, stop the production process.
2.2.2 The Role of FMEA in Maintenance
Failure mode and effects analysis (FMEA) is a procedure found to be useful for analysing of potential failures of each components and system reliability. It is generally used during the design phase to analyses possible product failures (Mo & Chan, 2017). The FMEA aims, within a particular period of time, to analyse potential failures, that is, how the system of multi-components might fail and what happens to them when there is a failure in specific a system in order to take actions steps that can eliminate the risks of failures.
The literature review indicates that many researches worked on the preventive maintenance scheduling area for some components, but there is a gap to design PM schedule based on the utilization of the FMEA method, with detail consideration of modes of failure to decide PM activities for all system components as a “complete system”. A whole system is optimised by dividing its components based on different failure modes into FMEA Blocks, and then optimise each FMEA block separately based on preventive replacement interval. Besides, the above researches aimed at minimisation of system costs but failed to consider level of impact of failures to the operations and performance of some partially working systems. Consideration of how the system fails is necessary for complex systems to keep continuity of production outputs during performing maintenance. None of these has been adopted in the previous works.
3 System Reliability in Block
Through the running of the system, reliability can clearly and efficiently reflect the system’s state, moving from one to zero. In this study, complex system reliability is evaluated based on its reliability diagram. The diagram of reliability is drawn as a series of parallel or series-configured blocks. This diagram is necessary to determine the impact of the failure on the system, i.e., can it still operate partially.
Many failure distributions may be used to model the component failure distribution, faults, and the lifecycle stages of components. The exponential survival function MTTF is a useful approach when a system is in a running situation. In this research, the entire system components have distributions of exponential failure under the assumption of changing failure rate at all times. Because of the approach’s tractability, it is common to analyse system reliability using the exponential distribution to model failure. Another good argument in support of the exponential method is the viewpoints of the users (Das, 2008). The exponential model is simple to estimate and apply, and it has been shown in the literature to provide strong approximations to system failure distributions (Diallo et al., 2001; Savsar, 2000; Yazhau et al., 1995). The exponential survival function MTTF is a useful approach when a system is in a running situation.
In reliability analysis, the failure rate is estimated, which can then be used to compute the Mean Time to Failure (MTTF) of each component in the system for clarity in the production system’s reliability calculation.
The function F(t) represents the probability distribution function of a component to fail within a time interval {0, t} (Rausand & Høyland, 2004).
That is,
where T is a stochastic variable that represents the time of component failure.
The instantaneous probability of failure after a time t is given by the failure rate function h(t) and defined as follows:
where
When discussing reliability, another essential aspect of a failure probability distribution is the Mean Time to Failure MTTF. This is the time expected to fail. The relationship between reliability and MTTF is defined by:
Therefore, for constant failure rate the reliability of the system is calculated for each component as:
and,
4 Preventive Maintenance Scheduling Optimization
In this research, a production system consists of an n number of multiple nonidentical components, and the system will not fail completely if one or more of the components fails. First, knowing the updated MTTF information, the maintenance for a critical component based on shortest
4.1 General Assumptions
Due to system components’ complexities and presence of many variables, it is necessary to simplify the system.
Assumptions:
• First replacement maintenance time
• Failure or maintenance of one block does not stop the entire production system.
• The production system components are assumed to follow an exponential distribution and continuously work for a sufficiently long time until the time of replacement is reached.
• We assumed that all components have spare parts available.
• Replacing a component at optimal time incurs the cost of planned maintenance.
• The time measured is in hours, and all preventive replacement are performed simultaneously.
• At the initial time (t = 0), any component is new.
• The action for preventive maintenance is considered to be immediate.
4.2 Total Maintenance Cost
This section develops a multi-mode mathematical model in the form of matrices for the cost of maintaining a production system using a group preventive maintenance schedule. The expected maintenance cost per unit of time has been widely detailed in literature (Jardine and Tsang, 2013). The primary purpose for PM scheduling is to minimize overall cost of maintenance in comparison to no PM scheduling, i.e. breakdown maintenance. Maintenance cost has many categories, all of which contribute to the total maintenance cost. The following sub-sections provide detail account of the constituent costs.
4.2.1 Breakdown Cost
After a component or system fails, a breakdown maintenance is commonly referred to as a repair. By making repairs or replacing the failing component, it attempts to return the component to working conditions as quick as possible. The maintenance cost is raised if the system components in use at period t are about to reach the end of their life. The expected number of failures for component within the period length t at the assumption of exponential distribution, can be given by diagonal matrix where,
Availability of spare parts is a vital aspect of maintenance. Any delay in supplying spare parts leads to a delay in production. The availability of spare parts and an awareness of the cost of purchase for each component can assist in deciding on maintenance of the other components. We assumed in this maintenance model that spare parts are always ready. Spare parts have various costs and that there is no additional cost for storing and moving, therefore, we can defined the spare parts variable
Labour cost
The cost of breakdown maintenance is influenced by downtime. Downtime is considered unplanned, which implies that when one component fails, production loss cost PLs
Due to dependencies between system components, they may have been impacted by the shutdown in some cases. In a series system, every component failure leads in the failure of all components in the same arrangement. The Q matrix is defined as those components which gets influenced due to failure of another component. The rows of the matrix define the components. For example, row-1 is component A, row-2 is component B and so on. The columns in the Q matrix denote the influence of failure of one component on other components. It takes value of 1 if failure of one component influences other, else it takes 0.
The matrix
Where
The sum of four matrix variables determines the CM cost of a system for a certain time interval from the preceding computations. The cost of system component failures can thus be computed as follows:
4.2.2 Preventive Maintenance Cost
The cost of preventive maintenance over one cycle can be calculated by adding labour costs and the number of people need. The labours cost for preventive maintenance can be calculated for each replacement. Thus, matrix can be represented as follows:
Where,
Maintenance costs are evaluated for each FMEA Block, and all costs are given in AUD dollars. From the previous calculations, the expected overall maintenance cost per year for a FMEA Block
4.3 Maintenance Procedures
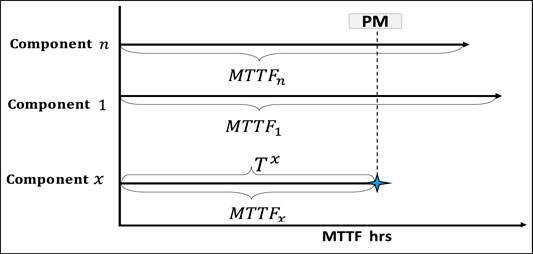
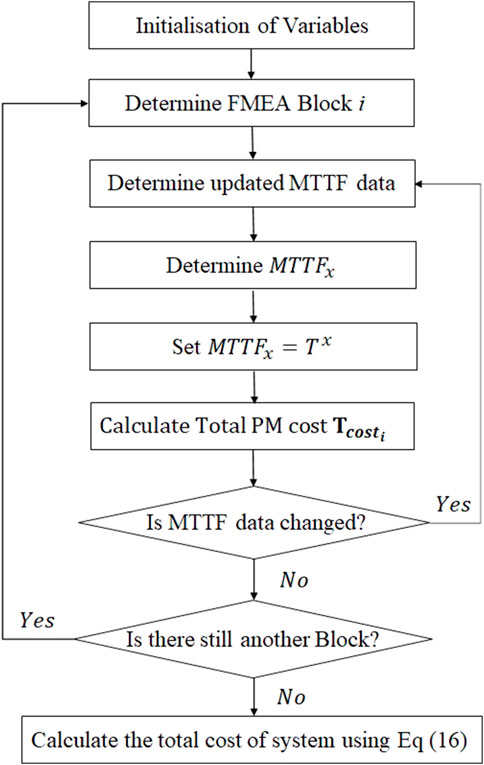
The flowchart in Figure 2 summarizes the maintenance procedures in this study. Group of components replacement grow for other system components when a preventive maintenance task is conducted on the component x. Preventive maintenance tasks are put together depending on the FMEA Block. Therefore, maintaining all components simultaneously is very important to avoid any breakdown and reduce frequent maintenance actions.
The goal of the study is to define the maintenance schedule for a complete system while keeping the cost function low. After performing the system analysis, we can define the FMEA Block. The MTTF values of system components can then be determined. Preventive maintenance cycle is determined by the maintenance time
Since the failure rates of the components are always changed, the MTTF values should be monitored continuously. If the value of MTTF is updated, the actual time to start maintenance is changed depending on new information. The updated
It is important to note that since this methodology depends heavily on the MTTF values of components in the system, accuracy of these values should be updated continuously using accumulated data from condition monitoring, system performance and product quality. Industry 4.0 environment has great advantage to support this process.
5 Case Study
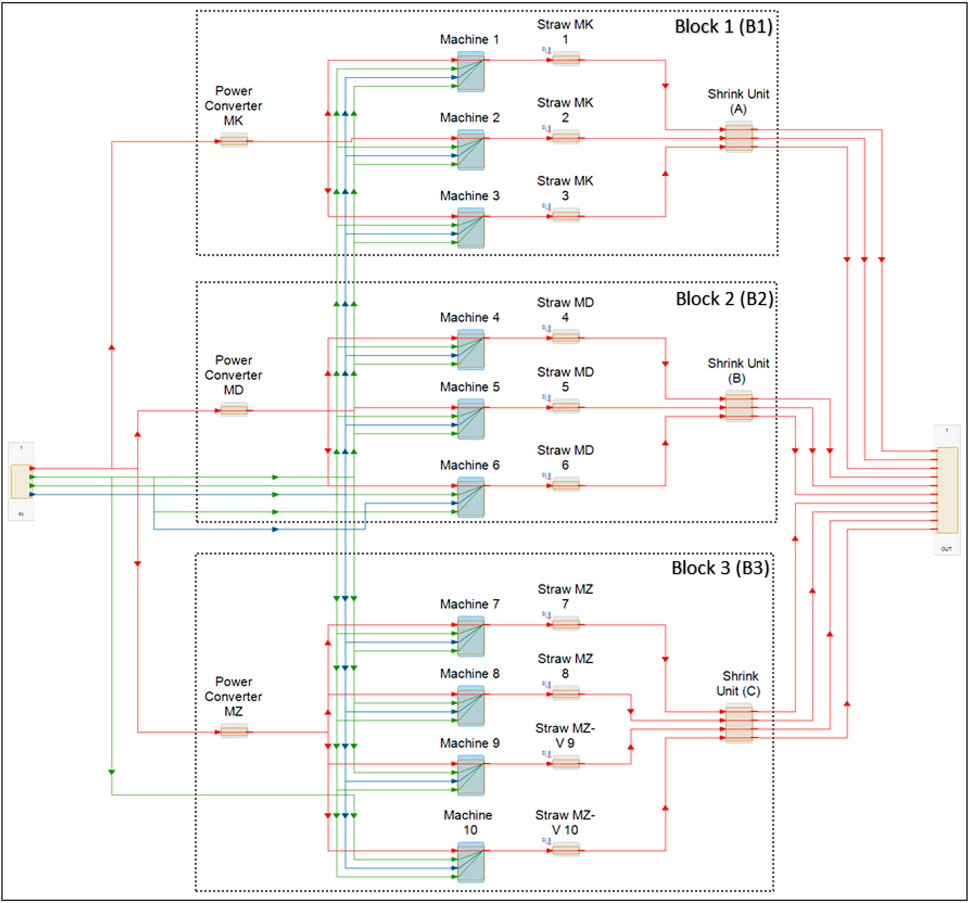
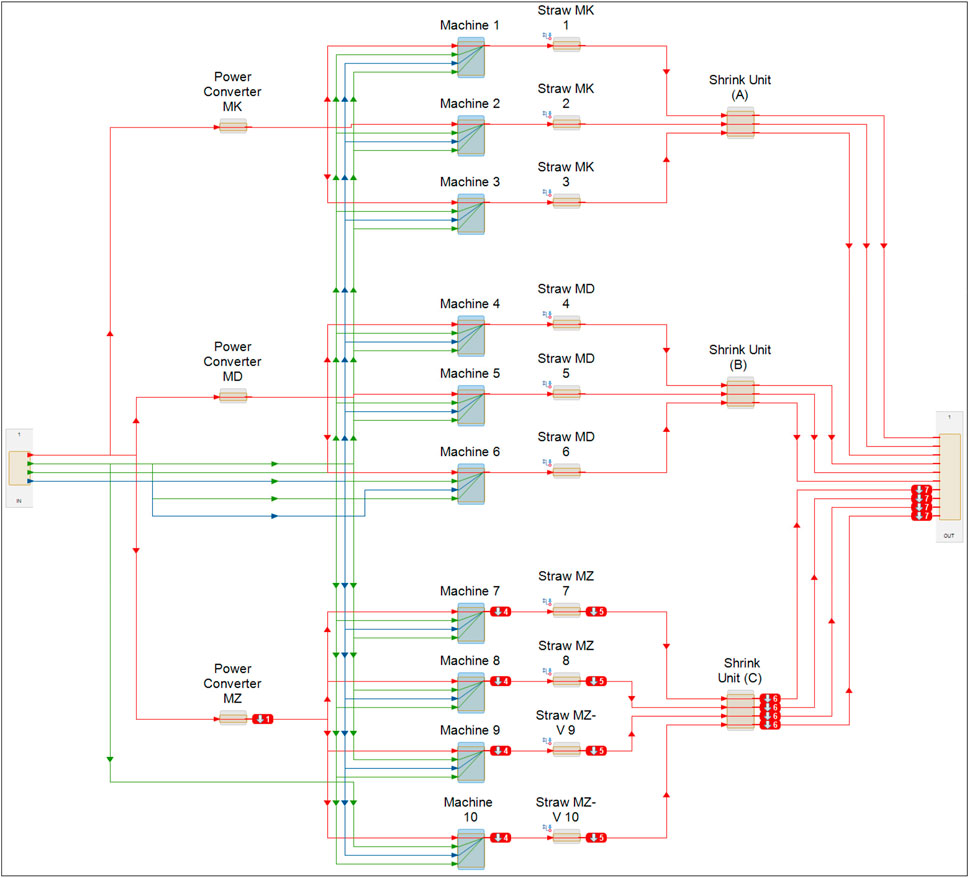
In this research, an example of a real case of production line system is used to demonstrate the proposed theory see Figure 3. A commercialized software known as Maintenance Aware Design environment (MADe) is used to capture the FMEA models of the production system. MADe is a support tool for engineering decisions that generate a system model composed of functions, modules, components, and interactions between them (Hess et al., 2008). It is possible to identify failure modes and failure causes by applying failure rates to the components of the system. The modeling work begins with the model being generated and a task being assigned to the top-level.
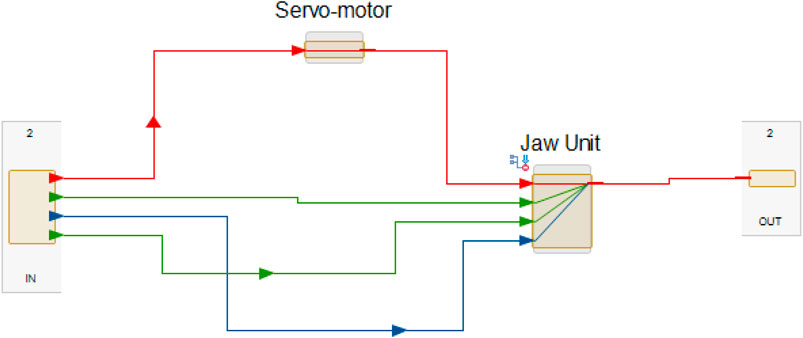
The production system in this study consists of ten production lines. Each line contains Machines and Straws designed in a parallel configuration and are connected to other critical components such as Power Converters and Shrink Units in a series arrangement. The system functions 12 h a day and 7 days a week. It is multiple lines of production divided into three blocks (Block 1, Block 2, and Block 3). It is made of 36 elements (components and parts). Ten subsystems, which are Machines numbered from 1 to 10. Each subsystem includes two different types of components (Figure 4). The remaining components work as complementary parts in the production line.
All parts of the system should be running to sustain the system’s necessary operation, but the failure of any system’s components will not cause the entire system to fail. For example, if Straw Unit 1 component fails, the Machine1 will stop running since it works in one line. However, the other machines 2 and 3 in the same B1 will not be affected. In this situation, the system will lose some of its capacity. In the same way, if the (Power Converter MK) fails, the failure will affect the other components in the same block. This means that Block1 will stop working completely, and therefore the effect of failure on the system will be partial. In this case, the other blocks, Block 2, and Block 3, will continue working, but the system capacity will be lower than before.
5.1 Feedback Data From the Manufacturing System
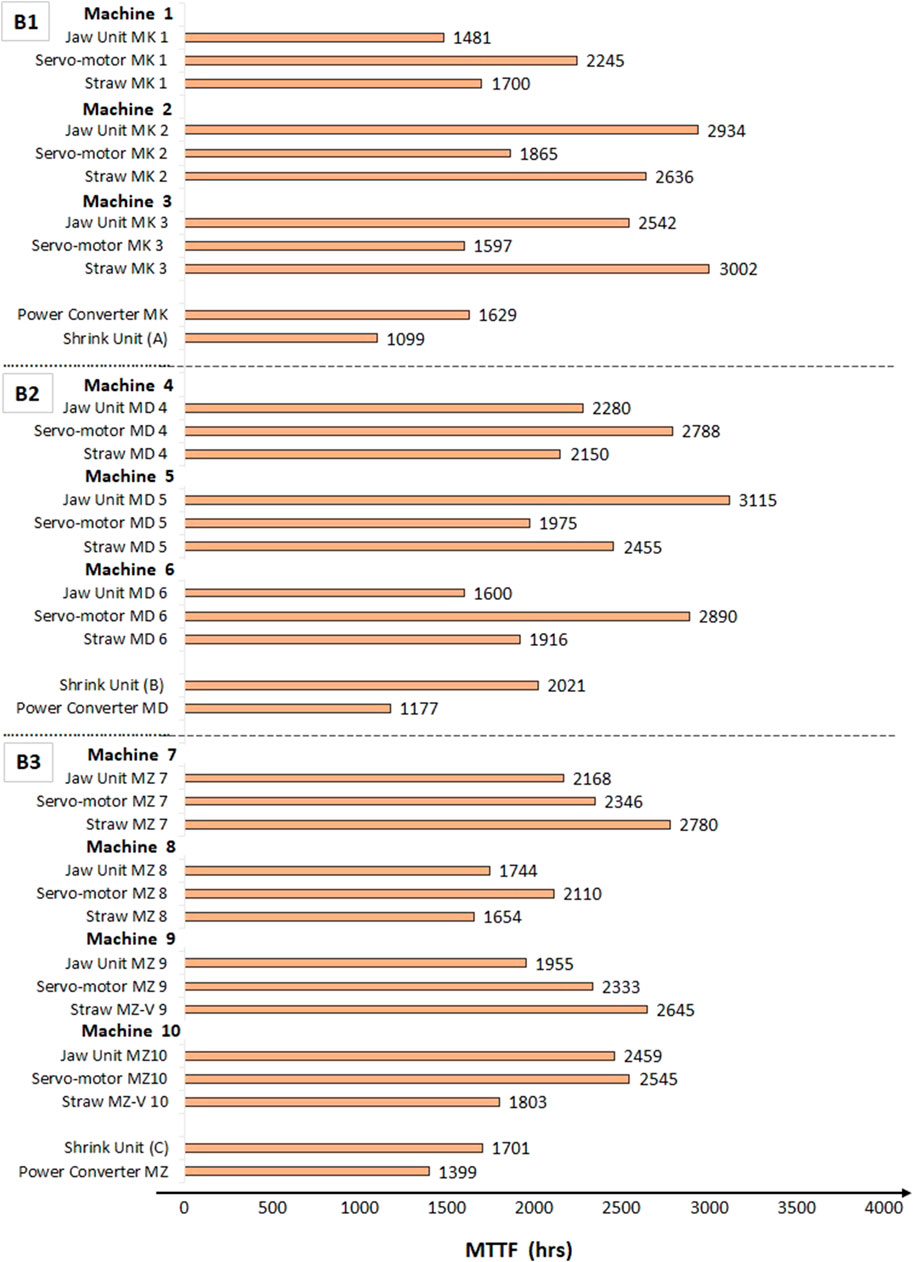
Due to the variability of MTTF values all the time, in this research, we assume that the MTTF information comes from the statistical industry and online monitoring is changing all the time. Continuous monitoring of MTTF for any future changes allows updating the required maintenance plan and recalculation of new maintenance time (based on accurate and updated information of system components) prior to any predicted failure. We formed a schedule on the basis of always updated MTTF values for system blocks B1, B2, and B3 see Figure 5.
6 Propagation of Failure
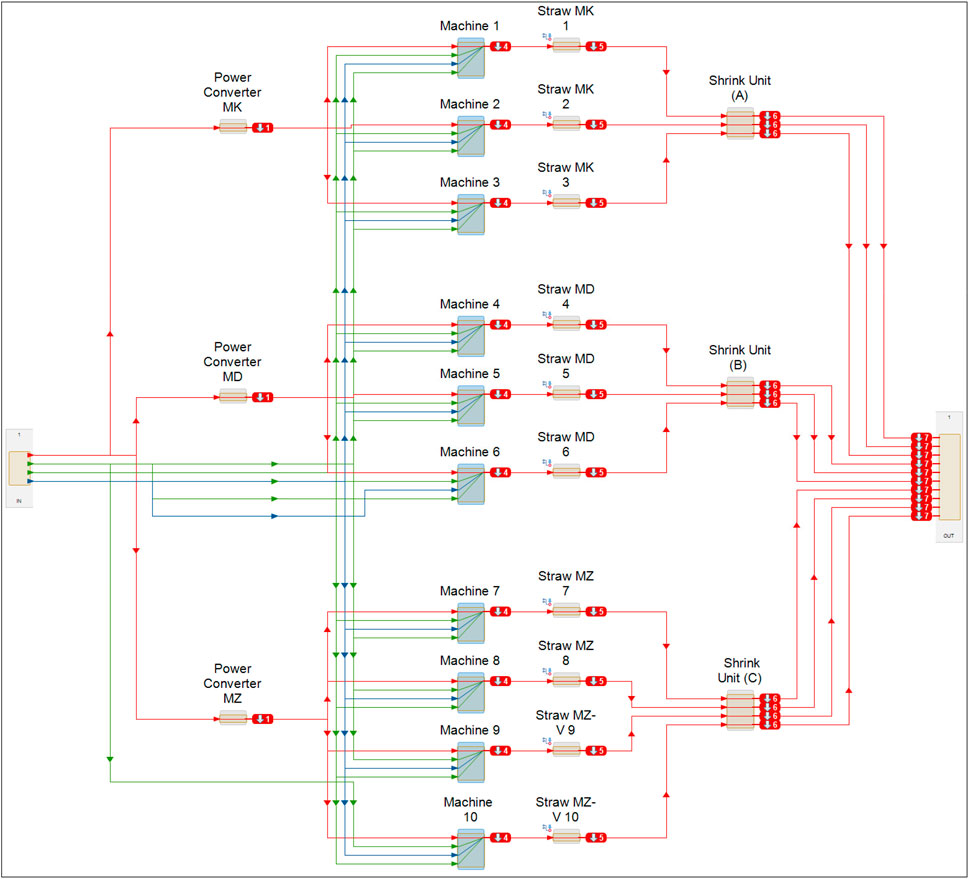
To analyse the system, it is first modelled in MADe, as is shown in Figure 3. A function and failure mode are specified for each element, using a functional block diagram. By translating the flow links between components into reliable connections, the MADe program transforms the functional diagram into a reliability diagram. Where there are multiple flow connections between system components, a single reliability link is represented, and the reliability diagram is drawn according to this.
6.1 Complete Failure of the System
The negative effects that failure has on a given system can always be determined by conducting a simulation of failure propagation using MADe software. A single component of a system can be injected with either low or high response, which in turn propagates failure to the whole system.Figure 6 shows a system having high indenture levels. This is a simulation of a production process that clearly shows the path of failure propagation in the system. From the model, it is clear that failure negatively affects power converters MK, MD, and MZ. The numbers in the MADe model shows the path of the fault throughout the simulation model in the defined sequence.
6.2 Partial Failure of the System
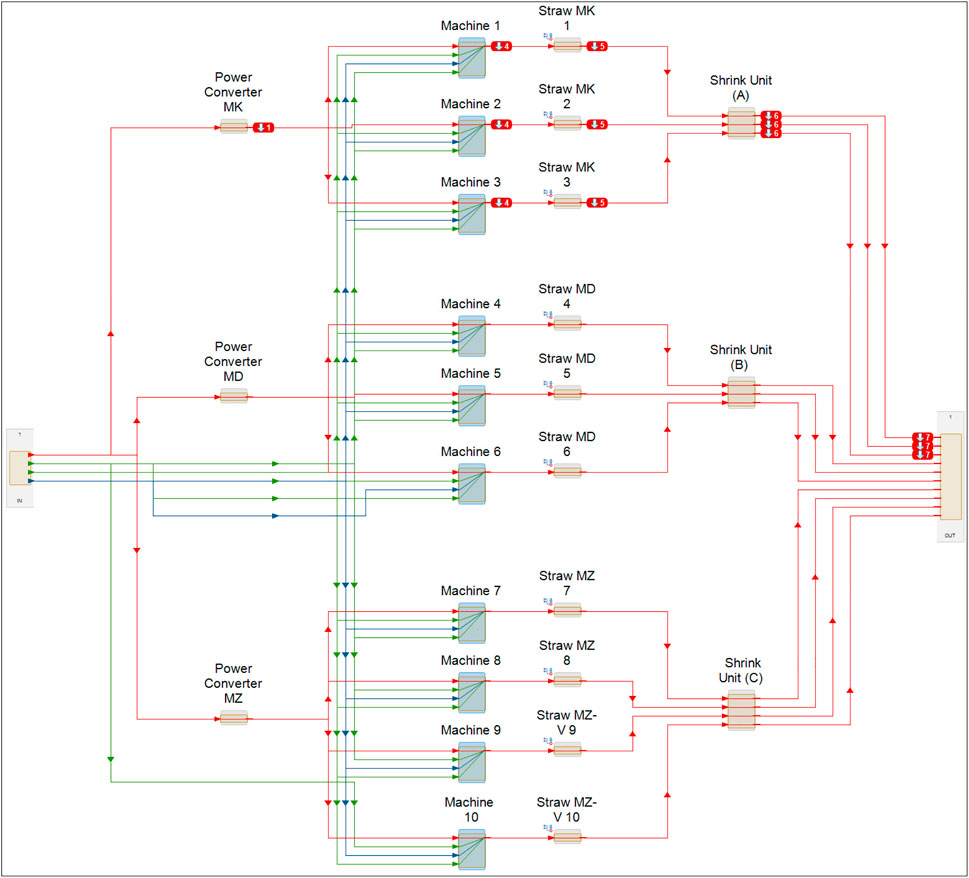
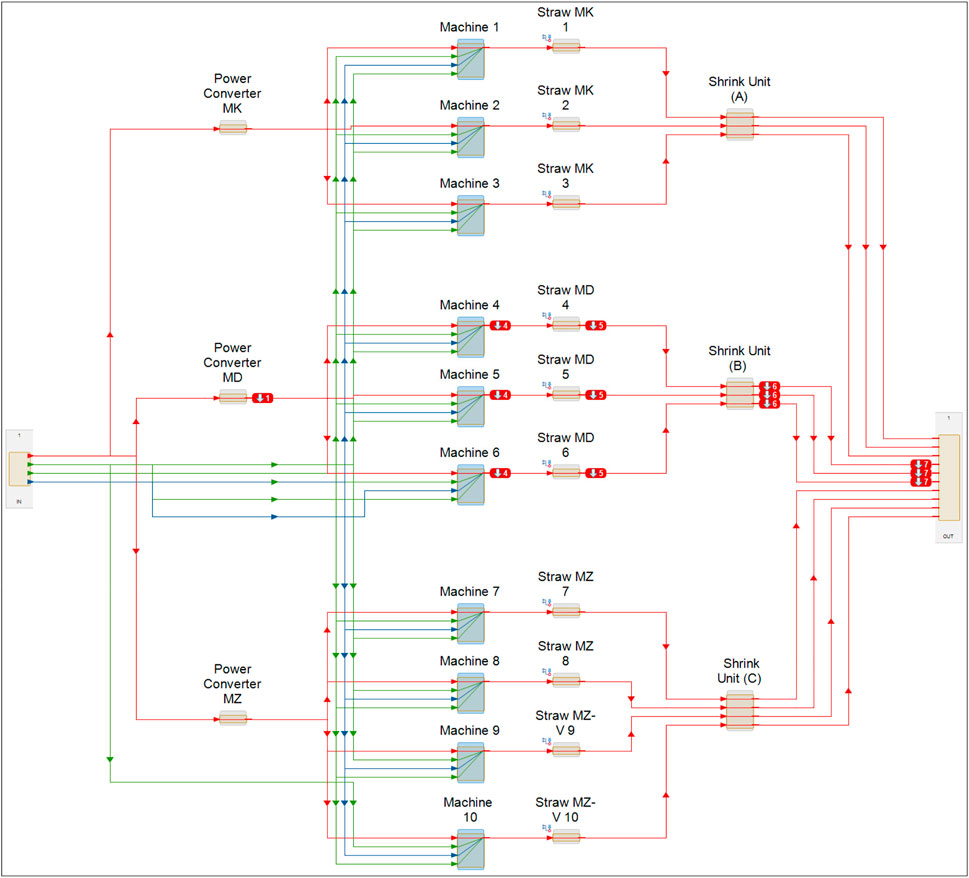
In the previous section, a simulation of failure propagation was provided in order to observe the impact of failure modes on the entire system. In this section, partial failure propagation is simulated to monitor the impact of failure modes on the part of the system. In this part, the model failure occurs at B1 (Figure 7), B2 (Figure 8), and B3 (Figure 9). There are still some parts on the system to keep it working.
Although it was stated that the stop of a component does not normally result in a whole system shutdown, the stop of one component or two (depending on its position in the system) during system operation reduces the capacity and efficiency of the system. Understanding how the system fails is very important and could help to avoid this issue during planning PM schedules, which contributes to the continued of the production system. For example, in this system, it can be noticed that B1, B2, and B3 work in a parallel arrangement meaning that the shutdown of one block will not impact other Blocks. The production line system consists of different speeds. Therefore, B1 and B2 represent 50% of the system’s production capacity. That means 25% each, while B3 represents 50%.
7 Implementation of the Proposed Approach
After defining the FMEA Block, we need to consider the shortest MTTF value of components in order to determine the interval of preventive replacement. When the preventive maintenance start, a group of replacement actions can be performed at the same time on all components. PM should be conducted to minimise maintenance costs by reducing unexpected equipment failure.
The total expected costs for simultaneous preventive maintenance actions of components in all tasks comprise the cost of maintenance activities and downtime cost. The cost of maintenance includes the cost of spare parts (Table 1). It is assumed that enough maintenance workers are available at the planned maintenance execution times. Here, the total cost of a preventive replacement is determined based on the assumption that labour cost is $50 (2 people). To obtain the cost of corrective maintenance, the cost of labour is assumed to be $50 (5 people, 5 h each–total 25 h) and lost production is $900.
The proposed mathematical matrix model was implemented, and PM schedule was solved for all system blocks separately. MATLAB software was used to simulate the cost model.
7.1 Block 1 Maintenance Task
To improve the preventive maintenance schedule, understanding how system components work and how failure modes could impact the system operation is important. In this task, Shrink Unit A has been identified to perform the first replacement maintenance based on the earliest MTTF value. During performing replacement maintenance at
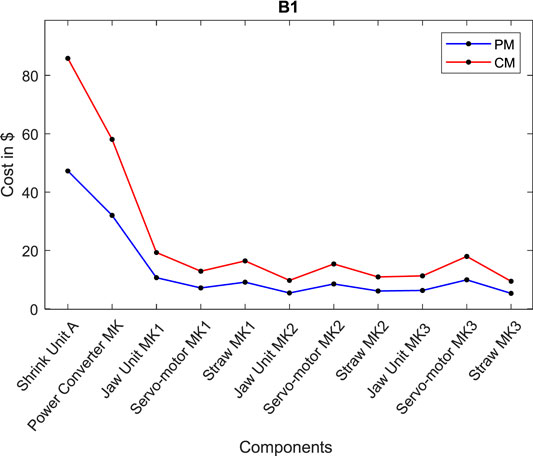
Shrink Unit A and Power Converter MK are critical components. Replacement one of these components will stop all components completely from operating since they operate in a series configuration. Figure 10 shows that the comparison results between the PM approach in this study and CM if there is no maintenance for this Block. The failures of the critical components have a significant impact on maintenance costs since this failure impacts other components in same time due to the cost of production loss and the cost of downtime.
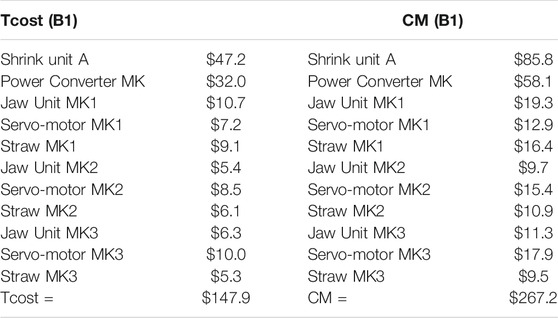
Table 2 shows the total annual preventive maintenance cost for all components in B1 comparing with the cost of CM in case of failure. CM cost was calculated by using Eq. 13.
7.2 Block 2 Maintenance Task
In this task, the Power Converter MD is a critical component that requires replacement based on its MTTF value. The preventive maintenance time for the Power converter MD is
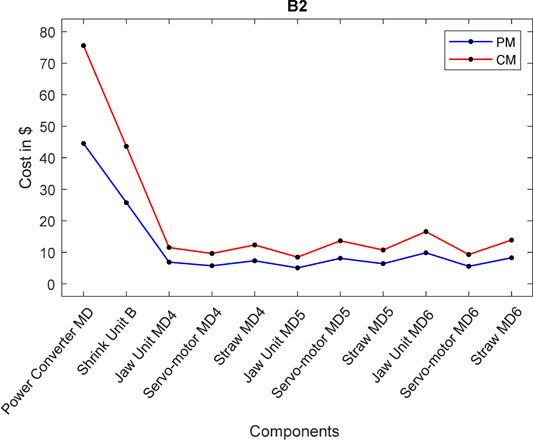
It can be seen from the production system model that Block two is in a serial-parallel arrangement, and the Power converter MD functions the whole block 2. Therefore, to start replacing this critical component, then B2 has to be unavailable at the same time. In this case, the whole production system will not stop meaning that the B1 and B3 will continue functioning; however, the capacity of the system will be reduced. As shown in Figure 11, the failure of critical components will affect the maintenance cost of the entire block, as this effect will extend to the rest of the components. While the effect of other components is less since this effect is limited to the components in the same configuration.
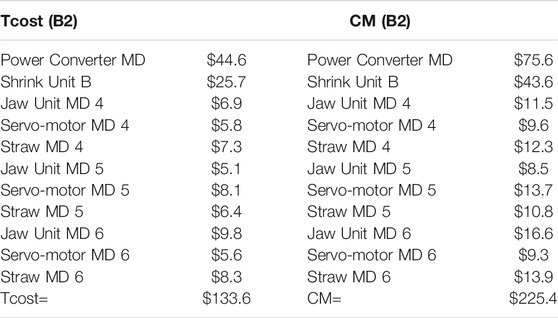
Table 3 shows the cost of CM in the event of failure and the total yearly preventive maintenance cost for all components in B2. Eq. (13) was used to determine the cost of CM.
7.3 Block 3 Maintenance Task
Maintenance task 3 is conducted when the Power converter MZ arrives at its replacement time. In this case, all the block 3 (B3) components are considered as down when performing a maintenance task and remain unavailable until selected components have been replaced. In this task, we can note that Power Converter MZ is a critical part and has the shortest MTTF. Thus, the component is chosen to start maintenance. The maintenance time for replacement of this component at
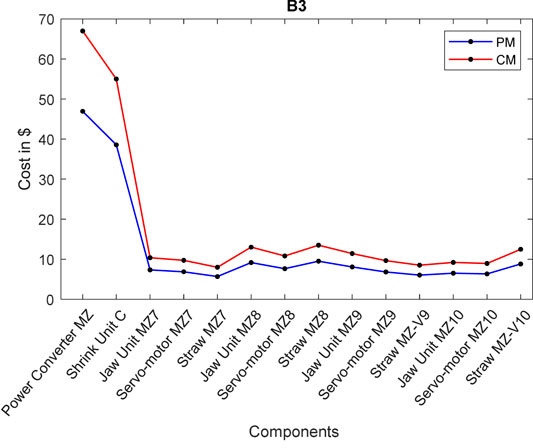
Figure 12 indicates that the huge effect of failure on this block, when the failure occurs on the (Shrink Unit C or Power Converter MZ). In this case, the B3 will stop working. The impact of failure will be partial to the system however the cost will be high due to production loss during the shutdown of all other components in the same block. While the effect of failure of other components on the maintenance cost of the block is much less than the effect of failure of critical components. This is due to its position in the block configuration.
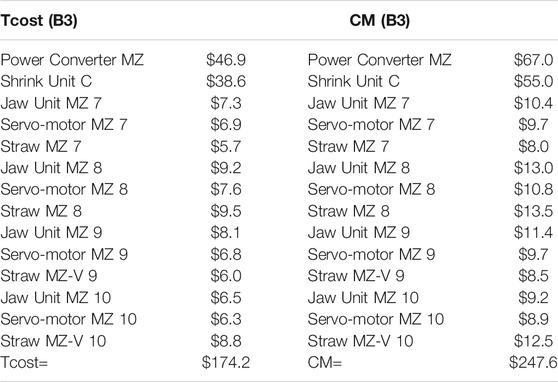
Table 4 displays the total yearly preventive maintenance costs for all components in B3 and the cost of corrective replacement in the event of a breakdown. The cost of CM was determined using Equation 13.
7.4 Complete System
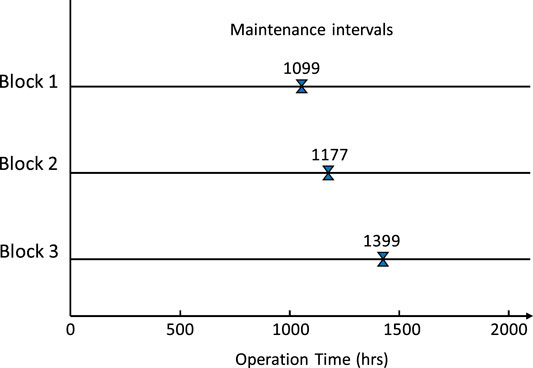
Under three different tasks, the maintenance time for start maintenance of the first component has been determined based on shortest MTTF to allow PM tasks on group of components to be executed. For Shrink Unit A, Power converter MD and Power converter MZ the replacement time of hours is 1099, 1102, and 1399 respectively. Determining the PM intervals for these three components helped to implement PM actions at once. The annual total maintenance cost for three blocks using Eq. 16 is $563,412.
Figure 13 shows that the implementation of preventive maintenance on the complete system. We note that the optimal times for starting maintenance on all tasks do not coincide with other tasks. For example, when performing the maintenance program on Task 1, in this case, only block one will be unavailable, and therefore blocks 2 and 3 will continue to work at 50% of the system’s capacity. Furthermore, when maintenance is performed on Tasks 2 and 3, the other blocks will continue to work. We can, therefore, conclude that under our maintenance schedule, there will be a guarantee that about half of the system capacity continues to operate if any block is under maintenance. The maintenance schedule has the benefit of reducing the system’s downtime and the frequency of maintenance in addition to keeping the continuity of production outputs.
7.5 Fitness in Industry 4.0 Infrastructure
Based on Industry 4.0 infrastructure, our proposed method relies on data that needs to be accumulated over time. Continuous conditions of MTTF are recorded for any future changes allows updating the required maintenance plan and recalculation of new maintenance time based on the least of MTTF information of system components prior to any predicted failure. For example, in block 1, the lowest value obtained was for the Shrink Unit A component. If this value changes, maintenance will be rescheduled for this block based on the updated MTTF value.
8 Conclusion
This paper has developed a failure mode based PM scheduling method for complex engineering systems. Since not all failures will cause whole system to fail, by analyzing failure modes that only cause partial system failures, the proposed PM scheduling method can sustain continuous production outputs during PM. Due to more intensive data analysis requirement to determine MTTF, the PM schedule can be updated regularly if statistical machine conditions can be refreshed in the latest Industry 4.0 environment, and this is the novelty of this paper.
The failure mode structured preventive maintenance scheduling methodology described in this paper has the advantage of maintaining continuity of production while optimizing maintenance costs and achieving required level of reliability. The optimal preventive maintenance schedule requires analysis of the effect to system continuity on different system failure modes. Using the FMEA software MADe, it is then possible to determine, for a complex system, multiple series-parallel components relationships governing production capacity when some of the components stop working. The PM replacement schedule can then be computed from the distribution of exponential failure.
Due to its reliance on failure distribution data, the PM scheduling methodology presented in this paper builds on extensive use of mean time to failure data, which can be estimated from rich feedback data of the manufacturing system in Industry 4.0 environment. The methodology allows re-adjustment of PM schedule easily if updated MTTF data is made available.
The PM scheduling methodology has been illustrated by a case study with industry supplied data. The production lines case study demonstrates how the methodology ensures optimal maintenance conditions of the system. The results of the case study investigation clearly indicate that over 90% system reliability has been achieved while ensuring that associated costs are minimized.
Immediate future research will focus on generalizing with more reliability-oriented distribution functions instead of the exponential failure function. Future research could consider an update of the system condition e.g. integrate sensors data with the PM model that could provide accurate information for the maintenance of the production system. Furthermore, the research could be extended by considering the model with varying production loss by integrating the production schedule with the preventive maintenance schedule model to obtain better results.
Data Availability Statement
The raw data supporting the conclusions of this article will be made available by the authors, without undue reservation.
Author Contributions
All authors listed have made a substantial, direct, and intellectual contribution to the work and approved it for publication.
Conflict of Interest
The authors declare that the research was conducted in the absence of any commercial or financial relationships that could be construed as a potential conflict of interest.
Publisher’s Note
All claims expressed in this article are solely those of the authors and do not necessarily represent those of their affiliated organizations, or those of the publisher, the editors and the reviewers. Any product that may be evaluated in this article, or claim that may be made by its manufacturer, is not guaranteed or endorsed by the publisher.
Acknowledgments
The authors wish to express their thanks to Chris Stecki and Daniel Chan at PHM Technology Pty Ltd. for their support and assistance.
References
Adhikary, D. D., Bose, G. K., Bose, D., and Mitra, S. (2013). Maintenance Class-Based Cost-Effective Preventive Maintenance Scheduling of Coal-Fired Power Plants. Ijrs 7 (4), 358–371. doi:10.1504/ijrs.2013.057422
Adhikary, D. D., Bose, G. K., Jana, D. K., Bose, D., and Mitra, S. (2016). Availability and Cost-Centered Preventive Maintenance Scheduling of Continuous Operating Series Systems Using Multi-Objective Genetic Algorithm: A Case Study. Qual. Eng. 28 (3), 352–357. doi:10.1080/08982112.2015.1086001
Cicek, K., Turan, H. H., Topcu, Y. I., and Searslan, M. N. (2010). “Risk-based Preventive Maintenance Planning Using Failure Mode and Effect Analysis (FMEA) for marine Engine Systems,” in 2010 Second International Conference on Engineering System Management and Applications, Sharjah, United Arab Emirates, 30 March – 1 April, 1–6.
Cullum, J., Binns, J., Lonsdale, M., Abbassi, R., and Garaniya, V. (2018). Risk-Based Maintenance Scheduling with Application to Naval Vessels and Ships. Ocean Eng. 148 (October 2017), 476–485. doi:10.1016/j.oceaneng.2017.11.044
Dahia, Z., Bellaouar, A., and Billel, S. (2018). “Optimization of the Preventive Maintenance for a Multi-Component System Using Genetic Algorithm,” in International Conference in Artificial Intelligence in Renewable Energetic Systems, Tipaza, Algeria, November 2018 (Cham: Springer), 313–320. doi:10.1007/978-3-030-04789-4_34
Das, K. (2008). A Comparative Study of Exponential Distribution vs Weibull Distribution in Machine Reliability Analysis in a CMS Design. Comput. Ind. Eng. 54 (1), 12–33. doi:10.1016/j.cie.2007.06.030
Das, K., Lashkari, R. S., and Sengupta, S. (2007). Machine Reliability and Preventive Maintenance Planning for Cellular Manufacturing Systems. Eur. J. Oper. Res. 183 (1), 162–180. doi:10.1016/j.ejor.2006.09.079
Diallo, M., Pierreval, H., and Quilliot, A. (2001). Manufacturing Cells Design with Flexible Routing Capability in Presence of Unreliable Machines. Int. J. Prod. Econ. 74 (1–3), 175–182. doi:10.1016/s0925-5273(01)00124-4
Dinh, D.-H., Do, P., and Iung, B. (2022). Multi-level Opportunistic Predictive Maintenance for Multi-Component Systems with Economic Dependence and Assembly/disassembly Impacts. Reliability Eng. Syst. Saf. 217, 108055. doi:10.1016/j.ress.2021.108055
Do Van, P., Barros, A., Bérenguer, C., Bouvard, K., and Brissaud, F. (2013). Dynamic Grouping Maintenance with Time Limited Opportunities. Reliability Eng. Syst. Saf. 120, 51–59. doi:10.1016/j.ress.2013.03.016
Duan, C., Deng, C., Gong, Q., and Wang, Y. (2018). Optimal Failure Mode-Based Preventive Maintenance Scheduling for a Complex Mechanical Device. Int. J. Adv. Manufacturing Technol. 95 (5–8), 2717–2728. doi:10.1007/s00170-017-1419-2
Feng, X., Qian, Y., Li, Z., Wang, L., and Wu, M. (2018). “Functional Model-Driven FMEA Method and its System Implementation,” in Proveedings of the 2018 12th International Conference on Reliability, Maintainability, and Safety (ICRMS), Shanghai, China, 17-19 October, 345–350. doi:10.1109/icrms.2018.00072
Guo, J., Li, Z., and Wolf, J. (2016). “Reliability Centered Preventive Maintenance Optimization for Aircraft Indicators,” in Proceedings - Annual Reliability and Maintainability Symposium, Tucson, USA, 25–28 January. doi:10.1109/rams.2016.7448068
Gustavsson, E., Patriksson, M., Strömberg, A.-B., Wojciechowski, A., and Önnheim, M. (2014). Preventive Maintenance Scheduling of Multi-Component Systems with Interval Costs. Comput. Ind. Eng. 76, 390–400. doi:10.1016/j.cie.2014.02.009
Hess, A., Stecki, J., and Rudov-Clark, S. (2008). “The Maintenance Aware Environment: the Development of an Aerospace PHM Software Tool,” in Proceedings of 2008 IEEE Aerospace Conference Big Sky, Montana, USA, January 2008.
Huang, J., and Okogbaa, O. G. (1996). A Heuristic Replacement Scheduling Approach for Multi-Unit Systems with Economic Dependency. Int. J. Rel. Qual. Saf. Eng. 03 (01), 1–10. doi:10.1142/s0218539396000028
Islam, S. S., Lestari, T., Fitriani, A., and Wardani, D. A. (2020). The Implementation of Preventive Maintenance Using Machine Damage Analysis: a Case Study of Power Plant Machine. In IOP Conference Series:. Mater. Sci. Eng. 885 (No. 1), 012030. doi:10.1088/1757-899x/885/1/012030
Jardine, A. K., and Tsang, A. H. (2013). Maintenance, Replacement, and Reliability; Theory and Applications. 2d Ed, 28. Portland: Ringgold, Inc CRC press.” Reference & Research Book News. ISSN: 0887-3763.4
Kamel, G., Aly, M. F., Mohib, A., and Afefy, I. H. (2020). Optimization of a Multilevel Integrated Preventive Maintenance Scheduling Mathematical Model Using Genetic Algorithm. Int. J. Manage. Sci. Eng. Manage. 15, 247–257. doi:10.1080/17509653.2020.1726834
Khalaf, A. B., Hamam, Y., Alayli, Y., and Djouani, K. (2013). The Effect of Maintenance on the Survival of Medical Equipment. J. Eng. Des. Tech. 11 (2), 142–157. doi:10.1108/JEDT-06-2011-0033
Khalaf, A., Djouani, K., Hamam, Y., and Alayli, Y. (2015). Maintenance Strategies and Failure-Cost Model for Medical Equipment. Qual. Reliab. Engng. Int. 31 (6), 935–947. doi:10.1002/qre.1650
Kobbacy, K. A. H., and Murthy, D. N. P. (2008). Complex System Maintenance Handbook. Berlin/Heidelberg, Germany: Springer Science & Business Media. doi:10.1007/978-1-84800-011-7Complex System Maintenance Handbook
Laggoune, R., Chateauneuf, A., and Aissani, D. (2009). Opportunistic Policy for Optimal Preventive Maintenance of a Multi-Component System in Continuous Operating Units. Comput. Chem. Eng. 33 (9), 1499–1510. doi:10.1016/j.compchemeng.2009.03.003
Liu, B., Yeh, R.-H., Xie, M., and Kuo, W. (2017). Maintenance Scheduling for Multicomponent Systems with Hidden Failures. IEEE Trans. Rel. 66, 1280–1292. doi:10.1109/tr.2017.2740562
Mishra, A. K., Shrivastava, D., Tarasia, D., and Rahim, A. (2021). Joint Optimization of Production Scheduling and Group Preventive Maintenance Planning in Multi-Machine Systems. Ann. Oper. Res., 1–44. doi:10.1007/s10479-021-04362-z
Mo, J. P. T., and Chan, D. (2017). Reliability Based Maintenance Planning of Wind Turbine Using Bond Graph. ujme 5 (4), 103–112. doi:10.13189/ujme.2017.050401
Palei, S. K., Das, S., and Chatterjee, S. (2020). Reliability-Centered Maintenance of Rapier Dragline for Optimizing Replacement Interval of Dragline Components. Mining, Metall. Exploration 37, 1121–1136. doi:10.1007/s42461-020-00226-5
Paprocka, I. (2019). The Model of Maintenance Planning and Production Scheduling for Maximising Robustness. Int. J. Prod. Res. 57 (14), 4480–4501. doi:10.1080/00207543.2018.1492752
Petchrompo, S., Li, H., Erguido, A., Riches, C., and Parlikad, A. K. (2020). A Value-Based Approach to Optimizing Long-Term Maintenance Plans for a Multi-Asset K-Out-Of-N System. Reliability Eng. Syst. Saf. 200, 106924. doi:10.1016/j.ress.2020.106924
Petchrompo, S., and Parlikad, A. K. (2019). A Review of Asset Management Literature on Multi-Asset Systems. Reliability Eng. Syst. Saf. 181, 181–201. doi:10.1016/j.ress.2018.09.009
Pham, H., and Wang, H. (1996). Imperfect Maintenance. Eur. J. Oper. Res. 94 (3), 425–438. doi:10.1016/s0377-2217(96)00099-9
Piechowski, M., Szafer, P., Wyczolkowski, R., and Gladysiak, V. (2018). Concept of the FMEA Method-Based Model Supporting Proactive and Preventive Maintenance Activities. IOP Conf. Ser. Mater. Sci. Eng. 400 (6), 062023. doi:10.1088/1757-899X/400/6/062023
Puthillath, B., and Sasikumar, R. (2012). Selection of Maintenance Strategy Using Failure Mode Effect and Criticality Analysis. Int. J. Eng. Innovative Technol. (Ijeit) 1 (6), 73–79.
Rahmania, W. S., Prasetya, H. E. G., and Sholihah, F. H. (2020). “Maintenance Analysis of Boiler Feed Pump Turbine Using Failure Mode Effect Analysis (FMEA) Methods,” in Proceedings of the 2020 International Electronics Symposium (IES), Sarubaya, Indonesia, 29-30 September 2020, 54–59. doi:10.1109/ies50839.2020.9231886
Ramere, M. D., and Laseinde, O. T. (2021). Optimization of Condition-Based Maintenance Strategy Prediction for Aging Automotive Industrial Equipment Using FMEA. Proced. Comput. Sci. 180, 229–238. doi:10.1016/j.procs.2021.01.160
Rausand, M., and Høyland, A. (2004). System Reliability Theory: Models, Statistical Methods, and Applications. 2nd Ed. Hoboken: John Wiley & Sons. ISBN 0-471-47133-X.
Rungsa, E. A., and Tangjitsitcharoen, S. (2014). Development of Computerized Preventive Maintenance Management System with Failure Mode and Effect Analysis for CNC Machine. Amm 627, 365–371. doi:10.4028/www.scientific.net/amm.627.365
Savsar, M. (2000). Reliability Analysis of a Flexible Manufacturing Cell. Reliability Eng. Syst. Saf. 67 (2), 147–152. doi:10.1016/s0951-8320(99)00056-3
Shafiee, M., and Sørensen, J. D. (2019). Maintenance Optimization and Inspection Planning of Wind Energy Assets: Models, Methods and Strategies. Reliability Eng. Syst. Saf. 192, 105993. doi:10.1016/j.ress.2017.10.025
Soh, S. S., Radzi, N. H. M., and Haron, H. (2012). “Review on Scheduling Techniques of Preventive Maintenance Activities of Railway,” in Proceedings of International Conference on Computational Intelligence, Modelling and Simulation, Kuantan, Malaysia, September 2012, 310–315. doi:10.1109/CIMSim.2012.56
Sudadiyo, S., Santa, S. A., Subekti, M., Sunaryo, G. R., and Busono, P. (2020). FMEA for Maintenance Criterion at RSG-GAS Reactor Implemented on JE01-AP01 Primary Pump. Kerntechnik 85 (3), 153–160. doi:10.3139/124.110969
Tam, A. S. B., Chan, W. M., and Price, J. W. H. (2006). Optimal Maintenance Intervals for a Multi-Component System. Prod. Plann. Control. 17 (8), 769–779. doi:10.1080/09537280600834452
Vilarinho, S., Lopes, I., and Oliveira, J. A. (2017). Preventive Maintenance Decisions through Maintenance Optimization Models: A Case Study. Proced. Manufacturing 11, 1170–1177. doi:10.1016/j.promfg.2017.07.241
Vu, H. C., Do, P., Fouladirad, M., and Grall, A. (2020). Dynamic Opportunistic Maintenance Planning for Multi-Component Redundant Systems with Various Types of Opportunities. Reliability Eng. Syst. Saf. 198, 106854. doi:10.1016/j.ress.2020.106854
Wang, W. (2011). An Inspection Model Based on a Three-Stage Failure Process. Reliability Eng. Syst. Saf. 96 (7), 838–848. doi:10.1016/j.ress.2011.03.003
Wang, X., Guo, S., Shen, J., and Liu, Y. (2020). Optimization of Preventive Maintenance for Series Manufacturing System by Differential Evolution Algorithm. J. Intell. Manuf 31 (3), 745–757. doi:10.1007/s10845-019-01475-y
Xiao, L., Xia, T., Pan, E., and Zhang, X. (2020). Long-term Predictive Opportunistic Replacement Optimisation for a Small Multi-Component System Using Partial Condition Monitoring Data to Date. Int. J. Prod. Res. 58 (13), 4015–4032. doi:10.1080/00207543.2019.1641236
Yazhau, J., Molin, W., and Zhixin, J. (1995). Probability Failures of Machining center Failures. Reliability Eng. Syst. Saf. 50 (1), 121–125.
Keywords: preventive maintenance, reliability, failure mode and effect analysis, dynamic mean time to failure, partially failure mode
Citation: Alamri TO and Mo JPT (2022) Failure Mode Structured Preventive Maintenance Scheduling With Changing Failure Rates in Industry 4.0 Environment. Front. Manuf. Technol. 2:828986. doi: 10.3389/fmtec.2022.828986
Received: 04 December 2021; Accepted: 17 February 2022;
Published: 24 March 2022.
Edited by:
Amit Kumar Jain, Alliance University, IndiaReviewed by:
Sandeep Kumar, IILM Institute for Higher Education, IndiaJuergen Herbert Lenz, Würzburg-Schweinfurt, Germany
Sanyapong Petchrompo, Mahidol University, Thailand
Bin Liu, University of Strathclyde, United Kingdom
Copyright © 2022 Alamri and Mo. This is an open-access article distributed under the terms of the Creative Commons Attribution License (CC BY). The use, distribution or reproduction in other forums is permitted, provided the original author(s) and the copyright owner(s) are credited and that the original publication in this journal is cited, in accordance with accepted academic practice. No use, distribution or reproduction is permitted which does not comply with these terms.
*Correspondence: John P. T. Mo, am9obi5tb0BybWl0LmVkdS5hdQ==
 Theyab O. Alamri
 John P. T. Mo