Abstract
With the evolution of product service systems, as well as the proposal and wide application of cloud computing and big services, more and more manufacturing enterprises are turning from being product oriented to service oriented. A difficult aspect is that with the growth of customer scale and the personalization of customer service needs, service providers cannot rely on their own resources to fulfill services. Moreover, meeting the needs of customers often requires a complete and complex service. Therefore, the service provider has to provide cross-enterprise collaborative services and coordinate the resources of all participants in the product service system to complete the services together. This research proposes a novel resource allocation method for product service systems that adopt the bilateral resource integration service mode and considers the service process life cycle. Based on the process mining techniques, this method extracts knowledge from the execution event log of the service process stored in the enterprise information system, constructs the resource allocation problem model, and gives the process mining-based resource allocation algorithm (PMRA). We use an air conditioner repair service as a case to verify the method proposed in this study. The contribution of this study is to propose a new method of resource allocation for cross-enterprise product−service processes based on process mining techniques, which takes into account empirical knowledge from historical data and can provide a new idea for service optimization of product service systems.
1 Introduction
At present, service has become the main driving force for social and economic development. More and more manufacturing enterprises are undergoing service-oriented transformation. They are no longer limited to the sales of products, but provide products and services as a whole to increase the added value, improve corporate profits, and gain a competitive advantage in the market (Kimita et al., 2016). The product service system (PSS) is a business model that emerged under this trend. It is designed to be competitive, meet customer needs, and have a lower impact on the environment (Mont, 2002). Also, as time evolved, value-driven PSS has come to be known as one of the main directions of research, focusing on the co-creation of value for all stakeholders (Brissaud et al., 2022). A customer’s service need is the trigger of service, which is ultimately met by various service actors together (Zhou et al., 2020). With the increasing complexity and personalization of customer needs, service providers cannot meet the requirements of customers with the services and resources they have alone. At the same time, service providers need to provide customers with a transparent and complete service and reduce customer participation and improve customer satisfaction. Hereby, the actors and resources in the value chain need to be integrated to meet the massive individualized needs (Xu et al., 2018). Cloud computing provides the access mode of service resources, while big service provides the construction method of complex services (Xu et al., 2015). The PSS is a relatively new field, and theories such as cloud computing and big services can be used to enrich its resource access modes and service compositions, while the use of resources is inseparable from each participant in the operation system of the PSS. However, it can be found that there is little research on resource allocation for the PSS, while the service-oriented process and activity-level resource allocation still lack in-depth research combined with the actual service scenarios of PSS.
For this gap, in the context of cloud computing and big service, this study proposes a new resource allocation method for a PSS that adopts the bilateral resource integration service (BIRIS) mode and considers the service process life cycle. Based on the process mining techniques, this method extracts knowledge from the execution event log of the service process stored in the enterprise’s information systems, constructs the resource allocation problem model, and gives the corresponding solution algorithm. Through the mining and analysis of historical data, the model construction and solution results can be more in line with the actual situation of service execution in the PSS and the weakness of difference between theoretical analysis and practical application can be avoided. Since information systems collect a large amount of data from business practices, the adoption of process mining techniques can not only extract knowledge from these data to provide near-realistic settings but also assist in running simulations. Moreover, the method proposed in this study can improve the computability of resource allocation in the service process of the PSS, especially in terms of work efficiency and service time.
In this study, the product−service process refers to the process of fulfilling customer service needs around the product in the PSS with the product as the carrier. That is, the services in the PSS are realized through the product−service process. The originality of this contribution lies in a new method of resource allocation of product−service processes based on process mining techniques. As there are a large number of service logs in the information system of the PSS, the introduction of the process mining algorithm can discover the service patterns, resource usage, and personnel efficiency from the logs, which can provide empirical knowledge support for the subsequent resource allocation. On this basis, we establish a mathematical model of the product−service process resource allocation problem and give the corresponding solution. This approach considers the impact of historical experience on the upcoming service process with the historical service log; at the same time, it tries to apply the process mining techniques to new service scenarios and provides a new idea for resource allocation in the PSS. Therefore, this study fills the gap of less literature on resource allocation in the PSS to some extent.
The remainder of this article is structured as follows: Section 2 reviews some relevant literature and theoretical foundations of the PSS, resource allocation, and process mining. Section 3 describes the problem of resource allocation in the product−service process of the PSS, defines related concepts, and constructs the problem model. Section 4 presents the solution idea and specific algorithm for the problem model based on process mining. A real case is used to validate our method in Section 5. Section 6 discusses the applicable service scenarios of the proposed method and some shortcomings of the method. Finally, the conclusion is given in Section 7.
2 Literature background
This section presents the relevant research work and theoretical foundations, including product service systems, resource allocation, and process mining. Among them, a product service system is the context in which the research is conducted, resource allocation is the key to completing the services in the PSS and is the problem that needs to be solved, and process mining is a means to solve this problem and is an important supporting technique.
2.1 Product service system
The product service system (PSS) comes from the concept of “servitization,” which promotes the transformation of traditional product-oriented manufacturing to service-oriented manufacturing (Kryvinska et al., 2020). White et al. (1999) articulated that service is the value-added part of the industrial economic base. Goedkoop et al., 1999 proposed a clear concept of a product service system; they pointed out that a product service system is a system that integrates products and services to meet customers’ needs. With the development of the Internet, social interaction breaks through the limitations of time and space, and this also provides an opportunity for the integration of products and services. Based on the background of Industry 4.0, Gaiardelli et al. (2021) argued that the development of science and technology plays an important role in the establishment and improvement of the PSS, which is embodied in the incentive effect on horizontal integration and service transformation. The massive amount of data generated by the current development of technology is both a challenge and an opportunity for enterprises. The collaborative and integrated ecosystem named big service can more effectively address these challenges (Xu et al., 2015).
In the current research, the network nature of the PSS is beginning to merge with service design (Costa et al., 2018). In the field of service, scholars have begun to focus on the concept of pattern. Alexander, 1979 defined a pattern as a set of rules that describe situations, problems, and solutions. Later, researchers began to combine pattern and service, focusing on the service composition of primitive services, and combining atomic services using domain knowledge to meet customer needs (Strunk, 2010). Xu et al. (2019) proposed that the core of the service pattern is to combine small-granularity services into a service pattern and quickly construct a service plan based on it. Huang et al. (2010) defined the concept of reusable process fragments similar to service patterns, which refers to service composition that meets certain constraints.
It can be found that the concept of PSS has been gradually integrated into the operating philosophy of management and gradually penetrated the subdivision of enterprises. Also, the PSS is an important theoretical support for enterprise service transformation. With the deepening of the research on the PSS, the concept has become more and more specific, and it is more in line with the characteristics of social development.
2.2 Resource allocation
The classic project scheduling problem usually takes the construction period and cost as the scheduling goal and the resources have a single capability (Ma et al., 2019). Later, resources were further subdivided into renewable resources, non-renewable resources, doubly-constrained resources, and partially-renewable resources (Kolisch and Padman, 2001). In the follow-up modeling research, most scholars focus on renewable resources but ignore the flexibility of resources. Yu et al. (2010) studied the project scheduling problem with flexible resource constraints, and they designed a two levels mapping network to map relationships among tasks, capabilities, and resources.
With the rapid development of cloud computing and big data, the research on service resource allocation problems becomes more complicated (Xu et al., 2017). Xu et al. (2020) analyzed relevant literature and pointed out that the relationship between capabilities and resources can be further studied. Wang and Xu (2009) designed a bilateral resource integration service (BIRIS) model, which introduced a third-party service platform for resource integration; it could integrate service resources to customers and customer resources to providers. Pawar and Wagh (2012) proposed a dynamic resource allocation mechanism for preemptable jobs in the cloud and proposed a priority-based algorithm to meet the fast response in multi-client situations. Mezache et al. (2016) proposed an adaptive resource allocation algorithm for cloud systems and used a genetic algorithm to solve it. Zhuang et al. (2016) pointed out that there are some important business constraints between services and resources and valuable service experience can be obtained through statistical analysis, data mining, and other techniques. Zhang et al. (2020) proposed a method based on a PSS multilayer network to solve the problem of service activity selection as well as resource allocation. Wang et al. (2022) argued that in the context of big services, the provision of resources is often cross-industry and the algorithm search space is huge, and in this case, more efficient resource allocation can be achieved through the aggregation of services and resources in different fields. Kang et al. (2021) proposed an auction-based cloud configuration and sharing method for the logistics product service system to solve the problem of logistics resource allocation.
In the new social and economic environment, traditional resource allocation methods are no longer suitable for proposing service-oriented solutions. In order to quickly match the supply and demand sides, various techniques can be used to complete the resource allocation in the current big service system.
2.3 Process mining
Process mining is a new business intelligence analysis method. It obtains the real business process of the enterprise by mining the event log generated during the operation of the enterprise system (Zerbino et al., 2021). Cook and Wolf first proposed the concept of process discovery, that is, process models can be automatically discovered from event logs recorded by enterprise information systems (Cook and Wolf, 1995). After that, Agrawal et al. (1998) proposed the concept of process mining and they are the earliest researchers of process mining algorithms. With the evolution of process mining, some scholars have proposed or improved process mining algorithms to adapt to appropriate application scenarios. Weijters et al. (2006) proposed a heuristic process mining algorithm, which can handle noise and abnormal problems well. After that, Weijters and Ribeiro (2011) improved the heuristic process mining algorithm and proposed a flexible heuristic mining algorithm, in which the concept of the enhanced causal network was proposed and the concept of the package was used instead of set. Later, Zhou et al. (2021) improved the flexible heuristic algorithm and proposed a mining algorithm for the service value chain, which can extract actors participating in activities and value information of different dimensions.
Based on process mining techniques, the real service execution process of the enterprise can be obtained by mining the service event logs stored in the enterprise information system. With the improvement of the process mining algorithm, more valuable information can be mined, such as valuable information about different activities in the process. Therefore, this study uses process mining techniques to obtain the resource allocation information during the execution of the historical service process, which can play an auxiliary role in the future resource allocation decision.
3 Resource allocation model for the product service system
In the context of PSS, traditional resource allocation methods need to be improved to adapt to the new demands of the current service ecosystem. This section clarifies the research issues and proposes an analytical framework, then defines related concepts, and finally proposes a resource allocation mathematical model. The model and solution proposed in this study address the door-to-door service scenario for large household appliances, i.e., after the service demand is generated, all parties involved need to integrate their resources and go to the location where the customer demands are located to perform the service activities. For example, installation service for refrigerators, repair service for washing machines, etc. It is assumed that the update of the resource status is timely and without delay; each service activity is assumed to be an independent unit, and if the same service activity is performed repeatedly it is treated as multiple service units. Only the time-consuming activities related to resource allocation in the service process are considered and the rest of the activities are not considered in this study.
3.1 Description of resource allocation problems in the PSS
As mentioned in the literature review section, BIRIS is a service integration model proposed due to the huge number of both supply and demand sides, which consists of three parts: customers, providers, and third-party platforms (Wang and Xu, 2009). For customers, it is reflected in the rapid response to their needs, and can use the platform’s services transparently without paying attention to details. For providers, it is reflected in improving the provider’s business quality and efficiency. Considering the characteristics of the PSS, it extends the application scenario of the BIRIS mode, which is described in Figure 1. On the one hand, the service system integrates the service needs of customers; on the other hand, it integrates the primitive services and service resources of service actors. The service system is operated by the service provider and the actors in the service system could be service providers, its partners, or customers. Compared with BIRIS, it emphasizes that all actors in the service value chain complete the service together for the target customers and emphasizes the mutual collaboration of participants and value co-creation in the service process.
FIGURE 1
Combined with the new models and technologies emerging in the current PSS development, this study integrates the concept of BIRIS in the PSS into the big service system and uses the idea of cloud computing to propose an analytical framework for the PSS considering resources. As shown in Figure 2, the left and right sides are the aggregation of customer needs and actors, respectively. The cloud in the middle is the service system where the service provider matches the supply and demand sides. Service models including service process information are stored in the service library. Atomic services and resources provided by different actors are stored in primitive service repositories and virtual resource pools, respectively. In this framework, service providers integrate various actors with their primitive services and resources to participate in the service according to the needs of customers. As mentioned above, some related small-granularity services can combine into a service pattern (Xu et al., 2019). When the customer’s service order arrives, the service provider finds the suitable service model and appropriate atomic services or service patterns from the repositories, then allocates resources to these services, and finally, executes the service tasks and collects the feedback for continuous optimization. Customers only need to use the services in the service system according to their needs, without knowing who will complete their service orders.
FIGURE 2
This study mainly focuses on the resource allocation step in the proposed framework to achieve efficient execution of the service process. For example, the air conditioner repair service requires an engineer to carry repair tools and parts and drive to the agreed site to perform the task. But the engineer’s schedule may already be filled with other tasks or the parts may be out of stock. In these situations, it requires waiting for these resources to become available again, or selecting other resources to perform the task. When calling other resources, the execution efficiency of the task may change. Because the capabilities of different resources are often different, such as engineer A can complete the repair in half an hour, but engineer B may take 2 h due to his or her unfamiliarity with this type of repair. Therefore, how to complete the order efficiently through reasonable resource allocation is the practical problem that this study intends to solve.
3.2 Concepts of resource allocation in the PSS
The following defines the relevant concepts and establishes a mathematical model for the resource allocation step in the framework. The definition can be divided into two parts, the definition of resource and the definition of service. During the resource configuration process, (−) is used to represent the variable before participating in the configuration. The variable without the prefix symbol defaults to the variable in the general state and the state change of the resource is not particularly emphasized.
Definition 1The customer resource Rdemand is stored in the form of service order, and the service order O is the entity corresponding to the customer’s service request in the service system. The two can be expressed as follows:where• Rdemand is a customer resource, which consists of a customer code cID and order code oID. cID is a unique number that identifies a customer and oID is a unique number that identifies an order;• oLoc is the location of the order. The location of the order reflects where the customer wants to be served;• oNeed is the type of customer’s need;• oTime is the generation time of the order.
Definition 2The service resource Rsupply refers to the resource that can be provided by actors, which are stored in the virtual resource pool. The service system will match the resources and the needs. The service resources can be expressed as follows:where• sID represents the code of the actor providing the service, uniquely identifying an actor;• rID is the code of the resource, which uniquely identifies a resource;• rLoc is the location of the resource. If the distance between oLoc and rLoc exceeds a certain threshold, the resource does not have the ability to serve the order;• rType is the type of resource, and the variable can be assigned according to different resource classification methods according to the business needs;• rName is the name of the resource;• rCapability is the capability set of a resource, which reflectswhether the resource is a flexible resource. If rCapability contains only one element, the resource is a common resource, and if there is more than one capability, the resource is a flexible resource. This study represents the capability level of the flexible resource by quantifying the specialization level of resources. For a specific service task, the capabilities of flexible resources can be expressed in the form of a set:where cName is the name of the capability and Te refers to the service execution time spent by the flexible resource to perform specific tasks to meet customer needs.• rState represents the state of the resource; if the resource is now available, then rState = 1, otherwise, if the resource is unavailable during that time period, rState = 0.• Nremain indicates the remaining number of resources.
Definition 3The allocated resource Rallocation refers to the resources participating in the resource allocation process and are combined with the service to form a service solution. The configured resource contains the type and quantity of the resource and can be expressed as follows:where• Rsupply is the same as it of Definition 2;• Nallocation is the number of resources configured.
Definition 4Atomic service, also named primitive service, is the smallest granularity of services that can no longer be segmented. It is stored in the service repository, and it can be defined as follows:where• sID is the code of the atomic service;• sName is the name of the atomic service;• sNeed represents the set of requirements that the atomic service can be used to satisfy;• sCapability is the set of capabilities required by the atomic service.
Definition 5Service pattern, also known as the business-oriented service complex, is a series of primitive services that can fit customers’ needs efficiently (Wang et al., 2013). It is related to a priori business, which can realize the mapping of service requirements to specific service combinations. It can be represented by a multi-dimensional vector (Zhuang et al., 2016):where• pInfo is the basic information set of the service pattern, including the service pattern code spID and application process;• pService stores the atomic services included in the service pattern and the logical relationship between them;• pResource is a collection of resources required by the service pattern;• pConstraint is a set of constraints of service modes, mainly including logical constraints and association constraints between atomic services;• pNeed is the set of requirements that the service model can be used to satisfy.
Definition 6Service scheme is a service execution plan for the process, which include atomic services, service patterns, and logical relationships between them, which can be defined as follows:where• C(S) represents a collection of services, which store atomic services, service patterns, or a combination of the two required by the service solution;• C(Rallocation) represents a collection of allocated resources.
3.3 Resource allocation model for the PSS
In the PSS, the service system provides knowledge support for the whole life cycle of the service process through knowledge extraction by process mining, specifically in three areas: clarifying the process, mining service association rules, and mining resource behavior.
The service process can be obtained through a process mining algorithm, and the key activities related to resource allocation can be obtained through value analysis. The association between services is defined as (Xu et al., 2017). If the collaboration probability p (si and sj) between two services is greater than a certain threshold P, then, these two services are the set of associated services. In the heuristic mining algorithm, the collaboration probability and order relationship between services can be measured by . a⇒Wb takes a value between [−1 and 1], and the more the value tends to 1 or −1, the more it indicates a stronger sequential relationship and dependence between the two (Weijters et al., 2006). In this study, we define that if the dependency between two activities is greater than 0.9, then they are positively sequential and have a strong association. The historical behavior information of resources can be obtained by mining service value.
According to the framework of Figure 2 and the concept definition, a model for the resource allocation process is established as follows:s.t.
Eq. 1 is the objective function of the model. This model is used to rapidly integrate and match the orders, services, and resources of both supply and demand sides to provide customers with efficient and complete big services. According to the actual situation of the service-oriented manufacturing industry, this study mainly considers the time-consuming service preparation phase and service execution phase of the service process life cycle.
Eqs 2–10 are the constraints of the model. The constraints of the model can be divided into two parts; one part is the constraints arising from the match between the integration requirements and the integration services and resources. The other part is the constraints formed within the service process. Eqs 2–7 are the constraints generated by the matching process. Different demands of orders, different types of services, and different states and efficiencies of resources will all have an impact on resource allocation.
In Eq. 2, represents the service capability value of , which needs to be greater than the user’s requirement oNeed (Wang et al., 2022). Eq. 3 indicates that for all configured resources, the location oLoc of the customer should be within the distance d where the actors and their partners can provide the service. Eq. 4 states that the resource can only participate in the task if the state of it is 1. Eq. 5 means that for all the resources Rallocation is involved in the allocation and the number of configurations Nallocation needs to be non-zero. Eq. 6 indicates that for all resources Rallocation involved in the configuration, it is necessary to determine whether the number of configurations Nallocation exceeds the remaining number Nremain before the configuration, and if it exceeds Nremain, the constraint is not met and cannot participate in the allocation; in Eq. 7, for all Rsupply, the number of capabilities |rCapability| needs to be greater than or equal to 1, otherwise, the resource does not have the prerequisite to create value.
Eqs 8–10 are the constraints formed within the service process. This study measures indivisibility by the correlation properties of services. The correlation relationship between services is defined as (Xu et al., 2017). Referring to this definition, the measurement based on service pattern is proposed as Eq. 8. As it is mentioned above, a service pattern is a collection of business-related services which is related to the prior tasks (Wang et al., 2013). This study uses Eq. 8 to verify whether there is a correlation between service tasks, that is, if si and sj belong to the same service pattern, then the collaboration probability between them should be higher than a certain threshold Pcorrelation. si and sj are any two primitive services or service patterns in C(S) that have a sequential logical relationship. Eq. 9 indicates that if si is executed before sj, then the start time should be later than the end time . Eq. 10 indicates that the execution time of the service task should be greater than 0.
4 Solution for the resource allocation model
Based on the defined framework, concepts, and models, this section designs the following solution considering the service process lifecycle.
4.1 Idea of the solution
The operation of a service system is a continuous cycle, in which a new log is generated in one operation, which in turn can be used as the data for the next cycle. A professional division of labor for resources can improve the efficiency of the service, and how to use professional resources to deal with dominated problems is an important issue to be considered in process optimization (Zhao and Liu, 2014). This section presents a process mining-based solution based on process mining techniques for optimizing the analysis of resource allocation.
The idea of solving the resource allocation problem is shown in Figure 3. The outer loop represents the operation of the service system and the inner loop represents the continuous update of the resource state. The details of the solution process to the resource allocation problem are as follows:
FIGURE 3
4.1.1 Process mining
In the database, there are a large number of event logs that record historical information. The actual process, resource type, and efficiency information can be obtained through process mining techniques. It can provide a basis for Eq. 8 and the following service aggregation.
4.1.2 Integration of needs
Integrate and categorize the needs of customers. The customer’s needs may reach the service provider in various ways or the service provider may actively generate service requirements before the customer finds the problem. These requirements are passed into the service system in the form of O.
4.1.3 Service configuration
Under the constraints of SLA, we build service processes and select services that match orders (Zhou et al., 2020). The service model is matched to S and SP according to the correlation between the customer’s needs and the services obtained through process mining.
4.1.4 Resource allocation
Atomic service and service patterns configured in the service process require various resources. Multiple resources of various actors conforming to Eq. 7 are stored in the virtual resource pool in the different rState. They have different efficiency of services for different tasks due to their specialized property differences. This step requires considering the constraints of the model to find the optimal solution under the resource constraints.
First, integrate bilateral resources. For the customer side, the service system needs to extract the demand category oNeed and location oLoc from the order arriving at the system. For the actors providing the service, the service system combines all the that can satisfy the demand and are relatively efficient into the candidate service solution set according to Eq. 2. Then, it judges in the whether the C(Rallocation) in meets the constraint of Eqs 3, and if the distance is beyond the scope, then is removed from . Then, the service solutions in are arranged in ascending order according to the service execution time Te. Scan sequentially, and if all the resources required in satisfy Eqs 4–6, these services and resources can form a complete large service to meet the needs of the customer. Also, Eqs 8–10 are considered to obtain the optimal resource constraint under the logical restrictions. The resources are then configured and rState of them is updated. If some of the resources required by are in an unavailable state, then scan to the next . If all have some or all of their resources in an unavailable state, a wait or reorganization operation needs to be performed as appropriate.
The waiting operation is to wait for the occupied resources to become available again (rState changes from 0 to 1). The execution of services usually requires the participation of multiple resources, and the waiting time tw is determined by the resource with the longest waiting time. Calculate the sum of the service preparation time and the service execution time and select the shortest one, then record it as .
The reorganization operation is to configure alternative resources for service tasks based on historical data obtained by process mining. Executing a service task requires a simple resource or a subsystem (a collection of simple resources or other subsystems), and when some of them are unavailable, alternative resources can be used to execute the service task (d’Ambrogio and Zacharewicz, 2016). In order to improve the response speed to customers, this study defines the concept of service reorganization. Service reorganization is to reorganize the resources required within a certain range. However, not all resources that have historically implemented this kind of service can participate in reorganization. Only historically sub-optimal but acceptable ones can be allocated. Thus, if these resources are used to execute the service tasks, the finish time may be earlier than the time to wait for efficient resources to complete the same tasks. The combination of these resources and tasks is defined as the sub-optimal service plan. When some of the resources are occupied, the solution with the shortest time-consuming is searched in the sub-optimal service plan. Then, we compared with the shortest waiting time and chose the shorter one to form an optimal solution.
4.1.5 Aftercare of service
According to the abovementioned steps, the execution plan can be obtained. Collect feedback after service execution and dynamically adjust the efficiency of resources to adapt to future demands.
4.2 Specific steps of the algorithm
According to the abovementioned idea, the allocation steps are shown in Table 1.
TABLE 1
| Input: orders and event logOutput: service plan |
|---|
| Step 1: using a process mining algorithm to extract knowledge, including service processes, service actors, resources, etc. |
| Step 2: combining related services into a service pattern |
| Step 3: extraction of oNeed and oLoc from order O for arriving systems |
| Step 4: service configuration of orders to form or update candidate service solutions |
| Step 5: sort in ascending order by service execution time Te |
| Step 6: iterate through the sequentially and if all resources in are available and form the optimal service plan for the order and skip to step 8 |
| Step 7: if the current resource is not available, wait or reorganize the operation; choosing the least time-consuming option |
| Step 8: complete the resource configuration for the order, update the resource status, execute the configuration plan, and collect feedback |
Resource allocation algorithm based on process mining (PMRA).
Through the abovementioned steps, the delivery of the order can be completed through a complex service. At the same time, the execution of the entire process only requires the service provider to allocate the right resources for the service task via the service system; thus, reducing the involvement of the customer. In addition, PMRA is a dynamic resource allocation algorithm and collects feedback during subsequent operations in order to achieve continuous optimization of the system.
5 Case study
The experimental environment of this study is as follows: the operating system is Windows 10; the development language and tool are Java and Eclipse; the web server software is Apache Tomcat v9.0. We use the improved heuristics miner for process mining (Zhou et al., 2021). The data used in this case is from a manufacturing enterprise (Company H) in the air conditioner industry. Since the data involves the business operation information of the enterprise and cannot be completely disclosed, we have processed the data. In the figures below, Figures 5 and 8 are part of the output on the console of Eclipse. Figures 9 and 10 use the 2016 Microsoft Excel to visualize the result; Camunda 7.17.0 and Camunda-modeler 5.5.0 are used as process engines for the process simulation. This section uses the service event log of Company H to verify the effectiveness of the resource allocation model for PSS.
5.1 Case description and analysis
Company H is a well-known home appliance manufacturer in China and an air conditioner is one of its main products. To face the challenge brought by the rapid development of information, Company H is committed to using cloud computing and big data to realize service value chain collaboration and value co-creation. With the support of information techniques, Company H’s information system recorded a large amount of historical data including the event log of the air conditioner repair service. Based on the empirical knowledge of the historical event log of repair service, this study allocates resources to the after-sales service center of Company H for arriving air conditioner repair service orders and seeks the optimal solution under the resource constraints. In accordance with existing data and interview results, we simulated a dataset of air conditioner repair process event logs. After blurring key business data and customer privacy information of Company H, the content of the fragment information in the XES format service event log is as follows:
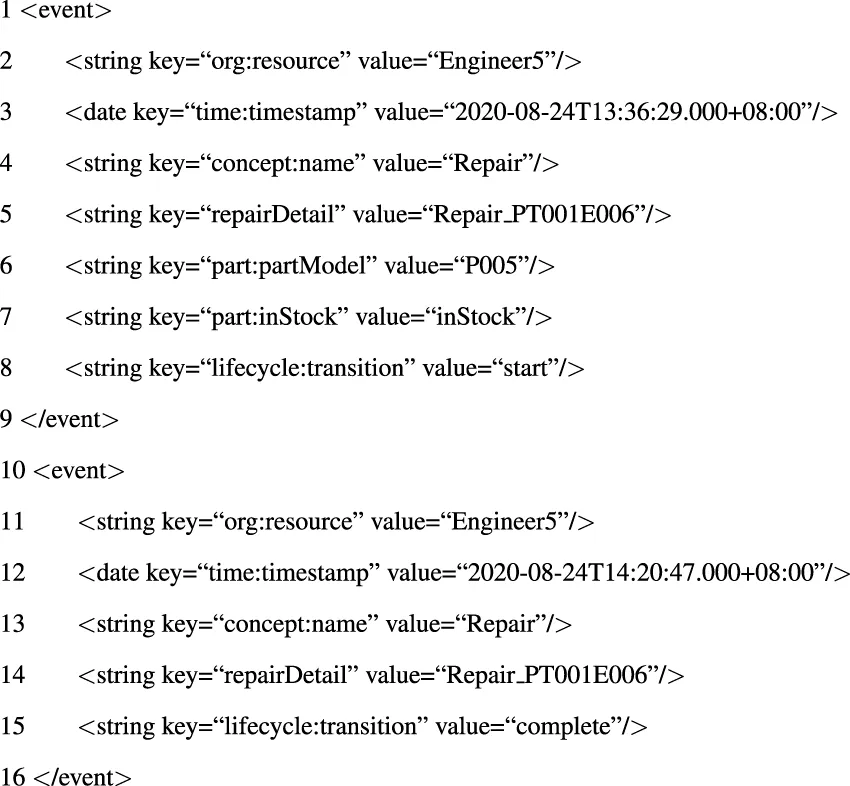
This is an event in a trace, identified by the tag event/event. The key “concept:name” in lines 4 and 13 corresponds to the name of the service task, while the key “lifecycle:transition” in lines 8 and 15 indicates the lifecycle of the activity. The values “start” and “complete” indicate the state of the task. The key “org:resource” in rows 2 and 11 stores the information of the actor, who can also be represented by the key “org:role.” In general, the value corresponding to “org:resource” is the trigger and the main executor of the activity. “org:role” is generally other executors in the activity, which is not present in this event. The key “time:timestamp” in rows 3 and 12 corresponds to the timestamp of the event, which in this case indicates that the “Repair” activity starts at “2020-08-24T13:36:29.000 + 08:00,” and ends at “2020-08-24T14:20:47.000 + 08:00.” The key “repairDetail” in lines 5 and 14 stores the details of the service; in this event “Repair_PT001E006” indicates the repair of error E006 of PT001. Line 6 “part:partModel” stores the code of spare parts. Line 7 “part:inStock” is the status of the spare part. In this activity, the number of parts is adequate, so the value is “inStock.”
5.2 Resource allocation in repair service
The case in this study is based on the principle of FIFO, which prioritizes the allocation process to the orders that arrive earlier.
5.2.1 Knowledge extraction
We obtain the service value chain from the event log of the enterprise through an improved heuristic mining algorithm proposed by Zhou et al. (2021). First, the original event logs are filtered to get the valid service event logs and based on the obtained valid event logs, the causality matrix is mined to extract the actors and value information. After the causal matrix is obtained, the basic and short-period relationship coefficients are calculated to obtain the activity dependency graph. The causal matrix is then combined with actors and value information to construct an activity-actor map, which is combined with domain knowledge and valuable information to further construct an activity-actor-value map, from which a service value chain can be constructed.
With the idea of the improved heuristic mining algorithm, the “Repair” activities in the service value chain are extracted in the form of BPMN as shown in Figure 4. It can be seen that the name of the service, actors, and value information are all extracted. However, the “AvgTime” extracted from the service value chain is the average time of all kinds of “Repair” activities by a certain actor. In addition, the types of parts in the service value chain are also the total set of parts required for certain actors in all types of repairs. Therefore, in this study, the mining algorithm is improved to mine more accurate information on service time and part requirements and then to mine the efficiency of engineers, which can be used as a basis for measuring Te. The efficiency information of engineers is stored in a HashMap structure, where the key is the specific error type, such as “PT001E002”, which is error 2 of product 1. The value is stored in LinkedHashMap, where the key is rID (engineer number). The value is the average repair time of this engineer in seconds, which is composed together with the “repairDetail” to form rCapability of the engineer. The efficiency information in LinkedHashMap is sorted by the ascending order of avg (Te).
FIGURE 4
The result of mining the historical event log is shown in Figure 5. In Repair_PT004E005, there is a significant difference in capability between different engineers, Engineer7 has the lowest efficiency, requiring three times more time than Engineer5 to complete the repair. However, Engineer7 has the highest repair efficiency in Repair_PT004E004, so Engineer7 is better at repairing Repair_PT004E004 compared to Repair_PT004E005. Since the repair efficiency of Engineer7 for the Repair_PT004E005 task is too low to efficiently meet the customer’s needs and the composed service solution cannot provide a quality solution for the customer, the service system will not involve Engineer7 in this kind of task configuration or reorganization when allocating resources.
FIGURE 5
By mining the historical logs, the demand for parts for various error types of different products can be obtained. Considering interviews with Company H, we get that there are three states of parts. If the inventory is sufficient, the waiting time is 0. If the store inventory is insufficient and the parts need to be obtained from the warehouse and the customer needs to wait for 1 day. If there are no parts in the warehouse, the customer needs to wait for 3 days.
5.2.2 Demand integration and service matching
Customers can initiate the demand as well as the service provider can proactively identify the customer’s needs. The service process can be obtained by process mining; if it is customer-initiated demand, it needs to go through the intelligent response first. If the problem is not solved, a manual response is needed. If the problem is still not solved, the service order is formed according to the user description entered into the service system and waits for the service configuration and resource allocation. If demand is generated through the identification of intelligent Netgear, it will be confirmed with the customer and then generate a service order to access the service system.
The speed of order generation is related to various factors, for example, during the peak season for the use of air conditioners; more orders may arrive at the service system within a certain time. This case assumes that 10–50 orders arrive at the system within half an hour in a given month. The subsequent example of 50 orders dynamically generated between 8:00 and 8:30 is used to illustrate the solving process of the PMRA algorithm. The differences in results and efficiency of the PMRA algorithm, Genetic Algorithm, and the Random Resource Allocation Algorithm are compared using 10, 20, 30, 40, and 50 orders, respectively.
As shown in Figure 6, O for PT004E001 is generated at 08:00:12, which is located at “Loc15.” Due to the character of the repair service, the location where the order is generated is consistent with the location where the customer wants to be serviced. Considering the realities of the repair process, engineers usually have all the parts and tools they need for all of today’s orders ready before departure, rather than completing one order and returning to the company to prepare the resources needed for the next. In the actual PSS lifecycle, however, the state of the service system is often elastic, especially for human-related activities and there are often errors in the actual execution (Yip et al., 2019). Therefore, this study proposes the variable of errorTime to measure the uncertainty of an engineer traveling to the next location. When the engineer travels to the next location, the errorTime is used to measure td to better suit the needs of this study’s scenario.
FIGURE 6
The analysis of the service value chain reveals that “Repair” and “Test Repair” are the key activities related to resource allocation. In this case, the heuristic process mining algorithm was used to mine the causality matrix of the process, and the dependency relationship between “Repair” and “Test Repair” was found to be 0.9989, which is a strongly correlated sequential relationship (Weijters et al., 2006). The relationship was further mined by the “Event Name and Resource” classifier of the heuristic algorithm, and it was found that the actors of the “Repair” and “Test Repair” were the same engineer. Therefore, these two activities satisfy the constraints of Eq. 8. Due to their inseparability, these two activities and their logical relationship and required resources can be combined to form a service pattern. Under the constraints of Eqs 9 and 10, the logical sequence relationship in the service pattern is repair (start), repair (complete), test repair (start), and test repair (complete).
5.2.3 Resource allocation
The resources considered in this study in the key activities are mainly divided into two categories, engineers and parts.
As shown in Figure 7, resources provided by different actors are allocated and managed uniformly by accessing the virtual resource pool. The storage structure of P008 is shown on the right. The engineers of different outlets are also stored in the virtual resource pool, waiting for the scheduling of service tasks.
FIGURE 7
This case assumes that the working hours of the engineer are from 8:00 a.m. to 18:00 p.m. For the arriving orders, the supply and demand sides are matched according to Eq. 2. For a certain requirement, engineers whose avg (Te) is less than 30 min directly participate in the service task, and engineers whose avg (Te) is within 30-50 min are sub-optimal resources and participate in the reorganization. Engineers whose avg (Te) is more than 50 min cannot participate in this type of task. They should be configured in more suitable tasks or they can participate in network training before performing this type of service.
After the resources and services are matched to form , the resource and service combinations that are not within the service distance are deleted according to Eq. 3 and is updated. Then arrange the in in ascending order of avg (Te), scan the service schemes in turn, and judge whether all the resources in the service scheme are available according to Eqs 4–7. If all the resources are available, configure the resources and update rSate. If all the in the cannot provide services at the current time, perform wait or reorganization operations. If the wait operation is selected, the system will optimize the shortest time that the order needs to wait for scheduling or join the waiting sequence. After the current time is consistent with the waiting time, the waiting time will be passed into the function to configure the resource and update rState. If the reorganization operation is selected, the sub-optimal resources are allocated according to the schedule and rState. Finally, the resource allocation plan of the order is obtained.
As shown in Figure 8, take Repair_PT004E003 as an example to illustrate the resource configuration result output by the console. The order is generated and arrives at the system at 8:28. The service system configures Engineer3 and P004 for the order. After the configuration is complete, the P004 remaining quantity Nremain is 4. The start time of the service task is 15:27, the end time is 15:56, the service preparation time Tp is 6.998 h, the service execution time Te is 0.478 h, and the total service time T is 7.476 h.
FIGURE 8
The time arrangement and resource allocation results of some orders during the dynamic arrival of 50 orders to the system are shown in Table 2. The last order Repair_PT001E008 needs to wait for more than 1 day. This is because the stock of P002 is insufficient in the store. It needs to contact the warehouse to replenish the inventory. At this time, the warehouse has stock, so it needs to wait 1 day until P002 arrives before the repair service can be carried out.
TABLE 2
| Order | Engineer | Part | Start time | End time | Tp(h) | Te(h) | T(h) |
|---|---|---|---|---|---|---|---|
| Repair_PT004E001 | Engineer6 | P002 | 1 day 8:30 | 1 day 9:06 | 0.500 | 0.611 | 1.111 |
| Repair_PT004E003 | Engineer3 | P004 | 1 day 8:30 | 1 day 8:58 | 0.500 | 0.478 | 0.978 |
| Repair_PT001E007 | Engineer1 | P003 | 1 day 13:41 | 1 day 14:20 | 5.338 | 0.640 | 5.978 |
| Repair_PT002E003 | Engineer3 | P010 | 1 day 14:13 | 1 day 14:57 | 5.850 | 0.746 | 6.596 |
| Repair_PT002E003 | Engineer1 | P010 | 1 day 14:50 | 1 day 15:27 | 6.466 | 0.621 | 7.087 |
| Repair_PT001E008 | Engineer6 | P002 | 2 days 8:30 | 2 days 9:12 | 24.09 | 0.713 | 24.80 |
Part of the service plan.
As shown in Figure 9, it is a graphical display of the service execution scheme obtained according to Table 2. The horizontal axis is the time, the vertical axis is the order type, the blue bar is the service task, the time corresponding to the left endpoint is the start time of the service task, and the time corresponding to the right endpoint is the end time of the service task.
FIGURE 9
The implementation plan can be used in the resource allocation process of Company H, and feedback is continuously collected to update the resource efficiency information to achieve the effect of continuous optimization.
5.2.4 Algorithm comparison
Here, we compare the PMRA algorithm with the random resource allocation algorithm (RRA) and the genetic algorithm (GA) in terms of solution speed and solution quality. Since the consumption of parts is determined after the demand order is determined, this section makes an algorithm comparison under the assumption that the number of parts is sufficient. RRA refers to an algorithm that allocates resources based on the rules of random dispatch. Engineers with historical experience can accept orders. While waiting, the service system will give priority to the engineer who is about to complete the current task. GA is a widely used algorithm in resource allocation (Yao, 2020). This study refers to the idea of solving resource allocation problems through GA proposed by Mezache et al. (2016), using activities as chromosomes and engineers as genes, and measuring fitness through total service time T. We compare the configuration efficiency and configuration results of the three when 10, 20, 30, 40, and 50 orders arrive at the system under the same number of parts, the same order quantity and generation time, and the same order type. As shown in Figure 10, it demonstrates the speed and result of the three algorithms when 10–50 orders arrive at the service system.
FIGURE 10
As shown in Figure 10A, it is a comparison of the speed of the three algorithms. The running time of GA is significantly slower than the other two algorithms under different order scales. With the increase in the number of orders, the solution speed of the three algorithms is increasing, but the solution speed of GA increases the fastest. With the same initial state of variables, GA has the longest running time, and PMRA and RRA have roughly the same running time. In addition to the defect that the GA algorithm itself is slow to solve, GA also ignores the characteristics of the process, which is also one of the reasons for the slow solution speed. For example, when generating the initial solution, GA does not consider resource behavior information, resulting in poor initial solution quality. Figure 10B is a comparison of the solution quality of the three algorithms. PMRA takes about 5–20 h less than GA and about 5–30 h less than RRA. Since PMRA is a dynamic allocation algorithm, resources can be allocated directly to the order when the order arrives in the system, while GA needs to wait for a period of time so that the order can form chromosomes before resource allocation. So GA takes longer than PMRA. Moreover, RRA ignores resource behavior information when dispatching orders and places too much emphasis on the response speed of a single order, resulting in an increase in the overall time-consuming. On the other hand, due to the existence of randomness in GA and RRA, the quality of the solution is very unstable and highly dependent on the initial solution, and GA is also affected by parameter settings.
5.3 Process simulation
After getting the service plan, we integrate Camunda through the Spring Boot framework for process simulation. This case uses the Repair_PT002E010 service requirement as an example to show the simulation process and result. We do not take into account situations where companies actively identify needs in process simulation. Figure 11 shows the service process of Company H. From “Apply Repair” to “Archive,” the service system integrates requirements and resources before assigning orders and allocates resources according to the resource behavior information obtained by process mining. According to the obtained resource configuration results, the following simulation process can be performed.
FIGURE 11
The simulation process is shown in Figure 12. The blue box represents where the activity goes, as shown in 12a, which means the process starts at the “Apply Repair” activity. In the “Release Order” activity shown in 12b, the service system allocates resources to the order. In 12c and 12d, the “Repair” activity involves the transfer of various variables. The variables named “solve” and “repairDetail” are generated in the “Manual Interaction” activity and their values represent whether the manual reply solves the customer’s needs and the type of repair, respectively. Moreover, “engineer” and “part” store the specific resource allocation plan.
FIGURE 12
The start time and end time information of each activity node in the simulation is shown in Table 3. If the start time is the same as the end time, it means that the duration of the activity is very short, which is consistent with the event in which the “lifecycle:transition” key only has the value “complete.”
TABLE 3
| Activity node | Start | End | ||
|---|---|---|---|---|
| Day | Time | Day | Time | |
| Apply repair | 1 | 7:00 | 1 | 7:00 |
| User identification | 1 | 7:03 | 1 | 7:03 |
| Intelligent response | 1 | 7:05 | 1 | 7:12 |
| Manual interaction | 1 | 7:12 | 1 | 7:25 |
| Release order | 1 | 7:31 | 1 | 7:31 |
| Order assignment | 1 | 7:40 | 1 | 7:40 |
| Repair | 1 | 8:30 | 1 | 9:02 |
| Test repair | 1 | 9:02 | 1 | 9:14 |
| Success | 1 | 9:15 | 1 | 9:15 |
| Service evaluation | 1 | 11:37 | 1 | 11:37 |
| Archive | 1 | 11:41 | 1 | 11:41 |
Information of activity nodes.
6 Discussion
In the current service environment, it is difficult to rely on the resources of a single enterprise to meet the service needs of customers. In this study, we mainly refer to the BIRIS mode (Wang and Xu, 2009) and big service (Xu et al., 2019) and propose a framework for PSS considering resources which provide theoretical guidance for resource integration and allocation. We focus on the resource allocation part of the framework, based on process mining technology to analyze and extract service patterns, actor behavior, and resource information from historical service logs to achieve reasonable resource allocation in the service process to meet customer needs. The historical logs contain a wide variety of information about the service process, and here, we only get information that is used to assist in resource allocation. If this data can be analyzed more deeply, it can also be applied to other phases of the framework, for example, customer experience information can be applied to the service evaluation part.
In our proposed innovative resource allocation method, process mining techniques clarify not only the actual process of the service but also the relationships between activities and between activities and participants in the service process. In addition, the combination of domain knowledge and historical behavior and usage information of various types of resources provides the basis for dynamic resource allocation for each service order that arrives. In the actual service process, there are some uncertainties in resource allocation, some of which have been considered in this study, for example, human-related activities are often uncertain (Yip et al., 2019), and this study uses errorTime to measure the uncertainty, some of which have not been considered in this study; for example, we consider that engineers’ working time is continuous, while in fact, there should be rest time in the working time. Subsequent studies can refine these uncertainties in order to enhance the algorithm.
The processing of raw data from service logs is difficult because of the need to shield some sensitive data related to the company’s critical business and private information of customers. In addition, the data set provided by the enterprise is relatively small, which may bring some minor deficiencies. We pre-processed the available data in conjunction with interviews with engineers and domain experts from the company. In this case, the process model obtained from the event log used in process mining will be weakened and the actual business of the enterprise will be more complex. In this study, the focus of using process mining is to clarify the enterprise service process and obtain the relationship between activities and resource efficiency information. Hereby, some other valuable information about the process may be ignored. For example, the efficiency mining in this study is based on the start of repair and the completion of test repair by the engineer, but it does not consider whether the repair is successful or not, that is, it does not consider the situation of restart repair. Because this information may also have some impact on the time-consuming engineer and customer satisfaction, this is a limitation of our algorithm. We should continue to optimize the algorithm.
In the service process resource allocation simulation part of the case study, an allocation result is carried out. Since process simulation is not the focus of this study, the content of this part is relatively simple. However, simulation is a good way to validate the algorithm, and simulation in a visual way can help manufacturing enterprises better understand the allocation of resources in the product−service process. We have now developed some basic simulation tools and can subsequently conduct some more in-depth research in service process simulation.
Although the service system is not limited by time and space when accepting service orders, the repair of air conditioners is limited by time and space, which is closely related to the characteristics of the product and service. Air conditioners are large home appliances and usually require professional engineers to come to the house to repair them when they break down. It is necessary to consider the location where the air conditioner is installed, the available time of the customer, the engineer’s schedule, and the availability of the equipment and spare parts needed for the repair, all of which will have an impact on the service process. In practice, service points and maintenance engineers will be divided into different regions. Considering the service cost, cross-regional repair services are not feasible. From the perspective of the whole service system, the number of service orders is very large. However, the air conditioner repair will be determined according to the location of the air conditioner and completed by the service resources in the region. At the same time, considering customer satisfaction, the order should be fulfilled in the shortest possible time. In addition, according to our survey of H company, more than 90% of the work of air conditioner repair service is spare parts replacement, rather than on-site repair of defective parts. This practice can save a lot of time on site repairs and solves problems faster. Also, the replaced parts can be returned to the partner companies where they were manufactured for further processing. This is the service scenario for which our proposed algorithm is oriented, so it may not be applicable in other scenarios. Therefore, our algorithm has certain limitations in application scenarios or we can extend the algorithm to apply to more service scenarios.
7 Conclusion
In this study, we propose a resource allocation method for the product−service process based on process mining techniques. On the basis of reviewing the literature on PSS, resource allocation, and process mining, we introduce an analytical framework of PSS considering resources, which combines the ideas of BIRIS, cloud computing, and big service. In this framework, we describe the resource allocation problem in PSS, define the concepts of service resource, service order, service pattern, and so on, and establish the mathematical model of resource allocation. Aiming at this mathematical model, taking the event log of the service process as the starting point, this study gives the solution idea and specific implementation steps based on process mining. In the case study, we used the air conditioner repair service event log from the manufacturer as the data set and verified the solution with a Java development program for the resource allocation scenario of the arriving air conditioner repair service order. The results show that the resource allocation method we proposed can shorten the completion time of the service. Finally, one of the configuration results is visualized through process simulation. The main difference from other resource allocation methods is that the method proposed in this study considers the actual execution of the service process in history, which fills the gap of research literature in this field to a certain extent. At the same time, it is also a new attempt to introduce process mining techniques into the resource allocation of service systems.
Although the method we proposed has some obvious shortcomings, as described in the Discussion section, it works well in suitable service scenarios. Therefore, in future work, we will continue to refine and optimize this method, such as considering the flexibility of human resources and rest time, more service scenarios needs, etc. Moreover, the analysis framework of the PSS considering resources proposed in this study includes not only the problem of resource allocation but also other aspects of the service process, which can continue to be focused on and studied in the future.
Statements
Data availability statement
The original contributions presented in the study are included in the article/Supplementary Material; further inquiries can be directed to the corresponding authors.
Author contributions
All authors contributed to the overall methodology investigation and analysis; XZ and YL focused on resource allocation problem modeling and solution design; YL, HZ, and DC completed the collation and analysis of the literature background; XZ, GZ, and DC defined the concept of resources and service and designed the PMRA algorithm; GZ, YL, and XZ organized the case study; HZ and XZ contributed in funding acquisition; XZ and YL wrote the first draft of the manuscript; and GZ and DC edited the final version. All authors have read and agreed to the published version of the manuscript.
Funding
This research was funded in part by the National Key Research and Development Program of China under Grant 2019YFB1707000 and in part by the Natural Science Foundation of Shandong Province under Grant ZR2020MF032.
Acknowledgments
The authors want to thank Yu Tian and Xiaotong Dong for their help in developing the web program for the experiment. They are undergraduates at the Weihai Campus of Harbin Institute of Technology. They also thank the development teams of BPMN-JS and Camunda for providing the open-source development framework. They also thank Gongfu (Qingdao) Technology Co., Ltd. for its support during the research work.
Conflict of interest
The authors declare that the research was conducted in the absence of any commercial or financial relationships that could be construed as a potential conflict of interest.
Publisher’s note
All claims expressed in this article are solely those of the authors and do not necessarily represent those of their affiliated organizations, or those of the publisher, the editors, and the reviewers. Any product that may be evaluated in this article, or claim that may be made by its manufacturer, is not guaranteed or endorsed by the publisher.
Supplementary material
The Supplementary Material for this article can be found online at: https://www.frontiersin.org/articles/10.3389/fmtec.2022.1008805/full#supplementary-material
References
1
AgrawalR.GunopulosD.LeymannF. (1998). “Mining process models from workflow logs,” in International Conference on Extending Database Technology (Springer), 467–483.
2
AlexanderC. (1979). The timeless way of building, 1. New york: Oxford University Press.
3
BrissaudD.SakaoT.RielA.ErkoyuncuJ. A. (2022). Designing value-driven solutions: The evolution of industrial product service system. CIRP Ann.71, 553–575. 10.1016/j.cirp.2022.05.006
4
CookJ. E.WolfA. L. (1995). Automating process discovery through event-data analysis. 1995 17th International Conference on Software Engineering. IEEE, 73.
5
CostaN.PatrícioL.MorelliN.MageeC. L. (2018). Bringing service design to manufacturing companies: Integrating pss and service design approaches. Des. Stud.55, 112–145. 10.1016/j.destud.2017.09.002
6
d’AmbrogioA.ZacharewiczG. (2016). “Resource-based modeling and simulation of business processes,” in SCSC’16. Summer Computer Simulation Conference.
7
GaiardelliP.PezzottaG.RondiniA.RomeroD.JarrahiF.BertoniM.et al (2021). Product service system evolution in the era of industry 4.0. Serv. Bus.15, 177–207. 10.1007/s11628-021-00438-9
8
GoedkoopM. J.Van HalenC. J.Te RieleH. R.RommensP. J. M. (1999). Product service systems, ecological and economic basics. Rep. Dutch Ministries Environ. (VROM) Econ. Aff. (EZ)36, 1–12.
9
HuangZ.HuaiJ.LiuX.ZhuJ. (2010). Business process decomposition based on service relevance mining. IEEE/WIC/ACM Int. Conf. Web Intell. Intelligent Agent Technol. (IEEE)1, 573–580.
10
KangK.ZhongR. Y.XuS. X.TanB. Q.WangL.PengT. (2021). Auction-based cloud service allocation and sharing for logistics product service system. J. Clean. Prod.278, 123881. 10.1016/j.jclepro.2020.123881
11
KimitaK.SuginoR.RossiM.ShimomuraY. (2016). Framework for analyzing customer involvement in product service system. Procedia CIRP47, 54–59. 10.1016/j.procir.2016.03.232
12
KolischR.PadmanR. (2001). An integrated survey of deterministic project scheduling. Omega29, 249–272. 10.1016/s0305-0483(00)00046-3
13
KryvinskaN.KaczorS.StraussC. (2020). Enterprises’ servitization in the first decade—Retrospective analysis of back-end and front-end challenges. Appl. Sci.10, 2957. 10.3390/app10082957
14
MaY.HeZ.WangN. (2019). Proactive project scheduling optimization based on flexible resource constraint. International Conference on Industrial Engineering and Systems Management IESM. 25-27 September 2019. Shanghai, China. IEEE, 1–5.
15
MezacheC.KazarO.BourekkacheS. (20162016). “A genetic algorithm for resource allocation with energy constraint in cloud computing,” in Proceedings of 2016 International Conference on Image Processing, Production and Computer Science. London UK, 62–69.
16
MontO. K. (2002). Clarifying the concept of product service system. J. Clean. Prod.10, 237–245. 10.1016/s0959-6526(01)00039-7
17
PawarC. S.WaghR. (2012). A review of resource allocation policies in cloud computing. World J. Sci. Technol.2, 165–167.
18
StrunkA. (2010). Qos-aware service composition: A survey. 2010 Eighth IEEE European Conference on Web Services. 01-03 December 2010. Ayia Napa, Cyprus. IEEE, 67–74.
19
WangX.WangZ.XuX. (2013). A pattern-based service integration methodology. Intelligent Comput. Appl.3, 1–5+9.
20
WangX.XuH.WangZ.TuZ.XuX. (2022). Efficient method for constructing service solutions based on the supply-demand bilateral patterns. Comput. Integr. Manuf. Syst.28, 864–879.
21
WangZ.XuX. (2009). Bilateral resource integration service mode for value innovation. Comput. Integr. Manuf. Syst.15, 2216–2225.
22
WeijtersA.RibeiroJ. T. S. (2011). Flexible heuristics miner (fhm). IEEE symposium on computational intelligence and data mining (CIDM). 11-15 April 2011. Paris, France. IEEE, 310–317.
23
WeijtersA.van Der AalstW. M.De MedeirosA. A. (2006). Process mining with the heuristics miner-algorithm. Tech. Univ. Eindh. Tech. Rep. WP166, 1–34.
24
WhiteA. L.StoughtonM.FengL. (1999). Servicizing: The quiet transition to extended product responsibility, 97. Boston: Tellus Institute.
25
XuH.ZhuangY.GuH.XuX.ZhangY. (2019). Pattern-based service composition for user satisfaction and service revenue. Int. J. Serv. Technol. Manag.25, 585–600. 10.1504/ijstm.2019.10021905
26
XuX.LiuZ.WangZ.ShengQ. Z.YuJ.WangX. (2017). S-Abc: A paradigm of service domain-oriented artificial bee colony algorithms for service selection and composition. Future Gener. Comput. Syst.68, 304–319. 10.1016/j.future.2016.09.008
27
XuX.MottaG.TuZ.XuH.WangZ.WangX. (2018). A new paradigm of software service engineering in big data and big service era. Computing100, 353–368. 10.1007/s00607-018-0602-0
28
XuX.ShengQ. Z.ZhangL.FanY.DustdarS. (2015). From big data to big service. Computer48, 80–83. 10.1109/mc.2015.182
29
XuZ.ElomriA.ZhangQ.LiuC.ShiL. (2020). Status review and research strategies on product-service supply chain. Proc. Institution Mech. Eng. Part B J. Eng. Manuf.234, 1075–1086. 10.1177/0954405420905199
30
YaoM. (2020). Multi-population genetic algorithm for multi-skill resource-constrained project scheduling problem. Comput. Sci.47, 6. 10.11896/JsJkx.190900123
31
YipM. H.RizviM. A. K.ChewE. (2019). Managing value co-creation: An integrated design framework for service-centric product service system. Portland International Conference on Management of Engineering and Technology (PICMET) (IEEE), 1–13.
32
YuX.ZhanD.NieL.ChuD.XuX. (2010). Flexible resource-constrained resource leveling project scheduling problem. Comput. Integr. Manuf. Syst.16, 1967–1976.
33
ZerbinoP.StefaniniA.AloiniD. (2021). Process science in action: A literature review on process mining in business management. Technol. Forecast. Soc. Change172, 121021. 10.1016/j.techfore.2021.121021
34
ZhangZ.XuD.OstrosiE.ChengH. (2020). Optimization of the product service system configuration based on a multilayer network. Sustainability12, 746. 10.3390/su12020746
35
ZhaoW.LiuH. (2014). Application of process mining in process optimization. Comput. Integr. Manuf. Syst.20, 2632–2642.
36
ZhouX.TanY.ZacharewiczG.LiuY.TanK.ChenD. (2021). Research on value based heuristics miner for product service system. 2021 IEEE 30th International Conference on Enabling Technologies: Infrastructure for Collaborative Enterprises. WETICE. 27-29 October 2021. Bayonne, France. IEEE, 89–94.
37
ZhouX.ZacharewiczG.ChenD.ChuD. (2020). A method for building service process value model based on process mining. Appl. Sci.10, 7311. 10.3390/app10207311
38
ZhuangY.XuH.XuX.WangZ.HeT. (2016). Research on service pattern-based rapid service composition approach. Comput. Eng. Appl.52.
Summary
Keywords
product service system, process mining, product-service process, resource allocation, bilateral resource integration service, service value chain
Citation
Zhou X, Liu Y, Zacharewicz G, Zhang H and Chen D (2022) A resource allocation method of the product−service process based on process mining. Front. Manuf. Technol. 2:1008805. doi: 10.3389/fmtec.2022.1008805
Received
01 August 2022
Accepted
28 September 2022
Published
17 October 2022
Volume
2 - 2022
Edited by
Tomohiko Sakao, Linköping University, Sweden
Reviewed by
Wenyan Song, Beihang University, China
Alexandros Bousdekis, National Technical University of Athens, Greece
Updates
Copyright
© 2022 Zhou, Liu, Zacharewicz, Zhang and Chen.
This is an open-access article distributed under the terms of the Creative Commons Attribution License (CC BY). The use, distribution or reproduction in other forums is permitted, provided the original author(s) and the copyright owner(s) are credited and that the original publication in this journal is cited, in accordance with accepted academic practice. No use, distribution or reproduction is permitted which does not comply with these terms.
*Correspondence: Xuequan Zhou, zhouxq@hit.edu.cn; Yuqi Liu, yuqi_liu@sjtu.edu.cn; Gregory Zacharewicz, gregory.zacharewicz@mines-ales.fr
This article was submitted to Life Cycle Engineering, a section of the journal Frontiers in Manufacturing Technology
Disclaimer
All claims expressed in this article are solely those of the authors and do not necessarily represent those of their affiliated organizations, or those of the publisher, the editors and the reviewers. Any product that may be evaluated in this article or claim that may be made by its manufacturer is not guaranteed or endorsed by the publisher.