
94% of researchers rate our articles as excellent or good
Learn more about the work of our research integrity team to safeguard the quality of each article we publish.
Find out more
ORIGINAL RESEARCH article
Front. Mol. Biosci., 17 October 2023
Sec. Cellular Biochemistry
Volume 10 - 2023 | https://doi.org/10.3389/fmolb.2023.1242879
 Orla Slattery1
 Maria K. Dahle2
 Arvind Y. M. Sundaram2,3
 Barbara F. Nowak4
 Mona C. Gjessing2
 Anita Solhaug2*
Fish gills are not only the respiratory organ, but also essential for ion-regulation, acid-base control, detoxification, waste excretion and host defense. Multifactorial gill diseases are common in farmed Atlantic salmon, and still poorly understood. Understanding gill pathophysiology is of paramount importance, but the sacrifice of large numbers of experimental animals for this purpose should be avoided. Therefore, in vitro models, such as cell lines, are urgently required to replace fish trials. An Atlantic salmon gill epithelial cell line, ASG-10, was established at the Norwegian Veterinary institute in 2018. This cell line forms a monolayer expressing cytokeratin, e-cadherin and desmosomes, hallmarks of a functional epithelial barrier. To determine the value of ASG-10 for comparative studies of gill functions, the characterization of ASG-10 was taken one step further by performing functional assays and comparing the cell proteome and transcriptome with those of gills from juvenile freshwater Atlantic salmon. The ASG-10 cell line appear to be a homogenous cell line consisting of epithelial cells, which express tight junction proteins. We demonstrated that ASG-10 forms a barrier, both alone and in co-culture with the Atlantic salmon gill fibroblast cell line ASG-13. ASG-10 cells can phagocytose and express several ATP-binding cassette transport proteins. Additionally, ASG-10 expresses genes involved in biotransformation of xenobiotics and immune responses. Taken together, this study provides an overview of functions that can be studied using ASG-10, which will be an important contribution to in vitro gill epithelial research of Atlantic salmon.
As the demand for food increases, aquaculture is now providing a greater proportion of fish for human consumption than wild fisheries, with Atlantic salmon (Salmo salar L) being one of the main farmed fish species (Seafish, 2020). Due to this dependence on fish farming, it is important to ensure fish health and animal welfare in aquaculture. However, despite a lot of progress, some fish losses still occur. For example, according to the Norwegian fish health report of 2022, 56.7 million (16.1%) of the farmed Atlantic salmon died after sea transfer in 2022 (Sommerset et al., 2023). The causes of these deaths were many, with gill diseases being part of the explanation. We cannot address issues with gill diseases without good gill models, which are needed to increase the understanding of Atlantic salmon biology.
Gills are a multifunctional organ responsible for gas-exchange and crucial in ion regulation, detoxification of xenobiotics, excretion of waste products and immunity. The gill surface is in direct contact with water and is thus prone to many water-borne agents. Non-infectious agents, such as pharmaceuticals (Chang et al., 2019), environmental toxins (Evans, 1987), toxic microalgae (John et al., 2022) or pollutants and other water quality issues (Sommerset et al., 2023) may compromise the gills and pave the way for infections. Causes of gill disease in Atlantic salmon are diverse with both non-infectious and infectious etiology (Gjessing et al., 2015; Weli et al., 2017; Herrero et al., 2018; Marcos-Lopez Rodger, 2020; Gjessing et al., 2021). The term “complex gill disease” is used to describe gill disease manifestation with a complex histopathological pattern and is often suspected to have multifactorial etiology.
The functional units of the gill are filaments extending in two rows from the gill arch. The filaments have a cartilage core and support rows of thin closely stacked respiratory units - plate-like lamellae, on the ventral and dorsal side of the filament. The lamellae consist of a network of vascular spaces delineated by modified endothelial cells (pillar cells) and covered by sheets of epithelial cells (pavement cells) (Evans et al., 2005). The thin epithelial layer covering the lamella and the counter current flow of blood and water allows efficient removal of carbon dioxide and uptake of oxygen. Further, a number of mitochondria-rich specialized epithelial cells (chloride cells) regulating the chloride and sodium levels, goblet (mucous) cells and neuroepithelial cells are present in the filament epithelium (Speare and Ferguson, 2006). Given this multifunctionality, compromised gills will not only affect respiration, but also impact other important physiological functions.
Today, a huge number of fish are used for experimental studies (Rønning, 2021). However, there is a drive towards reducing these fish numbers, and developing robust, biologically relevant, in vitro models for studies of infectious disease and toxicology (Paparella et al., 2021). In response to this, many fish cell lines have been developed. At the time of writing, Cellosaurus (version 45), the knowledge base of current cell lines used in biomedical research (Bairoch, 2018), listed 912 fish cell lines in its database, including 22 cell lines from Atlantic salmon. From the closely related salmonid, Rainbow trout (Oncorhynchus mykiss L), 77 cell lines were listed including the well-established and widely used gill epithelial cell line RTgill-W1 (Bols et al., 1994). Indeed, the validity and value of using fish cell lines was recently re-enforced with the establishment of an ISO standard (ISO21115) for water quality utilizing RTgill-W1 in a bioassay. This assay was also included in an OECD guideline in 2021 (OECD, 2021). Despite the increased number of fish cell lines developed in recent times, the development of a stable gill cell line from Atlantic salmon has remained elusive. In 2018, two gill cell lines from Atlantic salmon, named Atlantic salmon gill (ASG) −10 and ASG-13 were presented (Gjessing et al., 2018). This study suggested that ASG-10 cells are epithelial while ASG-13 cells are fibroblast-like. Both cell lines were observed to be susceptible to several viruses associated with severe diseases in Atlantic salmon. Our recent study (Solhaug et al., 2022) revealed differences between RTgill-W1 and ASG-10, where RTgill-W1 was far more sensitive to oxidative stress than ASG-10. Whether or not this in-vitro observation is a true reflection of fundamental differences between rainbow trout and Atlantic salmon gills in-vivo, remains to be elucidated.
To further characterize the ASG-10 gill cell line, and assess its value for future in vitro gill research, we have performed functional assays as well as transcriptomic and proteomic profiling, focusing on epithelial cell functions, such as barrier function, ion transport, phagocytosis, immune response, biotransformation and ABC transporters.
The ASG-10 and ASG-13 cell lines were previously developed at the Norwegian Veterinary institute (Gjessing et al., 2018). The cells were grown in Leibowitz´s L-15 Glutamax (Gibco, Thermo Fisher, Waltan, MA, USA) medium supplemented with 10% FBS (USA origin, Gibco), 1% penicillin/streptomycin (Gibco) and 30 µM β-mercaptoethanol (Gibco), at 19°C in a non-ventilated cell culture flask and sub-cultured 1:2 every 10-day following detachment by using trypLE (Gibco). The temperature was chosen to optimize cell growth. For experiments, the cells were plated out at a concentration of 132 000/cm2 using complete cell culture medium without β-mercaptoethanol. The cell lines were routinely checked for mycoplasma infection using the MycoAlert® Mycoplasma detection kit (Lonza, Basel, Switzerland).
To assess for the presence of mucous cells, the cells were seeded in 6-well plates and after 5 days the cells were fixed for 10 min in 4% paraformaldehyde at room temperature, washed with PBS, and stained with Periodic acid-Schiff (PAS), as described in (Suvarna et al., 2019). The cells were visualized with Leica DMIL microscope (Leica, Wetzlar, Germany), equipped with a color camera. For staining for mitochondria-rich cells (chloride cells), the cells were seeded on microscopy polymer coverslips (Ibidi, Gräfelfing) and after 5 days the mitochondria were stained with MitoTracker Red CMXRos (Molecular Probes, Invitrogen; 40 nM) in L-15 culture medium for 20 min at 19°C. The staining solution was replaced with phenol red free L-15 medium (Gibco) and mitochondria visualized by confocal microscopy (LSM710, 63x oil objective, Zeiss; Carl Zeiss Microscopy GmbH, Jena, Germany). For quantitative analyzing of differences in mitochondrial mass, the cells were harvested 5 days after plating (132 000/cm2, as described above), by using TrypLEe and stained with Mitotracker Green for flow cytometric analysis as described by the producer (Molecular probes, Invitrogen), and analyzed by flow cytometry (Accuri C6, BD Biosciences, Franklin Lakes, NJ, USA).
The cells were plated out in 12-well plates (132 000/cm2) the day before the experiment. The cells were then exposed to pHrodo Red E. coli Bioparticles conjugate (Thermo Fisher, Invitrogen) 25 μg/ml, or pHrodo Red Zymosan A Bioparticles conjugate (Thermo Fisher, Invitrogen) 25 μg/ml in complete cell culture media. The particles were non-fluorescent and had neutral pH. As they are internalized through the phagocytic pathway, they became fluorescent as the pH of their surroundings decreased (within acidic lysosomes). After 48 h the cells were washed twice with PBS, counter stained with DAPI (1:1,000, Thermo Fisher, Invitrogen) and imaged using a fluorescent microscope (Echo Revolve microscope, Echo a BICO company, San Diego, CA, USA). For quantification, the cells were harvested by using trypLE, and fluorescence measured by flow cytometry (Accuri C6, BD, Franklin Lakes, NJ, USA).
The cells were seeded on transwell inserts (Costar 0.4 µm polyester membrane; 132 000 cells/cm2) and TER was automatically measured using a CellZscope E (Nano Analytics, Münster, Germany).
The ASG-10 cells were seeded on transwell inserts (1.12 cm2, Costar 0.4 µm polyester membrane; 132 000 cells/cm2) and grown for 1–10 days. The cells were washed once in PBS (Gibco) and fixed with 4% paraformaldehyde (Sigma-Adrich, St-Louis, MO, USA) for 15 min at room temperature. The cells were then washed 3 times with PBS and blocked in 3% BSA (Sigma-Aldrich)/PBS for 60 min at room temperature. The membranes were then cut out from the insert using a scalpel (nr.12) and placed with the ASG-10 cells faced up in a 12-well plastic plate. The cells were then permeabilized using 0.05% saponin (Sigma-Aldrich)/3%BSA/PBS for 10 min and then incubated with a ZO-1 monoclonal antibody (ZO1-1A12, Thermo Fisher; 1:100) in 0.05% saponin/3%BSA/PBS buffer overnight at 4°C. The cells were then rinsed twice with PBS and incubated with a secondary antibody conjugated with Alexa Fluor 488 (AF488 PLUS a-mouse, 1:1,000, Molecular probes) and phalloidin 555 (1:400, Cell Signaling Tec, Danvers, MA, USA) for 1 h at room temperature. The cells were then washed 3 times with PBS, the nuclei stained with DAPI (1:1,000, Molecular probes) in the PBS wash (5 min). The membranes were then mounted between a microscope glass slide and a coverslip with ProLong Gold mounting medium (Thermo Fisher). Confocal fluorescence microscopy was performed using a Zeiss LSM 710 microscope and a ×40 oil objective lens. For ASG-10/ASG-13 co-culture: the ASG-13 cells were seeded on the basolateral side of the transwell inserts (132 000 cells/cm2) as followed: The inserts were placed in a 6-well plate with the basolateral side up. The cells were then seeded on the membrane in 200 μl cell culture medium. After 3 h in the incubator, the cells were attached to the membrane, and the inserts were then flipped and placed with the basolateral side down, and the ASG-10 cells were then seeded in the apical compartment and stained as described above. The immunostaining was done as described above.
ASG-10 and ASG-10/ASG-13 co-culture were seeded on transwell inserts as described in 2.5 and grown for 10 days. TER was measured as described in 2.3 to ensure that the membranes were intact. The inserts were washed with HBSS (Lonza) three times and put into a new 12-well plate. The apical compartment was filled with 500 µl of Lucifer yellow (60 μM, Sigma Aldrich) dissolved in complete L-15 medium, and the basolateral compartment with 1,500 µl L-15 growth medium. The samples were then put on gentle agitation (50 rpm) for 2 h at room temperature. For control, a transwell insert without cells was used. The apical and basolateral medium were diluted 1:10 and the Lucifer yellow fluorescence measured using a plate reader (Spectramax i3x, Molecular devices, San Jose, CA, USA). Lucifer yellow permeability was calculated as described in Frost et al. (2019) and normalized to control.
The cells were plated out in black 96-well plates (132 000/cm2) the day before the experiment. The cells were then pre-incubated in L-15 medium with different ABC transporter inhibitors: PSC833 (Sigma-Aldrich), MK751 (Sigma-Aldrich), Ceefourin (Bio-teche, MI, USA) and Probenecid (Biotinum, Fremont, CA, USA), for 15 min before the addition of Calcein-AM (0.25 µM; Sigma-Aldrich). Calcein-AM was dissolved in L-15 medium with the inhibitors, thus all incubations from this point onwards were carried out in the presence of inhibitors. After 1 h incubation the medium was removed, and the cells lysed with PBS/1% Triton. The cellular Calcein-AM uptake was then measured and quantified using a Spectramax i3x plate reader in fluorescence mode (Ex 494 nm/Em 517 nm). To ensure a representative readout of the fluorescent adherent cells, 37 different points were read in each well by using the well scan function of the plate reader. Caco-2 cells were used as a positive control, showing accumulation of Calcein-AM when using similar concentrations of PSC833 and MK751 as with the ASG-10 cells (data not shown).
The ASG-10 cells were seeded as described in 2.1. For positive control of PGP expression, we used Caco-2 cells. The cells were grown as described in (Ivanova et al., 2018) and confluent cells were used in the experiment. For cell lysis the ASG-10 and Caco-2 were washed twice in ice cold PBS and placed at −70°C until the next day. The cells were then scraped in cell lysis buffer (Cell Signaling Tec, Beverly, MA, USA) added 0.8% SDS and 1% proteinase inhibitor (sigma Aldrich). The samples were then centrifuged (10 000 x g, 1 min) through a QIAshredder (Qiagen, Hilden, Germany) for homogenization. The protein concentrations were quantified by using Bio-Rad DC protein assay kit (Bio-Rad Laboratories Inc., Hercules, CA, USA). Western blotting was performed by using the NuPage Novex system from Invitrogen. For detection of PGP the monoclonal antibody C219 (MA1-26528, Thermo Fisher; 1:180), shown to be reactive against Atlantic salmon (Tribble et al., 2008), was used as the primary antibody, and horseradish peroxidase-conjugated anti-mouse (1:500; Cell Signaling Tec) was used as the secondary antibody. For visualization, chemiluminescence, SuperSignal West Pico PLUS substrate (Thermo Scientific) and Chemidox XRS+ (BioRad, Hercules, CA, USA) were used.
A total of 5 Atlantic salmon parr (Fanad strain) aged 10 months were taken from freshwater tanks where they had been kept under low-light conditions. The median fish weight was 40.5 g (range: 33.4 g). The median fish length was 14.5 cm (range: 3.5 cm). The fish were euthanized with an overdose of Tricaine-methanesulfonate (Merck, Taufkirchen, Germany). Prior to gill excision, the gills were perfused by injection of sterile saline solution through the heart. All 8 gills from each fish were excised and the gill arch was removed using a sterile scalpel. Gills from the left side of the fish were stored in 1 mL of RNA later (Thermo Fisher Scientific, Waltham, MA USA) followed by storage at −80°C until required for further processing. Gills from the right side of the fish were flash frozen in liquid nitrogen, followed by storage at −80°C until required for further processing. ASG-10 cells were seeded in 75 cm2 cell culture flasks (132 000/cm2). Upon confluence, the cells were washed twice in ice-cold PBS and scraped with a cell scraper in 1 ml ice-cold PBS. The samples were centrifuged (600 x g, 4°C, 5 min) and the PBS removed. The samples were then snap frozen in liquid nitrogen and stored at −80°C until required for further processing.
Total protein was extracted and prepared for LC-MS/MS analysis from samples from perfused juvenile salmon gills (n = 5), and from confluent ASG-10 cultures (n = 5). Sample preparation was carried out using the PreOmics iST kit (PreOmics, Martinsried, Germany) according to the Tissue/FFPE sample preparation protocol. Peptide fractions were analyzed on a quadrupole Orbitrap (Q-Exactive, Thermo Scientific) mass spectrometer equipped with a reversed-phase NanoLC UltiMate 3000 HPLC system (Thermo Scientific). Raw data from the Orbitrap Q-Exactive was processed using MaxQuant version 1.6.6.0 for identification of proteins (Cox and Mann, 2008). To identify peptides and proteins, MS/MS spectra were matched to the protein database of ENSEMBL release 99 (Salmo salar). Proteins were quantified using the LFQ algorithm in MaxQuant using default settings (Cox et al., 2014). It should be noted that a fold-change cut-off was not applied to the proteomic data.
The RNA used for RNA-seq analysis were prepared from the ASG-10 cells and gill samples described in Section 2.9. For harvesting ASG-10, the cells were washed twice with cold PBS, lysed in RNEasy lysis buffer (Qiagen, Hilden, Germany) and collected using a cell scraper. DNA was shredded by pipetting 5 times through a 20 G syringe until the sample was no longer viscous. Gill samples stored in frozen RNALater (Merck, Darmstadt Germany) were transferred to 0.5 ml Qiazol (Qiagen) in a 2 ml tube containing a 5 mm stainless steel bead (Qiagen), homogenized on a TissueLyser II (Qiagen) at 24.7 Hz for 2 × 5 min, added 0.1 ml chloroform (Merck), vortexed and centrifuged in a table centrifuge (10 min, 4°C, 10 000 x g), after which the aquatic top phase was collected for further isolation. RNA was isolated from gill and ASG-10 samples using a manual RNEasy total RNA kit (Qiagen) according to the manufacturer’s protocol. Eluted RNA samples from gills or cells were treated with Turbo DNase (Thermo Fisher scientific), and the resulting RNA was quantified on a Multiscan SkyHigh spectrometer (Thermo Fisher scientific), and quality checked on a 4200 TapeStation System (Agilent, Santa Clara, CA, USA) to ensure a RIN value above 8. Samples were then frozen at −80°C until the pure total RNA (1 µg) was sent to the Norwegian Sequencing Center (Oslo University Hospital, Norway) for library preparation and sequencing. Sequencing libraries were prepared using TruSeq mRNA library preparation kit (Illumina Inc., San Diego, CA, USA) following the manufacturer’s protocol. Twelve barcoded libraries were pooled together and sequenced on one lane of a NovaSeq SP flowcell (Illumina Inc.) to generate 150 bp paired-end reads. Raw data from the sequencer were cleaned using bbduk, BBMap toolkit v34.56 to remove/trim low-quality reads and adapter sequences (parameters: ktrim = r k = 23 mink = 11 hdist = 1 tbo tpe qtrim = r trimq = 15 maq = 15 minlen = 36 forcetrimright = 149). Cleaned reads were aligned against the Salmo salar ENSEMBL release 99 genome and annotation information using HiSat2 v2.1.0 (Kim et al., 2019) (parameters: --rna-strandness RF). Reads mapping to the known genes were calculated using FeatureCounts v1.4.6-p1 (parameters: -p -s 2) (Liao and Smythshi, 2013) and the differential expression analysis were carried out using DESeq2 v1.22.1 (Love and Huberanders, 2014) in R v3.5.1 using default settings. For further analysis, both transcriptomic and proteomic identifications were combined into one dataset and a cut-off based on a minimum detection of 10 reads was applied. It should be noted that a fold-change cut-off was not applied to the transcriptomic data. Gene ontology (GO) analysis was carried out using g:Profiler (Raudvere et al., 2019) using the Salmo salar reference dataset.
The data analyses for Figures 5, 6 were performed using Sigma Plot version 14.0. Statistical significance was considered at p < 0.05. The different tests used are specified in the figure legends. For bioinformatic analysis, LFQ values obtained in MaxQuant were imported into Perseus software v1.6.2.3 (Tyanova et al., 2016). Differentially expressed proteins (ASG-10 vs. gills, Table 1) were identified using a two-way Student’s t-test (p < 0.05) followed by Benjamin-Hochberg false discovery rate (FDR) correction. Differential expression analysis for the transcriptome data (ASG-10 vs. gill, Table 1) was carried out using DESeq2 v1.22.1 (Love and Huberanders, 2014) in R v3.5.1 using default settings.
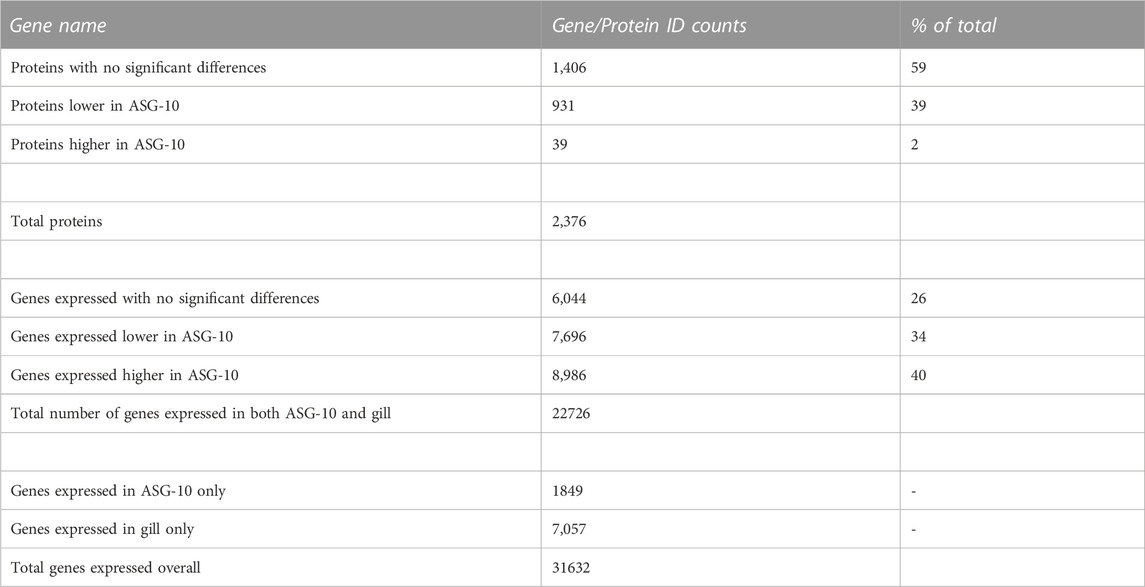
TABLE 1. Summary of proteomic and transcriptomic identifications (gene and protein ID count). p-value cut-off for gene expression analysis < or = 0.05; p-value cut off for protein analysis < or = 0.05. A cut-off based on a minimum of 10 reads was applied to the transcriptomic data. Log 2-fold change (Log2fc) for proteins with significant differences: −0.3 to −4.6 (lower); 0.5 to 5.0 (higher). Log2fc for genes expressed with significant differences: −0.3 to −12.7 (lower); 0.2 to 9.0 (higher).
Figure 1 shows the ASG-10 cells in proliferative and confluent state visualized by phase contrast microscopy. We examined the homogeneity of the cell line by staining the cell population for goblet and chloride cells 5 days after plating. A positive PAS staining would appear as bright pink staining of the whole cell or just the mucous granules in the cell (Smith et al., 2018). In the absence of a mucous cell line from fish and the differences in the methodology in staining of gill tissue and a cell line, a good positive staining control is absent. However, none of the stained ASG-10 cells appears to contain bright pink granuoles (Figure 2A). The seemingly negative PAS staining suggested that no goblet cells were present in the ASG-10 cell culture. Further investigation of the presence of goblet cells, expression of mucins, in the cell culture were done with transcriptomic analysis (Section 3.2.3). To examine the presence of chloride cells, which are specialized mitochondria rich epithelial cells, we used mitotracker red and confocal microscopy to examine the mitochondria in detail. None of the cells appeared to have more mitochondria compared to other cells in the culture (Figure 2B). To investigate further, we quantified mitochondrial mass by staining the cells with mitotracker green and analyzed by flow cytometry. In agreement with the confocal images, only cells with approximately similar mitochondrial mass were detected (Figure 2B). Correspondingly, when examining TEM data from our previous study (Gjessing et al., 2018), no mitochondria-rich cells were observed (data not shown). Thus, the ASG-10 cell line appears to contain neither goblet nor chloride cells.
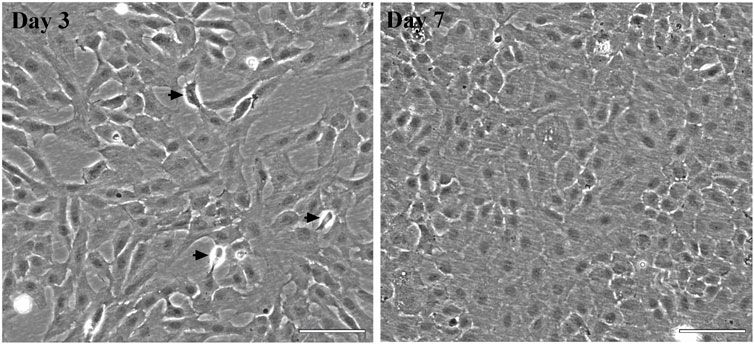
FIGURE 1. Morphology of the ASG-10 cell line. Phase contrast micrographs of representative cultures of ASG-10 cells at day 3 (proliferating) and 7 (confluent) after seeding. Arrows indicate mitotic cells. The images are taken with a phase contrast microscope (Zeiss Observer A1).Scale bar = 100 µm.
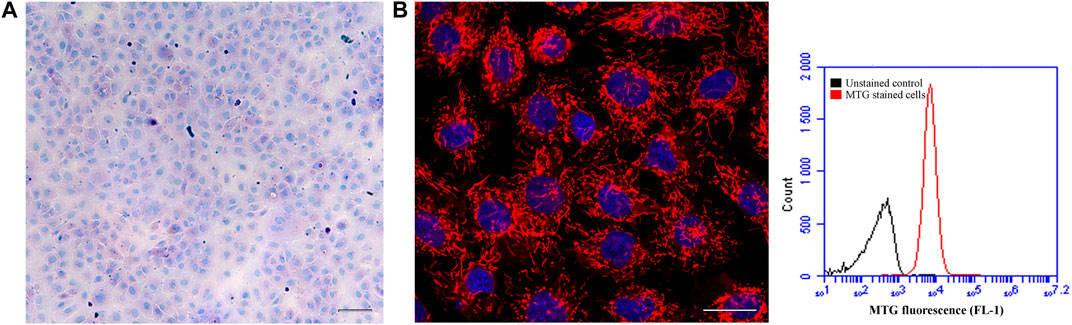
FIGURE 2. The ASG-10 cell line seems to contain neither goblet nor chloride cells. The ASG-10 cells were grown for 5 days. (A) The cells were stained with PAS to identify goblet cells (bright pink) and visualized by bright field microscopy. Scale bar = 100 µm. (B) The cells were stained with mitotracker red to identify cells rich in mitochondria and visualized by confocal fluorescence microscopy. Red = mitochondria, Blue = nuclei. Scale bar = 20 µm. For quantification of mitochondrial mass, the cells were stained with mitotracker green (MTG) and analyzed with flow cytometry. Flow cytometric histograms showing relative amount of mitochondrial mass in each cell are shown.
To investigate the phagocytic activity of the ASG-10 cells, we used two different pHrodo Bioparticles, Zymosan A from yeast cell wall and the gram-negative bacteria Escherichia coli (E. coli), which upon entering the acidic lysosomes become fluorescent. ASG-10 cells were able to take up both particles but E.coli were phagocytosed more efficiently than Zymosan A (Figure 3). This clearly shows that ASG-10 can phagocytize bioparticles, and there is a difference in the uptake of the yeast Zymosan compared to bacteria, which may be due to the involvement of different receptors in the process of phagocytosis.
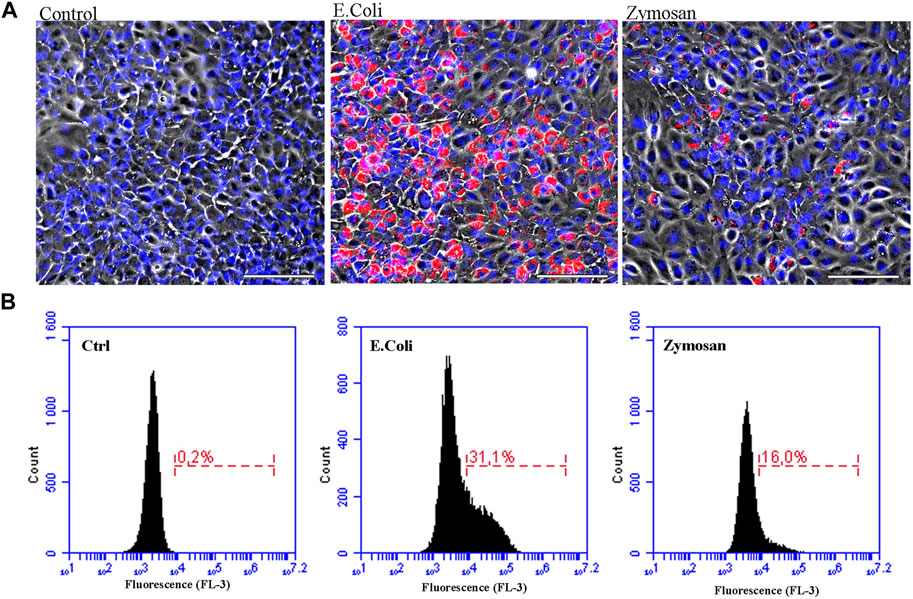
FIGURE 3. The ASG-10 cell line has phagocytic activity. ASG-10 was exposed to pHrodo Red E. Coli or Zymosan A bioparticles (50 μg/ml) for 48 h and analyzed for phagocytic activity by (A) fluorescence microscopy (scale bar = 100 μm, Blue = nuclei, Red = pHrodo particles taken up by the cells) and (B) flow cytometry. Percentage of cells that have taken up particles (red fluorescent cells) are shown.
The formation of a selectively permeable barrier is an important functional characteristic of epithelial cells. Transepithelial electrical resistance (TER) is a widely accepted quantitative measurement of the integrity of a cellular monolayer and tight junction dynamics (Srinivasan et al., 2015). To evaluate the ability of the ASG-10 cells to generate TER, the cells were seeded on transwell membranes, and TER was measured every 2 h for 28 days. During the first 5 days the TER increased and gradually reached a peak after about 8–10 days at approximately 8 Ω * cm2. Then, TER gradually decreased to about 6 Ω * cm2 after 28 days (Figure 4A). Tight junctions are important for the generation of a selective barrier. In the ASG-10 cells, the junctional adapter protein ZO-1 was clearly expressed. At day 1 after plating, ZO-1 staining could be seen both in the cytoplasm and at the outer edges of the cells, while at day 10 it was mainly expressed at cell-cell junctions (Figure 4B), resembling a tight barrier. Thus, the generated TER corresponded to ZO-1 expression and to the increased cell number. Using more complex cell models often enhances the accuracy of extrapolation to the in vivo situation. We therefore made a co-culture of ASG-10 and the Atlantic salmon gill fibroblast-like cell line ASG-13. Here ASG-10 was grown apically and the ASG-13 basolaterally on a transwell membrane (Figure 5A). The ASG-10/ASG-13 co-culture made a confluent layer on each side of the membrane and co-existed well under similar growth conditions. Together the cells generated significantly higher TER compared to ASG-10 alone (Figures 5B, C). The permeability test performed by monitoring the leakage of Lucifer yellow between the compartments showed significant differences from control but there was no difference between ASG-10 alone or the co-culture with ASG-13 (Figure 5D).
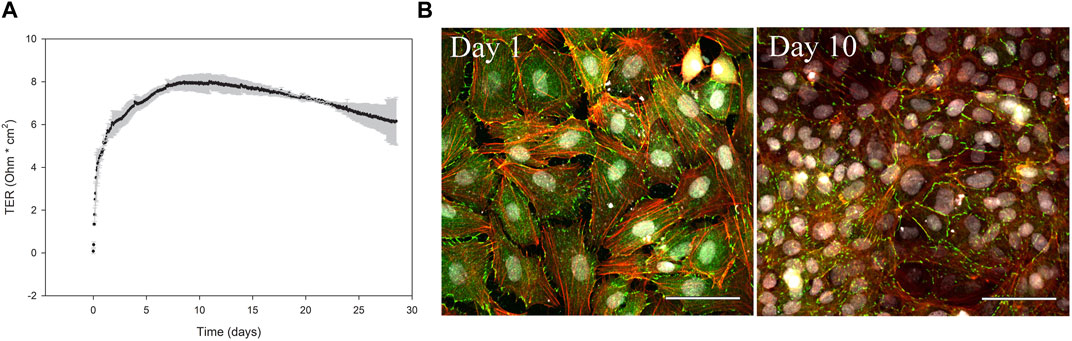
FIGURE 4. ASG-10 generates TER and express the junctional adapter protein ZO-1. ASG-10 was grown on transwell inserts for 28 days. (A) TER was measured every 2 h. Mean ± SD of 4 independent experiments are shown. (B) ASG-10 stained for ZO-1 (green), f-actin (red) and nuclei (grey) after 1 and 10 days following plating and visualized by confocal microscopy.
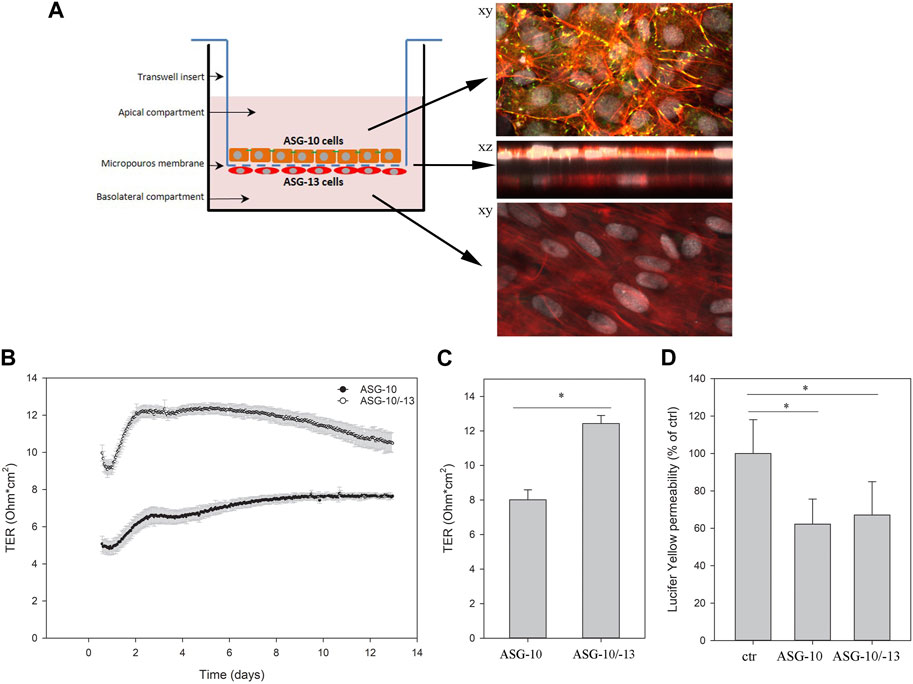
FIGURE 5. ASG-10 grown in co-culture with ASG-13 increased the TER, but had no impact on permeability of Lucifer yellow. ASG-10 was grown in the apical compartment and ASG-13 in the basolateral compartment for 7–14 days. (A) The ASG-10/ASG-13 co-culture were stained for ZO-1 (yellow-green), phalloidin (red) and nuclei (grey) after 10 days in culture and visualized by confocal microscopy. (B) TER was measured every 2 h for 13 days. Mean of three replicates +/- SD are shown. (C) Graph with statistical data are shown for day 7 and represent mean ± SD of 3 independent experiments. Statistical significance between the groups (p < 0.05, indicated by *) was assessed using paired t-test. (D) Permeability of Lucifer yellow. The data represent mean ± SD of three - five independent experiments. Statistical significance between the groups (p < 0.05, indicated by *) was assessed using 1-way ANOVA, mixed-effects analysis and Holm-Sidaks post-test.
The current knowledge of the presence of ABC transporters in gills is sparse, however a recent study on Rainbow trout suggested functional ABC transporter activity in the gills (Kropf et al., 2020). Therefore, we wanted to investigate ABC transporter activity in the ASG-10 cell line using an ABC transport assay. Calcein-AM is a cell permeable dye and a substrate for several efflux transporters. It easily diffuses into the cells, where the ester bond is cleaved by esterases to calcein, which is fluorescent. Several transporters extrude Calcein-AM from the plasma membrane. However, when these transporters are inhibited, more Calcein-AM enters the cells. Transporter activity is therefore indicated by an increase in the accumulation of Calcein-AM in the cells in the presence of an inhibitor. Several known transporter inhibitors were tested, namely PSC833 (PGP/multidrug resistance protein-1 (MDR1)/ABCB1 inhibitor), (Tai, 2000), MK751 (multidrug resistance-associated protein 1 and 4 (MRP1/4), (Hofmann et al., 1995; Chen and Leekruh., 2001; Reid et al., 2003), ceefourin1 (MRP4 inhibitor), (Cheung et al., 2014), and probenecid (MRP/organic-anion transporter inhibitor) (Gollapudi et al., 1997). Interestingly, only probenecid showed a significant increase in accumulation of Calcein-AM (Figure 6A). Furthermore, the lack of PGP protein expression in the ASG-10 cells, as determined by western blotting using the C219 monoclonal antibody (Figure 6B), corresponds to the unresponsiveness of the PCS833 inhibitor in the Calcein-AM assay.
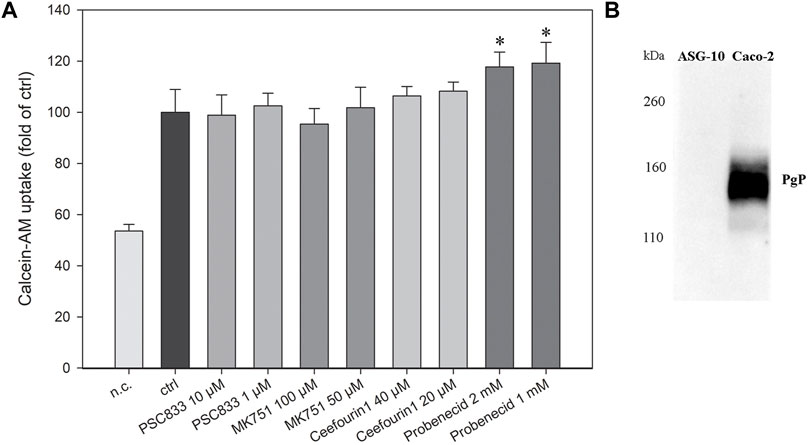
FIGURE 6. Characterization of efflux transport proteins in ASG-10 by using specific inhibitors and the Calcein-AM transport assay. (A) The ASG-10 cells were treated with different efflux transport protein inhibitors (PCS833: PGP/MDR1/ABCB1-inhibitor, MK751: MRP1/4-inhibitor, Ceefourin1: MRP4-inhibitor, Probenecid: MRP/organic-anion transporter inhibitor) and transport during 1 h measured by the Calcein-AM transport assay. n.c= negative control. The data represents mean ± SD of four independent experiments. Statistical significance between the groups (p < 0.05, indicated by *) was assessed using 1-way ANOVA with Holm-Sidaks post-test. (B) Pgp (141 kDa) expression in ASG-10 and Caco-2 (positive control) measured by western blot.
The total number of protein identifications from the initial MaxQuant mass spectrophotometric data output was 4,112. Following preliminary processing, the total number of proteins detected and compared in both ASG-10 and gill was 2,376. The majority of these proteins (1,406; 59%) were present at similar levels in the cell line and gill (p > 0.05; Table 1). Thirty-nine proteins (2%) were detected at a higher level in ASG-10 cells relative to gill, with 931 proteins detected at a lower level (39%; p < 0.05).
RNA-seq produced 42 million 150 bp pair-end reads on average for each sample. More than 98% of reads survived pre-processing and the resulting 90% of the clean reads aligned to the Atlantic salmon genome (Supplementary Table S1). The total number of genes detected and compared in both ASG-10 and gill was 22,726. A smaller proportion of genes were detected at a similar level in cells and gill (6,044; 26%; p > 0.05). A total of 8,986 genes (40%) were detected at a higher level in ASG-10 cells, compared with 7,696 detected at a lower level (34%; p < 0.05). The total number of genes detected in ASG-10 only was 1849. The total number of genes detected in gill only and not in ASG-10 was 7,057.
To gain greater insight into the similarities and differences between ASG-10 and gill, GO analysis was performed using g:Profiler. Separate analyses were carried out for both the transcriptomic and proteomic datasets (using corresponding gene ids). The top 10 molecular functions and biological process terms that emerged from the analysis of each dataset are presented in Supplementary Figure S1.
The top 10 KEGG terms for the transcriptome data comparison between gills and ASG-10 cells, presented as a function of decreasing enrichment score (represented as–log10[padj]), are displayed in Figure 7, with additional comparisons included in Supplementary Figure S2. The KEGG term with the greatest enrichment score for the gene expression detected at a lower level in ASG-10 was necroptosis, which relates to cell death (Figure 7A). In addition, multiple cell signaling pathway terms, including those associated with immune and inflammatory responses, such as the NOD-like receptor, C-type lectin receptor and MAPK signaling pathway, were associated with lower detection levels (Figure 7A).The most significant terms associated with higher detection levels in ASG-10 compared with gill were those associated with the proteasome (proteolysis), the ribosome (translation), the spliceosome (RNA splicing) and DNA replication (Figure 7B). At the lower enrichment score level, DNA repair and surveillance were evident.
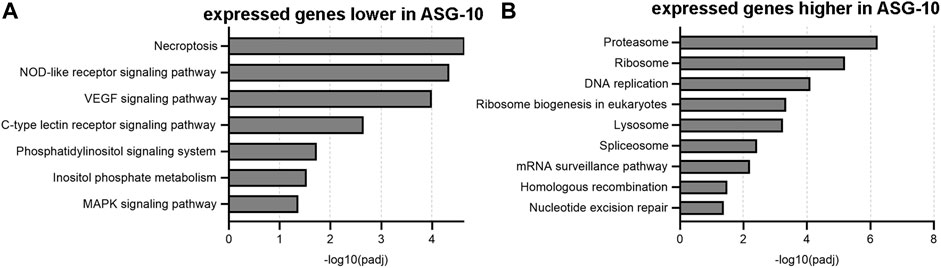
FIGURE 7. Summary of KEGG terms ranked according to the enrichment score (-log10padj value). (A) KEGG terms emerging from 7,696 genes expressed at significantly lower levels in ASG-10. (B) KEGG terms emerging from 8,986 genes expressed at significantly higher levels in ASG-10. The higher the enrichment score value, the more significant the pathway is for the given set of genes.
The proteomic data showed differences in proteins involved in housekeeping functions like metabolic pathways and protein synthesis and degradation (Supplementary Figure S2). The number of proteins detected at a higher level in ASG-10 compared with gill was limited (39 proteins). Twelve proteins were detected with a fold change of greater than or equal to 1.5. Of these, 4 were components of respiratory chain proteins including NADH:ubiquinone oxidoreductase subunit B1, cytochrome b-c1 complex subunit Rieske mitochondrial-like, NADH dehydrogenase and cytochrome c. Two were involved in actin severing, namely scinderin like b and cofilin-2-like. Other proteins within this group included a POU domain-containing transcription factor, a translation machinery protein and splicing factor proteins.
Expression of genes associated with the Fanconi anemia pathway, known to control repair of damaged DNA (Peake and Noguchi, 2022), appeared to be consistent in both the cell line and gill (Supplementary Figure S2). It appeared that expression detected only in ASG-10 involved biological transport functions, particularly ion transport. Cellular adhesion function also emerged. In line with this, molecular functions related to cation transporter activity, channel activity and passive transmembrane transporter activity were evident in ASG-10 (Supplementary Figure S1).
The ASG-10 cell line does not seem to contain mitochondrion-rich chloride cells (Figure 2B), but ion transporters of the Na+/H+ exchanger (NHE), solute carrier (SLC), NaCl co-transporter (NCC), Na+/K+-ATPase (NKK), or V-type ATPase (V) families may also be present in pavement epithelial cells, so the transcriptomic and proteomic datasets were interrogated to focus on ion transporters (Table 2). Expression of several Cl/HCO3− anion exchanger genes from the SLC4a and SLC26a families were detected in ASG-10, most at a similar or higher level in the cells compared with gill. Transcription of 3 members of the SLC4a family were found in ASG-10 only. Similarly, the majority of NHE genes were expressed at similar or higher levels in ASG-10 compared with gill, with transcription of only one NHE-3-like gene detected in the cells only. No NCC transcripts or proteins were seen in ASG-10. Expression of 3 NKK α-subunits (α1, α3 and α3-like) along with 3 of the β subunits (β-3-like, β-233 and β-233-like) were detected, albeit at a lower level in ASG-10 compared with gill. The only exception was the β-3-like, which were detected at a significantly higher level in the cells. Expression of some genes of the V-type ATPase were detected. These genes encoded the membrane-associated V0 subunits (a, c, d and e) and membrane-embedded V1 subunits (A, C, D, E and F). The V1, E1-like and F protein subunits of the ATPase were also detected and were present at a similar level in both cells and gill.
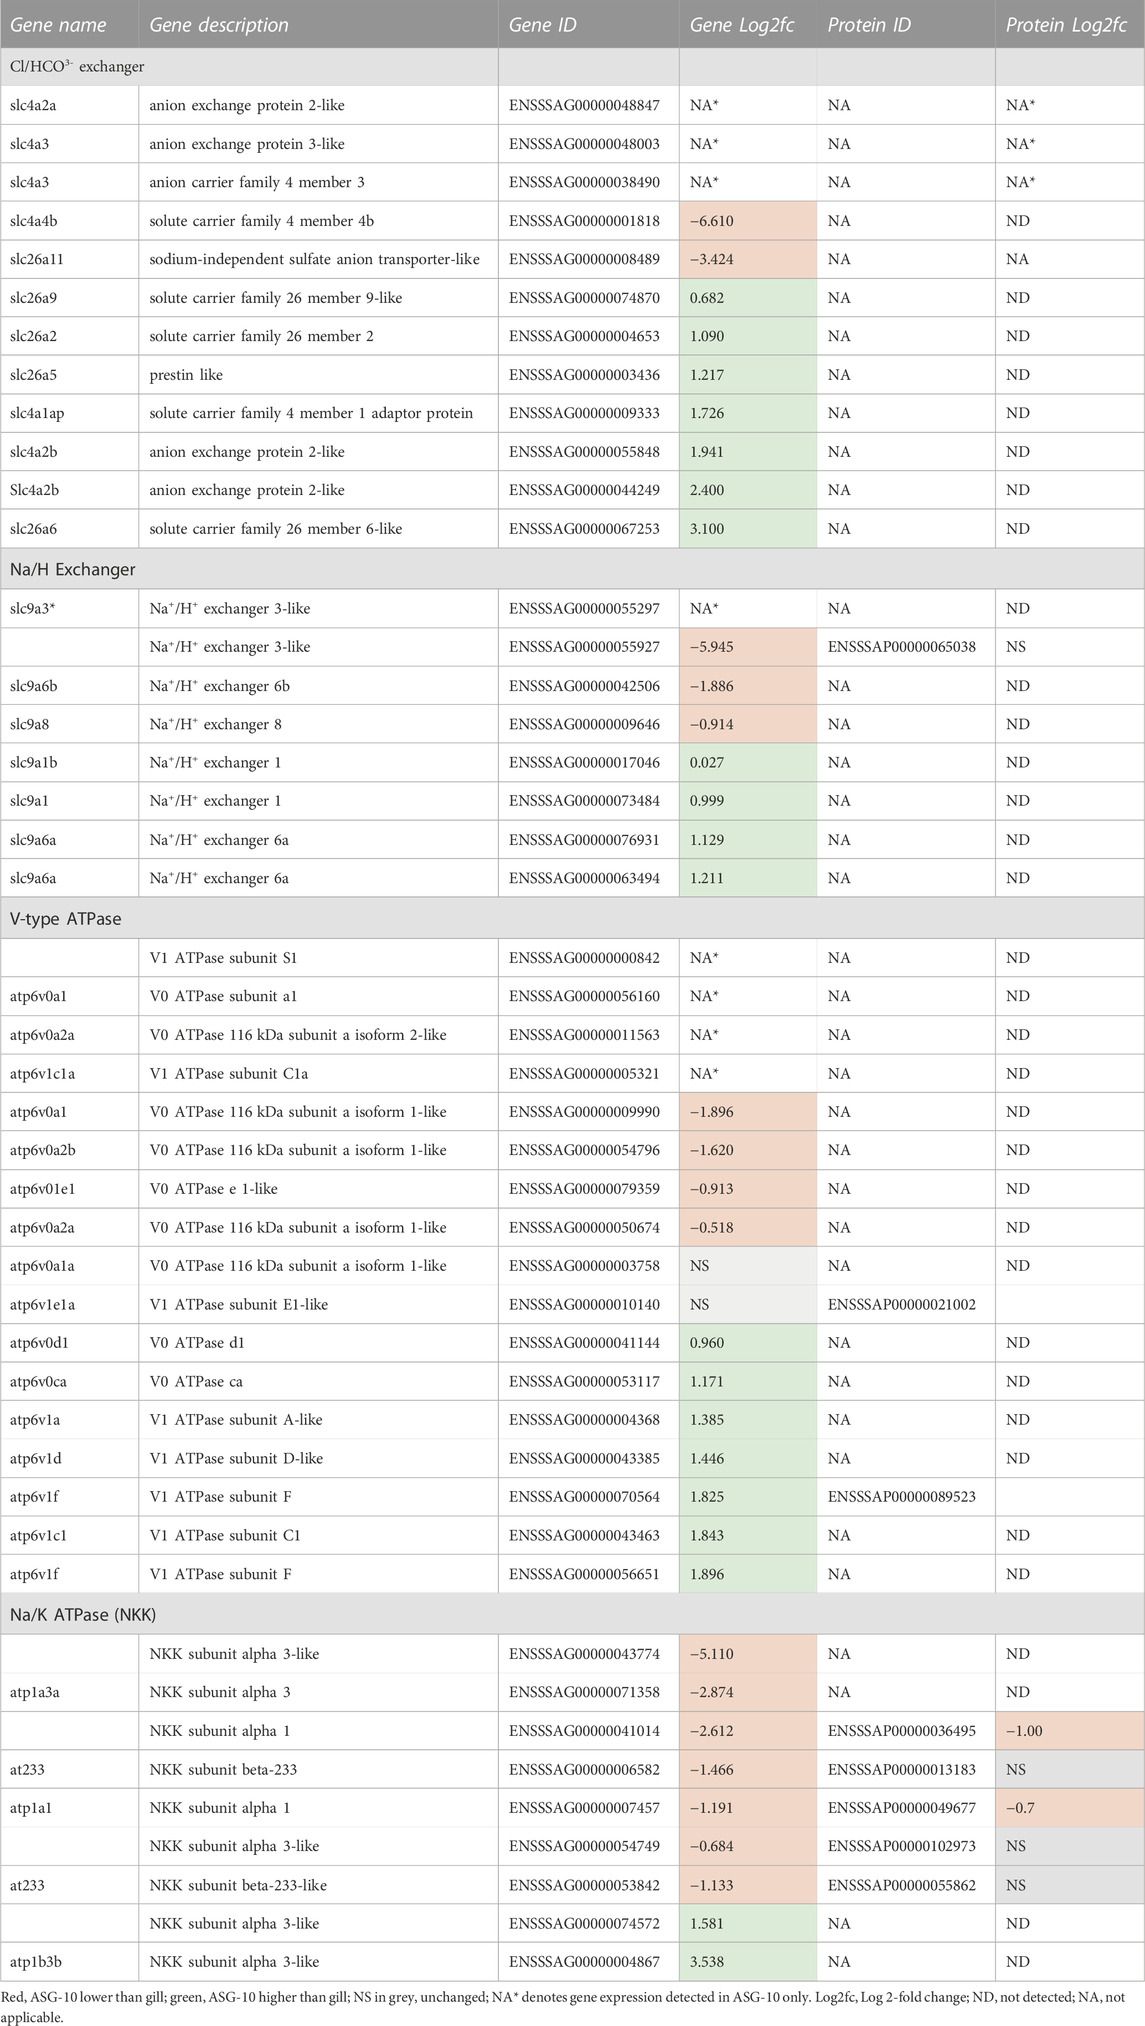
TABLE 2. Profile of ion regulatory gene expression and proteins detected in ASG-10 relative to gill. Log2fc for protein with significant differences: −0.3 to −4.6 (lower); 0.5 to 5.0 (higher). Log2fc for genes expressed with significant differences: −0.3 to −12.7 (lower); 0.2 to 9.0 (higher).
Several mucin-like genes were expressed in ASG-10 (Table 3). The majority of these were expressed at a lower level in the cells compared with gill. Some mucin genes, however, were expressed only in ASG-10, including one mucin-2-like, a mucin 5AC like and a mucin 13-like. A mucin-17 like gene was expressed at a moderately higher level in ASG-10. It should be noted that no mucin proteins were detected in the proteomic data set.
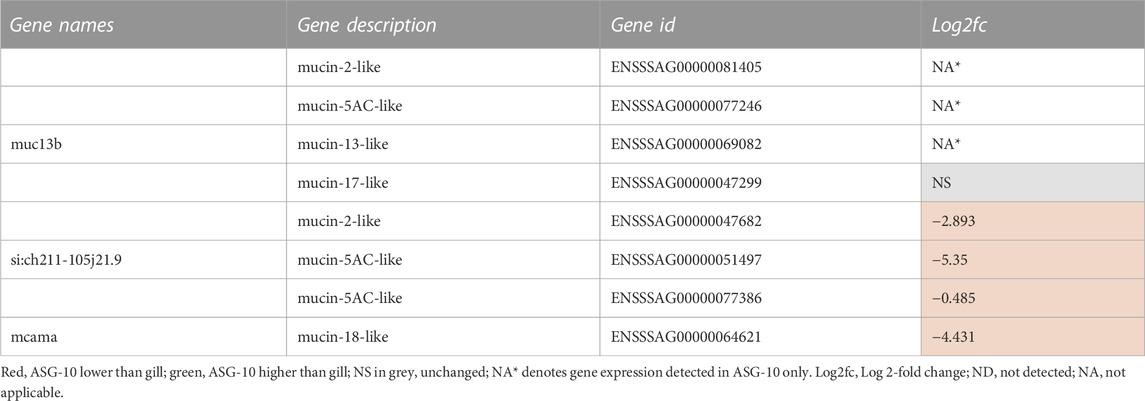
TABLE 3. Profile of mucin gene expression detected in ASG-10 relative to gill. Log2fc for genes expressed with significant differences: −0.3 to −12.7 (lower); 0.2 to 9.0 (higher).
The ASG-10 cells were more efficient in phagocytosis of E.coli compared to Zymozan A (Figure 3), which led us to investigate phagocytic receptors and opsonins. Clathrin heavy and light chain genes were expressed at a similar or higher level in cells compared with gill as were several dynamin 1 and 2 genes. The corresponding protein subunits were detected at slightly lower levels in the cells compared with gill. mRNA expression of several mannose binding lectins (mannose binding lectin 1, mannose binding lectin 2-like) was detected at higher levels in ASG-10 compared to gill while transcription of the mannan binding lectin serine peptidase 2 was detected in ASG-10 only (Table 4). The levels of many C-type lectins, galectins, fucolectins and sialic acid binding Ig-like lectins varied in the cells compared with gill, with some variants higher in ASG-10 and others higher in gills. Interestingly, high levels of transcription of a fucolectin 6-like gene were detected in ASG-10 only, along with CLEC 19A and some other lectins belonging to the mannan binding lectin, galectin and collectin families. Several C-type lectin domain family members were either absent from ASG-10 or dominated in gills (Table 4).
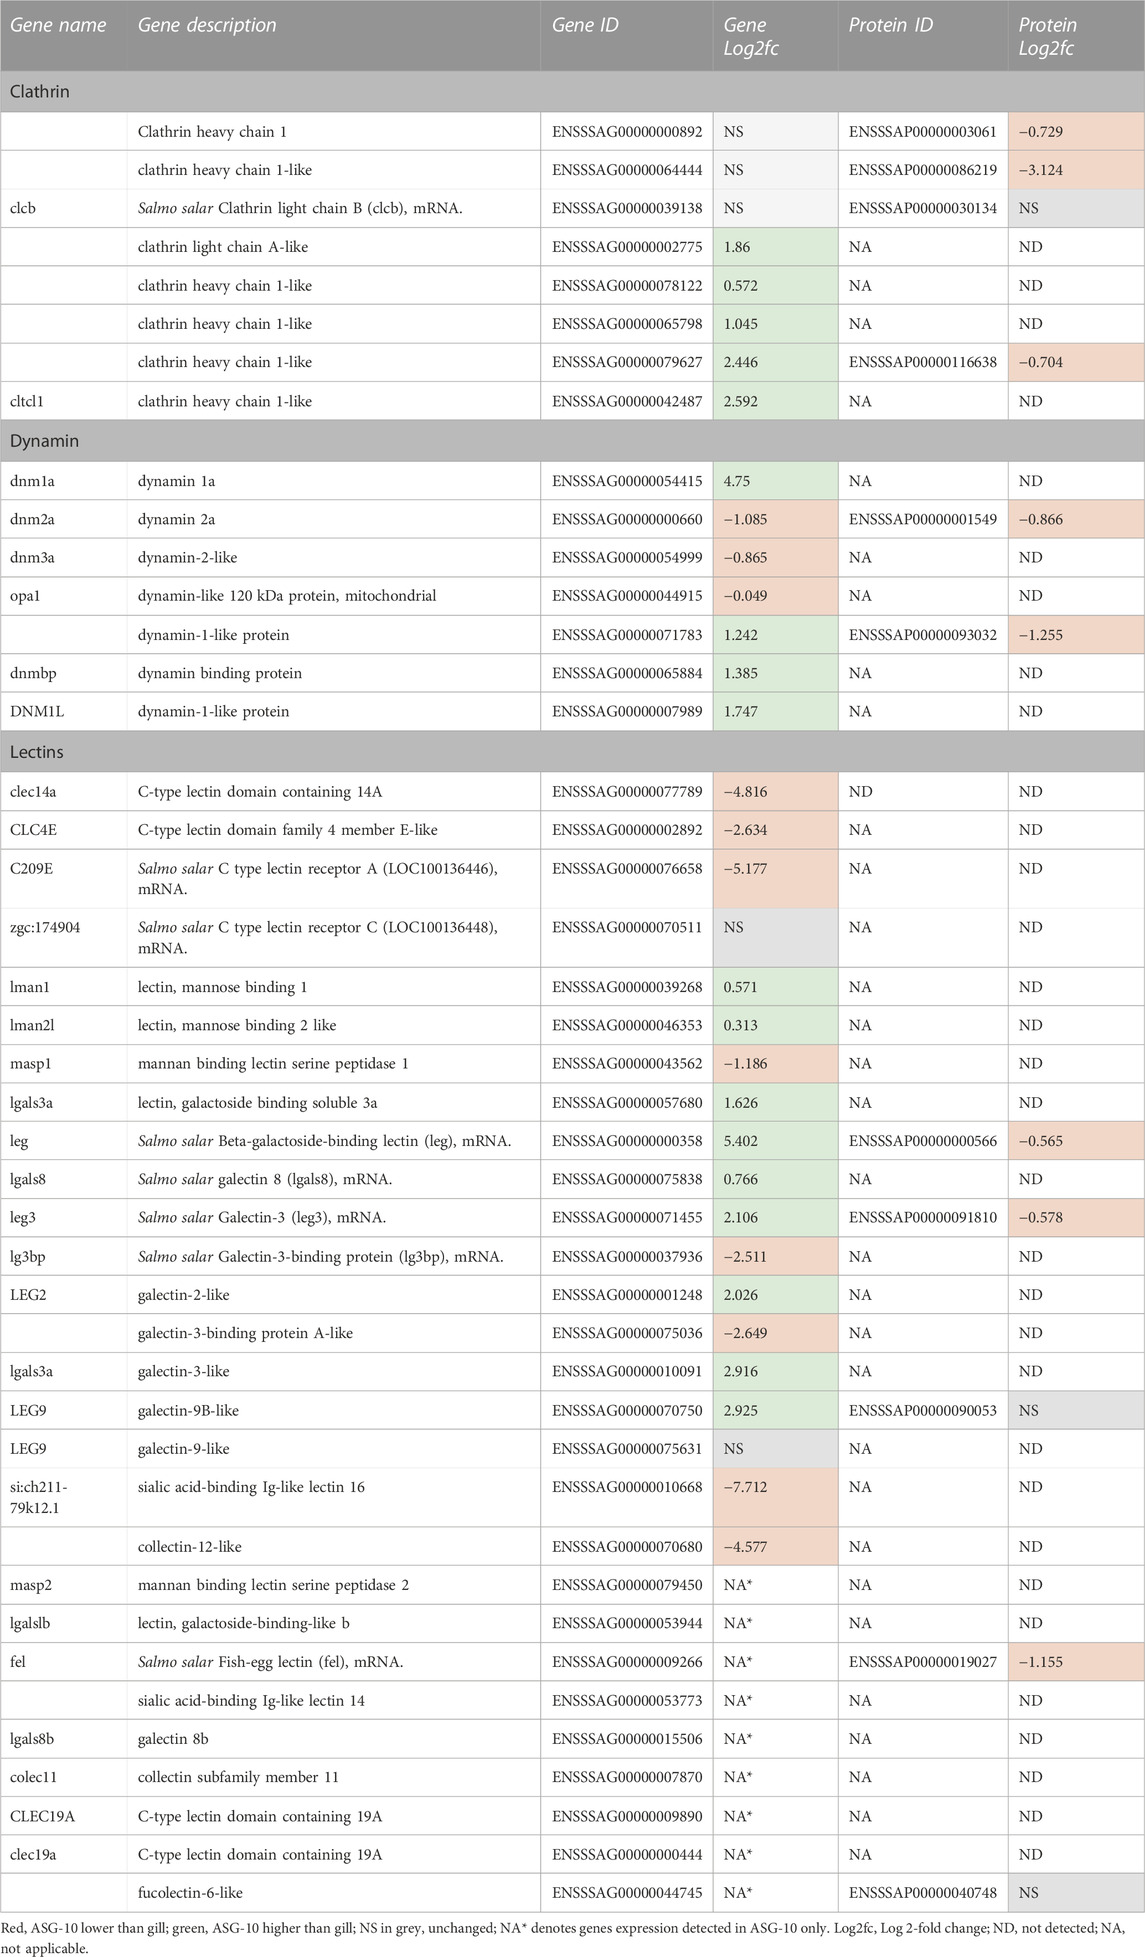
TABLE 4. Profile of phagocytic gene expression and proteins detected in ASG-10 relative to gill. Log2fc for genes expressed with significant differences: −0.3 to −12.7 (lower); 0.2 to 9.0 (higher).
Eight interleukin (IL) genes were expressed in ASG-10, the majority of which (IL-34, pro-IL-16-like, IL-12 β subunit-like and IL-18) were detected at lower levels in the cells compared with gill (Log2fc between −4 and −1.6, Table 5). In contrast, IL-34-like and IL-8-like gene expression was detected at higher levels in the cells and additional IL-12 β-subunit-like and IL11a genes were expressed in ASG-10 only. Both mRNA and protein corresponding to Pro-IL-16 were detected. The Pro-IL-16 protein was present at similar levels in ASG-10 and gill. Expression of receptor subunits (mRNA only) for IL-1, IL-4, IL-6, IL-10, IL-11, IL-12, IL-13, IL-15, IL-17, IL-20 and IL-21 was found in ASG-10. Among these, IL-1 receptor type 1-like, IL-20 receptor subunit β-like and two IL-6 receptor β-like mRNA were detected at significantly higher levels in ASG-10 compared with gill. mRNA from three toll-like receptor (TLR) genes were detected in ASG-10, namely TLR-5 which was detected at higher levels in ASG-10 cells compared with gill (Log2fc 2.8), as well as TLR-18 and TLR2 type-2, both of which were found in the cells only. The corresponding proteins were not found in the proteomics dataset. Nucleotide-binding oligomerization domain-containing (NOD) 1 and 2 mRNAs were detected in ASG-10, both lower in the cells compared with gill, however NOD-2 mRNA was found in ASG-10 cells only. Interestingly, expression of 2 suggested pan B-cell marker genes: IL-22-like and IL79A-like were detected in the ASG-10 cell line, albeit at lower levels compared to gill. Antimicrobial peptide (AMP) mRNAs were also present in ASG-10. Cathelicidin mRNA was detected at a lower level in the cells (Log2fc −4.2), as was NK-lysin mRNA (Log2fc −5.2), whereas hepcidin-1 mRNA was detected at slightly higher levels (Log2fc 1.3). AMP 2-like peptide mRNA, annotated as “liver-expressed”, was detected in ASG10 cells only. Other AMPs such as defensins, were not detected. Regarding other markers of innate immunity, expression levels of serum amyloid A-like and the pentraxin related C-reactive protein genes were similar in both cells and gill, whereas pentraxin-related PTX-3-like mRNA was detected in ASG-10 cells only (data not shown).
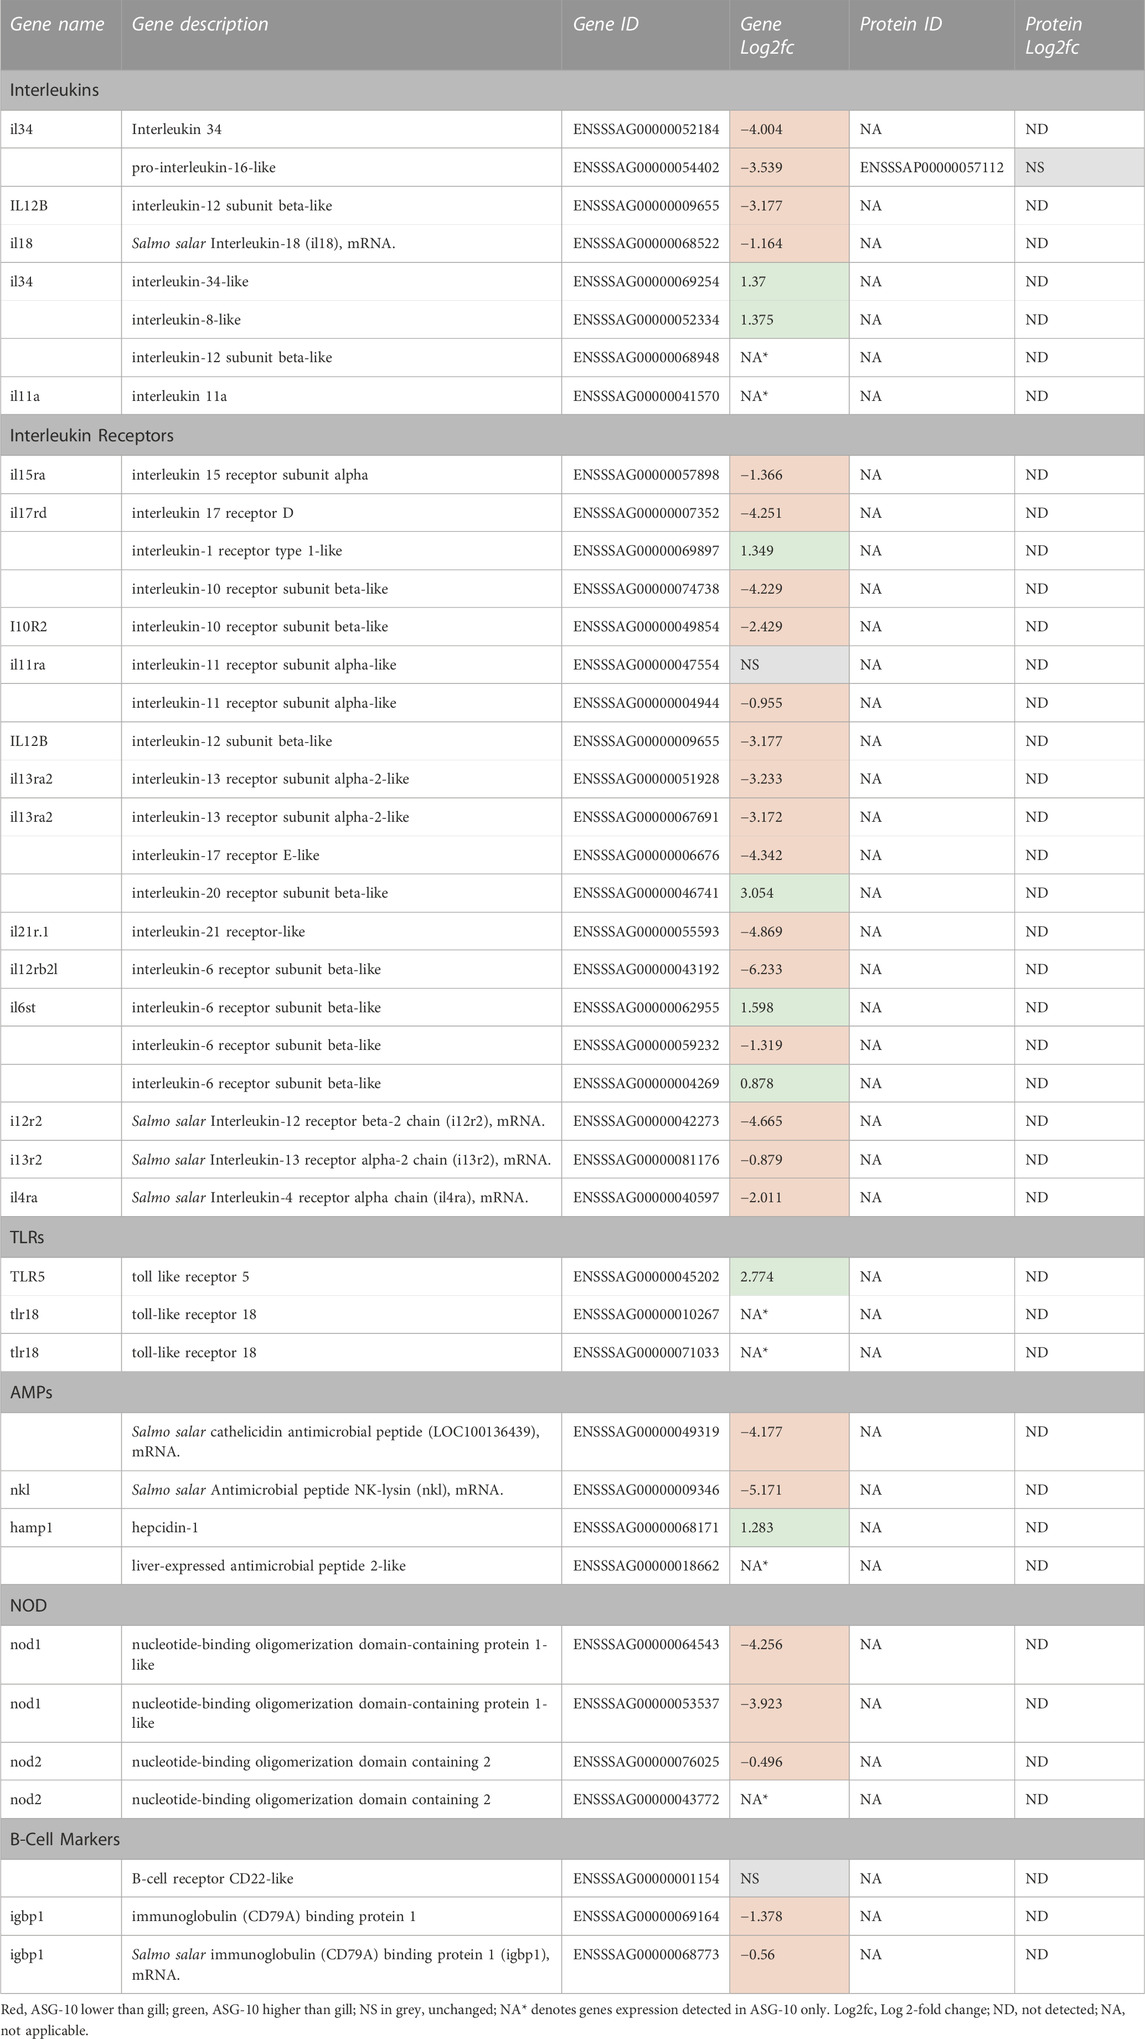
TABLE 5. Profile of immune gene expression and proteins detected in ASG-10 relative to gill. Log2fc for genes expressed with significant differences: −0.3 to −12.7 (lower); 0.2 to 9.0 (higher).
Adherent junction and tight junction proteins are integral to the function of epithelial cells. It was therefore important to evaluate their presence in ASG-10 at both RNA and protein level and their variation between the cells and gill. Supplementary Table S2 shows the overview of the tight junction mRNAs and proteins including claudin, occludin, integrin and the major adherent junction transmembrane protein e-cadherin mRNAs and proteins detected in both ASG-10 and gills. Expression of 117 adherent and tight junction genes were detected and most were found at a higher level in ASG-10 compared with gill (transcripts from 42 genes [36%]). From these, 38 genes (32%) were expressed at a lower level, with a lower number expressed at a similar level (transcripts from 10 genes [9%]). Twenty-seven proteins (23%) were detected only in ASG-10. A total of 67 cadherin genes were expressed in ASG-10. The majority of those were detected at a higher level in the cells compared with gill and 22 were detected in ASG-10 only. Cadherin-13-like and two β-cadherin-like proteins were found in the corresponding proteomics dataset and all 3 were detected at a similar level in both cells and gill. A small number of claudin genes (11) were expressed in ASG-10. Of these, most were expressed at a higher level in the ASG-10 cells and 3 were expressed in ASG-10 only. There were no corresponding claudin proteins detected in the proteomics dataset. A larger number of integrin genes (35) were found expressed in ASG-10 and the majority of these (19) were expressed at a lower level in the cells. The corresponding protein for integrin β-2, integrin α-1-like, integrin β-1-like and integrin subunit β-4 were found in the proteomics dataset. Only integrin subunit β-4 was expressed at a slightly lower level in the cells. All other integrin proteins were detected at a similar level in cells and gill. Transcription of integrin-β-8 was detected only in the ASG-10 cells. Transcription of only 3 zonulae occluding (ZO) genes were found in the data, all coding for a ZO2-like protein and all were detected at a lower level in ASG10 compared with gill. However, the corresponding ZO2 protein (ENSSSAP00000088444), had a modest positive Log2fc of 1.4. Only one occludin gene was found expressed in ASG10 only.
The P450 genes expressed were mainly from the cyp2 family, including cyp2K1-like, cyp2F2 and cyp2M1, which were detected in ASG-10 only. However, levels of cyp1A1 differed most between the cells and gill and were considerably lower in ASG-10. Other cyp mRNAs detected at a lower level in the cell line included: cyp4, cyp27 and cyp120 (Table 6). Transcription levels of cyp 20A1-like and cyp3A27-like were similar in ASG-10 and gill. Cyp genes expressed at a higher level in ASG-10 were of different types, with 2 cyp2, 2 cyp51, a cyp20 and a cyp11 family member included in this cohort. The majority of phase II biotransformation genes expressed in ASG-10 (Table 6) were from glutathione S-transferase (GST) (10), followed by uridine 5′-diphospho-glucoronyltransferase (UGT; 4) and finally cytosolic sulfotransferase (SULT; 1). The ugt1a1 gene was expressed at a modestly lower level in the cells compared with gill. Its corresponding protein was also detected at a moderately lower level in the cells (Log2fc −0.7). Transcription of ugt5g2 and ugt1b7 was detected in ASG-10 only. Transcription of only 1 SULT gene was detected in ASG-10 cells, namely cytosolic sulfotransferase 3 (st1s3). The corresponding protein was also detected. Ten GST genes were also expressed in the cell line with 4 at a lower level, 5 at a similar level and 1 expressed at a modestly higher level in the cell line compared with gill. Three GST proteins were detected in the proteomic analysis, namely GST theta-1-like, GST omega-2 and GST-P. GST theta-1-like protein was present at a similar level in both cells and gill. GST omega-2 and GST-P proteins were present at a modestly lower level in ASG-10 cells (Log2fc of −1.0 and −0.8 respectively).
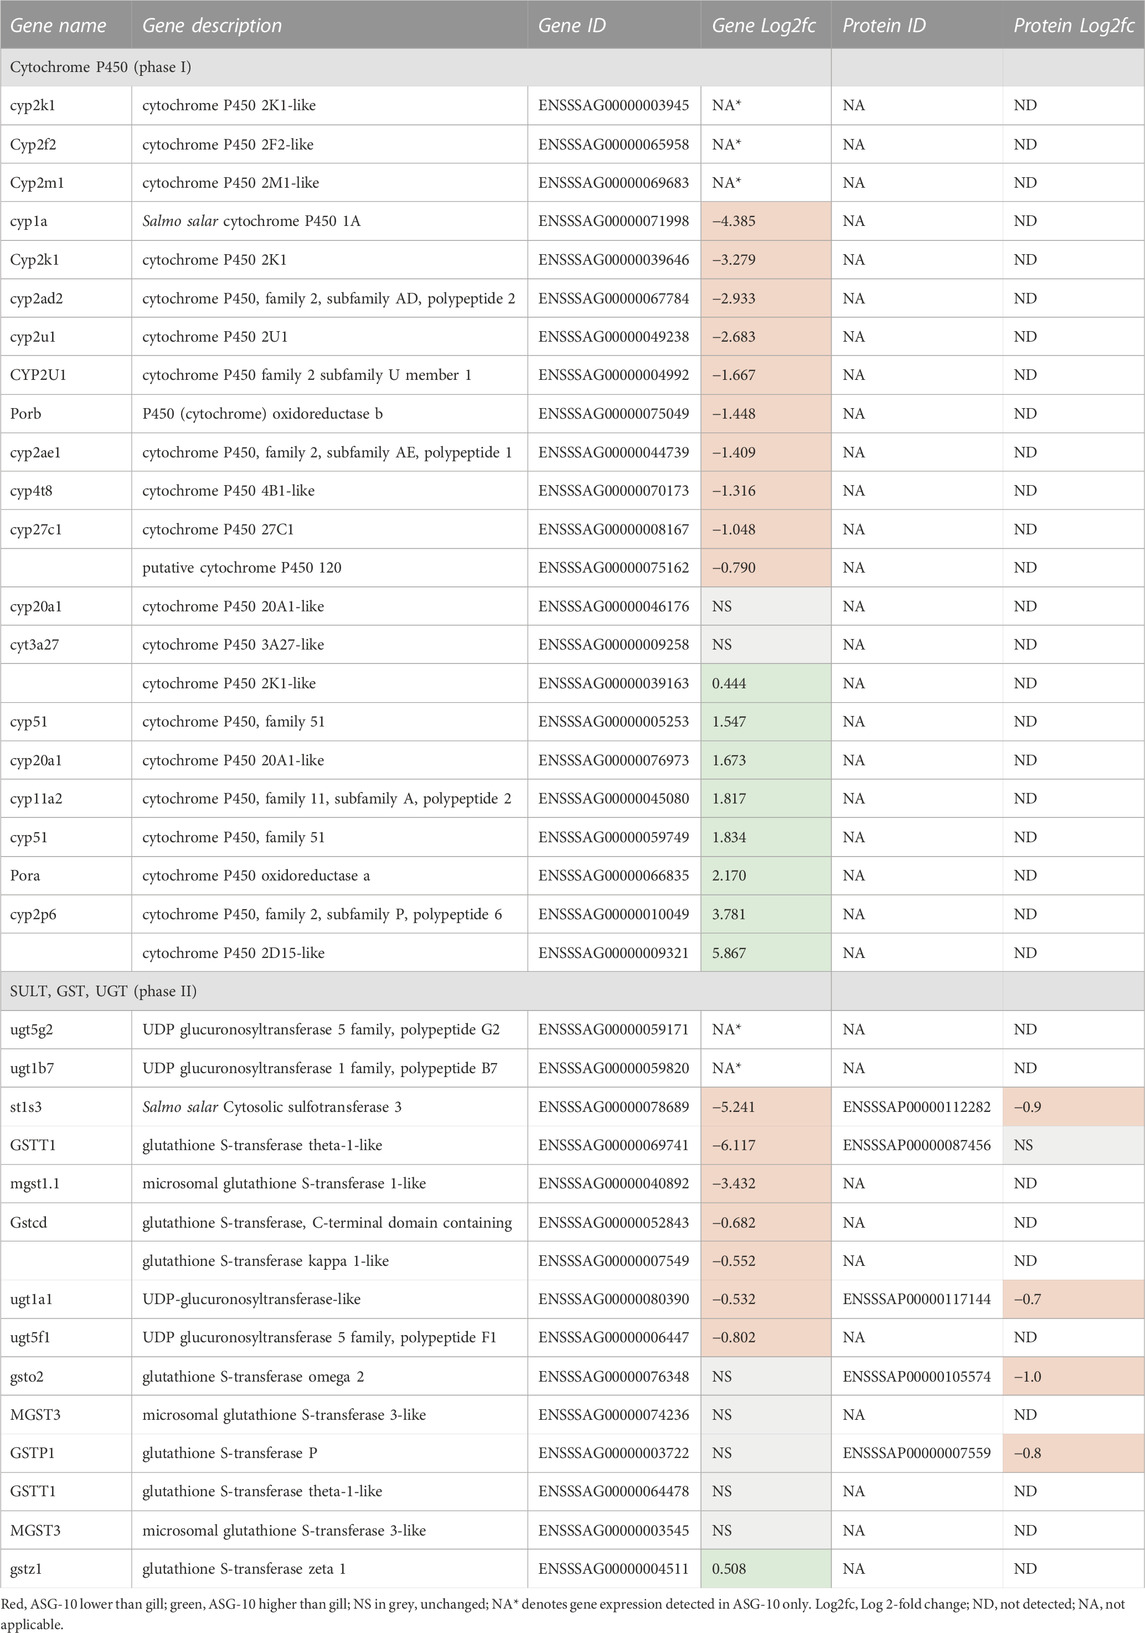
TABLE 6. Profile of biotransformation gene expression and proteins detected in ASG-10 relative to gill: Log2fc for genes expressed with significant differences: −0.3 to −12.7 (lower); 0.2 to 9.0 (higher).
Transcription of 35 genes across ABC transporter families A to F was detected in ASG-10. Transcription of approximately half (17 genes) were detected at either a lower or moderately lower level (Log2fc <1) in ASG-10, with the remainder detected at a higher or similar level. Three ABC transporter genes were expressed in ASG-10 only (Table 7). Only one ABC transporter, namely ABCF1, was detected in the proteomics dataset and was present at a lower level in the cells compared with gill. Solute carrier organic-anion transporters including slcob2a1, 3a1, 4a1 and 5a1 were found in the transcriptomics dataset (Table 7). Transcription of slco1c1 was detected in ASG-10 only. It is worth noting that the presence of PGP/ABCB1 mRNA or protein was note detected in the cells. This corresponds with the Calcein-AM assay and the PGP western blot (Figure 6). Two MRP4/ABCC4 genes were expressed at a lower level in ASG-10 cells compared with gill. There was no evidence of the corresponding proteins in the proteomics dataset, which also aligns with the Calcein-AM assay data (Figure 6).
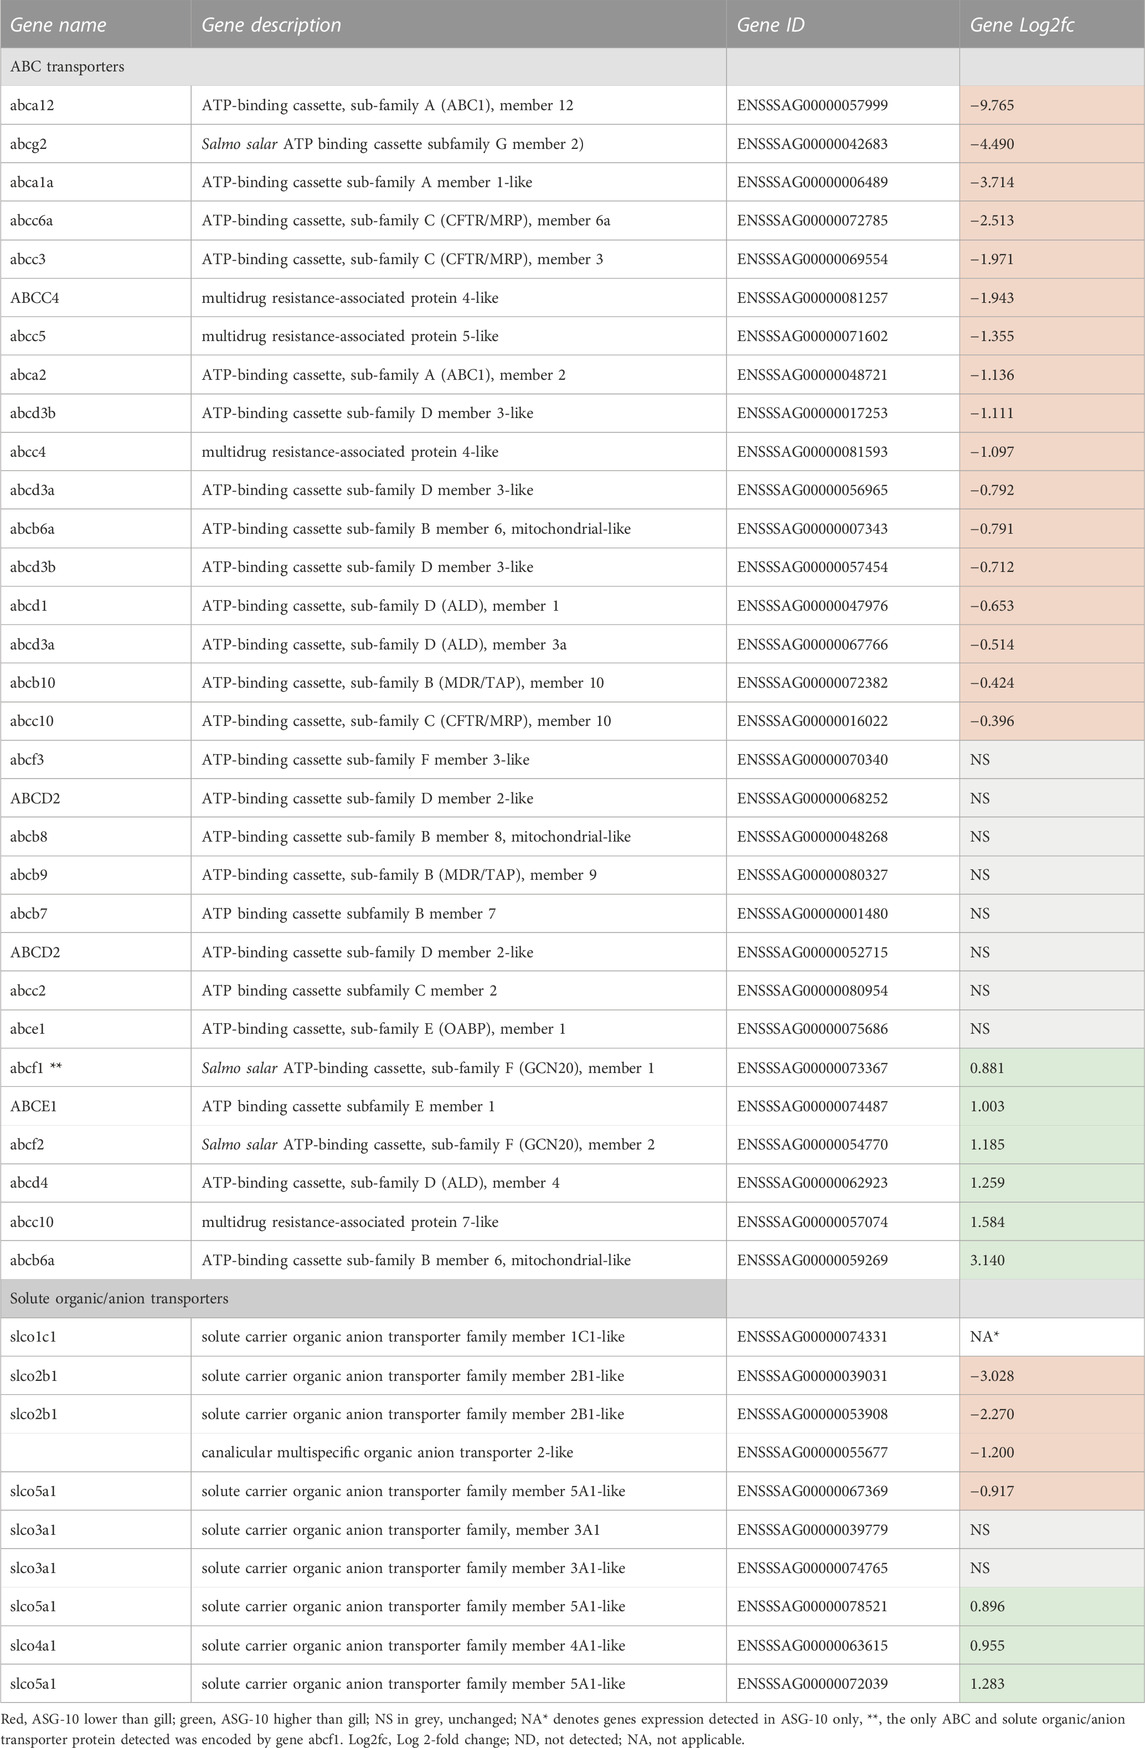
TABLE 7. Profile of ABC and solute organic/anion transporter gene expression detected in ASG-10 relative to gill. The protein was present at a lower level in ASG-10 (Log2fc = −1.7). Log2fc for genes expressed with significant differences: −0.3 to −12.7 (lower); 0.2 to 9.0 (higher).
Here, we further characterize the Atlantic salmon gill cell line, ASG-10, presented initially by Gjessing and co-workers (Gjessing et al., 2018). That initial study captured certain key characteristics of the newly developed cell line, including migratory and proliferation ability, cell morphology (consistent with epithelial cells), confirmation of Atlantic salmon origin, and virus susceptibility. To increase our understanding of the biology of ASG-10 cells, we generated a transcriptomic and proteomic profile of the cells and compared their expression patterns to native Atlantic salmon parr gills. Additionally, in vitro biophysical characteristics typical of epithelial cells, namely barrier function, ion transporters, phagocytosis, biotransformation and ABC transporters were explored. To our knowledge, this is the first time that such a comprehensive approach has been taken to examine a cell line derived from fish.
Here, like in other multi-omics studies on cells (Liu et al., 2016), we observed a difference in the sensitivity of the transcriptomics (22726 genes) compared with the proteomic analysis (2,376 proteins). This is a typical challenge of multi-omics analyses and has led to some of the discrepancies in the comparison between gene and protein expression data. Whereas the proteomic data represented primarily highly expressed proteins with housekeeping functions, the transcriptomic data also revealed differences in mRNA molecules present at low levels (>10 reads included in the data set). This was further reflected in an analysis of KEGG terms, which demonstrated the clear dominance of basic cellular processes, including metabolic pathways as well as biosynthetic pathways, ribosomal and spliceosome activity for proteins in all comparisons between ASG-10 cells and gill, whereas the transcriptome data revealed other pathways. KEGG analysis of the genes expressed at lower levels in ASG-10 highlighted a lower level of necroptosis in ASG-10 cells compared with gill. This controlled cell death pathway has elements of both apoptosis and necrosis (Dhuriya and Sharma., 2018) and its increased occurrence in the gill may be due to cell damage during excision and harvesting of the gills, post-mortem. Similarly, the lower identification of cell signaling pathways such as VEGF, MAPK signaling as well as the phosphatidylinositol signaling system are likely a result of the lack of crosstalk between different cell types in the ASG-10 cell culture compared with gill. The lower level of immune gene mRNAs reflected the likely lack of immune cells in the culture.
Staining for goblet and chloride cells indicated that neither cell type was present in the cell culture and that ASG-10 most likely is a pure culture of pavement epithelial cells. The fundamental epithelial characteristics of the ASG-10 cells are reflected throughout the study. Reflecting the lack of chloride cells present in the ASG-10 cell line, there was an absence of NCC transcripts. However, transcription of a number of other osmoregulatory genes including some Cl/HCO3- anion exchanger, NHE3, V-type H+ ATPase, and NKA genes, were detected at a similar or higher level in ASG-10 cells. These genes, while normally associated with chloride cells, (Christensen et al., 2018), are not exclusively expressed by them. For example, the Cl/HCO3- anion exchanger, Slc4a1-3 variants as well as SLC26a 2,5,6 and 9 variants detected in ASG-10 are known to be expressed in both chloride and epithelial cells (Romero et al., 2013). A low number of mucin genes were expressed in ASG-10, including a number of mucin-2 and 5-ac genes which encode secreted, gel-forming mucins, known to be expressed in Atlantic salmon gill (Sveen et al., 2017). Additionally, transcription of membrane bound or associated mucin genes, mucin-13-like, 17-like and 18-like was also detected in the cells. mRNA levels of these genes in the cells compared with gill varied, however the apparently lack of goblet cells in the ASG-10 cell line was reflected in the small number of mucins detected. Interestingly, the detection of slightly higher expression levels of the mucin-17-like gene may be associated with the higher proliferation rate of the cells in culture, relative to the natural proliferation rate of the gill epithelial cells. In accordance with this, it was shown that cells proliferating at a high rate, such as human cancer cells, have an increase in expression of muc-17 (Hirono et al., 2010).
Epithelial cells are known to act as “non-professional” phagocytes, particularly involved in the ingestion and recycling of other apoptotic epithelial cells (Günther and Seyfert., 2018) in a process known as efferocytosis. As part of an organism’s first line of defense, epithelial cells engulf pathogens through stimulation of cytoskeletal and membrane re-arrangement by the pathogens, causing uptake and subsequent destruction via phagolysosomes. While phagocytosis by fish gill epithelial cells is not well studied, there is evidence that the shellfish gill epithelium is capable of bacterial phagocytosis in vivo, as demonstrated in mussels (Tame et al., 2022), and in vitro, as shown with gill epithelial cell primary cultures from abalone (Pichon et al., 2013). Therefore, the phagocytic ability of ASG-10 was examined and, true to their nature, they successfully took up fluorescently labelled bioparticles, derived from fungal cells (Zymosan - S. cerevisiae -insoluble β-1,3-glucan polysaccharide) and bacterial cells (E. coli). Differences were observed in the efficiency of the bioparticle uptake, with the E. coli phagocytosed more readily than the Zymosan- S. cerevisiae counterpart. This was reflected in the expression of receptors involved in the phagocytic process. The Dectin 1 receptor, a C-type lectin receptor which is known as the main phagocytic receptor for Zymosan in mammals, is not found in salmon (Petit et al., 2019). In a recent paper attempting to identify the Zymozan binding receptor in carp, a C-type lectin domain 4 gene was detected among several candidate genes (Petit et al., 2019). Several C-type lectin domain 4 genes were transcribed at a lower level in ASG-10 compared to the gill, which putatively accounts for the lack of efficient Zymosan uptake. Phagocytosis of bacteria partly depends on the mannose receptor. High levels of mannose receptor C type 2 mRNA were detected in ASG-10, higher than in gill samples. Galectins are also involved in bacterial recognition, (Patel et al., 2020), and several galectin family members were detected in ASG-10. The detection of high levels of flagellin-binding TLR5 transcripts may also further induce bacterial phagocytosis. Expression of clathrin and dynamin genes in ASG-10 was comparable to that in gill. Both clathrin and dynamin are central to clathrin-mediated endocytosis which was the proposed mechanism of nanoparticle uptake in RTgill-W1 (Felix et al., 2017). Therefore, it is plausible that similar experiments modelling nanoparticle uptake would be possible with ASG-10.
The KEGG term “immune and inflammatory response” was clearly associated with the genes expressed at lower levels in ASG-10 compared to the gill. Transcripts from only a few genes in ASG-10 were associated with pathogen recognition pathways mediated by TLRs, NOD-like receptors and C-type lectins. This is likely due to the lack of immune cells, such as dendritic cells, macrophages and neutrophils, in the culture. More specifically, many TLRs detected in the gills were not detected in the ASG-10 transcriptome or proteome. Among them are the viral RNA receptors TLR-3, -7, -8 and -22, (data not shown), which indicates that ASG-10 cells may not be suitable for studying antiviral responses). This lack of virus sensing receptors may also be a reason for the viral susceptibility of the cell line, as demonstrated by Gjessing and co-workers (Gjessing et al., 2018), who showed that ASG-10 were susceptible to infectious hematopoietic necrosis virus (IHNV), viral hemorrhagic septicemia virus (VHSV), infectious pancreatic necrosis virus (IPNV), Atlantic salmon reovirus TS (TSRV) and Pacific salmon paramyxovirus (PSPV). In contrast, relatively high expression levels of the bacterial flagellin receptor TLR-5 were detected in ASG-10 cells, which makes them interesting for bacterial response studies (Günther and Seyfert, 2018). In line with this, an IL-8-like gene was expressed at higher levels in ASG-10 cells compared with gill. The expression of IL-8 is known to be induced through interaction of bacteria with TLRs (Eckman et al., 1993). Of note, mRNA from 2 TLR-18 genes, a teleost specific TLR, were detected in ASG-10 cells only. This TLR was previously confirmed to be expressed in gills of Atlantic salmon and its gene expression response to both viral and parasitic infection in head kidney has been reported (Lee et al., 2014). Its presence in ASG-10 cells provides the opportunity to use the cell line as a model to further investigate the role of TLR18 in gills. IL-22 and Il79A have been suggested as pan-B-cell markers in salmon (Peñaranda et al., 2019), but were detected at low levels in the ASG-10 cells, which could draw their specificity for B-cells in doubt. The IL11a cytokine was detected in ASG-10 only. Interestingly, IL11a has been characterized in trout, and found to be induced in gills upon bacterial infection (Wang et al., 2005). Transcription of AMPS, cathelicidin and NK-lysin was detected at lower levels in ASG-10 cells compared with gill. Expression of these genes is inducible by microbial and parasitic infection, therefore their presence at a lower level in the unchallenged cell line is likely to be expected (Acosta et al., 2019). Despite this, their presence does provide a baseline from which to assess their response as part of an infection challenge model incorporating ASG-10 cells.
Adherent and tight junctions are the linchpin of the selectively permeable barrier formed by epithelial cell layers. These junctions are formed by the interaction of several proteins including ZO proteins, occludins, claudins, integrins and cadherins. In gill epithelia of teleost fish, tighter junctions are associated with freshwater fish compared with “leaky” junctions associated with marine fish (Chasiotis et al., 2012). In line with this, the data presented here clearly demonstrated the ability of the freshwater gill-derived ASG-10 cells to express tight junction genes and to form tight junctions. The increased TER corresponds to the positive staining of ZO-1 protein between cells as a function of time, again confirming that the ASG-10 cells are epithelial. These data were complemented by the evidence of an overall higher expression of tight junction genes in ASG-10 cells compared to gill. However, the barrier generated by the ASG-10 might be considered as leaky as the ZO-1 staining pattern is somewhat punctuated and the tightness of the barrier, expressed as TER, is considerably lower than primary cells (Bury et al., 2014).
The variation in cyp gene mRNA levels in ASG-10 compared with gill pointed to a differential ability to metabolize both exogenous and endogenous substrates, including a range of fatty acids and drugs. However, this variability was likely due to the inherently inducible nature of these genes (Manikandan Nagini, 2018). Clearly, the gill, having been sourced from a living organism producing a variety of metabolites and exposed to various environmental stressors had a different cyp expression profile compared with a cell line grown in stable conditions (FBS supplemented media). For example, while the cyp1A1 gene was expressed at a considerably lower level in the cell line (Log2fc −4.4), exposure of the ASG-10 cells to β-naphthoflavone, a known inducer of CYP1A (Heinrich et al., 2014), induced both CYP1A protein expression and activity (Ivanova et al., 2023). Also, the gill cell line LG-1 from Atlantic Lumpfish (Cycloperus lumpus L) was found to have inducible CYP1A activity (Sindre et al., 2021), while the gill cell line from rainbow trout (RTgill-W1) and Waking catfish (Clarias batrachus), GB1, had no detectable CYP1A activity after β-naphthoflavone treatment (Franco et al., 2018). Interestingly, while expression of several of the cyp genes such as cyp1A1 is well characterized in Atlantic salmon gill (Olsvik et al., 2015; Alderman et al., 2020), many of the cyp genes emerging from the transcriptomics data are reported here in Atlantic salmon gill for the first time. These includes cyp2k1, cyp2D15-like and cyp2p6 which are detected at higher levels in ASG-10 compared with gill. Quantitative PCR studies evaluating the expression of cyp2k1 in Coho and Chinook salmon found that the gene was expressed hepatically but was not evident in the gill (Lavado and Aparicio fabreschleng., 2014, Matsuo et al., 2008). The cyp2D15 gene has primarily been characterized in dogs, (van Hagen et al., 2020). Cyp2p genes appear to be teleost specific and have so far been characterized in mangrove killfish, channel catfish and zebrafish (Goldstone et al., 2010; Zhang et al., 2014; Lee et al., 2018). Their presence and expression level, as well as the transcription of all reported cyp genes in ASG-10 provide the opportunity to expand toxicological studies in fish cell lines to include these genes/proteins and their substrates and therefore, increase our knowledge of gill biotransformation ability.
Sulfotransferase enzymes are responsible for the sulfation of a variety of compounds including xenobiotics and endogenous materials such as carbohydrates and proteins. Cytosolic sulfotransferase (SULT) enzymes are a subfamily involved in the biotransformation of hydrophobic environmental xenobiotics (Suiko et al., 2017). Transcripts from the cytosolic sulfotransferase gene st1s3 and its corresponding protein were detected at a lower level in ASG-10 cells compared with gill. Again, as with cyp gene expression, this is likely due to lack of exposure of the naïve cells to external stimulants. However, the overall expression level of this gene at both RNA and protein level in the cell line would indicate its potential in vitro utility as a biomarker of phase II biotransformation response. Such work would be insightful as, to date, SULT enzyme expression and activity in salmon and associated cell lines have only been explored in a limited number of studies (Gonzalez et al., 2009; Barry and Marwanunez, 2010; Srikanth et al., 2017). Glutathione S-transferases (GSTs) are well known for removing environmental pollutants and endogenous toxic compounds as part of the phase II detoxification process through glutathionylation of diverse electrophilic substrates (Sukhovskaya et al., 2017). They have been suggested biomarkers for oxidative stress after exposure of polycyclic aromatic hydrocarbons (Santana et al., 2018). Taking a broad view of the transcription levels of UGT and GST genes detected in this study, it can be concluded that these levels were similar in both the cell line and the gill. Significant differences in expression, when observed, were modest (<1) for the majority of the genes in question. This was also true for UGT and GST genes whose corresponding protein expression levels were detected. Of note, expression of the gstt1 gene was detected at a considerably lower level in ASG-10 cells compared with the gill (Log2fc −6). Any future work utilizing the expression of these genes as putative biomarkers should take this into consideration when using the cell line. However, like cyp and sulfotransferase, these genes are inducible. Additionally, the protein level of the corresponding GST theta-1 like enzyme was not significantly different in the cells compared with gill. This provides another example of how the transcriptomic and proteomic data do not always align due to the offset of mRNA levels compared with protein levels in the cell (Liu et al., 2016).
Aquatic organisms deploy a wide range of protective systems against harmful substances in water. Organs with blood-barrier or excretion functions, such as brain, liver and kidney possess a variety of membrane transporters, which are responsible for cellular efflux of endogenous substrates, as well as xenobiotics and their metabolites. A prominent family of membrane transporters are the ATP-binding cassette (ABC) transporters (Ferreira et al., 2014; Luckenbach et al., 2014) as well as the solute organic/anion transporters (OATs), which, together with drug metabolizing enzymes and transmembrane transporters, are important determinants of drug metabolism and drug clearance. The Calcein-AM assay using the probenecid inhibitor of MRP/organic-anion transporters showed a significant increase in Calcein-AM accumulation, indicating the presence of corresponding transporters in the cells. This correlates with the data showing that transcription of organic-anion transporter genes slco3a1, 4a1 and 5a1 were detected at a similar or moderately increased level in the ASG-10 cells compared with gill. However, the well-characterized ABC transporter ABCB1, also known as PGP1, was not expressed in ASG-10 as shown by the lack of response of the PCS833 inhibitor and the failure to detect the PGP protein in the cells with western blotting. It should be noted that PGP was not found in the transcriptomic or proteomic profile of gill. Taken together, this lack of expression is consistent with findings in other fish species (Ferreira et al., 2014). There have been limited studies of ABC transporter activity in fish gills. A study by (Kropf et al., 2020) compared ABC transporter expression in Rainbow trout gill with a primary trout gill cell culture. As in our study, transcription of abcg2, abcc2, abcc3 genes was detected. Importantly, the expression pattern of the transporters differed in the primary culture compared with gill, which is similar to the findings in our study. For example, mRNA molecules from the lipid transporter abca12, xenobiotic transporter abcg2, and the cholesterol efflux transporter abca1 are detected at higher level (Log2fc>3) in gill, whereas the heavy-metal and porphyrin transporter abca12 was detected at a higher level in ASG-10 cells. As suggested by Kropf et al. (2020), these differences could be attributed to media composition and the two-dimensional nature of cell culture compared to the three-dimensional nature of a gill.
Our broad characterization of ASG-10 supports the suitability of the cell line for a range of in vitro experimental studies to better understand gill functions, including epithelial regeneration and barrier function, drug biotransformation, transport and clearance, ion channel activity, studies of metabolism, phagocytic function, and host/pathogen interaction - in particular for bacteria. The ASG-10 cell line can further promote development of a functional gill model. Co-cultures with other cell types and fluidic organ-on-a-chip systems using ASG-10 can be developed in the future to create a more realistic gill model, and to better represent the complexity of the gills.
The raw data supporting the conclusions of this article will be made available by the authors, without undue reservation. The RNA-seq (transcriptomic) data has been uploaded to NCBI SRA with the accession number PRJNA1004542. The mass spectrometry proteomics data have been deposited to the ProteomeXchange Consortium via the PRIDE (Perez-Riverol et al., 2022) partner repository with the dataset identifier PXD044533.
Ethical approval was not required for the study involving animals in accordance with the local legislation and institutional requirements because This study involved the use of salmon parr gills that were retrieved from a small number humanely euthanised fish (overdose of Tricane-methanesulphate MS222, carried out by authorised and trained personnel only). The salmon were not subject to any procedures prior to euthanasia that would have affected their welfare and this was not a study of any effect of treatment or intervention on the salmon. Therefore ethical approval was not required.
All authors contributed to the study conception and design. Material preparation, data collection and analysis were performed by OS, MD, ArS, MG, and ASo. The first draft of the manuscript was written by OS, MD, and ASo and all authors commented on previous versions of the manuscript. All authors contributed to the article and approved the submitted version.
The work was funded by the Norwegian Research Council grant nr. 294876 (GILLMODEL). The article processing charge (APC) was funded by the Norwegian Veterinary Institute.
The authors wish to thank Dr. Lucy Lee (Fraser Valley University, Canada) for valuable discussions and Daylan Pritchard (Fraser Valley University, Canada) for skilled help with the phagocytosis assay. Additionally, we want to thank Karen Bakken Soleim (Norwegian Veterinary Institute) for isolating RNA from gills and the ASG-10 cell line, Dr. Eugene Dillon (UCD Conway Institute of Biomolecular and Biomedical Research, Ireland) for carrying out the mass spectrometry analysis of peptides extracted from gills and ASG-10 cells, as well as the Norwegian Sequencing Centre at Oslo University Hospital for RNA sequencing runs.
The authors declare that the research was conducted in the absence of any commercial or financial relationships that could be construed as a potential conflict of interest.
All claims expressed in this article are solely those of the authors and do not necessarily represent those of their affiliated organizations, or those of the publisher, the editors and the reviewers. Any product that may be evaluated in this article, or claim that may be made by its manufacturer, is not guaranteed or endorsed by the publisher.
The Supplementary Material for this article can be found online at: https://www.frontiersin.org/articles/10.3389/fmolb.2023.1242879/full#supplementary-material
Acosta, J., Roa, F., González-Chavarría, I., Astuya, A., Maura, R., Montesino, R., et al. (2019). In vitro immunomodulatory activities of peptides derived from Salmo salar NK-lysin and cathelicidin in fish cells. Fish Shellfish Immunol. 88, 587–594. doi:10.1016/j.fsi.2019.03.034
Alderman, S. L., Dilkumar, C. M., Avey, S. R., Farrell, A. P., Kennedy, C. J., and Gillis, T. E. (2020). Effects of diluted bitumen exposure and recovery on the seawater acclimation response of Atlantic salmon smolts. Aquat. Toxicol. 221, 105419. doi:10.1016/j.aquatox.2020.105419
Bairoch, A. (2018). The Cellosaurus, a cell-line knowledge resource. J. Biomol. Tech. 29, 25–38. doi:10.7171/jbt.18-2902-002
Barry, T. P., Marwah, A., and Nunez, S. (2010). Inhibition of cortisol metabolism by 17alpha,20beta-P: mechanism mediating semelparity in salmon? Gen. Comp. Endocrinol. 165, 53–59. doi:10.1016/j.ygcen.2009.06.003
Bols, N. C., Barlian, A., Chirinotrejo, M., Caldwell, S. J., Goegan, P., and Lee, L. E. J. (1994). Development of a cell line from primary cultures of rainbow trout, Oncorhynchus mykiss (Walbaum), gills. J. Fish. Dis. 17, 601–611. doi:10.1111/j.1365-2761.1994.tb00258.x
Bury, N. R., Schnell, S., and Hogstrand, C. (2014). Gill cell culture systems as models for aquatic environmental monitoring. J. Exp. Biol. 217, 639–650. doi:10.1242/jeb.095430
Chang, E. D., Hogstrand, C., Miller, T. H., Owen, S. F., and Bury, N. R. (2019). The use of molecular descriptors to model pharmaceutical uptake by a fish primary gill cell culture epithelium. Environ. Sci. Technol. 53, 1576–1584. doi:10.1021/acs.est.8b04394
Chasiotis, H., Kolosov, D., Bui, P., and Kelly, S. P. (2012). Tight junctions, tight junction proteins and paracellular permeability across the gill epithelium of fishes: a review. Respir. Physiol. Neurobiol. 184, 269–281. doi:10.1016/j.resp.2012.05.020
Chen, Z. S., Lee, K., and Kruh, G. D. (2001). Transport of cyclic nucleotides and estradiol 17-beta-D-glucuronide by multidrug resistance protein 4. Resistance to 6-mercaptopurine and 6-thioguanine. J. Biol. Chem. 276, 33747–33754. doi:10.1074/jbc.M104833200
Cheung, L., Flemming, C. L., Watt, F., Masada, N., Yu, D. M., Huynh, T., et al. (2014). High-throughput screening identifies Ceefourin 1 and Ceefourin 2 as highly selective inhibitors of multidrug resistance protein 4 (MRP4). Biochem. Pharmacol. 91, 97–108. doi:10.1016/j.bcp.2014.05.023
Christensen, A. K., Regish, A. M., and Mccormick, S. D. (2018). Shifts in the relationship between mRNA and protein abundance of gill ion-transporters during smolt development and seawater acclimation in Atlantic salmon (Salmo salar). Comp. Biochem. Physiology Part A Mol. Integr. Physiology 221, 63–73. doi:10.1016/j.cbpa.2018.03.020
Cox, J., Hein, M. Y., Luber, C. A., Paron, I., Nagaraj, N., and Mann, M. (2014). Accurate proteome-wide label-free quantification by delayed normalization and maximal peptide ratio extraction, termed MaxLFQ. Mol. Cell. Proteomics 13, 2513–2526. doi:10.1074/mcp.M113.031591
Cox, J., and Mann, M. (2008). MaxQuant enables high peptide identification rates, individualized p.p.b.-range mass accuracies and proteome-wide protein quantification. Nat. Biotechnol. 26, 1367–1372. doi:10.1038/nbt.1511
Dhuriya, Y. K., and Sharma, D. (2018). Necroptosis: a regulated inflammatory mode of cell death. J. Neuroinflammation 15, 199. doi:10.1186/s12974-018-1235-0
Eckmann, L., Kagnoff, M. F., and Fierer, J. (1993). Epithelial cells secrete the chemokine interleukin-8 in response to bacterial entry. Infect. Immun. 61, 4569–4574. doi:10.1128/iai.61.11.4569-4574.1993
Evans, D. H., Piermarini, P. M., and Choe, K. P. (2005). The multifunctional fish gill: dominant site of gas exchange, osmoregulation, acid-base regulation, and excretion of nitrogenous waste. Physiol. Rev. 85, 97–177. doi:10.1152/physrev.00050.2003
Evans, D. H. (1987). The fish gill: site of action and model for toxic effects of environmental pollutants. Environ. Health Perspect. 71, 47–58. doi:10.1289/ehp.877147
Felix, L. C., Ortega, V. A., and Goss, G. G. (2017). Cellular uptake and intracellular localization of poly (acrylic acid) nanoparticles in a rainbow trout (Oncorhynchus mykiss) gill epithelial cell line, RTgill-W1. RTgill-W1. Aquat. Toxicol. 192, 58–68. doi:10.1016/j.aquatox.2017.09.008
Ferreira, M., Costa, J., and Reis-Henriques, M. A. (2014). ABC transporters in fish species: a review. Front. Physiology 5, 266. doi:10.3389/fphys.2014.00266
Franco, M. E., Sutherland, G. E., and Lavado, R. (2018). Xenobiotic metabolism in the fish hepatic cell lines Hepa-E1 and RTH-149, and the gill cell lines RTgill-W1 and G1B: biomarkers of CYP450 activity and oxidative stress. Comp. Biochem. Physiol. C. Toxicol. Pharmacol. 206-207, 32–40. doi:10.1016/j.cbpc.2018.02.006
Frost, T. S., Jiang, L., Lynch, R. M., and Zohar, Y. (2019). Permeability of epithelial/endothelial barriers in transwells and microfluidic bilayer devices. Micromachines 10, 533. doi:10.3390/mi10080533
Gjessing, M. C., Aamelfot, M., Batts, W. N., Benestad, S. L., Dale, O. B., Thoen, E., et al. (2018). Development and characterization of two cell lines from gills of Atlantic salmon. PLoS One 13, e0191792. doi:10.1371/journal.pone.0191792
Gjessing, M. C., Spilsberg, B., Steinum, T. M., Amundsen, M., Austbø, L., Hansen, H., et al. (2021). Multi-agent in situ hybridization confirms Ca. Branchiomonas cysticola as a major contributor in complex gill disease in Atlantic salmon. Fish Shellfish Immunol. Rep. 2, 100026. doi:10.1016/j.fsirep.2021.100026
Gjessing, M. C., Yutin, N., Tengs, T., Senkevich, T., Koonin, E., Ronning, H. P., et al. (2015). Salmon gill poxvirus, the deepest representative of the chordopoxvirinae. J. Virol. 89, 9348–9367. doi:10.1128/JVI.01174-15
Goldstone, J. V., Mcarthur, A. G., Kubota, A., Zanette, J., Parente, T., Jönsson, M. E., et al. (2010). Identification and developmental expression of the full complement of Cytochrome P450 genes in Zebrafish. BMC Genomics 11, 643. doi:10.1186/1471-2164-11-643
Gollapudi, S., Kim, C. H., Tran, B.-N., Sangha, S., and Gupta, S. (1997). Probenecid reverses multidrug resistance in multidrug resistance-associated protein-overexpressing HL60/AR and H69/AR cells but not in P-glycoprotein-overexpressing HL60/Tax and P388/ADR cells. Cancer Chemother. Pharmacol. 40, 150–158. doi:10.1007/s002800050640
Gonzalez, J. F., Reimschuessel, R., Shaikh, B., and Kane, A. S. (2009). Kinetics of hepatic phase I and II biotransformation reactions in eight finfish species. Mar. Environ. Res. 67, 183–188. doi:10.1016/j.marenvres.2009.01.002
Günther, J., and Seyfert, H.-M. (2018). The first line of defence: insights into mechanisms and relevance of phagocytosis in epithelial cells. Semin. Immunopathol. 40, 555–565. doi:10.1007/s00281-018-0701-1
Heinrich, P., Diehl, U., Forster, F., and Braunbeck, T. (2014). Improving the in vitro ethoxyresorufin-O-deethylase (EROD) assay with RTL-W1 by metabolic normalization and use of beta-naphthoflavone as the reference substance. Comp. Biochem. Physiol. C Toxicol. Pharmacol. 164, 27–34. doi:10.1016/j.cbpc.2014.04.005
Herrero, A., Thompson, K. D., Ashby, A., Rodger, H. D., and Dagleish, M. P. (2018). Complex gill disease: an emerging syndrome in farmed atlantic salmon (Salmo salar L). J. Comp. Pathol. 163, 23–28. doi:10.1016/j.jcpa.2018.07.004
Hirono, S., Yamaue, H., Hoshikawa, Y., Ina, S., Tani, M., Kawai, M., et al. (2010). Molecular markers associated with lymph node metastasis in pancreatic ductal adenocarcinoma by genome-wide expression profiling. Cancer Sci. 101, 259–266. doi:10.1111/j.1349-7006.2009.01359.x
Hofmann, J., Gekeler, V., Ise, W., Noller, A., Mitterdorfer, J., Hofer, S., et al. (1995). Mechanism of action of dexniguldipine-HCl (B8509-035), a new potent modulator of multidrug resistance. Biochem. Pharmacol. 49, 603–609. doi:10.1016/0006-2952(94)00479-6
ISO21115 (2019). Water quality — determination of acute toxicity of water samples and chemicals to a fish gill cell line (RTgill-W1). [Online]. Available at: https://www.iso.org/standard/69933.html.
Ivanova, L., Fæste, C. K., and Solhaug, A. (2018). Role of P-glycoprotein in deoxynivalenol-mediated in vitro toxicity. Toxicol. Lett. 284, 21–28. doi:10.1016/j.toxlet.2017.11.021
Ivanova, L., Fæste, C. K., and Solhaug, A. (2023). Atlantic salmon gill epithelial cell line (ASG-10) as a suitable model for xenobiotic biotransformation. Metabolites 13 (6), 771. doi:10.3390/metabo13060771
John, U., Šupraha, L., Gran-Stadniczeñko, S., Bunse, C., Cembella, A., Eikrem, W., et al. (2022). Spatial and biological oceanographic insights into the massive fish-killing bloom of the haptophyte Chrysochromulina leadbeateri in northern Norway. Harmful Algae 118, 102287. doi:10.1016/j.hal.2022.102287
Kim, D., Paggi, J. M., Park, C., Bennett, C., and Salzberg, S. L. (2019). Graph-based genome alignment and genotyping with HISAT2 and HISAT-genotype. Nat. Biotechnol. 37, 907–915. doi:10.1038/s41587-019-0201-4
Kropf, C., Fent, K., Fischer, S., Casanova, A., and Segner, H. (2020). ABC transporters in gills of rainbow trout (Oncorhynchus mykiss). J. Exp. Biol. 223, jeb221069. doi:10.1242/jeb.221069
Lavado, R., Aparicio-Fabre, R., and Schlenk, D. (2014). Effects of salinity acclimation on the expression and activity of Phase I enzymes (CYP450 and FMOs) in coho salmon (Oncorhynchus kisutch). Fish. Physiol. Biochem. 40, 267–278. doi:10.1007/s10695-013-9842-2
Lee, B. Y., Kim, D. H., Kim, H. S., Kim, B. M., Han, J., and Lee, J. S. (2018). Identification of 74 cytochrome P450 genes and co-localized cytochrome P450 genes of the CYP2K, CYP5A, and CYP46A subfamilies in the mangrove killifish Kryptolebias marmoratus. BMC Genomics 19, 7. doi:10.1186/s12864-017-4410-2
Lee, P. T., Zou, J., Holland, J. W., Martin, S. a. M., Collet, B., Kanellos, T., et al. (2014). Identification and characterisation of TLR18-21 genes in Atlantic salmon (Salmo salar). Fish Shellfish Immunol. 41, 549–559. doi:10.1016/j.fsi.2014.10.006
Liao, Y., Smyth, G. K., and Shi, W. (2013). featureCounts: an efficient general purpose program for assigning sequence reads to genomic features. Bioinformatics 30, 923–930. doi:10.1093/bioinformatics/btt656
Liu, Y., Beyer, A., and Aebersold, R. (2016). On the dependency of cellular protein levels on mRNA abundance. Cell. 165, 535–550. doi:10.1016/j.cell.2016.03.014
Love, M. I., Huber, W., and Anders, S. (2014). Moderated estimation of fold change and dispersion for RNA-seq data with DESeq2. Genome Biol. 15, 550. doi:10.1186/s13059-014-0550-8
Luckenbach, T., Fischer, S., and Sturm, A. (2014). Current advances on ABC drug transporters in fish. Comp. Biochem. Physiol. C Toxicol. Pharmacol. 165, 28–52. doi:10.1016/j.cbpc.2014.05.002
Manikandan, P., and Nagini, S. (2018). Cytochrome P450 structure, function and clinical significance: a review. Curr. Drug Targets 19, 38–54. doi:10.2174/1389450118666170125144557
Marcos-Lopez, M., and Rodger, H. D. (2020). Amoebic gill disease and host response in atlantic salmon (Salmo salar L): a review. Parasite Immunol. 42, e12766. doi:10.1111/pim.12766
Matsuo, A. Y., Gallagher, E. P., Trute, M., Stapleton, P. L., Levado, R., and Schlenk, D. (2008). Characterization of Phase I biotransformation enzymes in coho salmon (Oncorhynchus kisutch). Comp. Biochem. Physiol. C Toxicol. Pharmacol. 147, 78–84. doi:10.1016/j.cbpc.2007.08.001
OECD (2021). “Test No. 249,” in Fish cell line acute toxicity - the RTgill-W1 cell line assay (Paris: OECD Publishing). doi:10.1787/c66d5190-en
Olsvik, P. A., Urke, H. A., Nilsen, T. O., Ulvund, J. B., and Kristensen, T. (2015). Effects of mining chemicals on fish: exposure to tailings containing lilaflot D817M induces CYP1A transcription in atlantic salmon smolt. BMC Res. Notes 8, 389. doi:10.1186/s13104-015-1342-2
Paparella, M., Scholz, S., Belanger, S., Braunbeck, T., Bicherel, P., Connors, K., et al. (2021). Limitations and uncertainties of acute fish toxicity assessments can be reduced using alternative methods. ALTEX 38, 20–32. doi:10.14573/altex.2006051
Patel, D. M., Kitani, Y., Korsnes, K., Iversen, M. H., and Brinchmann, M. F. (2020). A truncated galectin-3 isolated from skin mucus of atlantic salmon Salmo salar binds to and modulates the proteome of the gram-negative bacteria moritella viscosa. Mar. Drugs 18, 102. doi:10.3390/md18020102
Peake, J. D., and Noguchi, E. (2022). Fanconi anemia: current insights regarding epidemiology, cancer, and DNA repair. Hum. Genet. 141, 1811–1836. doi:10.1007/s00439-022-02462-9
Peñaranda, M. M. D., Jensen, I., Tollersrud, L. G., Bruun, J.-A., and Jørgensen, J. B. (2019). Profiling the atlantic salmon IgM+ B cell surface proteome: novel information on teleost fish B cell protein repertoire and identification of potential B cell markers. Front. Immunol. 10, 37. doi:10.3389/fimmu.2019.00037
Perez-Riverol, Y., Bai, J., Bandla, C., Hewapathirana, S., García-Seisdedos, D., Kamatchinathan, S., et al. (2022). The PRIDE database resources in 2022: a Hub for mass spectrometry-based proteomics evidences. Nucleic. Acids Res. 50 (D1), D543–D552. doi:10.1093/nar/gkab1038
Petit, J., Bailey, E. C., Wheeler, R. T., De Oliveira, C. a. F., Forlenza, M., and Wiegertjes, G. F. (2019). Studies into beta-glucan recognition in fish suggests a key role for the C-type lectin pathway. Front. Immunol. 10, 280. doi:10.3389/fimmu.2019.00280
Pichon, D., Cudennec, B., Huchette, S., Djediat, C., Renault, T., Paillard, C., et al. (2013). Characterization of abalone Haliotis tuberculata-Vibrio harveyi interactions in gill primary cultures. Cytotechnology 65, 759–772. doi:10.1007/s10616-013-9583-1
Raudvere, U., Kolberg, L., Kuzmin, I., Arak, T., Adler, P., Peterson, H., et al. (2019). g:Profiler: a web server for functional enrichment analysis and conversions of gene lists (2019 update). Nucleic Acids Res. 47, W191-W198–w198. doi:10.1093/nar/gkz369
Reid, G., Wielinga, P., Zelcer, N., Van Der Heijden, I., Kuil, A., De Haas, M., et al. (2003). The human multidrug resistance protein MRP4 functions as a prostaglandin efflux transporter and is inhibited by nonsteroidal antiinflammatory drugs. Proc. Natl. Acad. Sci. U. S. A. 100, 9244–9249. doi:10.1073/pnas.1033060100
Romero, M. F., Chen, A. P., Parker, M. D., and Boron, W. F. (2013). The SLC4 family of bicarbonate (HCO₃⁻) transporters. Mol. Asp. Med. 34, 159–182. doi:10.1016/j.mam.2012.10.008
Rønning, A. O. (2021). Salmon is the new Guinea pig [online]. National research ethics commettees. Available at: https://www.forskningsetikk.no/en/resources/the-research-ethics-magazine/2021-2/salmon-is-the-new-guinea-pig/.
Santana, M. S., Sandrini-Neto, L., Filipak Neto, F., Oliveira Ribeiro, C. A., Di Domenico, M., and Prodocimo, M. M. (2018). Biomarker responses in fish exposed to polycyclic aromatic hydrocarbons (PAHs): systematic review and meta-analysis. Environ. Pollut. 242, 449–461. doi:10.1016/j.envpol.2018.07.004
Seafish (2020). Atlantic salmon. [Online]. Available at: https://www.seafish.org/responsible-sourcing/aquaculture-farming-seafood/species-farmed-in-aquaculture/aquaculture-profiles/atlantic-salmon/.
Sindre, H., Gjessing, M. C., Fosse, J. H., Hermansen, L. C., Bockerman, I., Amundsen, M. M., et al. (2021). Establishment and characterization of a novel gill cell line, LG-1, from atlantic lumpfish (Cyclopterus lumpus L). Cells 10 (9), 2442. doi:10.3390/cells10092442
Smith, S. A., Newman, S. J., Coleman, M. P., and Alex, C. (2018). Characterization of the histologic appearance of normal gill tissue using special staining techniques. J. Vet. Diagn Investig. 30 (5), 688–698. doi:10.1177/1040638718791819
Solhaug, A., Gjessing, M., Sandvik, M., and Eriksen, G. S. (2022). The gill epithelial cell lines RTgill-W1, from Rainbow trout and ASG-10, from Atlantic salmon, exert different toxicity profiles towards rotenone. Cytotechnology 75, 63–75. doi:10.1007/s10616-022-00560-0
Sommerset, I., Wiik-Nielsen, J., De Olivera, V. H. S., Moldal, T., Bornø, G., et al. 2023. Norwegian fish health report 2022, Norwegian Veterinary Institute Report. series#5a/2023. Norwegian veterinary Institute, London
Srikanth, K., Trindade, T., Duarte, A. C., and Pereira, E. (2017). Cytotoxicity and oxidative stress responses of silica-coated iron oxide nanoparticles in CHSE-214 cells. Environ. Sci. Pollut. Res. Int. 24, 2055–2064. doi:10.1007/s11356-016-7870-z
Srinivasan, B., Kolli, A. R., Esch, M. B., Abaci, H. E., Shuler, M. L., and Hickman, J. J. (2015). TEER measurement techniques for in vitro barrier model systems. J. Lab. Autom. 20, 107–126. doi:10.1177/2211068214561025
Suiko, M., Kurogi, K., Hashiguchi, T., Sakakibara, Y., and Liu, M. C. (2017). Updated perspectives on the cytosolic sulfotransferases (SULTs) and SULT-mediated sulfation. Biosci. Biotechnol. Biochem. 81, 63–72. doi:10.1080/09168451.2016.1222266
Sukhovskaya, I. V., Borvinskaya, E. V., Smirnov, L. P., and Kochneva, A. A. (2017). Role of glutathione in functioning of the system of antioxidant protection in fish (review). Inland Water Biol. 10, 97–102. doi:10.1134/S1995082917010187
Suvarna, S. K., Layton, C. D., and John, D. B. (2019). Bancoft`s theory and practice of histological techniques. Elsevier. doi:10.1016/C2015-0-00143-5
Sveen, L. R., Grammes, F. T., Ytteborg, E., Takle, H., and Jørgensen, S. M. (2017). Genome-wide analysis of Atlantic salmon (Salmo salar) mucin genes and their role as biomarkers. PLoS One 12, e0189103. doi:10.1371/journal.pone.0189103
Tai, H. L. (2000). Technology evaluation: valspodar, novartis AG. Curr. Opin. Mol. Ther. 2, 459–467.
Tame, A., Maruyama, T., and Yoshida, T. (2022). Phagocytosis of exogenous bacteria by gill epithelial cells in the deep-sea symbiotic mussel Bathymodiolus japonicus. R. Soc. Open Sci. 9, 211384. doi:10.1098/rsos.211384
Tribble, N., Burka, J., Kibenge, F., and Wright, G. (2008). Identification and localization of a putative ATP-binding cassette transporter in sea lice (Lepeophtheirus salmonis) and host Atlantic salmon (Salmo salar). Parasitology 135 (2), 243–255. doi:10.1017/S0031182007003861
Tyanova, S., Temu, T., Sinitcyn, P., Carlson, A., Hein, M. Y., Geiger, T., et al. (2016). The Perseus computational platform for comprehensive analysis of (prote)omics data. Nat. Methods 13, 731–740. doi:10.1038/nmeth.3901
Van Hagen, M. a. E., Schipper, L., Oosterveer-Van Der Doelen, M. a. M., Vos-Loohuis, M., Gehring, R., and Leegwater, P. A. (2020). Analysis of polymorphisms of canine Cytochrome P 450-CYP2D15. J. Vet. Pharmacol. Ther. 43, 602–607. doi:10.1111/jvp.12890
Wang, T., Holland, J. W., Bols, N., and Secombes, C. J. (2005). Cloning and expression of the first nonmammalian interleukin-11 gene in rainbow trout Oncorhynchus mykiss. FEBS J. 272, 1136–1147. doi:10.1111/j.1742-4658.2005.04544.x
Weli, S. C., Dale, O. B., Hansen, H., Gjessing, M. C., Ronneberg, L. B., and Falk, K. (2017). A case study of Desmozoon lepeophtherii infection in farmed Atlantic salmon associated with gill disease, peritonitis, intestinal infection, stunted growth, and increased mortality. Parasit. Vectors 10, 370. doi:10.1186/s13071-017-2303-5
Keywords: gill epithelium, ASG-10, Atlantic salmon, cytochromeP450, tight junctions, ABC transporters, transcriptome, proteome
Citation: Slattery O, Dahle MK, Sundaram AYM, Nowak BF, Gjessing MC and Solhaug A (2023) Functional and molecular characterization of the Atlantic salmon gill epithelium cell line ASG-10; a tool for in vitro gill research. Front. Mol. Biosci. 10:1242879. doi: 10.3389/fmolb.2023.1242879
Received: 19 June 2023; Accepted: 08 August 2023;
Published: 17 October 2023.
Edited by:
Teresita Padilla-Benavides, Wesleyan University, United StatesReviewed by:
Tiziano Verri, University of Salento, ItalyCopyright © 2023 Slattery, Dahle, Sundaram, Nowak, Gjessing and Solhaug. This is an open-access article distributed under the terms of the Creative Commons Attribution License (CC BY). The use, distribution or reproduction in other forums is permitted, provided the original author(s) and the copyright owner(s) are credited and that the original publication in this journal is cited, in accordance with accepted academic practice. No use, distribution or reproduction is permitted which does not comply with these terms.
*Correspondence: Anita Solhaug, QW5pdGEuU29saGF1Z0B2ZXRpbnN0Lm5v
Disclaimer: All claims expressed in this article are solely those of the authors and do not necessarily represent those of their affiliated organizations, or those of the publisher, the editors and the reviewers. Any product that may be evaluated in this article or claim that may be made by its manufacturer is not guaranteed or endorsed by the publisher.
Research integrity at Frontiers
Learn more about the work of our research integrity team to safeguard the quality of each article we publish.